
An Analysis on the Influence of R&D Fiscal and Tax Subsidies on Regional Innovation Efficiency: Empirical Evidence from China


1
Centre for Quantitative Economics, Jilin University, Changchun 130012, China
2
School of Business, Jilin University, Changchun 130012, China
*
Author to whom correspondence should be addressed.
Sustainability 2021, 13(22), 12707; https://doi.org/10.3390/su132212707
Submission received: 27 October 2021
/
Revised: 14 November 2021
/
Accepted: 15 November 2021
/
Published: 17 November 2021
(This article belongs to the Special Issue Innovation and Technology Management and Sustainability)
Abstract
:To promote the National Mid-andLong-Term Scientific and Technical Development Program, utilizing the technical innovation data from 30 provinces of China from2002–2016, this paper evaluates the inter-provincial differences of China’s regional innovation efficiency from four aspects of technical efficiency, efficiency index change, returns to scale, and projection analysis by using the DEA-Malmquist index method and constructs of the DEA-Tobit random response model to explore the impact of government funding on regional innovation efficiency. The research results show that: (1) The local development of regional innovation efficiency in China is unbalanced, and the level of pure technical efficiency restricts the improvement of innovation efficiency. (2) In the prophase of the scientific and technical development plan, technological progress has led to the growth of total factor productivity, resulting in the formation of scale effect; in the later stage, the scale return shows an overall increasing trend, and the continuous expansion of technological scale and opportunities has improved the regional innovation efficiency. (3) The R&D fiscal and tax subsidies have policy sustainability, and the direct government funding can significantly improve innovation efficiency, while the enterprises investment is opposite, and the pretax additional deduction has a negative but not significant impact. The government should give priority to direct subsidy and supplemented by tax preference, making reasonable policy allocations to expand the policy effect.
1. Introduction
In the early 1950s, Solow [1] proposed that innovation is the power source of economic growth. In-depth study of regional innovation efficiency is inevitable under the background of regional innovation economy, science and technology globalization, and regional integration economy. In recent years, in order to develop the new strategy of “improving independent innovation and building an innovative country”, governments at all levels have vigorously supported technological innovation in high-tech industries. However, technological innovation is a project with slow return on investment, high investment cost, and high risk. This quasi-public goods attribute can very easily cause technology spillover, which makes technological innovation lack initiative in both talent incentive and financing constraints. In order to solve the market failure caused by slow market development and innovation activities, the government plays an important role in coordinating local competitiveness and innovation [2,3]. Measuring innovation efficiency from a national perspective, representative developing countries such as China, Japan, South Korea, India, and other countries have a reasonable allocation of R&D resources and are at the forefront of efficiency [4]. In the existing literature based on Chinese provincial data, there are differences in the innovation efficiency of different provinces. The overall efficiency is low, but the efficiency value is on the rise. The level of regional economic development, the quality of labor, the knowledge transfer of universities and scientific research institutions, and the support of enterprises and financial institutions all restrict the efficiency of regional innovation [5,6]. The degree of utilization of technological knowledge and the degree of government support explain their important impact on technological efficiency from the perspective of the national innovation system [7,8].
The government’s policies and measures in science and technology are implemented by means of direct and indirect R&D subsidies and tax relief, respectively. In 2002, the national local government allocated 30.39 billion yuan for science and technology, reaching 520.63 billion yuan in 2018, with an average annual growth rate of 18.2%. The national change trend is consistent with that of the eastern region. As a direct supporter of technical innovation, the government promotes the development of regional innovation efficiency by means of R&D fiscal and tax policies. At the same time, the government’s stable support for industrial transformation, especially for new energy policies, not only enables the industry to obtain investment, but also actively encourages the industry to stimulate the development of the industry [9,10].
This paper explores the unbalanced development of China’s regional innovation efficiency as an empirical exploration of policy formulation. The final year for the “Implementation of the National Mid- and Long-Term Plan for Scientific and TechnicalDevelopment” is 2020, which is also the closing year of “13th five-year plan for science and technology innovation”. The innovation ability determines the degree of the country’s continuous progress from an “economic power” to a “leading economic power”. The goal of these policies and measures is to enhance the national independent innovation ability [11], stimulate the positive creativity of scientific researchers and high-tech industries, improve regional innovation efficiency and enterprise R&D capacity, accelerate the transformation of scientific and technological achievements, and provide preferential tax policies for the development of high-tech enterprises, laying a solid foundation for the next national mid- and long-term plan for scientific and technical development and the“14th five-year plan” strategic deployment from2021–2035.
The main points discussed in this paper are as follows: whether the R&D fiscal and tax policies of the Chinese government restrain or promote the efficiency of regional innovation, how the direct and indirect subsidies affect the local governments at all levels, and how the national mid- and long-term scientific and technical development plan has been implemented in recent years. Based on this, this paper first makes a comprehensive evaluation of technical innovation in 30 provinces of China by using the input and output data of technological innovation in 2002–2016 and observes the overall distribution of efficiency in each region. Then, the paper points out the improvement direction of provincial efficiency through Malmquist index change and returns to scale and analyzes the relationship between government subsidies and regional innovation efficiency from theoretical and empirical aspects, differences in the subsidy mechanism of government funds in different regions, as well as whether the impact of government R&D financial and tax subsidies on regional innovation efficiency is sustainable. Thus, we revealthe mechanism of government R&D financial and tax policies affecting innovation efficiency in the period of high-quality economic development and provide policy recommendations for the next stage of innovation-driven strategy.
2. Literature Review
2.1. Research on Efficiency of Regional Innovation in China
Measuring and analyzing the efficiency of technological innovation in different regions of China is conducive to mastering the input and output process of innovation activities in high-tech industries, guiding enterprises to develop from factor-concentration type to innovation-intensive type, and effectively grasping the overall development direction of regional innovation systems. Griliches first used knowledge production function to build an analysis framework to analyze R&D output efficiency. With the wide application of frontier production function, some scholars used non-parametric data envelopment analysis (DEA) to measure technical efficiency and used linear programming to measure effective technical frontiers. They took R&D capital stock and human capital as input factors, variables related to patents and sales revenue as output factors, and used extended multi-stage DEA method to measure technical efficiency [12,13]. Zhao et al. [14] used the microdata of high-tech enterprises in Jilin Province to analyze the innovation efficiency from the four aspects of efficiency, effectiveness, returns to scale and projection, and they foundthat the main reason for the low efficiency of enterprises is the lack of R&D funds and investment of scientific researchers.
In the study of the impact of different factors on innovation efficiency, some scholars started from the nature of capital market, such as market structure, environmental factors, the quality of workers, enterprise scale and so on to study the impact on output efficiency. Yu et al. [15] proposed that the nature of enterprises, human capital, and industrial structure are the main factors affecting the efficiency of technical innovation in China’s provinces. Bai and Li [16] investigated the impact of government R&D funding on technical efficiency from the industrial enterprise industry data. Fan et al. [17] studied integrated intra-regional and inter-regional collaborative innovations (IRCI) into a unified framework to analyze the overall impact of regional innovation efficiency. Some scholars also came from different industry heterogeneity and types of property rights, starting with the innovation efficiency of sub-units such as state-owned enterprises and domestic and foreign private enterprises in Hong Kong, Macao, and Taiwan [18,19]. Chen et al. [20] used firm-level data from Changzhou, a prefectural city in China’s Yangzi River Delta, and investigated the performance of both internal and external research and development (R&D) in high-tech firms. Chen et al. [21] studied the implementation effect of each province in the first five years of the national mid- and long-term scientific and technical development plan through the establishment of a dynamic analysis framework of multi-period R&D system for technological innovation. It is of great significance to explore the role of government in the context of the implementation of national science and technology policy plan.
Generally speaking, there are some deficiencies in the above research on the measurement of regional innovation efficiency. On the one hand, when DEA is used to analyze industry and regional efficiency, most of them are static analyses on the establishment of model indicators and influencing factors, and there are few comparative analyses between regions from the perspective of efficiency effectiveness, returns to scale, and quantitative empirical analysis on a specific policy. On the other hand, the research on innovation efficiency focuses on the changes in a certain period of time and seldom studies the policy effect with a certain national plan as the research main line. Therefore, this paper takes China’s provinces and regions as the research object; performsa comprehensive evaluation and analysis of the regional innovation efficiency by using the non-parametric method of DEA; and conductsan in-depth study on the change trend of pure technical efficiency and scale efficiency before and after the implementation of the national long-term scientific and technical development plan, so as to lay a solid foundation for the next research on the impact of government research and development fiscal subsidies.
2.2. Research on the Influence of R&D Financial Subsidies on Regional Innovation Efficiency
The Chinese government has carried out a series of fiscal incentive policies for regional innovation efficiency, mainly including government funding, tax preference, loan support for stimulus projects, information provision, government procurement, etc., of which the first two are the most commonly used incentive policy means. In recent years, the state has vigorously promoted the government’s fiscal and tax investment in R&D. On the one hand, it has encouraged all regions and enterprises to carry out scientific and technical innovation, made up for the negative impact and loss caused by the failure of R&D, and reduced the R&D cost of private high investment to a certain extent [22]. On the other hand, a large number of inputs does not bring matching economic benefits, R&D input and output are imbalanced, and regional innovation ability cannot be improved in proportion, which is a huge challenge to improve the government R&D financial incentive policy system.
The key and direct driving force for high-quality economic development lies in scientific and technological innovation. The quality of the government is directly related to the implementation of policies and the efficiency of resource allocation. It plays a guiding role in local technological innovation and determines the direction of economic development. Rothstein [23] believed that the fundamental reason that affected the development of a country’s technological innovation lied in the quality and efficiency of the country or local government. Fukuyama [24] pointed out that government quality is the government’s ability to formulate policies, supervise policies, and provide services.
The government conducts research on regional innovation output through direct and indirect methods such as R&D subsidies, scientific and technological project expenditures, basic knowledge, technology research and development, fiscal expenditures, and tax relief [25,26]. The quality of government may affect regional innovation performance through a variety of mechanisms. Local government areas with better control, policy formulation, and implementation are more innovative than those without strict control. When the core and peripheral regions are analyzed separately, the influencing factors of innovation performance are different, which shows that each region has its own unique system for its own development path [27,28]. West [29] proposed that a long-term innovation strategy formulated by an efficient government is more credible and more accurate in investing and implementing measures to fully ensure the success of the strategy. The quality of the government not only determines the behavior and structure of its fiscal expenditures, but also affects the efficiency of fiscal expenditures, thereby affecting regional innovation performance [30].
The form of direct funding was mainly guided by the government. In the national innovation system, the government played an important role in assisting enterprises and regions to improve competitiveness and R&D innovation activities [31,32]. Jin and Bing [26] proposed that similar to public products, the benefits of innovation usually did not fully extend to the private sector, partly because innovation was still lower than the socially acceptable level, and the government established relevant mechanisms to avoid such market failure. Pang and Guan [33] found that the government’s direct support had a more significant effect on the non-market-oriented innovation output of high-tech enterprises. Enterprise R&D investment and government funding were important sources of funding for the development of R&D activities. The formation of a “complementary relationship” between them effectively encouraged enterprise R&D behavior [34], which formed a positive signal in society to attract financial market investment [35]. Szczygielski et al. [25] studied the data at the corporate level in Turkey and Poland and found that the government’s assistancein R&D activities helped enterprises in both countries to improve innovation performance. Guellec and Van [36] confirmed this from the perspective of public research laboratories and universities. Some scholars also believed that government subsidies could promote patent quality, patent quantity, R&D investment and technical innovation efficiency [37,38]. However, some studies found that R&D subsidies had a crowding out effect on private R&D investment, and there were moral risks among enterprises, which led to no or even negative effect of R&D funding. Jian and Richard [39] studied the impact of the financial incentives of the Chinese government on the innovation performance of enterprises. Although the main financial incentives of the government (such as special loans and tax credits) had a positive impact on the enterprises, the direct government funding not only did not improve the innovation economic performance, but also sometimes had a negative impact on it [40,41]. Gorg et al. [42] and Wallsten [3] studied the relationship between the government’s support for R&D and its own expenditure. Through the simultaneous equation model, it was estimated that the government’s appropriation might completely squeeze out the private R&D expenditure and had a negative impact on the innovation of the company.
Indirect tax preference is much fairer, so the government actively plays the tax incentive policy. The tax preference based on the perspective of R&D investment can effectively promote the R&D activities of enterprises. Hall and Reenen [22] proposed that additional R&D tax relief will bring equal proportion of innovation investment. Feng et al. [43] discussed the effect of pretax additional deduction policy based on PSM-DID method from the perspective of “input–outputincome” of innovation chain, which had a positive impact on the scale and intensity of innovation as a whole. Some scholars also studied from the perspective of efficiency level and technology transformation and believed that tax preferential policies have positive effects on innovation efficiency [44,45]. However, when we studied its impact on innovation efficiency, there were some differences in the results. Czarnitzki et al. [46] and Li et al. [47] proposed that when enterprises enjoyed preferential tax policies, funds flew to the projects with the highest or most obvious short-term private income, rather than the projects that could mostly promote social and economic growth, and sometimes even served as a strong umbrella for these enterprises to evade tax. Zheng and Li [48], taking small and medium-sized high-tech enterprises as an example, found that government subsidies had a positive effect on the enterprise innovation, while tax incentives had no effect on enterprise performance or sometimes even had a negative effect. Warda [49] thought that the absolute value of R&D price elasticity was greater than the short-term price elasticity, the short-term incentive effect of tax preferential policies was weak, while the long-term effect of R&D expenditure was significant. Brown et al. [50] found that in promoting innovation investment to promote economic growth, domestic policies dealing directly with distributivity and financing were more effective than traditional tax subsidies, and tax relief was negatively related to enterprise R&D investment.
The above literature review confirms the important contribution of government R&D fiscal and tax subsidies to financial incentive policies, but the existing research only analyzes the effectiveness of incentive policies and the influencing factors of innovation activities and fails to link the pretax additional deduction policy with innovation efficiency and consider the sustainability and inter-provincial differences of R&D fiscal and tax subsidies forinnovation efficiency. Based on the construction of regional innovation efficiency system, this paper divides the government R&D fiscal and tax subsidies into two parts: direct and indirect. The former part chooses local governments and enterprises to invest R&D funds, while the latter uses the preferential tax policy to choose the special tax policy of pretax additional deduction and uses the truncated DEA-Tobit random effect model to regress and test the sustainability. It not only brings the tax preference into the innovation efficiency research system and broadens the new ideas in the research field of R&D policies and innovation efficiency, but also explores the balanced development of R&D fiscal and tax subsidies in the context of the national mid- and long-term scientific and technical development plan, which has a strong guiding significance for the policy-making of China’s technological innovation.
3. Materials and Methods
3.1. DEA Tobit Model
3.1.1. Decomposition of Regional Innovation Efficiency
In the evaluation of regional innovation efficiency, the main representative methods are the parameter method of stochastic frontier analysis (SFA) and the non-parameter method of data envelopment analysis (DEA). The efficiency of regional innovation represents the comparative relationship between multiple inputs and outputs in the process of scientific and technological innovation activities in different regions. This method of technical efficiency measurement just conforms to the characteristics of the DEA method that does not need to specify production function and multiple inputs and outputs. The knowledge-based economic characteristics of regional innovation activities determine the uncertainty of marginal income of innovation economic benefits. Therefore, this paper selects the BCC model to evaluate the regional innovation efficiency on the premise of variable returns to scale and analyzes the regional scale income and projection in depth.
Banker, Charnes, and Copper proposed the BCC model under the condition of variable returns to scale (VRS) and deduced the technical efficiency and scale efficiency. Assuming that there are n decision-making units (DMUs) to be evaluated, m input factors are used to produce q outputs, and the DEA model has a relative efficiency measurement index for the decision-making units represented by each province:
In the Formula (1), represents the total input of the i-th element of the j-th decision-making unit ; represents the r-th output of the j-th decision-making unit, ; and represent the weight coefficients of input and output, respectively. Further, the BCC model is obtained with relaxation and residual variables introduced as follows:
The effectiveness of each decision-making unit can be obtained by using the optimal solution of Formula (2). The efficiency value calculated by the CCR model is called technical efficiency, which can be divided into the product of scale efficiency and pure technical efficiency. Pure technical efficiency can be calculated by the BCC model. When the evaluated unit is DEA invalid, a new DEA effective decision unit can be constructed by projection analysis. , is the projection on the front surface relative to the original value . In order to get the effective DEA of the original decision-making unit, we need to adjust the input and output, that is, input redundancy , insufficient output .
3.1.2. Tobit Regression Model
The innovation efficiency calculated by DEA method cannot avoid the difference of individual external environment, which makes the efficiency value lose “fairness” and deviate from the real efficiency level. Therefore, Tobit model needs to be constructed, which takes the comprehensive efficiency as the explained variable and the influencing factor as the explained variable. Tobit regression model was first proposed by James Tobin [51], also known as the truncated regression model. The existing estimation methods are generally extended on the basis of Heckman’s [52] two-step method. In this paper, we want to study the impact of government R&D fiscal and tax policies on the regional innovation efficiency. The value of innovation efficiency is between 0 and 1, and the direct use of least square estimation can easily lead to biased parameter estimation. As the interpreted variables that just meet the requirements of the model are the characteristics of truncated data, we can use the truncated Tobit random effect model for regression analysis.
In the Formula (3), , is the vector matrix of explanatory variables. Through regression analysis, we can explain the impact of government fiscal and tax subsidies relief on the regional innovation efficiency.
3.2. Malmquist Exponential Decomposition
The Malmquist index was originally proposed by Malmquist (1953), and Fare [53] combined the Malmquist index with DEA theory and further decomposed the total factor productivity calculated by the Malmquist index, which can be divided into efficiency change index TEC and technology change index TC:
The technical efficiency change index can be divided into pure technical efficiency index PTEC and scale efficiency change index SEC, which is expressed as:
When the index change calculated by the above formula is greater than 1, it means that the efficiency of this part has been improved, and the total factor productivity has been promoted. When the index change is equal to 1, it means that the efficiency does not change. When the index change is less than 1, it means that the efficiency has a downward trend, and the total factor productivity has been reduced. The change of index is to express the change of productivity with the ratio of two distance functions at different times under the variable returns to scale. The Malmquist index can measure the change of total factor productivity of decision-making unit by period. It can also find out the root cause of the change of technical efficiency through the change mode of pure technical efficiency, technical progress and scale efficiency decomposed by the Malmquist index, see Appendix A for detailed analysis of returns to scale.
4. Results and Discussion
4.1. Evaluation of Regional Innovation Efficiency
4.1.1. Evaluation Index and Data Sources
For the purpose of accurately measuring the efficiency of regional innovation in China and considering the impact of fiscal subsidies on the regional innovation efficiency, 30 regional innovation systems from the Chinese mainland (the Chinese mainland excludes the two provinces of Hongkong and Macao as well as provinces, autonomous regions, and municipalities outside the Tibet autonomous region) were selected for the 2002–2016 period of innovation input and output data. The time lag is estimated by taking the lag period as the treatment of most studies [54]. This paper selects provincial data for research. On the one hand, provincial data is easy to obtain. On the other hand, the first level of research on the role of government is the provincial administrative unit. In the whole innovation process, R&D activities usually take place within the province rather than between provinces [55]. Therefore, the evaluation index system of China’s regional innovation efficiency is constructed from the perspective of innovation input and output, as shown in Table 1.
Among them, the amount of patent authorization reflects the transformation and development of technical innovation from quantity to quality in the long run; the number of scientific and technical papers published represents the practicality of technological innovation, the most direct way to reflect the technological development potential; and the two together represent the technological output of regional innovation efficiency. and are the performance of the marketization of science and technology innovation and international competition of each province and are also the economic output of regional innovation efficiency.
In order to explore the impact of government funding on regional innovation efficiency, the government science and technology allocations need to be included in the input indicators. For the specific treatment of input variables, in order to eliminate the error caused by price fluctuation, the internal R&D expenditure of each province is reduced in the base period of 2000, and the capital stock of R&D is obtained through the perpetual inventory. (Since the production input includes labor input, the double calculation of labor must be eliminated from the expenditure. The price index of R&D expenditure is obtained by weighting 0.45 times of fixed asset investment price index and 0.55 times of consumer price index by Zhu and Xu [56]). Local financial science and technology appropriation is used to offset the GDP reduction index of 2000 as the base period. In the output index, the patent authorization cannot explain the quality of technological innovation and its market-oriented achievements, which is supplemented by three other variables. The data of R&D input and output are from “China Statistical Yearbook‼, ȌChina Statistical Yearbook of Science‼ and “Technology and China Statistical Yearbook of High-Tech Industry‼.
4.1.2. Efficiency Evaluation
In this paper, the average efficiency level of technological innovation in various regions of China from2002–2016 is obtained by running the input-oriented BCC model in the Max DEA software. The analysis results from comprehensive efficiency (TE), pure technical efficiency (PE), scale efficiency (SE), and effective years of DEA are shown in Table 2. The comprehensive efficiency of each region in the table reflects the overall situation of technical efficiency, which can be divided into pure technical efficiency and scale efficiency.
Table 2 analyzes the average efficiency of regional innovation in China’s 30 provinces and four regions from 2002 to 2016. In the whole period, only Beijing, the eastern area and the northeast area have a comprehensive efficiency of 1, which is considered to be effective as a whole. The overall level of comprehensive efficiency of all provinces in China is the same as that of previous years (0.748). The national average comprehensive efficiency is 0.703, and there is 29.7% waste of investment. The regional development is unbalanced, showing a high and low polarization trend. The comprehensive efficiency between 0.8–1 includes Tianjin, Jilin, Heilongjiang, Shanghai, Jiangsu, Fujian, Hubei, Hunan, Guangdong, Hainan, Chongqing, Shanxi, Gansu, and central and western regions. Among them, only Shanghai, Hainan, and Gansu have higher pure technical efficiency than their scale efficiency, while other provinces have not achieved regional efficiency, which is largely caused by low pure technical efficiency. The scale efficiency promotes the growth of innovation efficiency. The specific distribution is shown in Figure 1. It can be seen that the comprehensive efficiency distribution is from low to high, and the color distribution is from light to deep. Among them, Hebei, Inner Mongolia, Jiangxi, Henan, Qinghai, Ningxia, and Xinjiang have very high scale efficiency values, which are 0.937, 0.820, 0.867, and 0.961, respectively, almost twice the pure technical efficiency. Low pure technical efficiency is the direct cause of poor comprehensive efficiency. In order to improve the low efficiency of innovation, the first thing is to improve the economic barriers brought about by pure technology, carry out scientific and technological research and development and equipment upgrading, vigorously increase investment in scientific research, encourage local universities, research and development institutions and other enterprises above the scale to invest in innovation, and promote regional innovation efficiency. From the index of DEA effective years, we can also judge the effectiveness of each region in the investigation period. Among them, Beijing, Tianjin, Jilin, Shanghai, Guangdong, Shaanxi, Hainan, and Gansu all have more than ten years of comprehensive efficiency and effectiveness. It is believed that eight regions have basically achieved DEA effectiveness. Although the effective use of resources has been realized, in order to improve the efficiency of regional innovation, the scale of enterprises should be continuously expanded to achieve the best ratio of input and output of technological innovation.
4.1.3. Malmquist Index Change Analysis
Table 3 analyzes the decomposition of the Malmquist index in 2002–2016 according to the time trend. The change trend in the first ten years can clearly be seen, since the implementation of the national mid- and long-term scientific and technical development plan (NPMLSTD). The change of national innovation efficiency is reflected in the technical efficiency change index (EC), pure technical efficiency change index (PEC), scale efficiency change index (SEC) and technical change index (TC).
Since the implementation of the development plan, technical efficiency has experienced a small fluctuation and has been growing steadily since 2011. The annual average technical efficiency index has changed to 1.009, and the overall efficiency situation is on the rise. The growth of the index is caused by the increase inpure technical efficiency in the early stage, and the increase of scale efficiency formed in the later stage promotes the innovation efficiency. The index of technological progress was more than 1 in 2006–2011, and the index of technical efficiency began to increase. To a large extent, after the implementation of the plan, all regions of the country began to focus on the development of high-tech industries and encourage enterprises to upgrade science and technology and make a lot of R&D investments. In the short term, technological progress led to the growth of total factor productivity. When a certain threshold was reached, the input and output of innovation formed a scale effect, pure technical efficiency drove economic growth, and regional innovation efficiency increased. From the perspective of index change, each index has a slight downward trend after 2014. Based on the analysis of local conditions, local governments and enterprises have generally increased their investment in innovation. However, due to the impact of factors such as the implementation of local funds, official performance championships, and the overall citizens’ awareness of innovation, the output level fails to give an ideal return, resulting in technological innovation turning to technological students. There are some problems such as waste of resources when the development of regional innovation ability cannot keep up with the high-quality development of economy. Therefore, we should pay more attention to whether the proportion of innovation factors is reasonable, continue to strengthen technological innovation, integrate regional innovation ability with high-quality economic development, improve regional innovation ability and efficiency, and comprehensively improve factor productivity.
Table 4 is divided into three stages for empirical research. From the overall Malmquist index change of four regions in China, before the implementation of the national mid- and long-term scientific and technical development plan, the index change of the whole country and the western area shows an upward trend, and the technological change leads to the improvement of innovation efficiency. This index change trend continues until the first five years of the implementation of the plan. Since 2012, technological change has continued to affect innovation efficiency, but the changes of pure technical efficiency index and scale efficiency index in the central area have shown a downward trend. At the same time of changing industrial technology in the central region, the development scale of high-tech industry and the corresponding special technical support did not expand the industrial pattern, resulting in the result far away from the forefront of technology production.
4.1.4. Returns to Scale Analysis
Table 5 shows the regional innovation scale compensation of 30 provinces in China and the overall trend of scale compensation in three time periods. Among them, only the provinces of Beijing, Gansu, Hainan, and Heilongjiang have the same return on scale during the whole research period, reaching the best state of scale efficiency. The Fujian, Hebei, Henan, Jiangxi, Liaoning, Qinghai, and Sichuan provinces have increased returns to scale in the whole research area, and the inefficiency of technical efficiency is mainly caused by the lack of innovation investment, which has large room for improvement, and increased moderate input can bring a higher output. Tianjin, Shanghai, and Hubei are in the best state of constant returns to scale in 2002–2011, decreasing from 2012 to 2016, and the three provinces are in the state of easy improvement. In the past five years, innovation input is relatively surplus rather than insufficient, so we should properly adjust the proportion of input and strengthen the effective use of resources. Since the implementation of the national mid- and long-term scientific and technical development plan in 2006, the scale reward has been increasing as a whole, and the scale reward is decreasing only in some provinces. Therefore, we should continue to increase investment in innovation so as to meet the scale economic trend of national technical efficiency.
4.1.5. Projection Analysis
Table 6 shows the redundancy and insufficiency of the non-effective regions in the past five years in the national mid- and long-term scientific and technical development plan. From the perspective of input and output, it is necessary to find out the root causes of low efficiency of regional technological innovation and how to learn and improve from DEA-effective provinces. During 2012–2016, there were 11 provinces with effective innovation efficiency. As the improvement target, Beijing, Guangdong, Chongqing, and Shaanxi were regarded as the reference benchmark of efficiency frontier by other provinces, expressed in the form of linear combination of efficiency frontier, and the correlation coefficient in brackets, which can be used as a reference for the improvement of efficiency of each province.
Conducting an in-depth analysis of the above empirical table, for example, we see that Tianjin’s innovation efficiency is 0.848, and Guangdong and Chongqing will be the improvement targets, of which Chongqing is the main reference target. As the two cities with the highest GDP among China’s second-tier cities, Tianjin and Chongqing have comparable economic developments, and their economic development trends and structures are very similar. In terms of technological innovation, a large number of high-end manufacturing and service industries in Tianjin have been absorbed by Beijing. It is at a disadvantage in terms of talent introduction and technology accumulation. Chongqing, as the economic leader in the northwest region, has a great advantage. Therefore, Tianjin should learn from Chongqing in terms of talent introduction and high-end technology, establish a win–win cooperation mechanism, and jointly promote the development of second-tier cities.
Table 7 lists the adjustment of input and output of innovation efficiency. Since the model is input-oriented, it mainly improves the innovation output of each province by adjusting the input of factors. It is noteworthy that the element investment here is the relative redundancy under the existing scale, not the absolute redundancy. Due to the irrational investment proportion among R&D personnel, R&D funds and local government grants, various provinces have different innovation efficiency with invalid DEA. The proportion of innovation investment improvement in non-DEA-effective regions is high; among them in Inner Mongolia, Qinghai, and Xinjiang, the R&D personnel input and local financial science and technology allocation improved by 85.474%, 81.001%, and 84.662%, respectively, and their redundancy is the main reason for the low efficiency of regional innovation. Compared with the first two input factors, R&D expenditure input has a smaller improvement. The improvement range of output factors is polarized, and the contract amount of technology introduction can be improved greatly. The improvement range of Henan and Yunnan is 6.689 and 6.153 times. Compared with that, it is difficult to increase output through the improvement of input factors.
4.2. Regression of R&D Fiscal and Tax Policy Model
4.2.1. Variable Selection and Model Establishment
To study the impact of R&D fiscal policy on innovation efficiency, we should consider the direct and indirect means of R&D fiscal policy. The direct means are the investment of regional governments and enterprises in scientific and technical research and development, and the indirect means are the government’s tax reduction and preference for R&D. When establishing the regression model of influencing effect, we can not only start with the input and output of R&D, and the level of innovation efficiency of each province in China is not only a regional economic problem, but also reflects the local social orientation of R&D innovation, which is restricted by many factors, such as economic development, regional infrastructure construction, enterprise R&D team, enterprise scale, and technology. Those effects have an impact on the efficiency of regional innovation. According to the actual situation of China and the existing research at home and abroad, the relevant variables of the model are defined in Table 8.
The form of tax relief of the R&D fiscal policy studied in this paper is indicated by the pretax additional deduction policy, which started in 1996 and is only limited to state-owned and collective industrial enterprises. In recent years, it has been gradually systematized. In order to determine the impact of this policy on regional innovation efficiency, this paper studied the implementation of the pretax additional deduction policy in the “Implementation of the PRC Enterprise Income Tax Law”. In 2009, the policy was amended to link the old and new tax laws, and a large degree of reform was carried out. Specifically, in order to promote the construction of an innovative national strategy in 2020, in-depth research on the national mid- and long-term scientific and technical development plan (NPMLSTD) is an important step to guide cross provincial and cross period R&D resources. The data of 30 provinces in China (except Hong Kong and Macao SAR, Tibet) from 2009 to 2016 were used to adjust the data based on the base period of 2002. The absolute logarithm was changed, and the dependent variable had taken into account the efficiency difference caused by the first lag period. The Tobit regression model was established as follows:
4.2.2. Empirical Results
The regression of this paper adopts the truncated Tobit random effect model combined with the characteristics of efficiency data, which conforms to the right broken tail distribution. Through Stata15.0 statistical software and the stability test of numerical integration, the Z statistics of each coefficient passes the 5% significance level test.
Table 9 reports the analysis results of the regression model. In this paper, three regression models are established. Model (1) and (2) are the robust estimations of model (3), and the regression results are consistent. The coefficient of Gov is positive in each column and significant at the level of 5%, which means that direct government funding for technology R&D can improve innovation efficiency; the Pri coefficient is negative in each column and significant at the level of 1%, which shows that enterprises’ investment in technology R&D has a negative impact on innovation efficiency, and the direct subsidy of R&D financial policy has an overall effect on innovation efficiency. The regression results of the model show that preferential tax policies have no effect on the regional innovation efficiency.
There is a positive correlation between the government direct subsidy and the regional innovation efficiency. Under the control of other factors, when the government’s direct subsidy changes by 1%, the regional innovation efficiency increases by 0.132 on average. In a certain range, the government can increase the subsidy, although it has a certain crowding out effect on enterprises and private R&D funds. However, on the whole, it can improve the efficiency of regional innovation. This is consistent with Zhu and Xu [56] who proposed that government subsidies can significantly promote enterprise R&D projects. Doh and Kim [57] also pointed out that South Korean government support has a significant positive impact on industrial innovation. Enterprises and private direct funding are negatively related to the efficiency of regional innovation. The theory of “economic man” determines the maximization of the benefits of enterprises’ decision-making, and the subsidies for scientific and technical research and development are also carried out for their own profits. It is difficult for enterprises to obtain high profits in the short term from their R&D investment, which will flow to projects with more obvious short-term profits.
Government tax preference has no significant effect on regional innovation efficiency. As the evaluation of regional innovation efficiency needs the transformation of R&D input and output for a certain period of time, the government’s indirect subsidy policy only plays a very weak role in the transformation process of innovation efficiency. The R&D tax preferential policy subsidizes enterprises in the form of a small amount of capital preferential policy, which makes the innovation output of enterprises change little in a short period of time, and there are intermediary effects on the regional innovation efficiency.
From the perspective of control variables, the regional economic development level, technological scale of enterprises, and technological opportunities are positively correlated with regional innovation efficiency, and they are significant at the level of 1% and 5% respectively. A higher level of economic development will promote local demand for scientific and technical innovation, thus increasing innovation output, which is conducive to improving regional innovation efficiency. The regression results show that the proportion of improving innovation efficiency is also higher, which shows that improving the level of local economic development can effectively improve the efficiency of R&D innovation. The increase in technology scale and R&D innovation opportunities of enterprises makes regional innovation in China form scale economic benefits. Since the implementation of NPMLSTD, the scale reward has been increasing as a whole. Most provinces are in the front of constant and increasing efficiency of scale reward. The continuous expansion of technology scale and opportunities improves the efficiency of regional innovation. The strength of the number of talents is negatively related to the efficiency of regional innovation. It is worth considering that the strength of the number of R&D talents in an enterprise will reduce the efficiency of regional innovation. In the process of improving the efficiency of innovation, the number of R&D talents cannot be used to express the atmosphere of industrial R&D, which requires the high quality and efficiency of the R&D team, strictly controlling the quality of the R&D personnel, and making the talents elitist so as to improve the district regional innovation efficiency.
In order to investigate the policy sustainability of R&D fiscal and tax subsidies on the regional innovation efficiency, regression models are established respectively for lag 1, lag 2, and lag 3, as shown in Table 10 models (4), (5), and (6). The lagged regression results show that direct government funding has a positive effect on regional innovation efficiency, while direct corporate and private funding has a negative effect, which is significant at 1% confidence level and consistent with the regression results of model (3). The results show that the R&D fiscal subsidy has policy sustainability on innovation efficiency, and the effect of government direct subsidy is the most obvious in the second year of the policy. However, with the increase in policy implementation time, the policy effectiveness is more and more obvious, and the regression coefficient of the impact on the regional innovation efficiency is also increasing. The impact of pretax additional deduction on regional innovation efficiency is still not obviously significant, and the direct effect of this policy on technical efficiency is weak.
In order to investigate the differences in the impact of R&D fiscal subsidies on regional innovation efficiency in different regions of China, China is divided into four regions according to geographical regions: eastern, western, central, and northeast, and regression models are established respectively, as shown in Table 11 models (7), (8), (9), and (10). Both government direct subsidy and enterprise capital in eastern and central regions have a positive impact on innovation efficiency, and the latter has a more significant change trend. It is worth mentioning that the central and northeast R&D pretax additional deduction policy has a significant impact, and the new deal takes the lead in these two regions. The policy impact of the western region is consistent with that of the whole country. The fiscal and taxpolicies for R&D in the four regions have produced different effects. According to the empirical results, we can optimize the allocation of direct subsidy and tax subsidy.
The above regression confirms the impact of R&D fiscal policy on the regional innovation efficiency, but its causal effect needs to be tested for robustness. Government funding will stimulate the input and output of scientific and technological innovation and promote enterprise innovation. Meanwhile, the improvement of innovation efficiency will also affect the decision-making of patrons, resulting in reverse causality. Therefore, this paper uses proxy variables to test the endogenous problems. Specifically, this paper constructs the proxy variable (expressed by eTax) for the R&D tax preference variable indirectly funded, re-estimates and tests the benchmark regression results, and uses the R&D expenditure pretax deduction preference constructed by Zheng [58]. Tax preference intensity = R&D investment × pretax deduction rate (r) × corporate income tax (t)/total assets, , where B represents tax incentive intensity index. According to Vada, the general enterprise value is 0.867 (based on the new enterprise tax law of 2008); takes 15% based on the tax reduction value of high-tech industry and substitutes the specific data into the regression model. The results are shown in Table 12.
The regression results of model (11) are consistent with model (3). The direct subsidy effect of R&D fiscal policy is significant, but the tax preference intensity is not significant. Tax preferential policies have no significant impact on regional innovation efficiency. An imperfect incentive mechanism will enable most enterprises to use R&D tax relief funds for other activities, as Gorg and Strobl [41] pointed out that enterprises funded by government R&D may use government capital investment instead of their own innovation investment, sometimes even having a negative effect.
5. Conclusions and Policy Recommendations
In order to study the overall situation of China’s regional innovation efficiency, the DEA-Malmquist index method was used to measure the regional innovation efficiency of China’s provinces in 2002–2016, and the technical efficiency from the perspective of inter-provincial differences was evaluated. From four aspects of average technical efficiency, Malmquist index change, returns to scale and projection analysis, this paper analyzes the situation before and after the implementation of the national medium-andlong-term scientific and technical development plan from the perspectives of time trend and regional differences. On this foundation, this paper makes an empirical analysis of the impact of government R&D fiscal and tax subsidies on regional innovation efficiency by using Tobit right censoring model, verifies the impact of direct government funding and indirect tax on innovation efficiency in China’s provinces, tests the sustainability of R&D fiscal and tax policies, and draws the following conclusions:
From the perspective of inter-provincial differences, the overall level of comprehensive efficiency of China’s provinces remains unchanged before and after the implementation of the national mid- and long-term scientific and technical development plan. The national average comprehensive efficiency is 0.703, with 29.7% of investment waste, unbalanced regional development and large differences between provinces. Among them, the comprehensive efficiency of Hebei, Inner Mongolia, Jiangxi and Henan provinces is less than 0.5, but the average scale efficiency is 0.896, almost twice the pure technical efficiency, which reflects that the main reason for the poor overall technical efficiency of the country is the low pure technical efficiency. Therefore, we should start from the perspective of special technology of production to solve the problem of low productivity caused by short technology, so as to improve the overall regional innovation efficiency environment in China.
From the perspective of time trends, looking at the changes before and after the implementation of the national mid- and long-term scientific and technical development plan, compared with the plan before implementation, the returns to scale of each province show an overall increasing trend. Only Tianjin, Shanghai, and Hubei provinces in the past five years in the plan decreased the scale income, and the innovation investment is relatively surplus rather than insufficient, which is easy to improve. Therefore, the investment proportion should be properly adjusted. There are 11 provinces with effective innovation efficiency in the past five years, with Beijing, Guangdong, Chongqing and Shaanxi beingregarded as the reference benchmark of efficiency frontier by other provinces as the improvement target. According to the input-oriented BCC model, the R&D personnel input and the improvement of local financial science and technology allocation in Inner Mongolia, Qinghai, and Xinjiang reached 85.474%, 81.001%, and 84.662%, for which investment redundancy is the main reason for low efficiency of regional innovation. The improvement range of output factors is polarized, and the contract amount of technology introduction can be improved greatly. The improvement range of Henan and Yunnan is 6.689 and 6.153 times. In contrast, it is difficult to increase output through the improvement of input factors.
The regression of DEA-Tobit random effect shows that the government’s direct funding for technology R&D can improve innovation efficiency, the investment of enterprise’s technology R&D has a negative impact on innovation efficiency, and the direct subsidy of R&D fiscal policy has an overall effect on innovation efficiency; the pretax additional deduction has a negative impact on regional innovation efficiency, but it is not significant. The test results are consistent with the above regression results through the constructed tool variable of tax preference. R&D fiscal and tax subsidies have policy effectiveness on regional innovation efficiency. The results show that the direct government funding has a positive effect on regional innovation efficiency, and the direct corporate and private funding has a negative effect. R&D fiscal policy has a long-term impact on innovation efficiency, which is even greater than the short-term fluctuation. In the second year of the policy, the effect of direct government funding is the most obvious. With the increase in the implementation time of the policy, the policy continuity is more and more obvious.
In order to effectively improve the innovation efficiency of high-tech enterprises, the following policy recommendations are put forward from the three levels of inter-provincial differences, national development plans, and government policies:
First, the efficiency of regional innovation in all provinces of China is consistent with that of previous years (0.748), and there is still a great waste of R&D resources. We should pay attention to the rational allocation of R&D investment resources so as to optimize the R&D expenditure structure and improve the resource waste and efficiency reduction caused by the lack of pure technical capacity as soon as possible, as well as the accumulated economic barriers. Taking Hebei, Inner Mongolia, Jiangxi, and Henan as typical examples, in view of their serious pure technical efficiency lagging problem, they will learn and exchange from the pure technical aspects of the high-tech industry in the target provinces for improvement. For example, Tianjin’s innovation efficiency is 0.848, and Guangdong and Chongqing will be the improvement targets, of which Chongqing is the main reference target. As the two cities with the highest GDP among China’s second-tier cities, Tianjin and Chongqing have comparable economic developments, and their economic development trends and structures are very similar. In terms of technological innovation, a large number of high-end manufacturing and service industries in Tianjin have been absorbed by Beijing. It is at a disadvantage in terms of talent introduction and technology accumulation. Chongqing, as the economic leader in the northwest region, has a great advantage. Therefore, Tianjin should learn from Chongqing in terms of talent introduction and high-end technology, establish a win–win cooperation mechanism, and jointly promote the development of second-tier cities. The government should strengthen the cultivation of scientific and technical capabilities, stimulate the high-tech industry to carry out scientific and technical research and equipment upgrading, effectively play the role of the market in promoting technical efficiency, and encourage local universities, research and development institutions, and enterprises above the scale to invest in innovation.
Next, to adapt to the development trend of the national mid- and long-term scientific and technical development plan, different provinces make effective adjustments according to their own development. The paper analyzes the returns to scale of each province in different time periods. The provinces with increasing scale returns should expand the investment scale of technology research and development, broaden the field of technology research and development, and improve the driving effect of technology research and development on the economy. The provinces with decreasing scale returns should have a better understanding of their own development situation rather thanblindly investing a lot. The development scale of high-tech industry and corresponding special technical support in the central region should form a supporting development model to strengthen cooperation and exchange between provinces and regions. The government should create a good learning and cooperation atmosphere for this purpose, provide effective guidance for technological innovation activities, and carry out training forms such as technical exchange meetings, formulating a construction of regional competitiveness strategy policy [59,60].
Last, government subsidies can directly improve the innovation efficiency of enterprises and effectively reduce the risk of technological innovation of enterprises. The government’s R&D funding can make up for the lack of funds for enterprise innovation, create an innovation environment in which cooperation and competition coexist for science and technology in the economic society, clarify regional strategic countermeasures, and establish a scientific and fair regional innovation system. The incentive effect of the government’s preferential tax policies on R&D activities is long-term and stable, with certain lag. China’s central and northeastern regions’ pretax additional deduction policy has had a significant impact and has shown a leading advantage. These two regions should continue to leverage the benefits of indirect taxation to promote industrial upgrading in the other two regions. In order to ensure the continuous improvement of innovation efficiency in various regions of our country, we should take the government direct subsidy as the main means of funding and tax preference as the auxiliary for long-term policy support. Chen et al. [61] tookadvantage of a large fiscal incentive and detailed administrative tax data to analyze these margins where firms with R&D investment over a threshold or “notch” in the important case of Chinaobtained aconclusion thataccounting for relabeling had important implications for the design of R&D subsidies, along with the use of loan discounts, corporate bonds, and other subsidies to improve regional innovation efficiency. We will continue to update the preferential tax rate system, establish a fair and reasonable incentive policy for R&D tax, and make effective and timely reasonable policy supplements for industry heterogeneity.
The level of regional economic development, technological scale of enterprises and technological opportunities can promote the efficiency of regional innovation. Therefore, the Chinese government should further improve the environment of the technological innovation market, improve the soft power of regional economy, formulate astricter R&D and intellectual property system, stabilize the investment and supervision of basic research while ensuring the efficient development of high-tech industry, and create an environment for the formation of an independent industrial chain. For R&D scientific and technical talents, the aim should be to build a high-quality talent team. Local governments should pay more attention to the cultivation and introduction of high-tech talents, mobilize the enthusiasm of innovation of technical R&D talents, formulate corresponding incentive measures, and ensure the overall high level of the technical innovation talent team. R&D financial and tax subsidies have policy sustainability for regional innovation efficiency. When testing the effect of policies, we should pay attention to timeliness and deeply explore the mechanism and effect of production technology. Due to the special nature of technical innovation, it is difficult to have an immediate effect on the short-term innovation efficiency through effective means. The direct subsidy and indirect subsidy of the government should have the policy persistence. By analyzing the time trend of policy effect, the strength and effect time of policy implementation should be controlled.
On the whole, the investment in R&D funding by the eastern and central governments in China has brought about the improvement of regional innovation efficiency. The R&D expenses in the central region will also be given priority to deduct the New Deal. The eastern and central regions should adopt the overall regional policies and cooperate with industrial policies. Speeding up the breaking of system and mechanism barriers in regional linkage development, following the principles of complementary advantages and regional integration, and focusing on industrial structure optimization and upgrading and innovation-driven development are more conducive to achieving mutual benefit and improving production efficiency. The “Belt and Road” policy has benefited China’s economic exchanges with other developing countries. China’s technological innovation has paved the way for China to expand business opportunities and improve people’s living standards. The “spillover effects” it produces will benefit other developing countries and even the world. China is similar to the factor endowment structure of most “Belt and Road” developing countries [62,63]. Through its advantageous technological innovation cooperation, China uses the advantages of various countries to jointly develop new and suitable technologies that are more internationally competitive, while expanding international investment market. In order to promote the technological progress of the home country through the technology spillover effect obtained through feedback, for example, there are cooperative projects of countries along the route to jointly build science and technology parks.
The Chinese government should also provide more preferential policies to support technology-seeking foreign direct investment, encourage outstanding domestic companies to make technology-obtained direct investment abroad, and shift the investment focus to the advantageous industries along the “Belt and Road” countries. Some examples are Romania’s high-speed rail and railway network construction; Ukraine’s aviation, weaponry, and equipment industries; Egypt’s machinery manufacturing and automobile industry; Russia’s military, aerospace, and nuclear industries; and Malaysia’s cooperation in low-carbon new energy fields, such as hydropower, wind power, and solar power generation. At present, compared with developed countries, China’s investment in R&D funding is far different, and the level of domestic emphasis on high-tech technological innovation research and development is far less than that of developed countries. Only by increasing investment in domestic scientific and technical innovation capital, maintaining a reasonable proportion of scientific and technical investment, and continuously improving the country’s self-innovation capabilities can the gap between China and developed countries in the development of high-tech development be gradually reduced.
Author Contributions
W.L. is the first author of this article; she mainly put forward the idea of this article and helped perform the analysis with constructive discussions, and she is also the director of the funding project that supported this article. Y.B. is the corresponding author of this article; she contributed to the conception of the study and significantly to the data analysis and manuscript writing, and she also mainly undertook the writing task of this article. All authors have read and agreed to the published version of the manuscript.
Funding
“Research on Factor Allocation and Industrial Upgrading Policies for Stable Economic Growth under the New Normal”, Major Project of Key Research Bases of Humanities and Social Sciences, Ministry of Education, China. No: 16JJD790015; “Research on Monitoring and Influencing Mechanism of Small and Micro Enterprise’s Lifespan of Jilin Province”, Northeast Revitalization and Development Program of Jilin University, China. No: 21dbzx05.
Institutional Review Board Statement
Not applicable.
Informed Consent Statement
Not applicable.
Data Availability Statement
The raw/processed data required to reproduce these findings cannot be shared at this time as the data also forms part of an ongoing study.
Conflicts of Interest
The authors declare no conflict of interest.
Appendix A
Returns to scale analysis. In the DEA model, the setting of RTS determines the shape of the frontier. The returns to scale of production technology have three stages: Increasing Returns to Scale (IRS), Constant Returns to Scale (CRS), and Decreasing Returns to Scale (DRS). The technical efficiency obtained from VRS model selected in this paper is the pure technical efficiency. The leading edge of the model can be divided into three parts: MAB (excluding B point) is the IRS stage, B point is CRS stage, BD (excluding B point) is the DRS stage. The front edge of the IRS model consists of two parts: MAB (excluding point B) is the IRS stage, in which the sum of linear combination coefficients of section AB is 1; ray rwith point B as the end point is the CRS stage, the sum of linear combination coefficients is greater than or equal to 1, and the solid part constitutes the front edge of IRS model and , as shown in Figure A1. There is no IRS stage in the leading edge of DRS model, and its leading edge is composed of two parts: OB is the CRS stage, and the sum of linear combination coefficients is less than or equal to 1; BD (excluding point B) is the DRS stage, the sum of linear combination coefficients is 1, and the solid part constitutes the leading edge of the DRS model and , as shown in Figure A2.
Figure A1.
Frontier of model IRS (input-oriented).
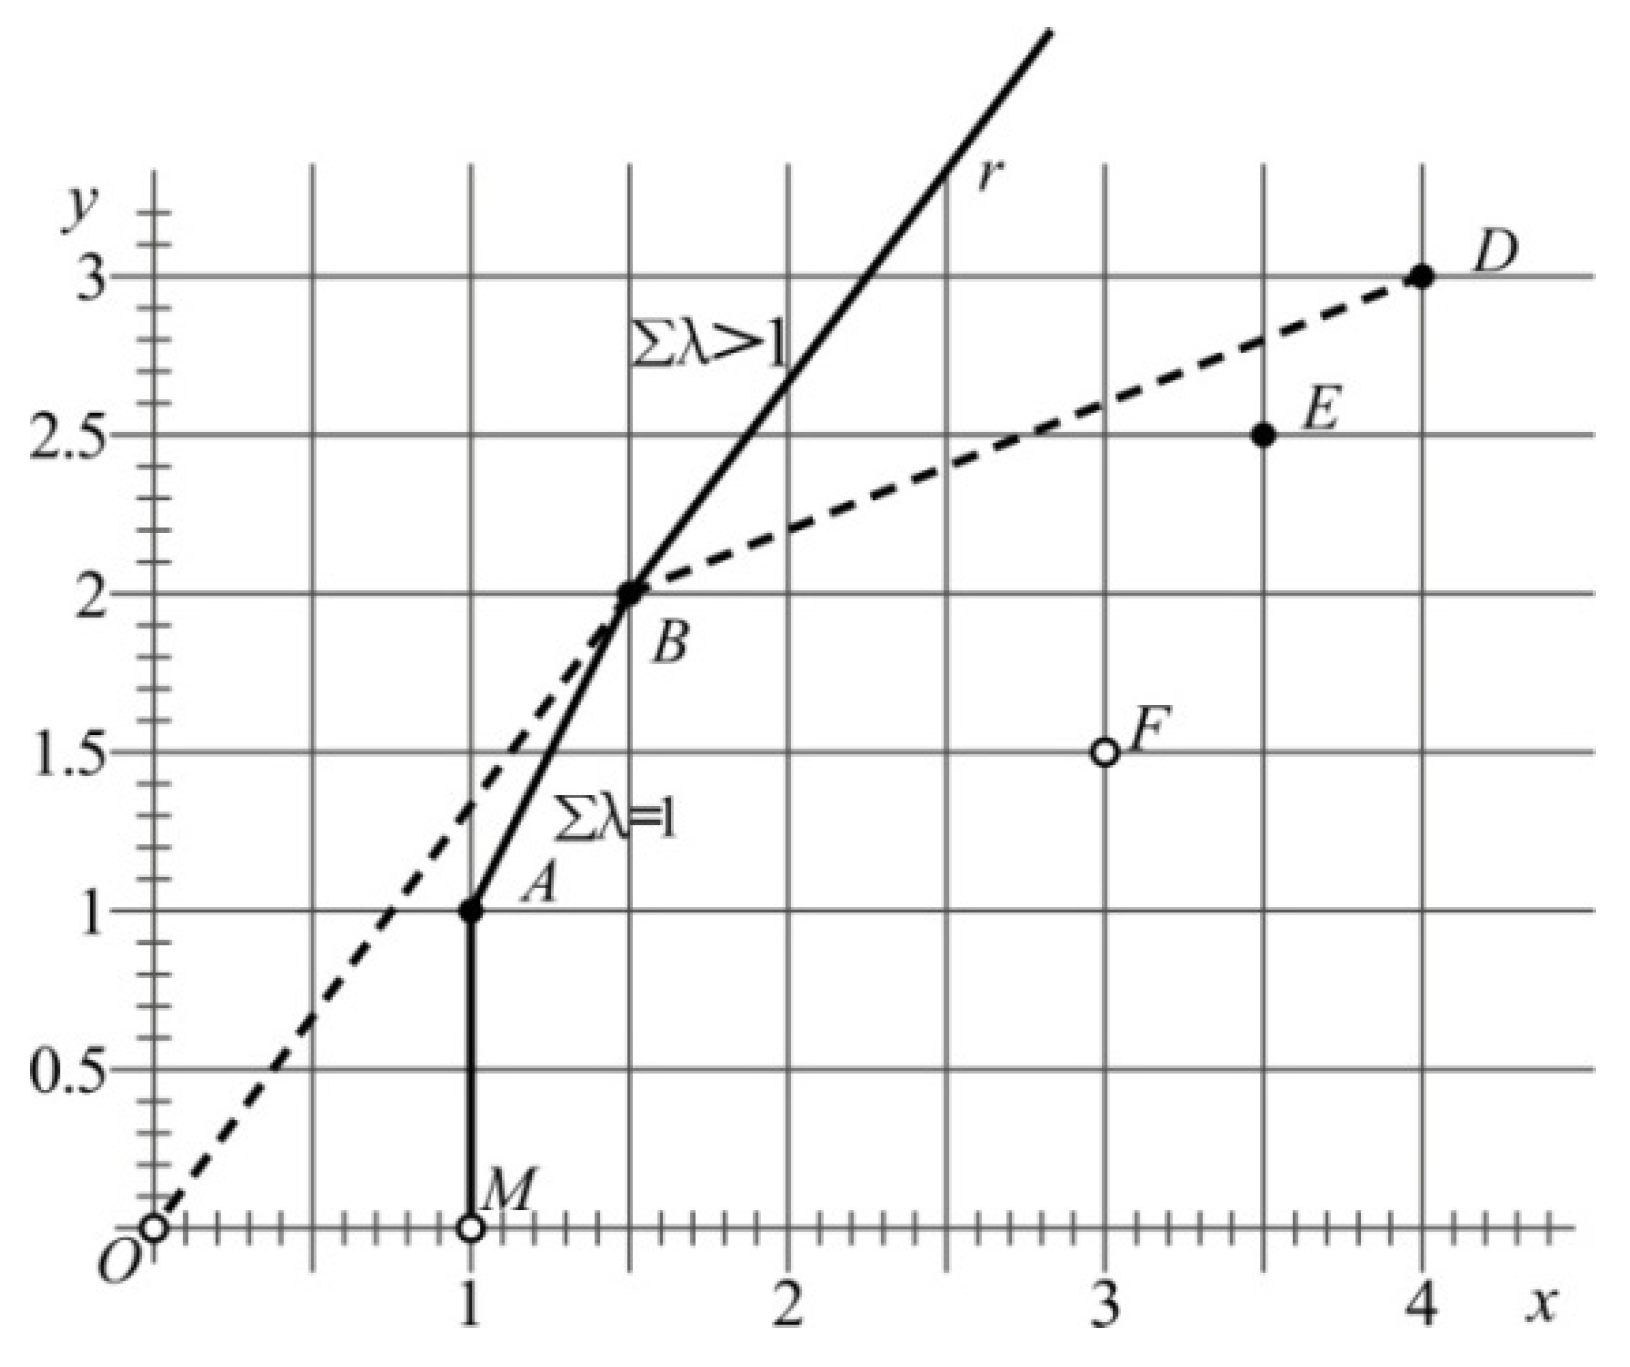
Figure A2.
We obtain the DEA input-oriented CRS multiplier model, where the sum of linear combination coefficients of VRS, IRS, and DRS is respectively , , ; represents a row vector with all element values of 1, i.e., = (1,1,…,1).
Figure A2.
We obtain the DEA input-oriented CRS multiplier model, where the sum of linear combination coefficients of VRS, IRS, and DRS is respectively , , ; represents a row vector with all element values of 1, i.e., = (1,1,…,1).

References
- Solow, R.M. A contribution to the theory of economic growth. Q. J. Econ. 1956, 70, 65–94. [Google Scholar] [CrossRef]
- Lundvall, B. National systems of innovation: Toward a theory of innovation and interactive learning. In Anthem Other Canon Economics; Anthem Press: London, UK; New York, NY, USA, 2010; Volume 2, p. 388. [Google Scholar]
- Wallsten, S.J. The effects of government-industry R&D programs on private R&D: The case of the small business innovation research program. RAND J. Econ. 2000, 31, 82–100. [Google Scholar] [CrossRef]
- Sharma, S.; Thoms, V.J. Inter-Country R&D Efficiency Analysis: Application of Data Envelopment Analysis. Scientometrics 2008, 76, 483–501. [Google Scholar]
- Parida, V.; Westerberg, M.; Frishammar, J. Inbound open innovation activities in high-tech SMEs: The impact on innovation performance. J. Small Bus. Manag. 2012, 50, 283–309. [Google Scholar] [CrossRef] [Green Version]
- Zhang, Y.; Chen, K.H.; Fu, X.L. Scientific effects of Triple Helix interactions among research institutes, industries and universities. Technovation 2019, 86, 33–47. [Google Scholar] [CrossRef]
- Li, X.B. An empirical analysis of the effect of institutional factors on regional innovation performance. J. Quant. Tech. Econ. 2007, 24, 13–24. [Google Scholar]
- Cheng, D.P.; Gan, S.M. Research on high-tech industry input-output efficiency in Yangtze River economic belt: Resources and Environment in the Yangtze Basin. CNKI J. 2017, 26, 325–332. [Google Scholar]
- Fischlein, M.; Smith, T.M. Revisiting renewable portfolio standard effectiveness: Policy design and outcome specification matter. Policy Sci. 2013, 46, 277–310. [Google Scholar] [CrossRef]
- Joskow, P.L. Comparing the costs of intermittent and dispatchable electricity generating technologies. Am. Econ. Rev. 2011, 101, 238–241. [Google Scholar] [CrossRef] [Green Version]
- Liu, F.C.; Simon, D.F.; Sun, Y.T.; Cao, C. China’s innovation policies: Evolution, institution and structure, and trajectory. Res. Policy 2011, 40, 917–931. [Google Scholar] [CrossRef]
- Liu, S.Z.; Guan, J.C. The evaluation on the innovating performance of regional innovation systems. Chin. J. Manag. Sci. 2002, 1, 75–78. [Google Scholar]
- Shi, F. Research on regional innovation efficiency: Based on Chinese provincial panel data and DEA method. Technol. Econ. 2010, 5, 42–47. [Google Scholar]
- Zhao, S.K.; Yu, H.Q.; Gong, S.L. The innovation efficiency of hi-tech enterprises in Jilin Province based on DEA method. Sci. Res. Manag. 2013, 34, 36–43+104. [Google Scholar]
- Yu, X.F.; Li, Z.W.; Chi, R.Y.; Shi, M.W. Technological innovation efficiency of different regions in China: Status quo and causes. Sci. Res. Manag. 2005, 2, 258–264. [Google Scholar]
- Bai, J.H.; Li, J. Government R&D funding and enterprise technology innovation: An empirical analysis from the perspective of efficiency. J. Financ. Res. 2011, 6, 181–193. [Google Scholar]
- Fan, F.; Huan, L.A.; Wang, S. Can regional collaborative innovation improve innovation efficiency? An empirical study of Chinese cities. Growth Chang. 2020, 51, 440–463. [Google Scholar] [CrossRef]
- Qian, L.; Wang, W.P.; Xiao, R.Q. Ownership, technology gap and innovation efficiency of high-tech enterprises. Sci. Technol. Prog. Policy 2019, 12, 1058–1114. [Google Scholar]
- Wu, Y.B. Which type of ownership is the most innovative enterprise in China? J. World Econ. 2012, 6, 3–29. [Google Scholar]
- Chen, Z.; Xu, W.; Lee, S.H. R&D Performances in High-Tech Firms in China. Asian Econ. Pap. 2017, 16, 193–208. [Google Scholar]
- Chen, K.; Kou, M.; Fu, X. Evaluation of multi-period regional R&D efficiency: An application of dynamic DEA to China’s regional R&D systems. Omega 2018, 74, 103–114. [Google Scholar]
- Hall, B.H.; Reenen, J.V. How effective are fiscal incentives for R&D? A review of the evidence. Res. Policy 2000, 29, 449–469. [Google Scholar] [CrossRef]
- Rothstein, B. Government Quality, Governance Capacity and Corruption, Social Trust and Inequality; Jiang, X.H., Ed.; Translator; Xinhua Publishing House: Beijing, China, 2012. [Google Scholar]
- Fukuyama, F. What is governance? Governance 2013, 26, 347–368. [Google Scholar] [CrossRef]
- Szczygielski, K.; Grabowski, W.; Pamukcu, M.T.; Tandogan, V.S. Does government support for private innovation matter? Firm-level from evidence from two catching-up countries. Res. Policy 2017, 46, 219–237. [Google Scholar] [CrossRef]
- Jin, H.; Bing, F.; Wu, Y.R.; Wang, L.B. Do government grants promote innovation efficiency in China’s high-tech industries? Technovation 2016, 57–58, 4–13. [Google Scholar] [CrossRef]
- Barca, F.; Mccann, P.; Rodriguez, P.A. The case for regional development intervention: Place-based versus place-neutral approaches. J. Reg. Sci. 2012, 52, 134–152. [Google Scholar] [CrossRef]
- Rodriguez, P.A. Do institutions matter for regional development? Reg. Stud. 2013, 47, 1034–1047. [Google Scholar] [CrossRef] [Green Version]
- West, J. Regional Innovation Monitor: Governance, Policies, and Perspectives in European Regions; Enterprise and Industry Directorate-General. Project No. 0932; European Commission: Brussels, Belgium, 2012.
- Mauro, P. Corruption and the composition of government expenditure. J. Public Econ. 1998, 69, 263–279. [Google Scholar] [CrossRef]
- Freeman, C. Technology policy and economic performance. In R&D Management; Trevor, M., Ed.; Pinter Publishers: London, UK, 1989; Volume 2, p. 34. [Google Scholar]
- Porter, M.E. Competitive Advantage of Nations: Creating and Sustaining Superior Performance, 5th ed.; Simon and Schuster: New York, NY, USA, 2011. [Google Scholar]
- Pang, L.X.; Guan, J.C. The effects of government financial policies on high-tech firm’s innovation and growth. Stud. Sci. 2018, 12, 2259–2269. [Google Scholar]
- Li, P.; Wang, C.H. The optimal level of public direct subsidies to business R&D and the targeted project select: A threshold regression analysis based on the industrial heterogeneity. Rev. Ind. Econ. 2010, 9, 37–53. [Google Scholar]
- Li, L.; Chen, J.; Gao, H.L.; Xie, L. The certification effect of government R&D subsidies on innovative entrepreneurial firm’s access to bank finance: Evidence from China. Small Bus. Econ. 2019, 52, 241–259. [Google Scholar]
- Guellec, D.; Van Pottelsberghe, B. The impact of public R&D expenditure on business R&D. Econ. Innov. New Technol. 2003, 12, 225–243. [Google Scholar] [CrossRef]
- Kang, Z.Y. Does Chinese government subsidies promote the quality of enterprise patents? Stud. Sci. 2018, 36, 69–80. [Google Scholar]
- Yang, T.T.; Luo, L.H.; Xu, B.T. The technical innovation effect of government subsidy: “Quantity change” or “Quality change”. China Soft Sci. 2018, 10, 52–61. [Google Scholar]
- Jian, G.; Richard, C.M. Effects of government financial incentives on firm’s innovation performance in China. Res. Policy 2015, 44, 273–282. [Google Scholar] [CrossRef]
- An, T.L.; Zhou, S.D.; Pi, J.C. The stimulating effects of R&D subsidies on independent innovation of Chinese enterprises. Econ. Res. J. 2009, 10, 87–98. [Google Scholar]
- Yu, F.F. Government R&D subsidies, political relations and technological SMEs innovation transformation. iBusiness 2013, 5, 104–109. [Google Scholar]
- Gorg, H.; Strobl, E. The effect of R&D subsidies on private R&D. Economica 2007, 74, 215–234. [Google Scholar]
- Feng, Z.; Chen, K.H.; Dai, X.Y. Does the weighted tax deduction for R&D costs promote firm’s innovative capability?—The full perspective of innovation chain. Sci. Res. Manag. 2019, 10, 73–86. [Google Scholar]
- Li, Y.L. Preferential tax policy and innovation efficiency of high-tech industry. J. Quant. Tech. Econ. 2018, 1, 60–76. [Google Scholar]
- Wang, Z.; Wang, L.H. Low-carbon economy development under the carbon emission trading scheme (ETS)—An analysis based on undesired DEA and DID models. J. Southwest. Univ. 2019, 5, 85–95. [Google Scholar]
- Czarnitzki, D.; Hanel, P.; Rosa, J.M. Evaluating the impact of R&D tax credits on innovation: A micro-econometric study on Canadian firms. Res. Policy 2011, 40, 217–229. [Google Scholar]
- Li, W.A.; Li, H.B.; Li, H.C. Innovation incentives or tax shield?—A study of the tax preferences of high-tech enterprises. Sci. Res. Manag. 2016, 37, 61–70. [Google Scholar] [CrossRef]
- Zheng, C.M.; Li, P. The influence of government subsidy and tax preference on innovation performance of enterprises. Sci. Technol. Prog. Policy 2015, 16, 83–87. [Google Scholar]
- Warda, J. Measuring the Attractiveness Of R&D Tax Incentives: Canada and Major Industrial Countries; Report Prepared for TAITC, OIS and Statistics Canada 88F0006XFB; Statistics Canada: Ottawa, ON, Canada, 1999.
- Brown, J.R.; Martinsson, G.; Petersen, C. What promotes R&D? Comparative evidence from around the world. Res. Policy 2017, 46, 447–462. [Google Scholar] [CrossRef] [Green Version]
- Tobin, J. Estimation of relationships for limited dependent variables. Econometrica 1958, 1, 24–36. [Google Scholar] [CrossRef] [Green Version]
- Heckman, J. Shadow price, market wages, and labor supply. Econometrica 1974, 4, 679–694. [Google Scholar] [CrossRef]
- Fare, R.; Grosskopf, S.; Norris, M.; Zhang, Z. Productivity growth, technical progress, and efficiency change in industrialized countries. Am. Econ. Rev. 1994, 84, 66–83. [Google Scholar]
- Liu, Z.Y.; Zhang, J.K. Analysis on innovation efficiency of the different capital type enterprises in high-tech industries—Based on the three-stage DEA model. R&D Manag. 2013, 25, 45–51. [Google Scholar]
- Chen, K.H.; Guan, J.C. Measuring China’s regional innovation systems: Application of network data envelopment analysis (DEA). Reg. Stud. 2012, 46, 355–377. [Google Scholar] [CrossRef]
- Zhu, P.F.; Xu, W.M. On the impact of government’s S&T incentive policy on the R&D input and its patent output of large and medium-sized industrial enterprises in Shanghai. Econ. Res. J. 2003, 6, 45–52. [Google Scholar]
- Doh, S.; Kim, B. Government support for SME innovations in the regional industries: The case of government financial support program in South Korea. Res. Policy 2014, 43, 1557–1569. [Google Scholar] [CrossRef]
- Zheng, R. Evaluation on different approaches of R&D tax incentives. Financ. Trade Econ. 2006, 9, 3–8. [Google Scholar]
- Harmaakorpi, V.; Rinkinen, S. Regional development platforms as incubators of business ecosystems. Case study: The Lahti urban region, Finland. Growth Chang. 2020, 51, 626–645. [Google Scholar] [CrossRef] [Green Version]
- Feng, M.H.; Qu, W.; Li, M.L. Does tax incentives induce R&D investment in firms? Stud. Sci. 2015, 33, 665–673. [Google Scholar]
- Chen, Z.; Liu, Z.; Serrato, J.C.; Xu, D. Notching R&D Investment with Corporate Income Tax Cuts in China. Am. Econ. Rev. 2021, 111, 2065–2100. [Google Scholar]
- Watkins, A.; Papaioannou, T.; Mugwagwa, J.; Kale, D. National innovation systems and the intermediary role of industry associations in building institutional capacities for innovation in developing countries: A critical review of the literature. Res. Policy 2015, 44, 1407–1418. [Google Scholar] [CrossRef]
- Xian, W.; Li, G.B. Government support, R&D management and technological innovation efficiency. Manag. World 2014, 4, 71–80. [Google Scholar]
Figure 1.
Distribution of comprehensive efficiency in different regions of China.


Table 1.
Regional innovation efficiency evaluation index system of China.
| Investment Category | Definition | Unit |
|---|---|---|
| Input | R&D expenditure of regional innovation system | 100 million yuan |
| R&D innovation system full-time equivalent personnel | 1000 person/year | |
| Science and technology appropriation of local finance | 100 million yuan | |
| Output | Amount of invention patent authorization | Items |
| The sales revenue of new products in high-tech industry | 100 million yuan | |
| Scientific and technical papers published in Chinese Journals | Number of articles | |
| The contract amount of technology introduction | 100 million yuan |
Table 2.
Average regional innovation efficiency of China from 2002 to 2016.
| DMU | TE | PE | SE | DEA Effective Years |
|---|---|---|---|---|
| Beijing | 1.000 | 1.000 | 1.000 | 15 |
| Tianjin | 0.932 | 0.944 | 0.987 | 11 |
| Hebei | 0.411 | 0.440 | 0.937 | 0 |
| Shanxi | 0.544 | 0.582 | 0.931 | 1 |
| Inner Mongolia | 0.323 | 0.391 | 0.820 | 0 |
| Liaoning | 0.556 | 0.570 | 0.974 | 0 |
| Jilin | 0.973 | 0.981 | 0.992 | 11 |
| Heilongjiang | 0.891 | 0.937 | 0.953 | 7 |
| Shanghai | 0.891 | 0.970 | 0.921 | 10 |
| Jiangsu | 0.805 | 0.848 | 0.954 | 6 |
| Zhejiang | 0.732 | 0.750 | 0.978 | 0 |
| Anhui | 0.781 | 0.842 | 0.931 | 3 |
| Fujian | 0.804 | 0.818 | 0.982 | 4 |
| Jiangxi | 0.433 | 0.503 | 0.867 | 0 |
| Shandong | 0.549 | 0.558 | 0.985 | 0 |
| Henan | 0.460 | 0.479 | 0.961 | 0 |
| Hubei | 0.837 | 0.842 | 0.992 | 6 |
| Hunan | 0.835 | 0.849 | 0.984 | 4 |
| Guangdong | 0.875 | 1.000 | 0.875 | 10 |
| Guangxi | 0.555 | 0.582 | 0.949 | 3 |
| Hainan | 0.918 | 1.000 | 0.918 | 12 |
| Chongqing | 0.806 | 0.821 | 0.971 | 9 |
| Sichuan | 0.696 | 0.716 | 0.973 | 0 |
| Guizhou | 0.678 | 0.761 | 0.902 | 1 |
| Yunnan | 0.680 | 0.790 | 0.873 | 2 |
| Shaanxi | 0.906 | 0.922 | 0.979 | 11 |
| Gansu | 0.978 | 1.000 | 0.978 | 12 |
| Qinghai | 0.334 | 0.860 | 0.419 | 0 |
| Ningxia | 0.464 | 0.747 | 0.619 | 1 |
| Xinjiang | 0.454 | 0.529 | 0.857 | 0 |
| Country | 0.972 | 1.000 | 0.972 | 3 |
| Eastern Area | 1.000 | 1.000 | 1.000 | 15 |
| Central Area | 0.974 | 0.993 | 0.981 | 11 |
| Western Area | 0.897 | 0.920 | 0.972 | 8 |
| Northeast Area | 1.000 | 1.000 | 1.000 | 15 |
Table 3.
Innovation efficiency dynamic change index of China in 2002 to 2016.
| Year | EC | PEC | SEC | TC |
|---|---|---|---|---|
| 2002 | 1.031 | 1.015 | 1.020 | 1.256 |
| 2003 | 0.986 | 0.984 | 1.004 | 1.086 |
| 2004 | 1.048 | 1.017 | 1.033 | 1.012 |
| 2005 | 1.013 | 1.012 | 1.001 | 0.973 |
| 2006 | 0.969 | 1.012 | 0.956 | 1.005 |
| 2007 | 1.022 | 0.994 | 1.029 | 1.036 |
| 2008 | 0.986 | 1.006 | 0.980 | 1.044 |
| 2009 | 1.006 | 1.021 | 0.987 | 1.049 |
| 2010 | 0.985 | 0.998 | 0.987 | 1.041 |
| 2011 | 1.015 | 1.006 | 1.010 | 1.046 |
| 2012 | 1.032 | 1.040 | 0.997 | 0.956 |
| 2013 | 1.076 | 1.033 | 1.041 | 0.953 |
| 2014 | 1.007 | 0.998 | 1.010 | 1.177 |
| 2015 | 0.991 | 0.991 | 1.000 | 1.062 |
| 2016 | 0.969 | 0.989 | 0.980 | 0.998 |
Table 4.
Regional innovation efficiency dynamic change index of China.
| Year | Region | EC | PEC | SEC | TC |
|---|---|---|---|---|---|
| 2002–2006 | Country | 1.002 | 1 | 1.002 | 1.010 |
| Eastern Area | 1 | 1 | 1 | 1 | |
| Central Area | 1 | 1 | 1 | 1.031 | |
| Western Area | 1.009 | 1.006 | 1.008 | 1.052 | |
| Northeast Area | 1 | 1 | 1 | 1.005 | |
| 2007–2011 | Country | 1.004 | 1 | 1.004 | 1.006 |
| Eastern Area | 1 | 1 | 1 | 1 | |
| Central Area | 1 | 1 | 1 | 1.009 | |
| Western Area | 1.032 | 1.025 | 1.006 | 1.015 | |
| Northeast Area | 1 | 1 | 1 | 1.008 | |
| 2012–2016 | Country | 0.996 | 1 | 0.996 | 1.018 |
| Eastern Area | 1 | 1 | 1 | 1 | |
| Central Area | 0.986 | 0.987 | 0.999 | 1.032 | |
| Western Area | 1 | 1 | 1 | 1.002 | |
| Northeast Area | 1 | 1 | 1 | 1.003 |
Table 5.
Returns to scale of regional innovation efficiency.
| Year | IRS | DRS | CRS |
|---|---|---|---|
| 2002–2006 | AH, FJ, HE, HA, JS, JX, LN, QH, SD, SN, SC, CQ | GD, GX, GZ, IN, NX, SX, XJ, YN, ZJ | BJ, GS, HI, HL, HB, HN, JL, SH, TJ |
| 2007–2011 | AH, FJ, GX, HE, HA, JX, LN, IN, NX, QH, SD, SX, SC, XJ, ZJ | GZ, YN | BJ, GS, GD, HI, HL, HB, HN, JL, JS, SN, SH, TJ, CQ |
| 2012–2016 | FJ, GZ, HE, HA, HN, JX, LN, IN, NX, QH, SD, SX, SC, XJ, YN, ZJ | HB, SH, TJ | AH, BJ, GS, GD, GX, HI, HL, JL, JS, SN, CQ |
Table 6.
Projection analysis in China.
| Province | TE | Benchmark | Province | TE | Benchmark |
|---|---|---|---|---|---|
| Beijing | 1 | 1 | Henan | 0.491 | 1(0.161) |
| Tianjin | 0.848 | 19(0.056); 22(1.232) | Hubei | 0.714 | 1(0.055); 22(0.402); 26(0.592) |
| Hebei | 0.431 | 1(0.099); 19(0.005) | Hunan | 0.762 | 1(0.066); 22(0.679); 26(0.154) |
| Shanxi | 0.439 | 1(0.061) | Guangdong | 1 | 19 |
| Inner Mongolia | 0.227 | 1(0.021); 19(0.001) | Guangxi | 1 | 20 |
| Liaoning | 0.556 | 1(0.080); 22(0.129); 26(0.406) | Hainan | 1 | 21 |
| Jilin | 1 | 7 | Chongqing | 1 | 22 |
| Heilongjiang | 1 | 8 | Sichuan | 0.868 | 1(0.163); 22(0.565); 26(0.088) |
| Shanghai | 0.713 | 1(0.348); 22(1.154) | Guizhou | 0.708 | 1(0.012); 12(0.082); 20(0.076) |
| Jiangsu | 1 | 10 | Yunnan | 0.561 | 1(0.055) |
| Zhejiang | 0.831 | 1(0.403); 12(0.409); 19(0.103) | Shaanxi | 1 | 26 |
| Anhui | 1 | 12 | Gansu | 1 | 27 |
| Fujian | 0.719 | 1(0.078); 19(0.094) | Qinghai | 0.374 | 1(0.005); 22(0.003) |
| Jiangxi | 0.488 | 22(0.305); 26(0.073) | Ningxia | 0.531 | 1(0.010); 22(0.020) |
| Shandong | 0.669 | 1(0.352); 19(0.103) | Xinjiang | 0.441 | 1(0.024) |
Reference benchmark is the sequential number of each province, such as 1 Beijing; 19 Guangdong; 22 Chongqing; 26 Shaanxi.
Table 7.
Adjustment of input and output in China.
| Province. | Input Adjustment (%) | Output Adjustment (%) | |||||
|---|---|---|---|---|---|---|---|
| Beijing | 0 | 0 | 0 | 0 | 0 | 0 | 0 |
| Tianjin | 27.839 | 9.823 | 7.926 | 51.011 | 0 | 0 | 187.661 |
| Hebei | 48.808 | 72.439 | 49.575 | 0 | 0 | 15.939 | 121.888 |
| Shanxi | 39.400 | 67.891 | 61.014 | 0 | 125.604 | 12.182 | 66.345 |
| Inner Mongolia | 71.583 | 85.474 | 74.771 | 0 | 0 | 7.507 | 76.597 |
| Liaoning | 39.285 | 29.383 | 64.552 | 0 | 20.917 | 0 | 0 |
| Jilin | 0 | 0 | 0 | 0 | 0 | 0 | 0 |
| Heilongjiang | 0 | 0 | 0 | 0 | 0 | 0 | 0 |
| Shanghai | 17.650 | 10.316 | 58.283 | 0 | 53.320 | 5.494 | 0 |
| Jiangsu | 0 | 0 | 0 | 0 | 0 | 0 | 0 |
| Zhejiang | 0 | 39.693 | 10.876 | 0 | 0 | 85.269 | 16.057 |
| Anhui | 0 | 0 | 0 | 0 | 0 | 0 | 0 |
| Fujian | 23.217 | 47.486 | 13.528 | 0 | 0 | 4.790 | 11.607 |
| Jiangxi | 42.757 | 45.467 | 65.364 | 8.478 | 0 | 0 | 586.023 |
| Shandong | 43.141 | 51.460 | 4.762 | 0 | 0 | 52.253 | 106.627 |
| Henan | 34.129 | 74.295 | 44.136 | 0 | 67.647 | 32.022 | 668.869 |
| Hubei | 17.777 | 32.003 | 35.925 | 0 | 0 | 0 | 67.606 |
| Hunan | 11.442 | 36.380 | 23.475 | 0 | 0 | 0 | 544.294 |
| Guangdong | 0 | 0 | 0 | 0 | 0 | 0 | 0 |
| Guangxi | 0 | 0 | 0 | 0 | 0 | 0 | 0 |
| Hainan | 0 | 0 | 0 | 0 | 0 | 0 | 0 |
| Chongqing | 0 | 0 | 0 | 0 | 0 | 0 | 0 |
| Sichuan | 10.107 | 29.414 | 0 | 0 | 0 | 8.620 | 389.074 |
| Guizhou | 0 | 29.209 | 58.538 | 0 | 0 | 48.974 | 6.571 |
| Yunnan | 2.923 | 59.549 | 69.139 | 0 | 109.933 | 7.245 | 615.325 |
| Shaanxi | 0 | 0 | 0 | 0 | 0 | 0 | 0 |
| Gansu | 0 | 0 | 0 | 0 | 0 | 0 | 0 |
| Qinghai | 38.257 | 68.456 | 81.001 | 0 | 81.510 | 46.035 | 0 |
| Ningxia | 11.236 | 58.735 | 70.641 | 0 | 31.098 | 149.175 | 0 |
| Xinjiang | 19.081 | 64.060 | 84.662 | 0 | 305.339 | 0.154 | 57.558 |
Table 8.
Definitions of the influence factor variables.
| Variable Symbol | Variable Name | Definition | Unit |
|---|---|---|---|
| Gov | Government funding | Government funding in internal R&D expenditure | 100 million yuan |
| Pri | Enterprise funding | Enterprise funding in internal R&D expenditure | 100 million yuan |
| Tax | Tax relief | Government’s additional deduction policy | 100 million yuan |
| Inf | Regional infrastructure | Business total of posts and telecommunications/GDP | % |
| GDP | Regional economic development level | Total GDP | 100 million yuan |
| H | Talent number and intensity | R&D person/Enterprises number | Person/quantity |
| High-tech | Enterprise technology scale | High-tech industry main business income/Enterprises number | 100 million yuan/quantity |
| Chance | Technology chance | R&D expenditure/High-tech industry main business income | % |
Table 9.
Regression results of the random effects model.
| Variable Symbol | Model (1) | Model (2) | Model (3) |
|---|---|---|---|
| Gov | 0.154 *** (0.058) | 0.132 ** (0.060) | 0.132 ** (0.060) |
| Pri | −0.024 (0.053) | −0.187 *** (0.059) | −0.169 *** (0.062) |
| Tax | −0.027 | −0.020 | |
| (0.025) | (0.024) | ||
| Inf | −0.003 | −0.003 | |
| (0.002) | (0.002) | ||
| GDP | 0.236 ** | 0.241 ** | |
| (0.105) | (0.106) | ||
| H | −0.256 *** | −0.251 *** | |
| (0.054) | (0.055) | ||
| High−tech | 0.153 *** | 0.153 *** | |
| (0.043) | (0.043) | ||
| Chance | 0.002 *** | 0.002 *** | |
| (0.001) | (0.001) | ||
| _cons | −0.761 *** | −0.718 | −0.842 |
| (0.152) | (0.826) | (0.841) | |
| sigma_u | 0.296 *** | 0.289 *** | 0.290 *** |
| (0.042) | (0.042) | (0.042) | |
| sigma_e | 0.159 *** | 0.147 *** | 0.146 *** |
| (0.008) | (0.007) | (0.007) | |
| AIC | −88.730 | −116.100 | −114.800 |
| BIC | −67.840 | −81.320 | −76.530 |
| Observations | 240 | 240 | 240 |
*** Significant at 1% level; ** significant at 5% level.
Table 10.
Regression results in R&D fiscal policy sustainability of the random effects model.
| Variable Symbol | Model (4) | Model (5) | Model (6) |
|---|---|---|---|
| Gov | 0.264 *** | 0.308 *** | 0.270 *** |
| (0.057) | (0.060) | (0.063) | |
| Pri | −0.260 *** | −0.320 *** | −0.409 *** |
| (0.066) | (0.074) | (0.084) | |
| Tax | 0.0129 | −0.026 | −0.007 |
| (0.024) | (0.024) | (0.024) | |
| Inf | −0.009 *** | −0.009 *** | −0.006 ** |
| (0.002) | (0.003) | (0.003) | |
| GDP | 0.142 | 0.228 * | 0.397 *** |
| (0.108) | (0.119) | (0.137) | |
| H | −0.300 *** | −0.236 *** | −0.144 ** |
| (0.059) | (0.064) | (0.069) | |
| High−tech | 0.098 ** | 0.078 | 0.043 |
| (0.043) | (0.051) | (0.054) | |
| Chance | 0.001 ** | 0.001 | −0.000 |
| (0.001) | (0.001) | (0.001) | |
| _cons | 0.296 | −0.517 | −1.880 * |
| (0.867) | (0.927) | (1.041) | |
| sigma_u | 0.273 *** | 0.277 *** | 0.302 *** |
| (0.037) | (0.038) | (0.043) | |
| sigma_e | 0.135 *** | 0.130 *** | 0.117 *** |
| (0.007) | (0.008) | (0.008) | |
| AIC | −122.300 | −101.700 | −89.590 |
| BIC | −85.460 | −66.620 | −56.480 |
| Observations | 210 | 180 | 150 |
*** Significant at 1% level; ** significant at 5% level; * significant at 10% level.
Table 11.
Regression results in China for four regions of the random effects model.
| Variable Symbol | Model (7) | Model (8) | Model (9) | Model (10) |
|---|---|---|---|---|
| Gov | 0.223 *** | 0.339 *** | 0.300 ** | −0.439 *** |
| (0.087) | (0.120) | (0.127) | (0.123) | |
| pri | 0.112 | 0.436 *** | −0.471 *** | −0.598 *** |
| (0.092) | (0.148) | (0.120) | (0.146) | |
| Tax | 0.024 | −0.164 *** | 0.039 | 0.026 *** |
| (0.049) | (0.051) | (0.043) | (0.021) | |
| Inf | −0.129 *** | −0.070 | −0.001 | 0.121 ** |
| (0.060) | (0.059) | (0.004) | (0.048) | |
| GDP | −0.407 *** | −0.423 * | 0.409 ** | 0.222 |
| (0.148) | (0.250) | (0.205) | (0.224) | |
| H | 0.246 | 0.504 ** | −0.155 | −0.663 *** |
| (0.244) | (0.211) | (0.111) | (0.214) | |
| High−tech | −0.587 ** | −0.760 *** | 0.335 *** | 0.966 *** |
| (0.246) | (0.224) | (0.063) | (0.256) | |
| Chance | −0.636 *** | −0.593** | 0.002 *** | 0.837 *** |
| (0.246) | (0.253) | (0.001) | (0.238) | |
| _cons | 3.008 *** | −0.076 | −2.174 | 2.231 * |
| (1.094) | (1.918) | (1.613) | (1.140) | |
| sigma_u | 0.132 *** | 0.153 *** | 0.348 *** | 0.000 |
| (0.048) | (0.052) | (0.083) | (0.010) | |
| sigma_e | 0.136 *** | 0.089 *** | 0.154 *** | 0.049 *** |
| (0.011) | (0.010) | (0.013) | (0.007) | |
| AIC | −107.380 | −120.400 | −88.290 | −93.100 |
| BIC | −74.230 | −81.860 | −58.200 | −63.330 |
| Observations | 240 | 240 | 240 | 240 |
*** Significant at 1% level; ** significant at 5% level; * significant at 10% level.
Table 12.
Regression results of tax instrument variables.
| Variable Symbol | Model (11) |
|---|---|
| Gov | 0.158 ** (0.069) |
| Pri | −0.149 ** (0.066) |
| eTax | −0.081 |
| (0.160) | |
| _cons | −0.808 |
| (0.820) | |
| control variable | YES |
| sigma_u | 0.279 *** |
| (0.042) | |
| sigma_e | 0.150 *** |
| (0.007) | |
| AIC | −108.200 |
| BIC | −73.390 |
| Observations | 240 |
*** Significant at 1% level; ** significant at 5% level. To save space, the control variable coefficient report is omitted.
Publisher’s Note: MDPI stays neutral with regard to jurisdictional claims in published maps and institutional affiliations. |
© 2021 by the authors. Licensee MDPI, Basel, Switzerland. This article is an open access article distributed under the terms and conditions of the Creative Commons Attribution (CC BY) license (https://creativecommons.org/licenses/by/4.0/).
Share and Cite
MDPI and ACS Style
Liu, W.; Bai, Y. An Analysis on the Influence of R&D Fiscal and Tax Subsidies on Regional Innovation Efficiency: Empirical Evidence from China. Sustainability 2021, 13, 12707. https://doi.org/10.3390/su132212707
AMA Style
Liu W, Bai Y. An Analysis on the Influence of R&D Fiscal and Tax Subsidies on Regional Innovation Efficiency: Empirical Evidence from China. Sustainability. 2021; 13(22):12707. https://doi.org/10.3390/su132212707
Chicago/Turabian StyleLiu, Weijiang, and Yue Bai. 2021. "An Analysis on the Influence of R&D Fiscal and Tax Subsidies on Regional Innovation Efficiency: Empirical Evidence from China" Sustainability 13, no. 22: 12707. https://doi.org/10.3390/su132212707
Note that from the first issue of 2016, this journal uses article numbers instead of page numbers. See further details here.