
Demand Forecasting of E-Commerce Enterprises Based on Horizontal Federated Learning from the Perspective of Sustainable Development


Abstract
:1. Introduction
- Aiming at the shortcomings of traditional RNN and LSTM demand forecasting models that cannot handle the problem of multiple feature sequences, we propose a demand forecasting model based on ConvLSTM. It can extend the one-dimensional input LSTM to a multi-dimensional input model. Through the expansion of FC-LSTM, a convolution structure is added during state transition, such that the network can capture the spatial characteristics of the data while dealing with timing issues.
- According to the problem of centralized machine learning modeling, regarding the inability to directly share and exchange demand forecast-related data between e-commerce enterprises, we introduce the framework of Federated Learning, such that e-commerce companies of the same type can indirectly achieve the goal of demand information sharing modeling through Horizontal Federated Learning, under the premise that private data is not available locally, thus avoiding the leakage of private data.
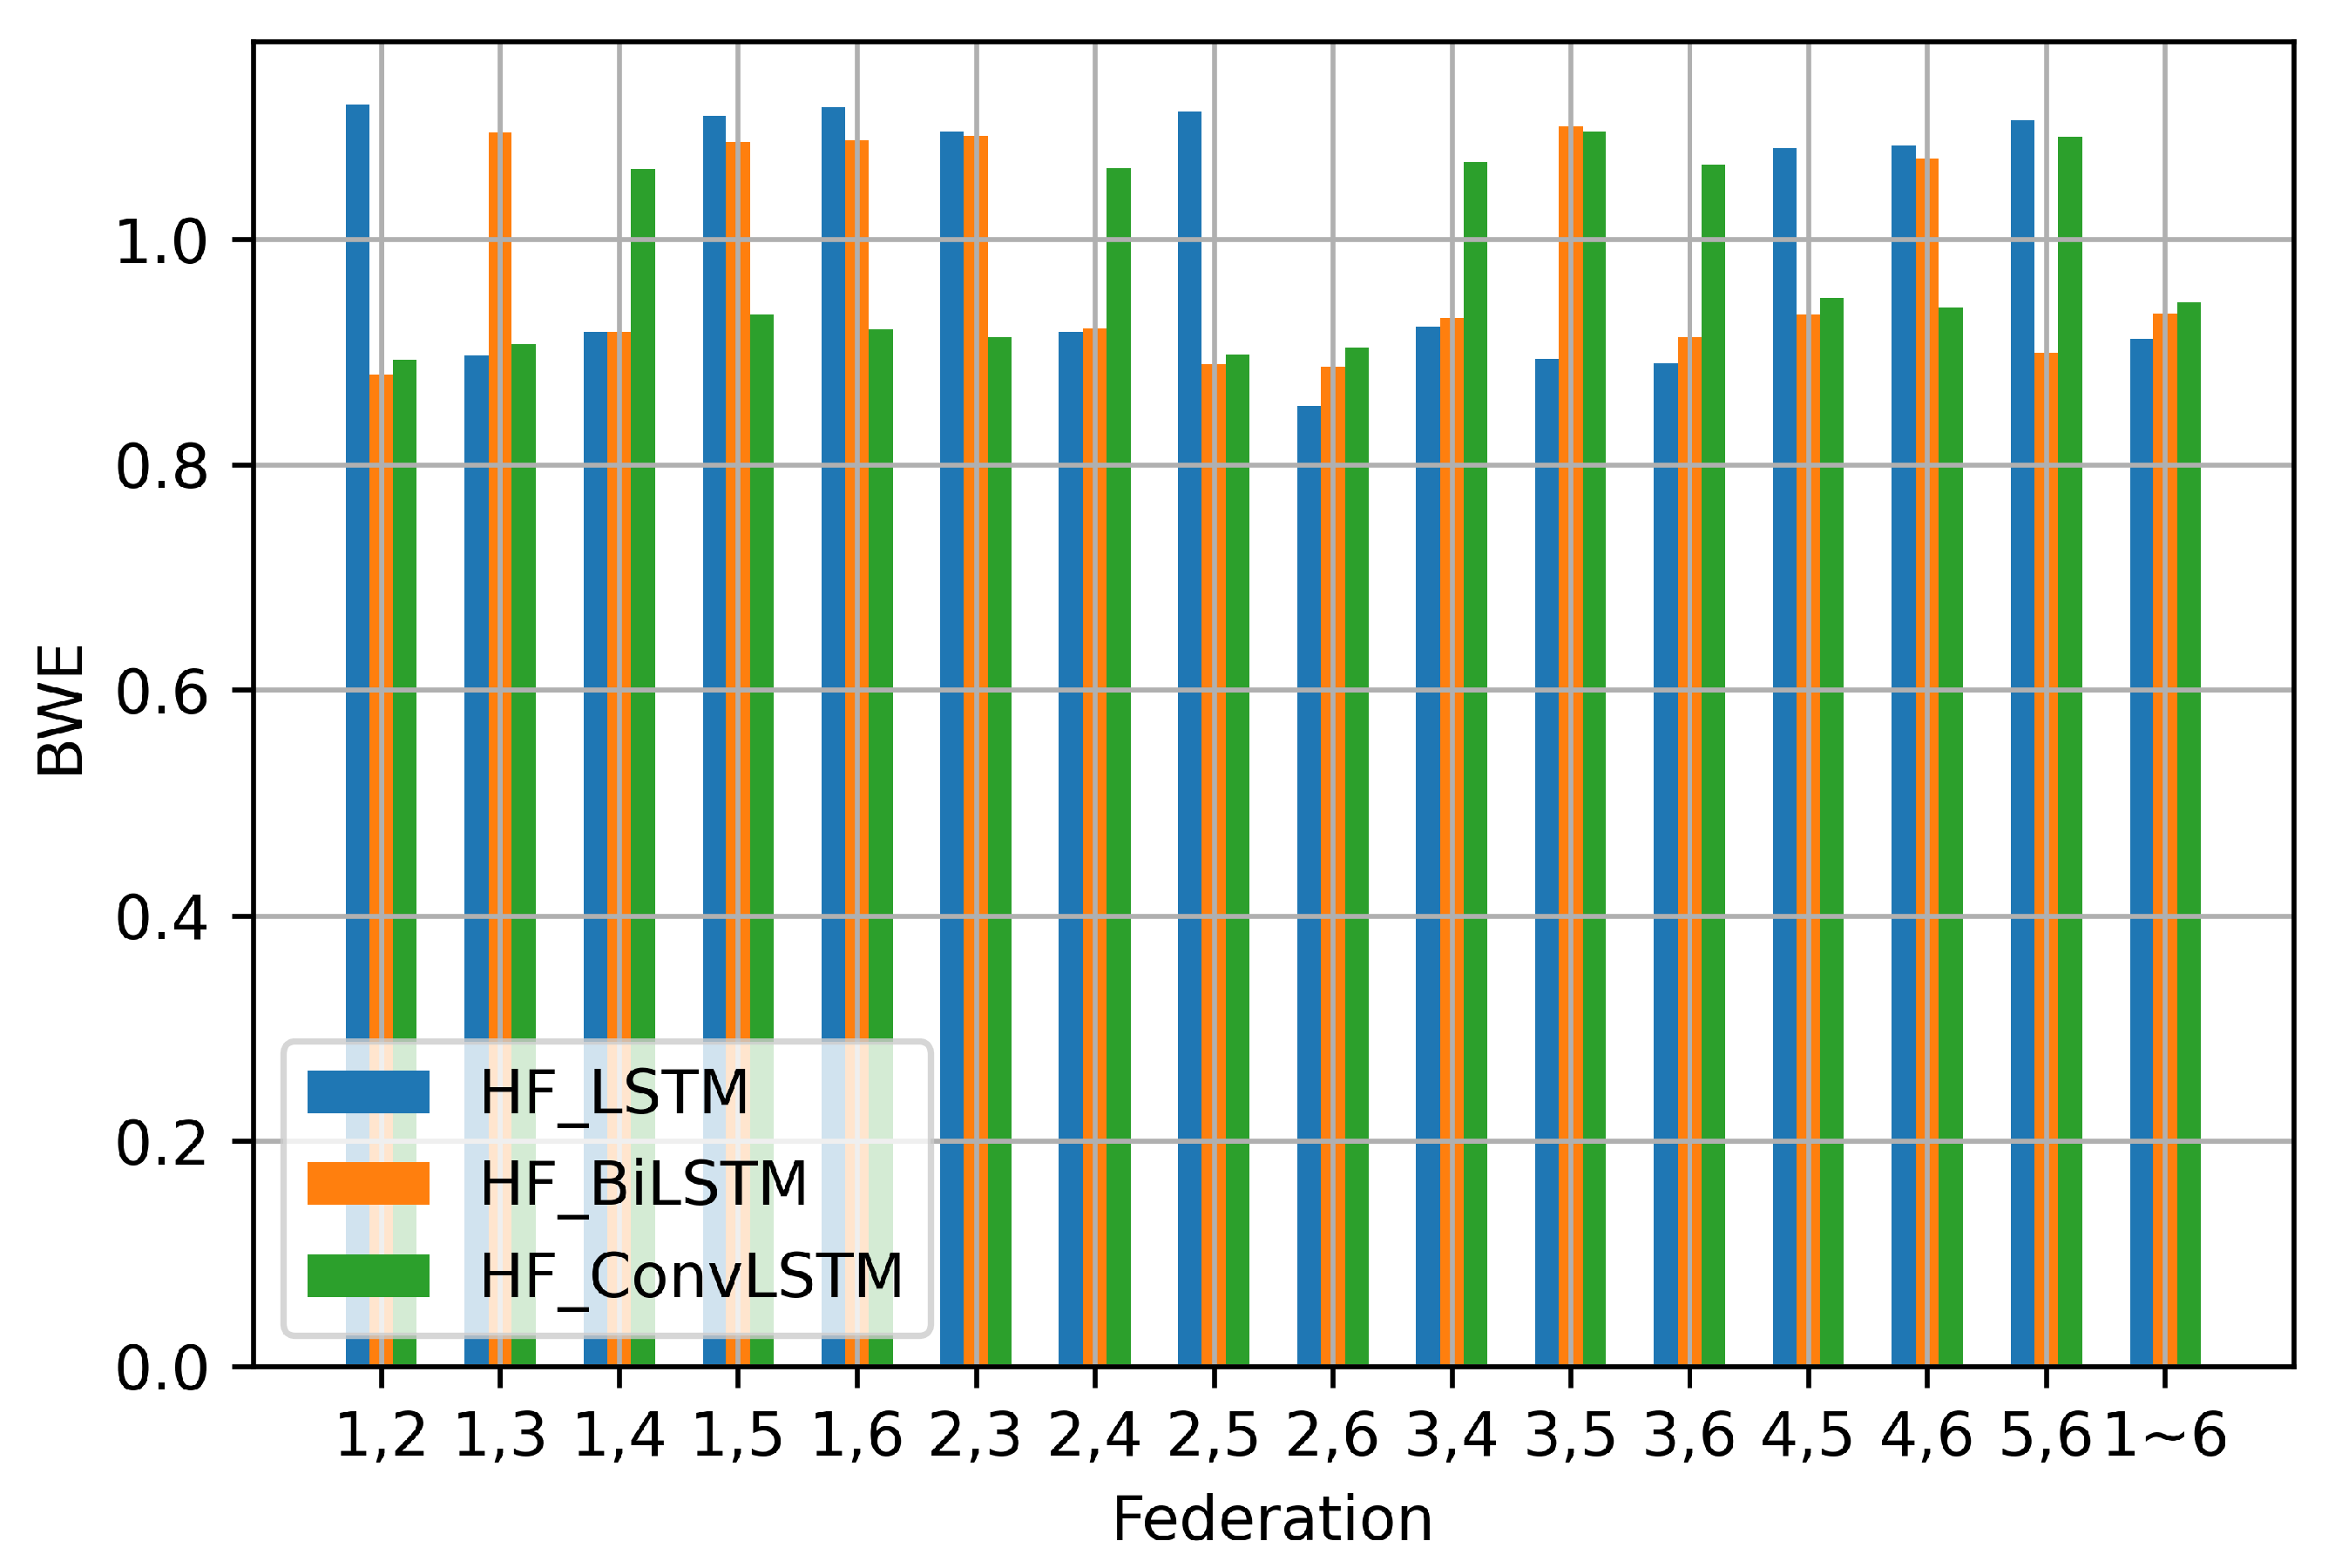
- Experimental results on a large number of real data sets show that, compared with benchmark experiments, our proposed method improves the accuracy of the e-commerce enterprise demand prediction model while avoiding the leakage of private data, and the bullwhip effect value is even greater—close to the target value of 1—effectively alleviating the bullwhip effect of the entire supply chain system on demand forecasting.
2. Literature Review
2.1. Federated Learning
2.2. E-commerce Enterprise Demand Forecasting
2.3. LSTM
3. Method and Results
3.1. Preliminary Knowledge and Definition
3.1.1. Typical Horizontal Federated Learning
3.1.2. Neural Network Based on Time-Series
3.2. Design of E-Commerce Enterprise Demand Forecasting Method Based on HF-ConvLSTM
3.2.1. E-Commerce Enterprise Demand Forecasting Model Based on ConvLSTM
3.2.2. E-Commerce Enterprise Demand Forecasting Model Based on HF-ConvLSTM
| Algorithm 1 Back-Propagation of ConvLSTM based on Federated Averaging. |
|
3.3. Experimental Design and Analysis
3.3.1. Data Set
3.3.2. Data Pre-Processing and Data Set Segmentation
3.3.3. Comparison of Algorithms
3.3.4. Evaluation Index
3.3.5. Experimental Setup
3.3.6. Display and Analysis of Experimental Results
4. Conclusions
Author Contributions
Funding
Conflicts of Interest
References
- Oniszczuk-Jastrząbek, A.; Czermański, E.; Cirella, G.T. Sustainable Supply Chain of Enterprises: Value Analysis. Sustainability 2020, 12, 419. [Google Scholar] [CrossRef] [Green Version]
- Papaioannou, G.; Sarakinos, I. The General Data Protection Regulation (GDPR, 2016/679/EE) and the (Big) Personal Data in Cultural Institutions: Thoughts on the GDPR Compliance Process; Springer: Cham, Switzerland, 2018. [Google Scholar]
- Kairouz, P.; McMahan, H.B.; Avent, B.; Bellet, A.; Bennis, M.; Bhagoji, A.N.; Bonawitz, K.; Charles, Z.; Cormode, G.; Cummings, R.; et al. Advances and open problems in federated learning. Found. Trends Mach. Learn. 2021, 14, 1–210. [Google Scholar] [CrossRef]
- Nitish, S.; Elman, M.; Ruslan, S. Unsupervised learning of video representations using lstms. In Proceedings of the 32nd International Conference on Machine Learning, Lille, France, 7–9 July 2015; pp. 843–852. [Google Scholar]
- Konečný, J.; McMahan, H.B.; Ramage, D.; Richtárik, P. Federated Optimization: Distributed Machine Learning for on-device Intelligence. arXiv 2016, arXiv:1610.02527. [Google Scholar]
- Yang, Q.; Liu, Y.; Chen, T.; Tong, Y. Federated machine learning: Concept and applications. ACM Trans. Intell. Syst. Technol. 2019, 10, 1–19. [Google Scholar] [CrossRef]
- Reza, S.; Vitaly, S. Privacy-Preserving Deep Learning. In Proceedings of the 22nd ACM SIGSAC Conference on Computer and Communications Security, Denver, CO, USA, 12–16 October 2015; pp. 1310–1321. [Google Scholar]
- Mcmahan, H.B.; Moore, E.; Ramage, D.; Hampson, S.; Arcas, B.A. Communication-efficient learning of deep networks from decentralized data. In Proceedings of the 20th International Conference on Artificial Intelligence and Statistics, Lauderdale, FL, USA, 20–22 April 2017; pp. 1273–1282. [Google Scholar]
- Kallista, A.B.; Vladimir, I.; Kreuter, B.; Marcedone, A.; Mcmahan, H.B.; Patel, S.; Ramage, D.; Aaron, S.; Karn, S. Practical secure aggregation for privacy-preserving machine learning. In Proceedings of the 2017 ACM SIGSAC Conference on Computer and Communications Security, Dallas, TX, USA, 30 October–3 November 2017; pp. 1175–1191. [Google Scholar]
- Yoshinori, A.; Takuya, H.; Wang, L.; Moriai, S. Privacy-preserving deep learning via additively homomorphic encryption. IEEE Trans. Inf. Forensics Secur. 2017, 13, 1333–1345. [Google Scholar]
- Virginia, S.; Chao-Kai, C.; Maziar, S.; Ameet, S.T. Federated Multi-Task Learning. In Proceedings of the Annual Conference on Neural Information Processing Systems 2017, Long Beach, CA, USA, 4–9 December 2017; pp. 4424–4434. [Google Scholar]
- Mcmahan, H.B.; Moore, E.; Ramage, D.; Arcas, B. Federated Learning of Deep Networks using Model. arXiv 2016, arXiv:1602.05629. [Google Scholar]
- Lin, Y.; Han, S.; Mao, H.; Wang, Y.; Dally, W.J. Deep gradient compression: Reducing the communication bandwidth for distributed training. In Proceedings of the ICLR, Vancouver, BC, Canada, 30 April–3 May 2018. [Google Scholar]
- Zhao, B.; Liu, X.; Chen, W. When Crowdsensing Meets Federated Learning: Privacy-Preserving Mobile Crowdsensing System. arXiv 2021, arXiv:2102.10109. [Google Scholar]
- Mohassel, P.; Zhang, Y. SecureML: A System for Scalable Privacy-Preserving Machine Learning. IEEE Symp. Secur. Privacy 2017, 19–38. [Google Scholar]
- Gao, D.; Liu, Y.; Huang, A.; Ju, C.; Yu, H.; Yang, Q. Privacy-preserving Heterogeneous Federated Transfer Learning. In Proceedings of the 2019 IEEE International Conference on Big Data (Big Data), Los Angeles, CA, USA, 9–12 December 2019; pp. 2552–2559. [Google Scholar]
- Zhao, Y.; Zhao, J.; Jiang, L.; Tan, R.; Niyato, D.; Li, Z.; Liu, Y. Privacy-Preserving Blockchain-Based Federated Learning for IoT Devices. IEEE Internet Things J. 2021, 8, 1817–1829. [Google Scholar] [CrossRef]
- Cong, M.; Yu, H.; Weng, X.; Yiu, S.M. A Game-Theoretic Framework for Incentive Mechanism Design in Federated Learning. In Federated Learning; Springer: Berlin/Heidelberg, Germany, 2020; Volume 12500, pp. 205–222. [Google Scholar]
- Wei, S.; Tong, Y.; Zhou, Z.; Song, T. Efficient and Fair Data Valuation for Horizontal Federated Learning. In Federated Learning; Springer: Berlin/Heidelberg, Germany, 2020; Volume 12500, pp. 139–152. [Google Scholar]
- Kim, S. Incentive Design and Differential Privacy Based Federated Learning: A Mechanism Design Perspective. IEEE Access 2020, 8, 187317–187325. [Google Scholar] [CrossRef]
- Zhan, Y.; Zhang, J.; Hong, Z.; Wu, L.; Guo, S. A Survey of Incentive Mechanism Design for Federated Learning. IEEE Trans. Emerg. Top. Comput. 2021, 99, 1. [Google Scholar] [CrossRef]
- Alberternst, S.; Anisimov, A.; Andre, A.; Benjamin, D.; Hilko, H.; Michael, M.; Muhammad, M.; Daniel, S.; Ingo, Z. Orchestrating Heterogeneous Devices and AI Services as Virtual Sensors for Secure Cloud-Based IoT Applications. Sensors 2021, 21, 7509. [Google Scholar] [CrossRef]
- Huang, W.; Yang, Y.; Chen, M.; Liu, C.; Feng, C.; Vincent, H.P. Wireless Network Optimization for Federated Learning with Model Compression in Hybrid VLC/RF Systems. Entropy 2021, 23, 1413. [Google Scholar] [CrossRef]
- Vasiliki, K.; Vasileios, A.; Thomas, L.; George, F.; Elisavet, G.; Panagiotis, S. IDS for Industrial Applications: A Federated Learning Approach with Active Personalization. Sensors 2021, 21, 6743. [Google Scholar]
- Venkataramanan, K.; Kaza, S.; Annaswamy, A.M. DER Forecast using Privacy Preserving Federated Learning. arXiv 2021, arXiv:2107.03248. [Google Scholar]
- Romano, F.; Benedetta, P. Federated learning framework for mobile edge computing network. Trans. Intell. Technol. 2020, 5, 15–21. [Google Scholar]
- Alexander, L.B.; Michael, P.P.; Nicholas, J.W. Domain Adaptation and Federated Learning for Ultrasonic Monitoring of Beer Fermentation. Fermentation 2021, 7, 253. [Google Scholar]
- Li, S.; Lv, L.; Li, X.; Ding, Z. Mobile App Start-Up Prediction Based on Federated Learning and Attributed Heterogeneous Network Embedding. Future Internet. 2021, 13, 256. [Google Scholar] [CrossRef]
- Eoin, B.; Maarten, D.V.; Geraldine, B.B.; Toms, W. Estimation of Continuous Blood Pressure from PPG via a Federated Learning Approach. Sensors 2021, 21, 6311. [Google Scholar]
- Moustris, K.P.; Nastos, P.T.; Larissi, I.K. Application of Multiple Linear Regression Models and Artificial Neural Networks on the Surface Ozone Forecast in the Greater Athens Area, Greece. Adv. Meteorol. 2012, 2012, 978–988. [Google Scholar] [CrossRef]
- Fang, Y.; Wang, X.; Yan, J. Green Product Pricing and Order Strategies in a Supply Chain under Demand Forecasting. Sustainability 2020, 12, 713. [Google Scholar] [CrossRef] [Green Version]
- Gardner, J.E.S. Exponential smoothing: The state of the art-Part II. Int. J. Forecast. 2006, 22, 637–666. [Google Scholar] [CrossRef]
- Li, J.; Chen, W. Forecasting Macroeconomics Time Series: LASSO-based Approaches and Their Forecast Combinations with Dynamic Factor Models. Int. J. Forecast. 2014, 30, 996–1015. [Google Scholar] [CrossRef]
- Firmino, P.; Neto, P.; Ferreira, T. Correcting and combining time series forecasters. Neural Netw. 2014, 50, 1–11. [Google Scholar] [CrossRef] [PubMed]
- Büyükşahin, Ü.Ç.; Şeyda, E. Improving forecasting accuracy of time series data using a new ARIMA-ANN hybrid method and empirical mode decomposition. Neurocomputing 2019, 361, 151–163. [Google Scholar] [CrossRef] [Green Version]
- Novri, S.; Suhartono; Dedy, D.P.; Baharuddin, A. Roll motion prediction using a hybrid deep learning and ARIMA model. Procedia Comput. Sci. 2018, 144, 251–258. [Google Scholar]
- Huang, Z.; Lei, D.; Han, Z.; Zhang, P. Boundary Moving Least Square method for numerical evaluation of two-dimensional elastic membrane and plate dynamics problems. Eng. Anal. Bound. Elem. 2019, 108, 41–48. [Google Scholar] [CrossRef]
- Luo, X.M.; Li, J.B.; Peng, H.U.; Management, S.O. E-commerce Inventory Optimization Strategy Based on Time Series Forecasting. Syst. Eng. 2014, 32, 91–98. [Google Scholar]
- Lu, W.; Chen, X.; Pedrycz, W.; Liu, X.; Yang, J. Using interval information granules to improve forecasting in fuzzy time series. Int. J. Approx. Reason. 2015, 57, 1–258. [Google Scholar] [CrossRef]
- Kittichotsatsawat, Y.; Jangkrajarng, V.; Tippayawong, K.Y. Enhancing Coffee Supply Chain towards Sustainable Growth with Big Data and Modern Agricultural Technologies. Sustainability 2021, 13, 4593. [Google Scholar] [CrossRef]
- Choi, A.; Wang, R.; Darwiche, A. On the relative expressiveness of Bayesian and neural networks. Int. J. Approx. Reason. 2019, 113, 303–323. [Google Scholar] [CrossRef] [Green Version]
- Zhang, G.; Li, G.; Peng, J. Risk Assessment and Monitoring of Green Logistics for Fresh Produce Based on a Support Vector Machine. Sustainability 2020, 12, 7569. [Google Scholar] [CrossRef]
- Zhang, G. Study of Logistics Demand Forecast based on Grey-Markov Model. Math. Pract. Theory 2011, 41, 17–21. [Google Scholar]
- Wang, Z.X.; Li, Q.; Pei, L.L. A seasonal GM(1,1) model for forecasting the electricity consumption of the primary economic sectors. Energy. 2018, 154, 533–534. [Google Scholar] [CrossRef]
- Hu, Y.C. A genetic-algorithm-based remnant grey prediction model for energy demand forecasting. PLoS ONE 2017, 12, e0185478. [Google Scholar]
- Liu, Y.; Ju, W.; Zhao, J.; Gao, J.; Zheng, J.; Jiang, A. Product life cycle based demand forecasting by using artificial bee colony algorithm optimized two-stage polynomial fitting. J. Intell. Fuzzy Syst. 2016, 31, 825–836. [Google Scholar]
- Adamowski, J.F. Peak Daily Water Demand Forecast Modeling Using Artificial Neural Networks. J. Water Resour. Plan. Manag. 2008, 134, 119–128. [Google Scholar] [CrossRef] [Green Version]
- Wang, G. Research On Supply Chain Demand Prediction Based On BP Neural Network Algorithm. Inmateh-Agric. Eng. 2013, 40, 27–34. [Google Scholar]
- Noori, R. Uncertainty analysis of support vector machine for online prediction of five-day biochemical oxygen demand. J. Hydrol. 2015, 527, 833–843. [Google Scholar] [CrossRef]
- Cao, J.; Jiang, Z.; Wangk, K. Customer demand prediction of service-oriented manufacturing using the least square support vector machine optimized by ppaper swarm optimization algorithm. Eng. Optim. 2017, 49, 1197–1210. [Google Scholar] [CrossRef]
- Chalmeta, R.; Barqueros-Muoz, J.E. Using Big Data for Sustainability in Supply Chain Management. Sustainability 2021, 13, 7004. [Google Scholar] [CrossRef]
- Guo, F.; Diao, J.; Zhao, Q.; Wang, D.; Sun, Q. A Double-level Combination Approach for Demand Forecasting of Repairable Airplane Spare Parts Based on Turnover Data. Comput. Ind. Eng. 2021, 110, 92–108. [Google Scholar] [CrossRef]
- Thomas, S.N.G.; Cheung, S.O.; Skitmore, M.; Wong, T.C.Y. An integrated regression analysis and time series model for construction tender price index forecasting. Constr. Manag. Econ. 2004, 22, 483–493. [Google Scholar]
- Chen, B.; Maung, K. Time-varying Forecast Combination for High-Dimensional Data. arXiv 2020, arXiv:2010.10435. [Google Scholar]
- Franses, P.H. Simple Bayesian Forecast Combination. Ann. Financ. Econ. 2020, 15, 2050016. [Google Scholar] [CrossRef]
- Cerqueira, V.; Torgo, L.; Soares, C.; Bifet, A. Model Compression for Dynamic Forecast Combination. arXiv 2021, arXiv:2104.01830. [Google Scholar]
- Chen, W.; Xu, H.; Chen, Z.; Jiang, M. A novel method for time series prediction based on error decomposition and nonlinear combination of forecasters. Neurocomputing 2020, 426, 85–103. [Google Scholar] [CrossRef]
- Choi, E.; Cho, S.; Kim, D.K. Power demand forecasting using long short-term memory (lstm) deep-learning model for monitoring energy sustainability. Sustainability 2020, 12, 1109. [Google Scholar] [CrossRef] [Green Version]
- Goyal, A.; Kumar, R.; Kulkarni, S.; Krishnamurthy, S.; Vartak, M. A Solution to Forecast Demand Using Long Short-Term Memory Recurrent Neural Networks for Time Series Forecasting. In Proceedings of the Midwest Decision Sciences Institute Conference, Indianapolis, IN, USA, 12–14 April 2018. [Google Scholar]
- Greff, K.; Srivastava, R.K.; Koutník, J.; Steunebrink, B.R.; Schmidhuber, J. LSTM: A Search Space Odyssey. IEEE Trans. Neural Netw. Learn. Syst. 2016, 2016 28, 2222–2232. [Google Scholar] [CrossRef] [Green Version]
- Bandara, K.; Bergmeir, C.; Hewamalage, H. LSTM-MSNet: Leveraging Forecasts on Sets of Related Time Series with Multiple Seasonal Patterns. IEEE Trans. Neural Netw. Learn. Syst. 2020, 32, 1586–1599. [Google Scholar] [CrossRef] [Green Version]
- Xu, J.; Cooke, F.L.; Gen, M.; Ahmed, S.E. Stock Price Forecast Based on Lstm Neural Network. In Proceedings of the Twelfth International Conference on Management Science and Engineering Management, Ontario, ON, Canada, 5–8 August 2019; pp. 139–152. [Google Scholar]
- Chimmula, V.; Zhang, L. Time series forecasting of COVID-19 transmission in Canada using LSTM networks. Chaos Solitons Fractals 2020, 135, 109864. [Google Scholar] [CrossRef]
- Abbasimehr, H.; Shabani, M.; Yousefi, M. An optimized model using LSTM network for demand forecasting. Comput. Ind. Eng. 2020, 143, 106435. [Google Scholar] [CrossRef]
- Lu, X.; Ma, C.; Qiao, Y. Short-term demand forecasting for online car-hailing using ConvLSTM networks. Phys. A Stat. Mech. Its Appl. 2021, 570, 125838. [Google Scholar] [CrossRef]
- Agga, A.; Abbou, A.; Labbadi, M.; Houm, Y.E. Short-Term Self Consumption PV Plant Power Production Forecasts Based on Hybrid CNN-LSTM, ConvLSTM Models. Renew. Energy 2021, 177, 101–112. [Google Scholar] [CrossRef]
- Nistor, S.C.; Moca, M.; Nistor, R.L. Discovering novel memory cell designs for sentiment analysis on tweets. Genet. Program. Evolvable Mach. 2020, 22, 147–187. [Google Scholar] [CrossRef]
- Cho, K.; Merrienboer, B.V.; Gulcehre, C.; Ba Hdanau, D.; Bougares, F.; Schwenk, H. Learning phrase representations using rnn encoder-decoder for statistical machine translation. In Proceedings of the EMNLP2014, Doha, Qatar, 25–29 October 2014; pp. 1724–1734. [Google Scholar]
- Lipton, Z.C.; Berkowitz, J.; Elkan, C. A critical review of recurrent neural networks for sequence learning. arXiv 2015, arXiv:1506.00019. [Google Scholar]
- Bayer, J.; Wierstra, D.; Togelius, J.; Schmidhuber, J. Evolving memory cell structures for sequence learning. In Proceedings of the Artificial Neural Networks—ICANN 2009, Limassol, Cyprus, 14–17 September 2009; pp. 755–764. [Google Scholar]
- Leiva-Aravena, E.; Leiva, E.; Zamorano, V.; Rojas, C.; Regan, J.M.; Vargas, I.T. Organotrophic acid-tolerant microorganisms enriched from an acid mine drainage affected environment as inoculum for microbial fuel cells. Sci. Total Environ. 2019, 678, 639–646. [Google Scholar] [CrossRef] [PubMed]


| Symbol | Meaning |
|---|---|
| k | Participant Index |
| Data set owned by participants | |
| Participant k’s local model in round t | |
| Global model for round t | |
| Global model for round t+1 | |
| The gradient change of participant k in round t | |
| The gradient change of the global model in the t round | |
| The neuron of the dimension in the time step for the layer | |
| The state of the dimension in the time step for the layer | |
| F;I;G;O | Forget gate; Input gate; quasi-unit state; Output gate |
| Weight coefficient along the direction of the network layer | |
| Weight coefficient along the time step | |
| ⊗ | Multiply by element |
| ⊕ | Add by element |
| Sigmoid activation function | |
| tanh | Hyperbolic tangent activation function |
| Symbol | Meaning |
|---|---|
| Description | |
| SKU unique identification code | |
| First-level category | |
| Second-level category | |
| Three-level category | |
| Brand code | |
| Attribute code | |
| Attribute value | |
| Warehouse code | |
| Date | Date |
| Sales | |
| Inventory status at the end of the day | |
| Price of the day (0–1) | |
| Sales discount (0–10) | |
| Promotion form code |
| Date | vendibility | discount |
| Participants (k) | 1 | 2 | 3 | 4 | 5 | 6 |
|---|---|---|---|---|---|---|
| 0 | 1 | 2 | 3 | 4 | 5 | |
| The amount of data | 433,315 | 424,875 | 423,169 | 416,310 | 279,957 | 149,859 |
| Number of types of | 1000 | 998 | 996 | 996 | 994 | 989 |
| Participant | LSTM | BiLSTM | ConvLSTM |
|---|---|---|---|
| 1 | 2425.65 | 2088.26 | 2028.26 |
| 2 | 3213.35 | 2476.14 | 2022.91 |
| 3 | 3147.89 | 3063.81 | 3021.43 |
| 4 | 3088.95 | 2721.45 | 2519.63 |
| 5 | 3256.61 | 2880.67 | 2647.27 |
| 6 | 3101.05 | 2905.18 | 2853.63 |
| Participant | LSTM | BiLSTM | ConvLSTM |
|---|---|---|---|
| 1 | 0.2886 | 0.2173 | 0.2076 |
| 2 | 0.2879 | 0.2767 | 0.2476 |
| 3 | 0.2793 | 0.2749 | 0.2634 |
| 4 | 0.2682 | 0.2368 | 0.2363 |
| 5 | 0.1381 | 0.1348 | 0.1026 |
| 6 | 0.0923 | 0.0737 | 0.0558 |
| Participant | LSTM | BiLSTM | ConvLSTM |
|---|---|---|---|
| 1 | 1.1391 | 0.8667 | 0.8819 |
| 2 | 0.7206 | 1.2149 | 0.8096 |
| 3 | 0.8725 | 1.1185 | 0.9058 |
| 4 | 0.9047 | 1.0947 | 1.0847 |
| 5 | 0.8672 | 0.8847 | 1.1153 |
| 6 | 1.1557 | 0.8479 | 1.1327 |
| Participant | HF-LSTM | HF-BiLSTM | HF-ConvLSTM |
|---|---|---|---|
| (1,2) | 2264.96 | 2084.55 | 1979.45 |
| (1,3) | 2300.45 | 1933.24 | 1836.43 |
| (1,4) | 2088.05 | 1643.76 | 1271.07 |
| (1,5) | 2134.68 | 1766.73 | 1677.92 |
| (1,6) | 2127.88 | 1715.98 | 1519.06 |
| (2,3) | 3013.89 | 2685.15 | 2448.72 |
| (2,4) | 3046.40 | 2868.42 | 2613.40 |
| (2,5) | 3101.35 | 2369.03 | 1797.95 |
| (2,6) | 3087.15 | 2601.80 | 2110.68 |
| (3,4) | 3070.60 | 2429.39 | 2355.04 |
| (3,5) | 3013.65 | 2635.99 | 2382.52 |
| (3,6) | 2981.24 | 2520.39 | 2312.14 |
| (4,5) | 3038.78 | 2638.10 | 2628.71 |
| (4,6) | 3012.31 | 2626.32 | 2432.85 |
| (5,6) | 3088.55 | 2771.18 | 2554.51 |
| (1,2,3,4,5,6) | 2307.93 | 2176.45 | 1890.68 |
| Participant | HF-LSTM | HF-BiLSTM | HF-ConvLSTM |
|---|---|---|---|
| (1,2) | 0.2166 | 0.1992 | 0.1597 |
| (1,3) | 0.2708 | 0.2541 | 0.2172 |
| (1,4) | 0.2235 | 0.1715 | 0.1658 |
| (1,5) | 0.1062 | 0.1037 | 0.0833 |
| (1,6) | 0.0847 | 0.0788 | 0.0706 |
| (2,3) | 0.2784 | 0.2545 | 0.2296 |
| (2,4) | 0.2594 | 0.2280 | 0.2072 |
| (2,5) | 0.1373 | 0.1288 | 0.1062 |
| (2,6) | 0.0758 | 0.0720 | 0.0659 |
| (3,4) | 0.2489 | 0.1996 | 0.1561 |
| (3,5) | 0.1198 | 0.1072 | 0.0939 |
| (3,6) | 0.0809 | 0.0616 | 0.0472 |
| (4,5) | 0.1171 | 0.0963 | 0.0884 |
| (4,6) | 0.0876 | 0.0779 | 0.0618 |
| (5,6) | 0.0824 | 0.0750 | 0.0664 |
| (1,2,3,4,5,6) | 0.0807 | 0.0686 | 0.0655 |
| Participant | HF-LSTM | HF-BiLSTM | HF-ConvLSTM |
|---|---|---|---|
| (1,2) | 1.1199 | 0.8801 | 0.8938 |
| (1,3) | 0.8967 | 1.0949 | 0.9071 |
| (1,4) | 0.9176 | 0.9176 | 1.0623 |
| (1,5) | 1.1095 | 1.0866 | 0.9335 |
| (1,6) | 1.1174 | 1.0881 | 0.9202 |
| (2,3) | 1.0957 | 1.0921 | 0.9133 |
| (2,4) | 0.9173 | 0.9208 | 1.0630 |
| (2,5) | 1.1135 | 0.8888 | 0.8983 |
| (2,6) | 0.8520 | 0.8872 | 0.9039 |
| (3,4) | 0.9226 | 0.9305 | 1.0691 |
| (3,5) | 0.8944 | 1.1007 | 1.0957 |
| (3,6) | 0.8904 | 0.9134 | 1.0663 |
| (4,5) | 1.0810 | 0.9335 | 0.9482 |
| (4,6) | 1.0836 | 1.0722 | 0.9395 |
| (5,6) | 1.1057 | 0.8993 | 1.0907 |
| (1,2,3,4,5,6) | 0.9117 | 0.9336 | 0.9439 |
Publisher’s Note: MDPI stays neutral with regard to jurisdictional claims in published maps and institutional affiliations. |
© 2021 by the authors. Licensee MDPI, Basel, Switzerland. This article is an open access article distributed under the terms and conditions of the Creative Commons Attribution (CC BY) license (https://creativecommons.org/licenses/by/4.0/).
Share and Cite
Li, J.; Cui, T.; Yang, K.; Yuan, R.; He, L.; Li, M. Demand Forecasting of E-Commerce Enterprises Based on Horizontal Federated Learning from the Perspective of Sustainable Development. Sustainability 2021, 13, 13050. https://doi.org/10.3390/su132313050
Li J, Cui T, Yang K, Yuan R, He L, Li M. Demand Forecasting of E-Commerce Enterprises Based on Horizontal Federated Learning from the Perspective of Sustainable Development. Sustainability. 2021; 13(23):13050. https://doi.org/10.3390/su132313050
Chicago/Turabian StyleLi, Juntao, Tianxu Cui, Kaiwen Yang, Ruiping Yuan, Liyan He, and Mengtao Li. 2021. "Demand Forecasting of E-Commerce Enterprises Based on Horizontal Federated Learning from the Perspective of Sustainable Development" Sustainability 13, no. 23: 13050. https://doi.org/10.3390/su132313050