
Spatiotemporal Trends and Driving Factors of Urban Livability in the Yangtze River Delta Agglomeration


1
State Key Laboratory of Resources and Environmental Information Systems, Institute of Geographic Sciences and Natural Resources Research, Chinese Academy of Sciences, Beijing 100101, China
2
College of Resources and Environment, University of Chinese Academy of Sciences, Beijing 100049, China
3
Institute of Ecological Environment Research, Chinese Research Academy of Environmental Sciences, Beijing 100012, China
4
State Key Laboratory of Environmental Criteria and Risk Assessment, Chinese Research Academy of Environmental Sciences, Beijing 100012, China
5
College of Mining, Guizhou University, Guiyang 550025, China
*
Author to whom correspondence should be addressed.
Sustainability 2021, 13(23), 13152; https://doi.org/10.3390/su132313152
Submission received: 27 October 2021
/
Revised: 25 November 2021
/
Accepted: 25 November 2021
/
Published: 27 November 2021
(This article belongs to the Collection Indicators, Assessment Tools, and Rating Systems for Mainstreaming Sustainability in Urban Planning and Development)
Abstract
:With the development of cities, the relationship between cities is becoming closer, and the study of urban livability based on a single city can no longer meet the guidelines and suggestions for urban agglomerations. A scientific evaluation of livability in urban agglomerations can better help cities to recognize the advantages and disadvantages. However, most studies on urban livability focus on its connotation and history and neglect simulations and analyses of the future. Based on the Yangtze River Delta agglomeration, this paper establishes an index system using data from 2011 to 2019 to simulate urban livability from 2020 to 2025 through the ARIMA model and analyzes the historical and future data by using GIS methods. The results show the following: (1) The ARIMA model has good simulation accuracy when applied to urban livability analysis and can provide a reference for future urban livability development. (2) The urban livability of the Yangtze River Delta agglomeration has obviously changed both on the whole and in subsystems. Cities in the upper ranking of livability have developed rapidly, and the difference in urban livability has increased. (3) The spatial autocorrelation of urban livability in the Yangtze River Delta agglomeration is obvious both on the whole and in subsystems. (4) The influencing factors of urban livability development are diverse. The general public budget expenditure for social security and employment, fixed assets investment in municipal public facilities, total retail sales of consumer goods, and education and medical expenditures have positive effects on the development of urban livability, while industrial emissions have a negative effect. The results show that cities should strengthen inter-city relationships, promote the coordinated development of inter-regional cities, and formulate relevant policies to improve the level of urban environmental governance in the region.
1. Introduction
According to the United Nations World Cities Report, before 2010, the total population of cities accounted for about 70% of the expected growth of the world’s average population by 2050 [1]. With the process of urbanization, urban living problems, such as resource shortages, environmental deterioration, and traffic congestion, have attracted more attention [2]. People’s life pursuit has gradually changed from economic improvement to improving the quality of life. Faced with the growing problems of cities, the United Nations Summit in September 2015 set 17 Sustainable Development Goals for 2015–2030 [3], covering economic development, social progress, and environmental protection, including building inclusive, safe, resilient, and sustainable cities and human settlements. Since the start of the 21st century, China’s urbanization process has been advancing rapidly under the promotion of policies, and cities are more closely related to human life. As one of the countries with the most progress in economic development and social construction in the world, China has actively responded to the 17 Sustainable Development Goals. The analysis of changes in the livability of cities in China’s representative regions has an indicative role in improving the world’s urban construction [4,5]. With regard to improving urban livability, the Chinese government has formulated many principles and policies to (1) enhance the interconnection of transportation between cities in order to facilitate more convenient communication between cities, (2) speed up the sharing of public services in order to help citizens enjoy fairer services, (3) build an integrated green development strategy and cities with a better environment, and (4) promote more open trade and more prosperity and development of the urban economy. How do these policies affect the livability of China’s urban agglomerations? How will the livability in these agglomerations develop under the influence of such policies? These problems need to be studied and explored.
Urban livability refers to the quality of life of people in a city or region. It can be defined in terms of a city providing adequate living conditions for its citizens so that they can prosper and have a good quality of life [6,7]. Urban livability is a multi-layered concept that can reflect the living environment and quality of life of a city. It involves many areas, including the physical environment and the social and cultural environment [8,9]. Research on urban livability is based on the garden city proposed by Howard in the 19th century, and the pursuit of urban comfort and beauty gradually affected the rest of Europe and the United States [10]. In 1961, the World Health Organization (WHO) summarized the basic geographic conditions of the urban and rural living environments and for the first time put forward the basic concept of a safe, healthy, convenient, and comfortable urban living environment. Since then, researchers have conducted in-depth studies on urban livability based on different connotations and research methods.
According to the connotation of urban livability, different scholars have put forward the idea that economic conditions play a decisive role in city livability [11]: the concept of sustainable development should be added to the livable construction in cities [12], urban livability should be studied from the perspective of architecture, and so on [13]. Research methods used are mainly questionnaires, statistical methods [14], and GIS spatial analysis [15], which can measure and study the relationship between urban livability at different scales with the living environment and residents’ life satisfaction. Previous studies have provided a better understanding of urban environmental quality evaluation and influencing factors [16]. Cities are more livable when they are seen as hubs for cultural, educational, leisure, commercial, social, and economic development [17]. However, these studies have a limitation. Most studies overemphasize the role of economic factors in influencing urban environmental quality. They often arrive at counterintuitive results, contrary to the actual life experience of local residents [18,19]. Therefore, a scientific framework for evaluating urban livability is needed to reflect the real expectations of urban residents in the living environment.
At present, the SDGs focus on improving the quality of urban life and also provide new driving force and connotation for the study of urban livability. SDG 11 is to build sustainable cities and communities [20]. The specific goals include ensuring that everyone has access to appropriate, safe, and affordable housing and basic services and reducing the negative environmental impact of cities per capita, etc., which is similar to concerns about urban residents’ living environment and quality of life. Therefore, it is necessary to link the study of urban livability with the implementation of SDGs. At the same time, the proposed SDGs are relatively general and tend to provide guidance for the direction of urban development. It is necessary to further deepen and elaborate the indicators describing urban livability. Nowadays, geographic big data and GIS technology are more closely related to people’s lives. Urban research is not as it was in the past. The proposal of smart cities, based on better public services and a cleaner environment to improve citizens’ quality of life, also coincides with the goal of sustainable development [21]. Big data [22], VGI [23], and social media data [24] provide more ways to study urban livability, and the research is becoming more complex.
China began to study urban livability in the 1990s. Wu established the theory of a living environment by combining livable environment theory with the actual situation of urban and rural areas in China [25]. Later, urban livability studies mainly analyzed the livability of individual cities or communities based on existing statistical data or questionnaires [26,27,28]. With the coordinated development of cities, research on urban livability at the regional scale is emerging [29,30]. Compared with the global scale, the current research on urban livability in China mostly uses statistical yearbook data, builds index systems for key cities or regions, and summarizes the spatiotemporal changes in combination with GIS. However, the index systems established by using statistical data are different in different regions, so it is difficult to obtain the same index data in the same long time series; thus, the index system established by most of these studies is not comprehensive. In addition, the current research on urban livability is focused on the discovery of historical data rules but ignores numerical simulation and scenario analysis for future urban development.
This study takes the Yangtze River Delta urban agglomeration as the research area and, through the prediction of future scenarios and analysis of historical data, intends to provide a reference for the construction of livable cities and the improvement of the living environment. The research is carried out according to the following steps:
Step 1: Based on the United Nations SDGs for urban construction and further refining its objectives, establish a livable index system for cities;
Step 2: Use the entropy method to calculate the weight of the index system and, on this basis, calculate the livability score from 2011 to 2019;
Step 3: Use the ARIMA model to predict the urban livability score in 2020–2025;
Step 4: Explore the spatial and temporal characteristics and driving factors of urban livability in the Yangtze River Delta agglomeration, mainly using hierarchical clustering, Moran’s I index, and the panel model.
2. Overview of the Study Area
The Yangtze River Delta agglomeration is mainly distributed in the overall optimized planning and development of the national "two horizontal and three vertical" modern urbanization development pattern and key industrial development area (Figure 1). It is composed of multiple cities, with Shanghai as the regional core and close connections with cities in Jiangsu, Zhejiang, and Anhui provinces. By the end of 2014, the region covered an area of 217,700 square kilometers and had a population of more than 150 million, equivalent to 2.2% and 11.0% of the national totals, respectively. As a leader of the country’s modernization drive and one of the core regions of economic development and social construction in China and the world, the Yangtze River Delta region is one of six world-class urban agglomerations [31,32]. However, according to the 2016 Yangtze River Delta agglomeration development plan, the development of urban agglomeration is not high-quality, the international competitiveness is not strong, the urban comprehensiveness is insufficient, and the space utilization efficiency is not high, and problems such as degraded ecosystem functions, urban development, and living environment increase the quality of life problem. The great loss of farmland, forest land, and so on under rapid urbanization is causing alarm for the Chinese central government [33]. Research on the development law and trend of human settlement and quality of life in the Yangtze River Delta urban agglomeration is conducive to the study of constructing regional urban livability, finding a solution to the integrated development of urban areas in the world, and realizing the United Nations SDGs [34,35]. Therefore, it is necessary to evaluate and analyze the development of urban livability in the Yangtze River Delta agglomeration.
3. Data and Methods
3.1. Index System Construction
An urban livability evaluation index system should objectively reflect the characteristics of the urban living environment based on the scientific Evaluation Standard for Livable Cities published by the government in 2007 and the objectives and requirements of urban construction in the United Nations SDGs. An evaluation system for livable cities in the Yangtze River Delta was established with six first-level indicators: economic affluence, security, environmental beauty, resource supply, urban construction, and medical education (Figure 2). Compared with the scientific evaluation standard and the SDGs, the index system established in this paper is further refined on this basis and depicts the livable city as a specific index rather than an empty goal. The index system established in this study is different from others and related to others and tries to reflect urban livability comprehensively.
3.2. Entropy Method
Subjective and objective weighting are two common methods to determine the weight of an index system. Compared with subjective weighting, the original information of the objective weighting method is based on realistic objective data. In this paper, the entropy method is adopted for objective weighting to eliminate the direct interference of various artificial and subjective factors with the information. The entropy method assigns the weight of an index by measuring its entropy based on information theory. According to the characteristics of entropy, we can judge the degree of randomness and disorder of events and also judge the degree of dispersion of indicators by calculating the entropy value. The greater the dispersion of the index, the greater its influence (weight) on the comprehensive evaluation and the smaller the entropy value. Using entropy weight to determine index weight can overcome the inevitable randomness and assumption of the subjective weight method. Objective statistical data are used in this paper, and the entropy method is needed to reduce the influence of subjective factors on the results. At the same time, by calculating the entropy value of each index, the amount of information of the index can be measured so as to ensure that the established index can reflect most of the original information. This paper aims to analyze and compare the livability of different cities in the Yangtze River Delta urban agglomeration. It is necessary to retain the original information of the data and highlight the influence of indicators with great differences among cities. Therefore, the entropy method is adopted in this paper to evaluate the weight of indicators. The steps of using the entropy method to assign values are as follows:
Step 1. In order to effectively eliminate the direct impact of different factors and data magnitude and differences between the positive and negative mean orientation of indicators on the analysis results, quantitative standardization analysis and processing should be carried out when data analysis is necessary. A positive coefficient indicator means that the larger the value of each indicator, the greater the significance of the positive indicator for the calculation. Formula (1) was used for calculation:
The negative index means that the smaller the value, the greater the positive significance for the system, which is calculated by Formula (2):
Step 2: Using Formula (3), the score of each index value obtained by calculating and processing the system entropy value and index value previously calculated and processed by the system are comprehensively calculated:
Step 3: Finally, using Formula (4), the score of urban livability is obtained by summation of the index scores:
where represents the true value of the index sample, represents the maximum value of the index, represents the minimum value of the index, represents the value after the standardization of index data in , represents the score of index in , and represents the urban livability score calculated in .
According to the analysis results (Table 1), the five factors with the largest index weight determined by the entropy method are the length of urban subway lines, local general public budget revenue, number of colleges and universities, amount of unemployment insurance, and amounts of urban workers’ basic endowment insurance. These five indicators have a large gap in cities with different levels of development, which can better depict the differences of urban livability among cities. At the same time, the weight distribution of other indicators is relatively even, which validates the use of the entropy method to confirm indicators in this paper.
3.3. ARIMA Model
The autoregressive comprehensive moving average (ARIMA) model is often used in econometrics. It is a more accurate calculation method to predict non-stationary moving time series [36]. The ARIMA model is widely used in areas of economics, behavior, disease transmission [37], etc., and the urban livability index system contains a variety of non-stationary indicators, so prediction using structural causal models, such as regression analysis, cannot achieve ideal results. The principle of the ARIMA model is to regard the time series as a random process and construct a mathematical model based on a comprehensive consideration of the parameters according to the criteria. After the model is determined, the time series can be simulated. The general steps for the ARIMA model are as follows [38]:
(1) Determine sequence stationarity. The unit root is used to test whether the sequence satisfies the stationary condition. If it does not, the data can be adjusted to meet the stationary condition through the logarithmic difference method.
(2) Calculate the time-series descriptive statistics. The ARIMA model needs to determine three statistics: autoregression order P, moving average order Q, and difference order D. The AIC and BIC information criteria can be combined to conduct multiple model comparison. The lower the two values, the better. The model parameters can be obtained by comprehensive analysis.
(3) Diagnose the model. The design of the ARIMA model requires that the residual is local white noise; that is, the local residual does not necessarily have its own correlation. The local white noise value can be tested by the method where Q is the measured value of statistical value. If the local residual of the model passes the white noise test, it means that the model can be used normally.
3.4. Hierarchical Clustering
Hierarchical clustering is used to measure the distance between items in the given dataset according to the algorithm and to decompose and set the data hierarchically [39]. Hierarchical clustering is generally divided into top-down and bottom-up methods according to the formation of hierarchies by either the splitting or agglomeration method. The splitting method starts from the whole and gradually breaks each class into smaller classes through iteration until each object is reduced to an indivisible class. The aggregation method starts from a single object and gradually merges close classes through iteration until all classes are merged into one or the termination condition is reached. Hierarchical clustering has simple requirements for implementation of the algorithm, and the similarity and classification restrictions are easier to implement than other classification methods and can reflect the hierarchy among categories. Therefore, it is used in the classification of urban livability in this study to explore the category changes of urban livability among different subsystems.
3.5. Moran’s I
Moran’s I is used in spatial statistical analysis to explore the existence of spatial autocorrelation in the whole world [40,41]. Global Moran ’s I is mainly used to conduct global spatial autocorrelation tests and analyses. In this study, the index mainly reveals the spatial layout of urban livability in the Yangtze River Delta agglomeration on the whole and explores whether there is spatial autocorrelation of livability in the whole area and subsystems and the development trend of spatial autocorrelation. The formula for calculating the global Moran’s I is:
where represents the number of cities in the Yangtze River Delta agglomeration; represents the spatial weight matrix, and if is adjacent to , the value is 1, and otherwise, it is 0; represents the livability score of ; and represents the average of livability scores [42].
The value range of the index is (−1,1). The larger the absolute value, the higher the spatial correlation degree of urban livability. A positive index indicates that the spatial layout of urban livability in the Yangtze River Delta agglomeration has a positive autocorrelation; that is, the trend of urban livability is correlated with itself. A negative index indicates that the spatial distribution of livability has a negative spatial autocorrelation. When the index is 0, it means that the urban livability score has no correlation in the spatial distribution and presents a random spatial layout.
3.6. Data Resources
This paper refers to the Sustainable Development Goals for basic services, energy, housing, transportation, and other aspects and presents an in-depth discussion of the specific goals, in an attempt to describe in detail all aspects of urban livability and the specific indicators of the indicator system used in this paper. The source of index data is objective statistical data of cities in the Yangtze River Delta, all of which can be found in the Statistical Yearbook of Chinese Cities from 2011 to 2019, Shanghai Statistical Yearbook, Jiangsu Statistical Yearbook, Anhui Statistical Yearbook, Zhejiang Statistical Yearbook of Natural Resources and Environment, and Municipal and County Statistical Yearbooks. The above yearbook data record the statistics of the database query in China, all found at https://data.cnki.net/Yearbook/, using query yearbook name and corresponding indicators to obtain the corresponding data.
4. Results and Analysis
4.1. Urban Livability System Score Characteristics
The evaluation results (Table 1) show that the subsystems affecting the livability of cities in the Yangtze River Delta agglomeration are urban construction (33.91%), medical education (25.08%), social security (19.33%), economic prosperity (13.28%), resource supply (4.78%), and good environment (3.64%). The following affect the livability of the index of the top 10: city subway line length (17.96%), local general public budget revenue (7.95%), number of universities (6.97%), amount of unemployed insurance (6.42%), amount of basic medical insurance for urban workers (6.27%), town worker basic endowment insurance (6.08%), education expenses in the fiscal expenditure per 100 people (5.71%), public library books (4.47%), mobile phone users (4.15%), and Internet broadband access subscribers (4.13%). For urban livability, the most influential index factor distribution is urban construction and medical education. The Yangtze River Delta agglomeration must improve the livability of cities while developing the economy and improving the environment. At the same time, it must upgrade the urban infrastructure related to the convenience of residents’ lives and production. It is necessary to improve urban medical and educational conditions and improve the living conditions and cultural environment of urban residents.
4.2. Spatiotemporal Characteristics of Urban Livability
The historical and predicted distribution results of urban livability (Figure 3)show a spatial distribution pattern with Shanghai as the main center and provincial capital cities as sub-centers and with less divergence toward the surrounding areas and mostly distributed along the banks of the Yangtze River. Cities with high livability are mainly provincial capitals, transportation hubs, and nearby cities, while cities farther from provincial capitals, transportation hubs, and other high livability cities show mediocre livability. From the point of view of time, Shanghai has always been a livable city, and Nanjing, Suzhou, and Hangzhou have become livable cities through development, driving the development of surrounding cities into livable cities. On the whole, the forecast that with development during 2011–2025, the Yangtze River Delta agglomeration urban livability has made great progress, going from good livability only in Shanghai city from 2011 (3.85% of total) to an increase in Shanghai, Nanjing, Suzhou, and Hangzhou city (15.38% overall) to good livability good or above by 46.15% (26.92% overall).
Based on the livability scores, rankings, and changing trends of cities in 2011 and 2025 (Table 2), the temporal evolution results of urban livability can be divided into the following three categories: (1) Rising type: urban livability fluctuates and rises with time over the study period. The main cities are Shanghai, Nanjing, Wuxi, Changzhou, Suzhou, Yangzhou, Zhenjiang, Hangzhou, Ningbo, Jiaxing, Shaoxing, Jinhua, Taizhou, Hefei, Chuzhou, and Xuancheng. Rising cities account for 61.54% of the cities in the Yangtze River Delta agglomeration, which shows that great progress has been made in development there during 2011–2025. Most of these cities are located in traffic centers, with good urban infrastructure construction and stable development of economic industries, and residents’ living standards have been greatly improved. (2) Stable type: the livability of the city does not change significantly over time during the study period and remains stable. It mainly includes Huzhou, Zhoushan, Wuhu, Anqing, and Chizhou. Compared with rising cities, stable cities have less competitiveness, but they have their advantages. Therefore, the livability of cities fluctuates with the development of time, with a small amplitude. (3) Declining type: the urban livability fluctuates and decreases over time during the study period. Declining cities include Nantong, Yancheng, Taizhou, Tongling, and Ma’anshan. The development model of these cities, such as the steel and chemical industries, since these are resource-based cities, can no longer meet the needs of economic development, and they also have certain disadvantages in urban infrastructure construction, medical education, and other aspects, and urban livability has shown a downward trend. Considering the changes in the livability of 26 cities in the Yangtze River Delta agglomeration during 2011–2025, those rising the fastest are Suzhou, Shanghai, Nanjing, Hangzhou, Hefei, Ningbo, and Wuxi, the seven cities with the highest livability scores in this region. The difference in livability between these and other cities is further widened. Except for Tongling, the livability of other cities has fluctuated but still improved, and the score distribution was within 0.10–0.25, and the difference of livability among cities was small.
According to the average scores of urban subsystems in each research period, clusters were defined as excellent livability, good livability, and general livability, with scores of 3, 2, and 1, respectively. Comparing the analysis results of the two periods (Figure 4) shows that each city has its own advantages and disadvantages. The economic category remained relatively stable, and no cities achieved progress or declined in the category. Cities with excellent, good, and general livability accounted for 3.85, 19.23, and 76.92%, respectively. In terms of urban construction and medical education, which have a great impact on overall livability, several cities achieved the transition from general to good livability and from good to excellent livability. After 10 years of development, the proportion of cities with good livability and above in urban construction, medical care, and education will increase from 7.69 and 19.23% to 46.15 and 42.31%, respectively.
Cities with good livability, in general, remain stable or improve in classification in most subsystems, and the deficiencies of urban development are greatly improved. For example, Shanghai has maintained a good livability classification among subsystems including economy, social security, urban construction, medical care, and education. Although it is still a weak link in the environmental subsystem and needs to be improved, the shortage of original resource supply has been greatly improved, and the livability has also improved from general to excellent. However, Tongling, Anqing, Chuzhou, and other cities do not score high in the overall system, and the performance of each subsystem is not satisfactory; thus, most of the subsystems are still in the general livability category. For example, except for the resource supply subsystem, the livability of the other subsystems in Chuzhou has been greatly improved. Therefore, the livability of the Yangtze River Delta urban agglomeration subsystems also presents the characteristic of increasing difference between the two poles.
4.3. Autocorrelation Characteristics of Urban Livability
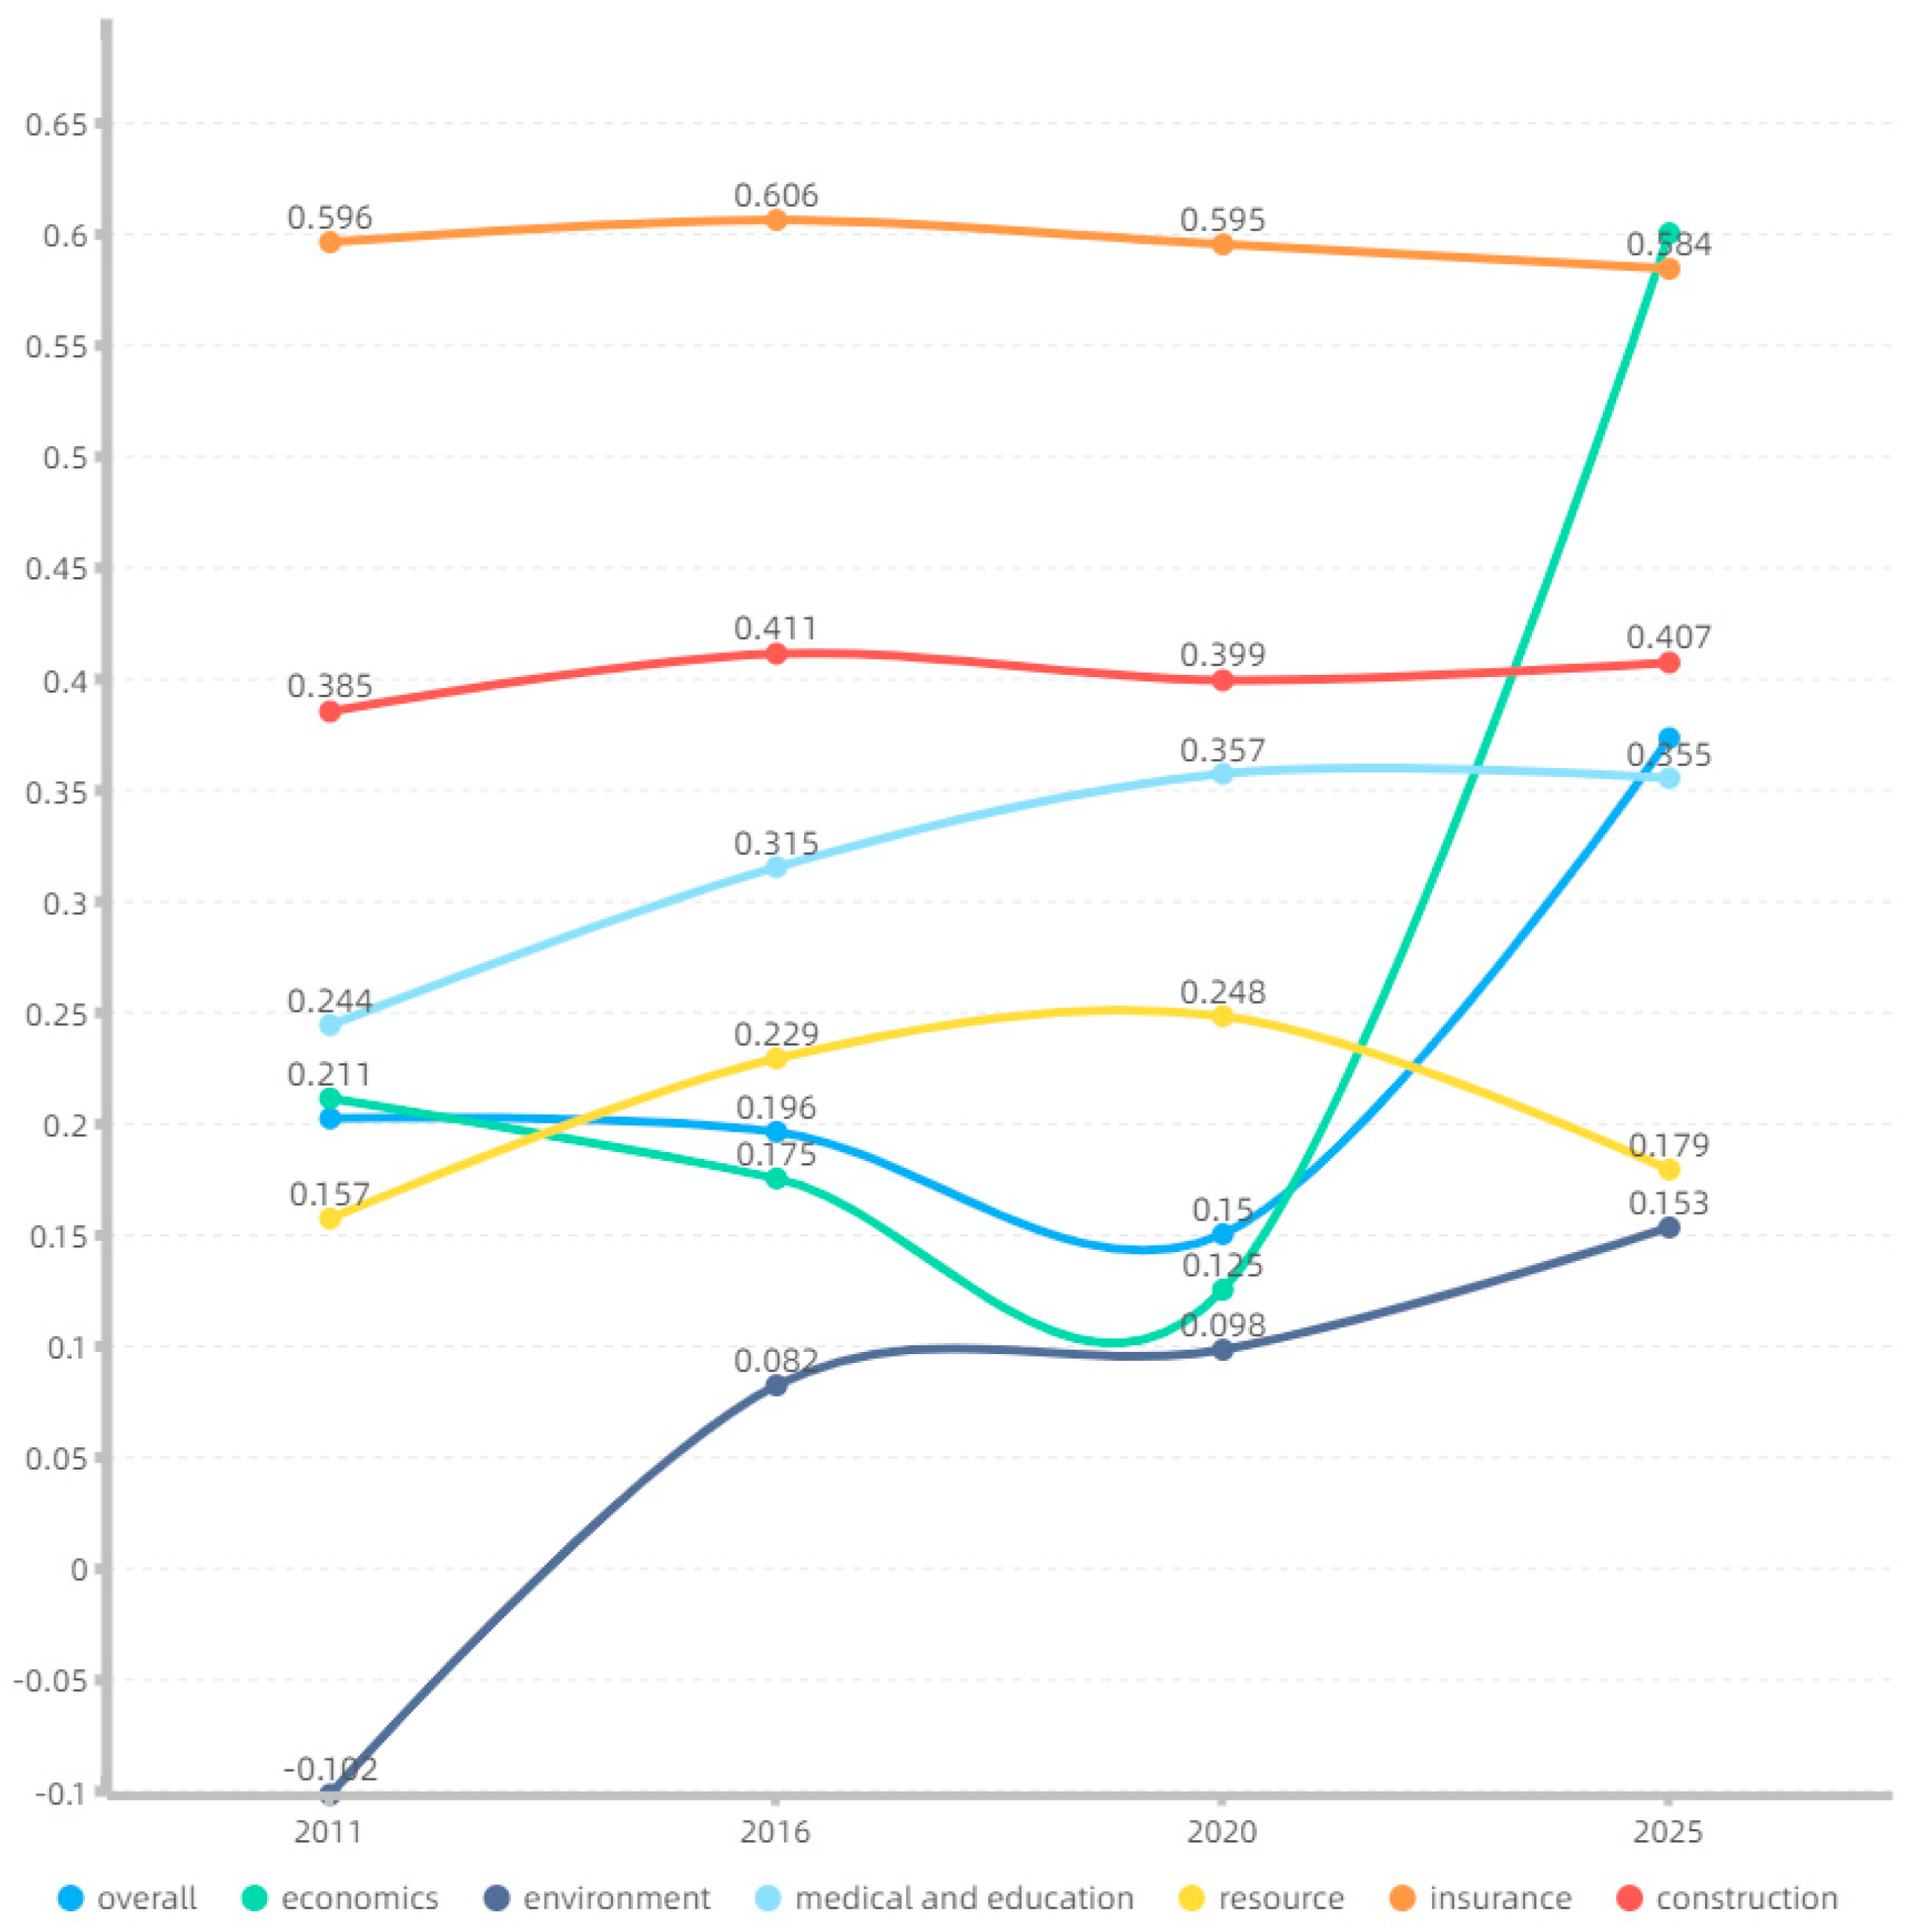
According to the evolution of the overall and subsystem Moran’s I score of the Yangtze River Delta agglomeration (Figure 5), the values of urban livability in 2011, 2016, 2020, and 2025 are all positive, which indicates that the cities in this region are significantly affected by the livability level of neighboring cities. In terms of space, livable cities are situated between high-value and low-value urban areas. Therefore, the spatial characteristics of cities in the Yangtze River Delta agglomeration are non-random and have a positive spatial autocorrelation of the approximate value agglomeration phenomenon.
From the overall time dimension, urban livability shows a slight decline and then a significant increasing trend. Moran ’s I decreases from 0.202 in 2011 and to 0.15 in 2020, indicating that the overall geographic aggregation of urban livability of the Yangtze River Delta agglomeration is relatively stable during 2011–2020, but there is a slight downward trend. Moran ’s I increases sharply from 0.15 in 2011 to 0.373 in 2020. Therefore, urban livability of the region experienced a trend from a small decline to a large increase in terms of the development stage.
The subsystems present a positive spatial autocorrelation trend most of the time, but there are differences in the evolution of spatial autocorrelation among the subsystems. In the six subsystems, except for the environmental system in 2011, Moran’s I was negative and showed negative spatial autocorrelation; the rest of the time, the system showed significant positive spatial autocorrelation. Moran’s I of the social security and urban construction systems maintains a high value and is relatively stable during 2011–2025, indicating that the spatial autocorrelation of the two parts of the system has not changed significantly. The spatial autocorrelation of health care and education and environment showed an increasing trend, from 0.244 and –0.102 in 2011 to 0.355 and 0.153 in 2025, respectively. However, after 2020, the upward trend shows weakening. The spatial autocorrelation of the resource subsystem increases slightly during 2011–2020 but decreases during 2020–2025, indicating that the positive spatial autocorrelation is gradually weakening. The trend of the economic subsystem is opposite to that of the resource system, which decreases from 0.211 to 0125 during 2011–2020 and surges from 0.125 to 0.600 during 2020–2025, indicating that the positive spatial autocorrelation is gradually increasing.
Decreased Moran’s I scores means weakening of the system’s spatial agglomeration phenomenon in this period of time. For the Yangtze River Delta agglomeration, it means that the differences between cities become smaller, and regional coordinated development has been improved. In the future simulation, the spatial autocorrelation of the whole system and the economic and environmental subsystems increases obviously, which may be due to the different urban development policies and locations. According to the above analysis, most cities with good livability are concentrated along the Yangtze River and the traffic trunk line, a superior geographic location. Most of them are provincial capitals, enjoying more policy benefits, which also means that the performance of the coordinated development strategy in the Yangtze River Delta agglomeration still needs to be improved. The obvious change of spatial autocorrelation is also the resource subsystem. The agglomeration introduced policies to reduce the resource gap among cities and achieved good results after simulation.
4.4. Driving Factors
According to the test results (Table 3), the FE model was selected as the final analysis model in this study. In order to avoid unscientific results of the evaluation system index, as above, industrial SO2 emissions, social security and spending on employment for the general public, total retail sales of consumer goods, and urban construction land area were chosen as influences on urban livability. Due to the large difference in magnitude between the scores and the influencing factor variables, the variables were analyzed using logarithms.
The analysis showed that the regression coefficients of the transformed general public budget expenditure on social security and employment, fixed assets investment in municipal public facilities construction, total retail sales of social consumer goods, education and medical expenditure, and urban construction land area were all positive numbers (0.007, 0.018, 0.039, and 0.014, respectively) (Table 4). This can have a significant positive impact on urban livability, indicating that generally, when cities increase their investment in social security, urban construction, medical and health care, and education, livability will also improve.
At a level of significance of 0.01 for industrial SO2 emissions after transformation, the regression coefficient value is –0.007 < 0, which will have a significant negative impact on urban livability. The Yangtze River Delta agglomeration is among the regions with the fastest economic development and urban construction in China. Many comprehensive industrial bases are distributed in this region, and industrial SO2 emissions are prevalent. Environmental problems represented by industrial SO2 emissions are one of the key issues to address in order to improve the livability of local cities.
5. Discussion
5.1. Simulation Accuracy
Before calculating the evaluation system scores, we used validity analysis and reliability analysis (Table 5) to judge the rationality of the system. Generally speaking, when the KMO value of validity analysis is greater than or equal to 0.8, the results of the evaluation system are reliable. When Cronbach’s α coefficient of reliability analysis is greater than or equal to 0.8, the system is considered to have good reliability. The results of validity analysis showed that the KMO value was 0.907, which is greater than 0.8, indicating that the validity of the research data was very good. The reliability analysis coefficient value was 0.852, which is greater than 0.8, indicating that the reliability of the research data was high.
Based on historical statistical data, this paper uses the ARIMA model to predict future scenarios and studies the spatial and temporal changes of the whole and Yangtze River Delta agglomeration and its subsystems in different periods. The ARIMA model was used in combination with information to measure AIC and BIC values to select the most suitable model for each city, and the results were analyzed by means of mean square error (MSE) and Q statistics. The mean square error distribution between the real and simulated value of the livability of cities is between 0.00001 and 0.00073 (Table 6), indicating a small difference between the model-predicted and real value. The Q statistic test was used to detect whether there was white noise. With Q6 order prior to inspecting the residual autocorrelation coefficient, if the p-value is greater than 0.1, then it meets the white noise test. The simulation results (Table 6) show that the p-value of every city meets the requirements of the white noise test, proving that use of the ARIMA model to simulate urban livability satisfies the requirement of the model.
In terms of regional livability, previous studies have also been based on historical data from statistical yearbooks but neglected to simulate future livability. Compared with previous studies on livability in the Yangtze River Delta agglomeration [30], in this paper, the ARIMA model is used to simulate livability in the future, to explore the changing trend of general and partial livability of future cities, and to select representative factors to analyze the influencing factors of urban livability construction based on the historical yearbook data. The previous research period was 2004–2017, which overlaps with the research period of this paper. By comparing the two results, the spatial differentiation law and temporal evolution law of urban livability in the Yangtze River Delta agglomeration are basically consistent in the given time period. Previous studies found that urban livability of this region does not have space since the correlation. However, the index system in this paper is more refined, and the spatial autocorrelation description of the urban habitability of the region is more comprehensive. The results show that the urban livability of the Yangtze River Delta agglomeration has spatial autocorrelation both as a whole and among its subsystems. Compared with previous studies, this paper adds future scenario simulation, so it is more valuable for urban construction.
5.2. Uncertainty
The driving factors of urban livability are very complex. In this study, referring to the original cases, a total of 32 factors in six modules (economy, environment, urban construction, medical care and education, resource, and insurance) were selected as the influencing factors driving the development of urban livability. However, natural factors, such as rainfall, slope, and sunshine duration, also have an impact on the urban living experience [43,44], and if new influencing factors are added in the future, that could still affect the results.
This study is limited by the shortcomings of the ARIMA model and fails to provide long-term series prediction. Later, we can combine social media, geographic big data, and deep learning to provide long-term prediction and simulation of urban livability in the future.
The basic premise of ARIMA model simulation is to use historical statistical yearbook data from the past. If the central and local governments adjust their urban development policies for the Yangtze River Delta agglomeration in the future, the regional development trend may be affected, and the simulation results of the ARIMA model may be biased. Considering the reform and development of the Chinese government and the construction of the Maritime Silk Road, the speed and level of regional economic and social development in the Yangtze River Delta region will steadily improve. The simulated conditions of the ARIMA model in the study area will not change significantly, and the results will be feasible.
5.3. Policy Suggestions
Since the implementation of the reform and opening-up policy in China, the Yangtze River Delta urban agglomeration has undergone rapid development of industrialization and informatization. From 2005 to 2010, the total GDP of scale economy increased from RMB 4126.4 billion to RMB 8631.4 billion [45]. At the same time, cities are also faced with continuous agglomeration of various resources and changes in spatial patterns. The urbanization degree of the Yangtze River Delta reached 67% in 2008 [46]. In 2019, it was defined as a national high-quality development area. The launch of the regional integration strategy is also conducive to the development of all cities in the region. However, through this study, it is found that the livability gap of the Yangtze River Delta agglomeration has increased between the first-tier and second-tier cities, and the competition between cities has led to the slow development of urban integration and regional coordination [47].
The integration strategy of triangle cities can promote narrowing of the internal urban gap and improve the overall development conditions of relatively backward cities through economic ties and resource allocation. From the perspective of regional coordinated development, the research suggests that central and local governments should continue to coordinate relevant policies and steadily promote the policies of urban integration construction in the Yangtze River Delta agglomeration.
At the same time, the environment is a major problem restricting the urban development of this region. The study shows that the Yangtze River Delta agglomeration has not improved much in terms of the environment. According to a comparison of the environmental system classification from 2011–2015 to 2020–2025, the environmental livability of the region is still poor, and the environmental livability of most cities is still at the general level. Green and low-carbon technological innovation cannot be isolated from the policy or regulation regime [48]. In order to ensure the sustainable development of cities in the Yangtze River Delta agglomeration, promote the construction of urban livability, improve the urban environment, and reduce the discharge and treatment of industrial waste gas and wastewater, it is extremely necessary to follow the concept of "green waters and green mountains are gold and silver mountains" and strengthen the construction of an ecological civilization [49]. The effect of reducing emissions of gases, such as industrial SO2 dioxide, can be improved through differentiated policies [50] and the transformation of economic development [51]. It is also urgent to promote urban development from high-speed to high-quality development.
6. Conclusions
This study adopts urban statistical data from 2011–2019; comprehensively considers urban economic development, social security, urban construction, medical education, resource supply, and environmental change; and uses the ARIMA model to simulate urban livability scores during 2020–2025 to explore the development of cities as a whole and their subsystems during 2011–2025. Combining the panel data and historical statistical data, the influencing factors of the livability of the Yangtze River Delta urban agglomeration during 2011–2019 were explored.
The results show that the livability of this region has changed significantly during 2011–2025, and the gap between high-level and low-level cities has gradually increased. The performance of high-level cities in each subsystem of livability is generally better than that of middle and low-level cities, and the latter are gradually drawn apart by the former in each subsystem. The livability of the Yangtze River Delta urban agglomeration has positive spatial autocorrelation, and the spatial autocorrelation of each subsystem has changed obviously during the study period. Environmental problems have become a major problem restricting the improvement of urban livability in the region.
There are many similar problems in urban development around the world [52,53], such as the gradual deterioration of the urban environment and the need to improve public transport. The Yangtze River Delta region is one of the fastest developing urban agglomerations in the world in recent years, and it has cities in different states of development. Therefore, it has certain reference significance for other urban agglomerations at different levels of development in the world. For example, it is found through research that the gap of livability between first-tier and second-tier cities in the Yangtze River Delta urban agglomeration has increased, and competition among cities has led to slow development of urban integration and regional coordination. Each urban agglomeration can formulate its own development strategies according to its city status, coordinate the resource ratio between cities, gradually reduce the differences in livability between cities, and realize the improvement of regional livability as a whole. The research also proves the reliability and practicability of the ARIMA and panel models in the simulation and analysis of urban livability. In future research, the selection of driving factors of livability and the optimization of model parameters can be further improved and deepened to adapt to the application needs of different regions and scenarios.
Author Contributions
Conceptualization, S.F.; methodology, S.F.; software, Y.Y.; validation. Y.Y.; formal analysis, Y.Y.; investigation, H.W. and J.D.; data curation, H.W.; writing—original draft preparation, Y.Y.; writing—review and editing, Y.Y. and W.H.; visualization, H.T.; supervision, S.F.; project administration, S.F.; funding acquisition, S.F. All authors have read and agreed to the published version of the manuscript.
Funding
This paper was jointly funded by the National Natural Science Foundation of China (No. 41971082) and the National Key Research and Development Program of China (2019YFC1510505).
Acknowledgments
The authors would like to express their sincere thanks to the anonymous reviewers, whose comments and suggestions were of great help to improve the quality of this paper.
Conflicts of Interest
The authors declare no conflict of interest.
References
- Un-Habitat. State of the World’s Cities, 2010/2011: Bridging the Urban Divide; Earthscan: London, UK, 2008. [Google Scholar]
- Wei, Y.; Huang, C.; Lam, P.T.; Yuan, Z. Sustainable urban development: A review on urban carrying capacity assessment. Habitat Int. 2015, 46, 64–71. [Google Scholar] [CrossRef]
- Bongaarts, J. World Health Organization Health in 2015: From MDGs, Millennium Development Goals, to SDGs, Sustainable Development Goals Geneva: WHO Press, 2016. 212 p. $60.00 (pbk.). Popul. Dev. Rev. 2016, 42, 575. [Google Scholar] [CrossRef] [Green Version]
- Yu, S.; Sial, M.S.; Tran, D.K.; Badulescu, A.; Thu, P.A.; Sehleanu, M. Adoption and implementation of sustainable development goals (SDGs) in China—Agenda 2030. Sustainability 2020, 12, 6288. [Google Scholar] [CrossRef]
- Chen, S.; Guo, L.; Wang, Z.; Mao, W.; Ge, Y.; Ying, X.; Fang, J.; Long, Q.; Liu, Q.; Xiang, H. Current situation and progress toward the 2030 health-related Sustainable Development Goals in China: A systematic analysis. PLoS Med. 2019, 16, e1002975. [Google Scholar] [CrossRef]
- Marans, R.W. Quality of urban life & environmental sustainability studies: Future linkage opportunities. Habitat Int. 2015, 45, 47–52. [Google Scholar]
- Ruth, M.; Franklin, R.S. Livability for all? Conceptual limits and practical implications. Appl. Geogr. 2014, 49, 18–23. [Google Scholar] [CrossRef] [Green Version]
- Kashef, M. Urban livability across disciplinary and professional boundaries. Front. Archit. Res. 2016, 5, 239–253. [Google Scholar] [CrossRef] [Green Version]
- Norouzian-Maleki, S.; Bell, S.; Hosseini, S.-B.; Faizi, M. Developing and testing a framework for the assessment of neighbourhood liveability in two contrasting countries: Iran and Estonia. Ecol. Indic. 2015, 48, 263–271. [Google Scholar] [CrossRef] [Green Version]
- Buder, S. Visionaries and Planners: The Garden City Movement and the Modern Community; Oxford University Press on Demand: Oxford, UK, 1990. [Google Scholar]
- Balsas, C.J. Measuring the livability of an urban centre: An exploratory study of key performance indicators. Plan. Pract. Res. 2004, 19, 101–110. [Google Scholar] [CrossRef]
- Carley, M.; Smith, H.; Jenkins, P. Urban Development and Civil Society: The Role of Communities in Sustainable Cities; Routledge: London, UK, 2013. [Google Scholar]
- Palej, A. In Architecture for, by and with children: A way to teach livable city. In Proceedings of the International Making Cities Livable Conference, Vienna, Austria, 4–8 July 2000. [Google Scholar]
- Bonaiuto, M.; Fornara, F.; Ariccio, S.; Cancellieri, U.G.; Rahimi, L. Perceived residential environment quality indicators (PREQIs) relevance for UN-HABITAT city prosperity index (CPI). Habitat Int. 2015, 45, 53–63. [Google Scholar] [CrossRef]
- Harvey, C.; Aultman-Hall, L. Measuring urban streetscapes for livability: A review of approaches. Prof. Geogr. 2016, 68, 149–158. [Google Scholar] [CrossRef]
- Mahmoudi, M.; Ahmad, F.; Abbasi, B. Livable streets: The effects of physical problems on the quality and livability of Kuala Lumpur streets. Cities 2015, 43, 104–114. [Google Scholar] [CrossRef]
- Marans, R.W.; Stimson, R.J. Investigating Quality of Urban Life: Theory, Methods, and Empirical Research; Springer Science & Business Media: Berlin/Heidelberg, Germany, 2011; Volume 45. [Google Scholar]
- Easterlin, R.A.; Morgan, R.; Switek, M.; Wang, F. China’s life satisfaction, 1990–2010. Proc. Natl. Acad. Sci. USA 2012, 109, 9775–9780. [Google Scholar] [CrossRef] [Green Version]
- Okulicz-Kozaryn, A. City life: Rankings (livability) versus perceptions (satisfaction). Soc. Indic. Res. 2013, 110, 433–451. [Google Scholar] [CrossRef]
- World Health Organization. Health in 2015: From MDGs, Millennium Development Goals to SDGs, Sustainable Development Goals; World Health Organization: Geneva, Switzerland, 2015. [Google Scholar]
- Appio, F.P.; Lima, M.; Paroutis, S. Understanding Smart Cities: Innovation ecosystems, technological advancements, and societal challenges. Technol. Forecast. Soc. Chang. 2019, 142, 1–14. [Google Scholar] [CrossRef]
- Batty, M. Big data, smart cities and city planning. Dialogues Hum. Geogr. 2013, 3, 274–279. [Google Scholar] [CrossRef] [PubMed]
- Jokar Arsanjani, J.; Helbich, M.; Bakillah, M.; Hagenauer, J.; Zipf, A. Toward mapping land-use patterns from volunteered geographic information. Int. J. Geogr. Inf. Sci. 2013, 27, 2264–2278. [Google Scholar] [CrossRef]
- Resch, B.; Summa, A.; Zeile, P.; Strube, M. Citizen-centric urban planning through extracting emotion information from twitter in an interdisciplinary space-time-linguistics algorithm. Urban Plan. 2016, 1, 114–127. [Google Scholar] [CrossRef]
- Wu, L. Sciences of human settlements: Searching for the theory and practice. Ekistics 2002, 69, 279. [Google Scholar]
- Huang, H.; Li, Q.; Zhang, Y. Urban residential land suitability analysis combining remote sensing and social sensing data: A case study in Beijing, China. Sustainability 2019, 11, 2255. [Google Scholar] [CrossRef] [Green Version]
- Xiong, Y.; Zhang, F. Effect of human settlements on urban thermal environment and factor analysis based on multi-source data: A case study of Changsha city. J. Geogr. Sci. 2021, 31, 819–838. [Google Scholar] [CrossRef]
- Fu, B.; Yu, D.; Zhang, Y. The livable urban landscape: GIS and remote sensing extracted land use assessment for urban livability in Changchun Proper, China. Land Use Policy 2019, 87, 104048. [Google Scholar] [CrossRef]
- Cui, F.; Tang, H.; Zhang, Q. Urban livability and influencing factors in Beijing, Tianjin, and Hebei: An empirical study based on panel data from 2010–2016. J. Beijing Norm. Univ. (Nat. Sci.) 2018, 54, 666–673. [Google Scholar]
- Guo, Z.; Yao, S.; Chen, S.; Wu, W.; Liu, W. Spatial-temporal evolution of the livability levels in the Yangtze River Delta urban agglomerations and its influencing factors. Econ. Geogr. 2020, 40, 79–88. [Google Scholar]
- Lu, H.; Zhang, M.; Sun, W.; Li, W. Expansion analysis of yangtze river delta urban agglomeration using dmsp/ols nighttime light imagery for 1993 to 2012. ISPRS Int. J. Geo-Inf. 2018, 7, 52. [Google Scholar] [CrossRef] [Green Version]
- Zhen, F.; Cao, Y.; Qin, X.; Wang, B. Delineation of an urban agglomeration boundary based on Sina Weibo microblog ‘check-in’data: A case study of the Yangtze River Delta. Cities 2017, 60, 180–191. [Google Scholar] [CrossRef]
- Huang, Z.; Du, X.; Castillo, C.S.Z. How does urbanization affect farmland protection? Evidence from China. Resour. Conserv. Recycl. 2019, 145, 139–147. [Google Scholar] [CrossRef] [Green Version]
- Olawumi, T.O.; Chan, D.W. A scientometric review of global research on sustainability and sustainable development. J. Clean. Prod. 2018, 183, 231–250. [Google Scholar] [CrossRef]
- Ye, C.; Zhu, J.; Li, S.; Yang, S.; Chen, M. Assessment and analysis of regional economic collaborative development within an urban agglomeration: Yangtze River Delta as a case study. Habitat Int. 2019, 83, 20–29. [Google Scholar] [CrossRef]
- Hillmer, S.C.; Tiao, G.C. An ARIMA-model-based approach to seasonal adjustment. J. Am. Stat. Assoc. 1982, 77, 63–70. [Google Scholar] [CrossRef]
- Perone, G. An ARIMA model to forecast the spread and the final size of COVID-2019 epidemic in Italy. HEDG-Health Econom. Data Group Work. Pap. Ser. Univ. York (2020) 2020, 2004, 00382. [Google Scholar]
- Benvenuto, D.; Giovanetti, M.; Vassallo, L.; Angeletti, S.; Ciccozzi, M. Application of the ARIMA model on the COVID-2019 epidemic dataset. Data Brief 2020, 29, 105340. [Google Scholar] [CrossRef] [PubMed]
- Voorhees, E.M. Implementing agglomerative hierarchic clustering algorithms for use in document retrieval. Inf. Process. Manag. 1986, 22, 465–476. [Google Scholar] [CrossRef] [Green Version]
- Getis, A. A history of the concept of spatial autocorrelation: A geographer’s perspective. Geogr. Anal. 2008, 40, 297–309. [Google Scholar] [CrossRef]
- Getis, A. Reflections on spatial autocorrelation. Reg. Sci. Urban Econ. 2007, 37, 491–496. [Google Scholar] [CrossRef]
- Griffith, D.A. Spatial autocorrelation. In A Primer; Association of American Geographers: Washington, DC, USA, 1987. [Google Scholar]
- Liang, L.; Deng, X.; Wang, P.; Wang, Z.; Wang, L. Assessment of the impact of climate change on cities livability in China. Sci. Total Environ. 2020, 726, 138339. [Google Scholar] [CrossRef] [PubMed]
- Liu, H. Comprehensive carrying capacity of the urban agglomeration in the Yangtze River Delta, China. Habitat Int. 2012, 36, 462–470. [Google Scholar] [CrossRef]
- Cai, P.; Huang, Z.-W. Spatial patterns of urban agglomeration in the Yangtze River Delta based on synergy development. Econ. Geogr. 2014, 34, 75–79. [Google Scholar]
- Xu, S.; Yu, T.; Wu, Q. A study of urbanization quality assessment system of county-level cities in China under the regional perspective: Taking the Yangtze delta area as an example. Urban Plan. Int. 2011, 26, 53–58. [Google Scholar]
- Hao, J.; Zhang, P.; Yu, W.; Mou, X. Causes of Spatial Patterns of Livability in Chinese Cities: MGWRL Analysis Based on Didi’s Big Data. J. Urban Plan. Dev. 2021, 147, 04021025. [Google Scholar] [CrossRef]
- Shi, Q.; Lai, X. Identifying the underpin of green and low carbon technology innovation research: A literature review from 1994 to 2010. Technol. Forecast. Soc. Chang. 2013, 80, 839–864. [Google Scholar] [CrossRef]
- Shi, T.; Zhang, W.; Zhou, Q.; Wang, K. Industrial structure, urban governance and haze pollution: Spatiotemporal evidence from China. Sci. Total Environ. 2020, 742, 139228. [Google Scholar] [CrossRef]
- Cheng, S.; Chen, Y.; Meng, F.; Chen, J.; Liu, G.; Song, M. Impacts of local public expenditure on CO2 emissions in Chinese cities: A spatial cluster decomposition analysis. Resour. Conserv. Recycl. 2021, 164, 105217. [Google Scholar] [CrossRef]
- Liu, Y.; Wang, S.; Qiao, Z.; Wang, Y.; Ding, Y.; Miao, C. Estimating the dynamic effects of socioeconomic development on industrial SO2 emissions in Chinese cities using a DPSIR causal framework. Resour. Conserv. Recycl. 2019, 150, 104450. [Google Scholar] [CrossRef]
- Howard, K.; Gerber, R. Impacts of urban areas and urban growth on groundwater in the Great Lakes Basin of North America. J. Great Lakes Res. 2018, 44, 1–13. [Google Scholar] [CrossRef]
- Fan, H.; Hashmi, S.H.; Habib, Y.; Ali, M. How Do Urbanization and Urban Agglomeration Affect CO2 Emissions in South Asia? Testing Non-Linearity Puzzle with Dynamic STIRPAT Model. Chin. J. Urban Environ. Stud. 2020, 8, 2050003. [Google Scholar] [CrossRef]
Figure 1.
Location of the Study Region in China.
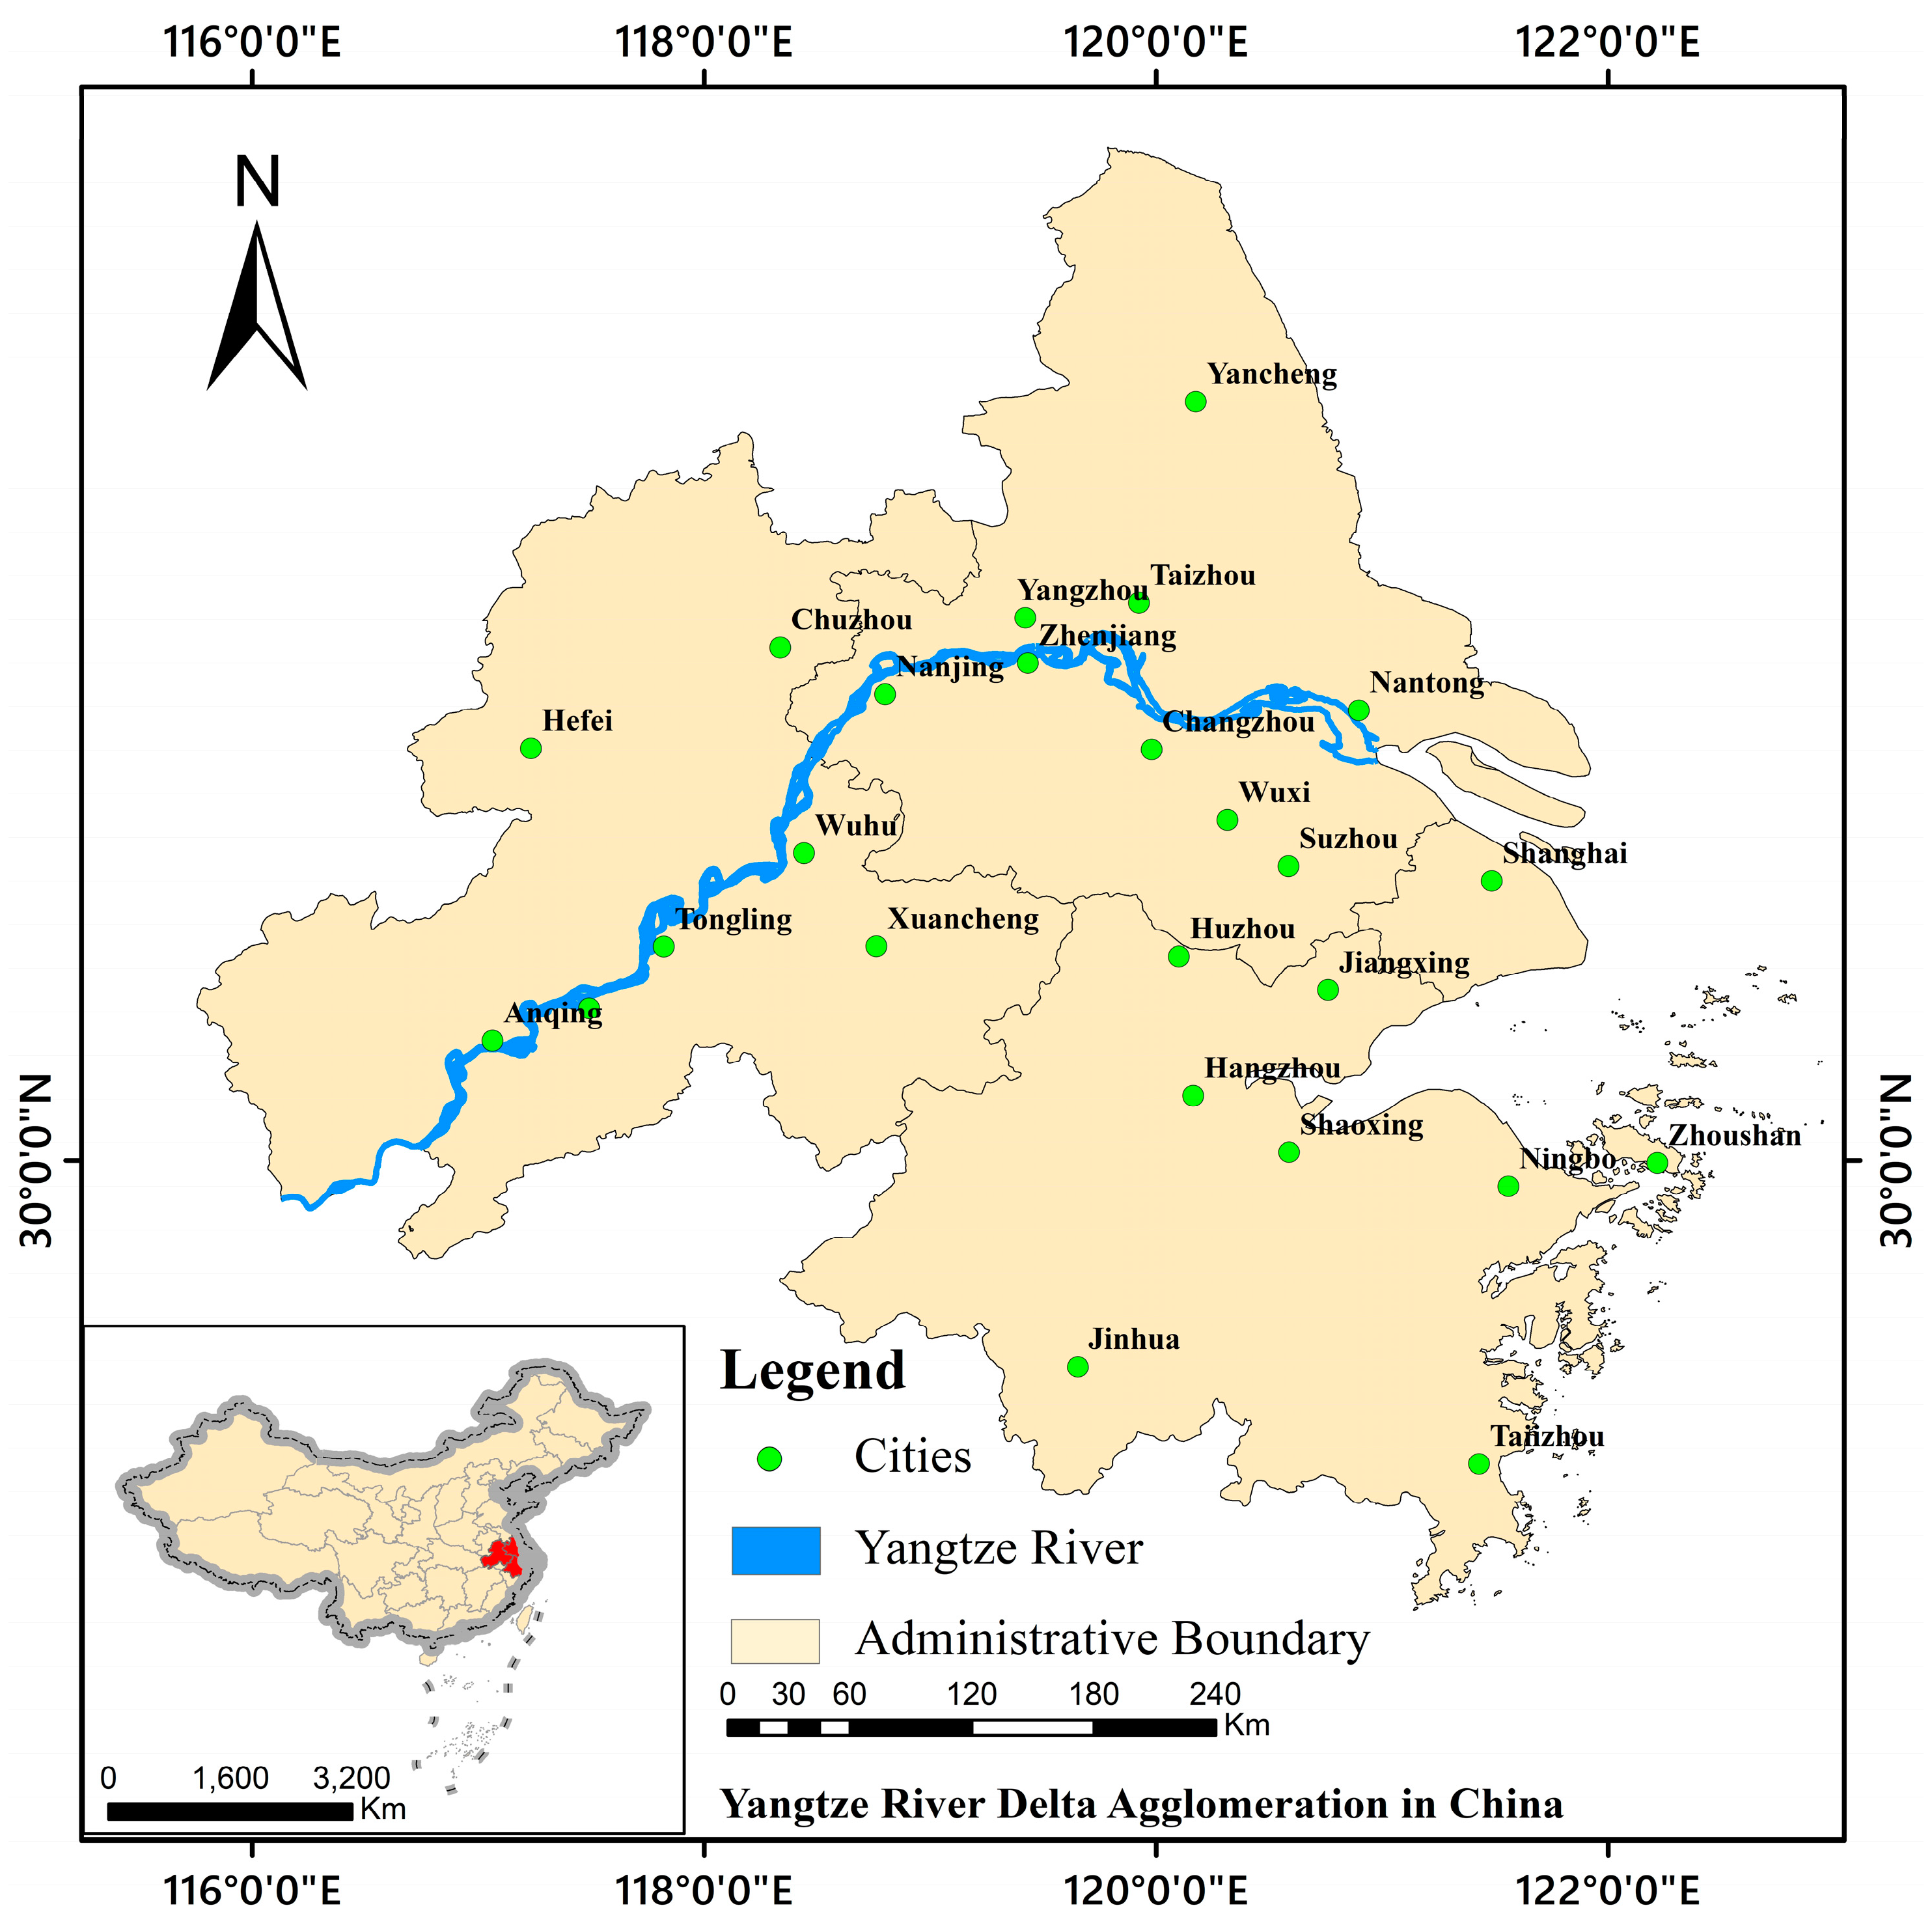
Figure 2.
Index System of Urban Livability in Yangtze River Delta Agglomeration.

Figure 3.
Spatial Distribution of Urban Livability in the Yangtze River Delta Urban Agglomeration in 2011 (a), 2016 (b), 2020 (c), and 2025 (d).
Figure 3.
Spatial Distribution of Urban Livability in the Yangtze River Delta Urban Agglomeration in 2011 (a), 2016 (b), 2020 (c), and 2025 (d).
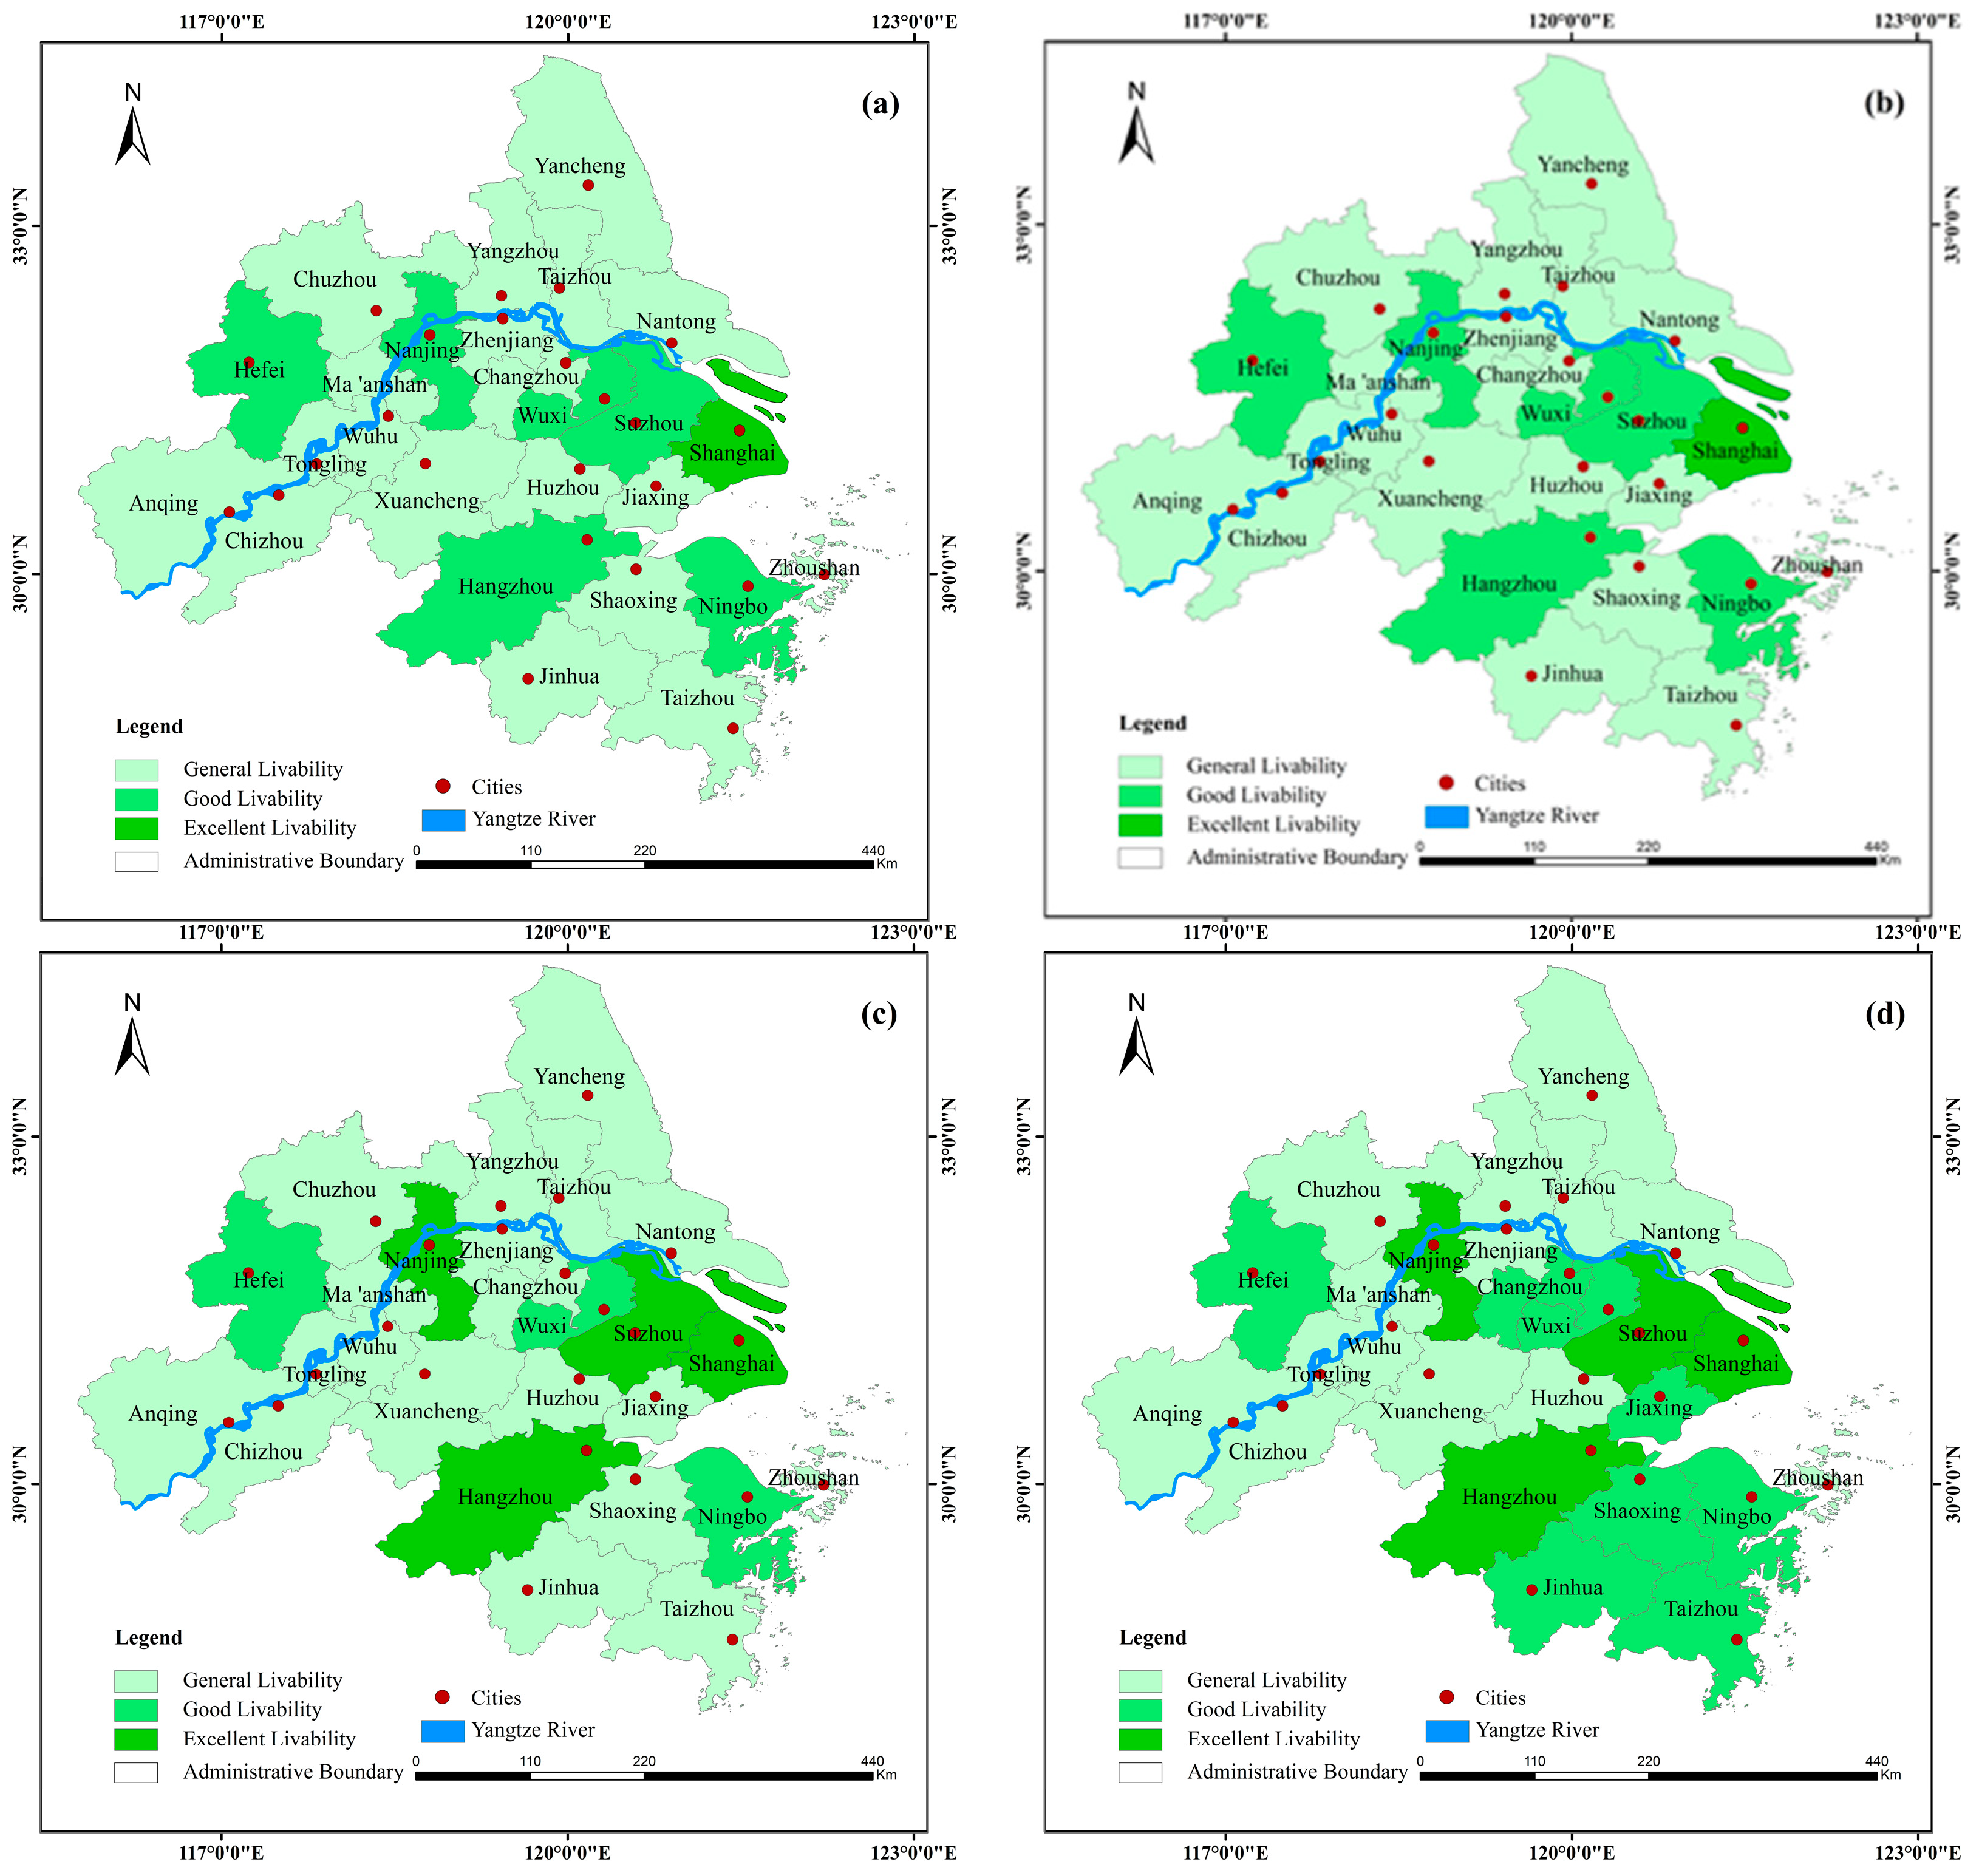
Figure 4.
The Performance Level of the Economic Subsystem, Medical and Education Subsystem, Resource Subsystem, Environment Subsystem, Construction Subsystem, and Insurance Subsystem of Cities in Yangtze River Delta Agglomeration.
Figure 4.
The Performance Level of the Economic Subsystem, Medical and Education Subsystem, Resource Subsystem, Environment Subsystem, Construction Subsystem, and Insurance Subsystem of Cities in Yangtze River Delta Agglomeration.
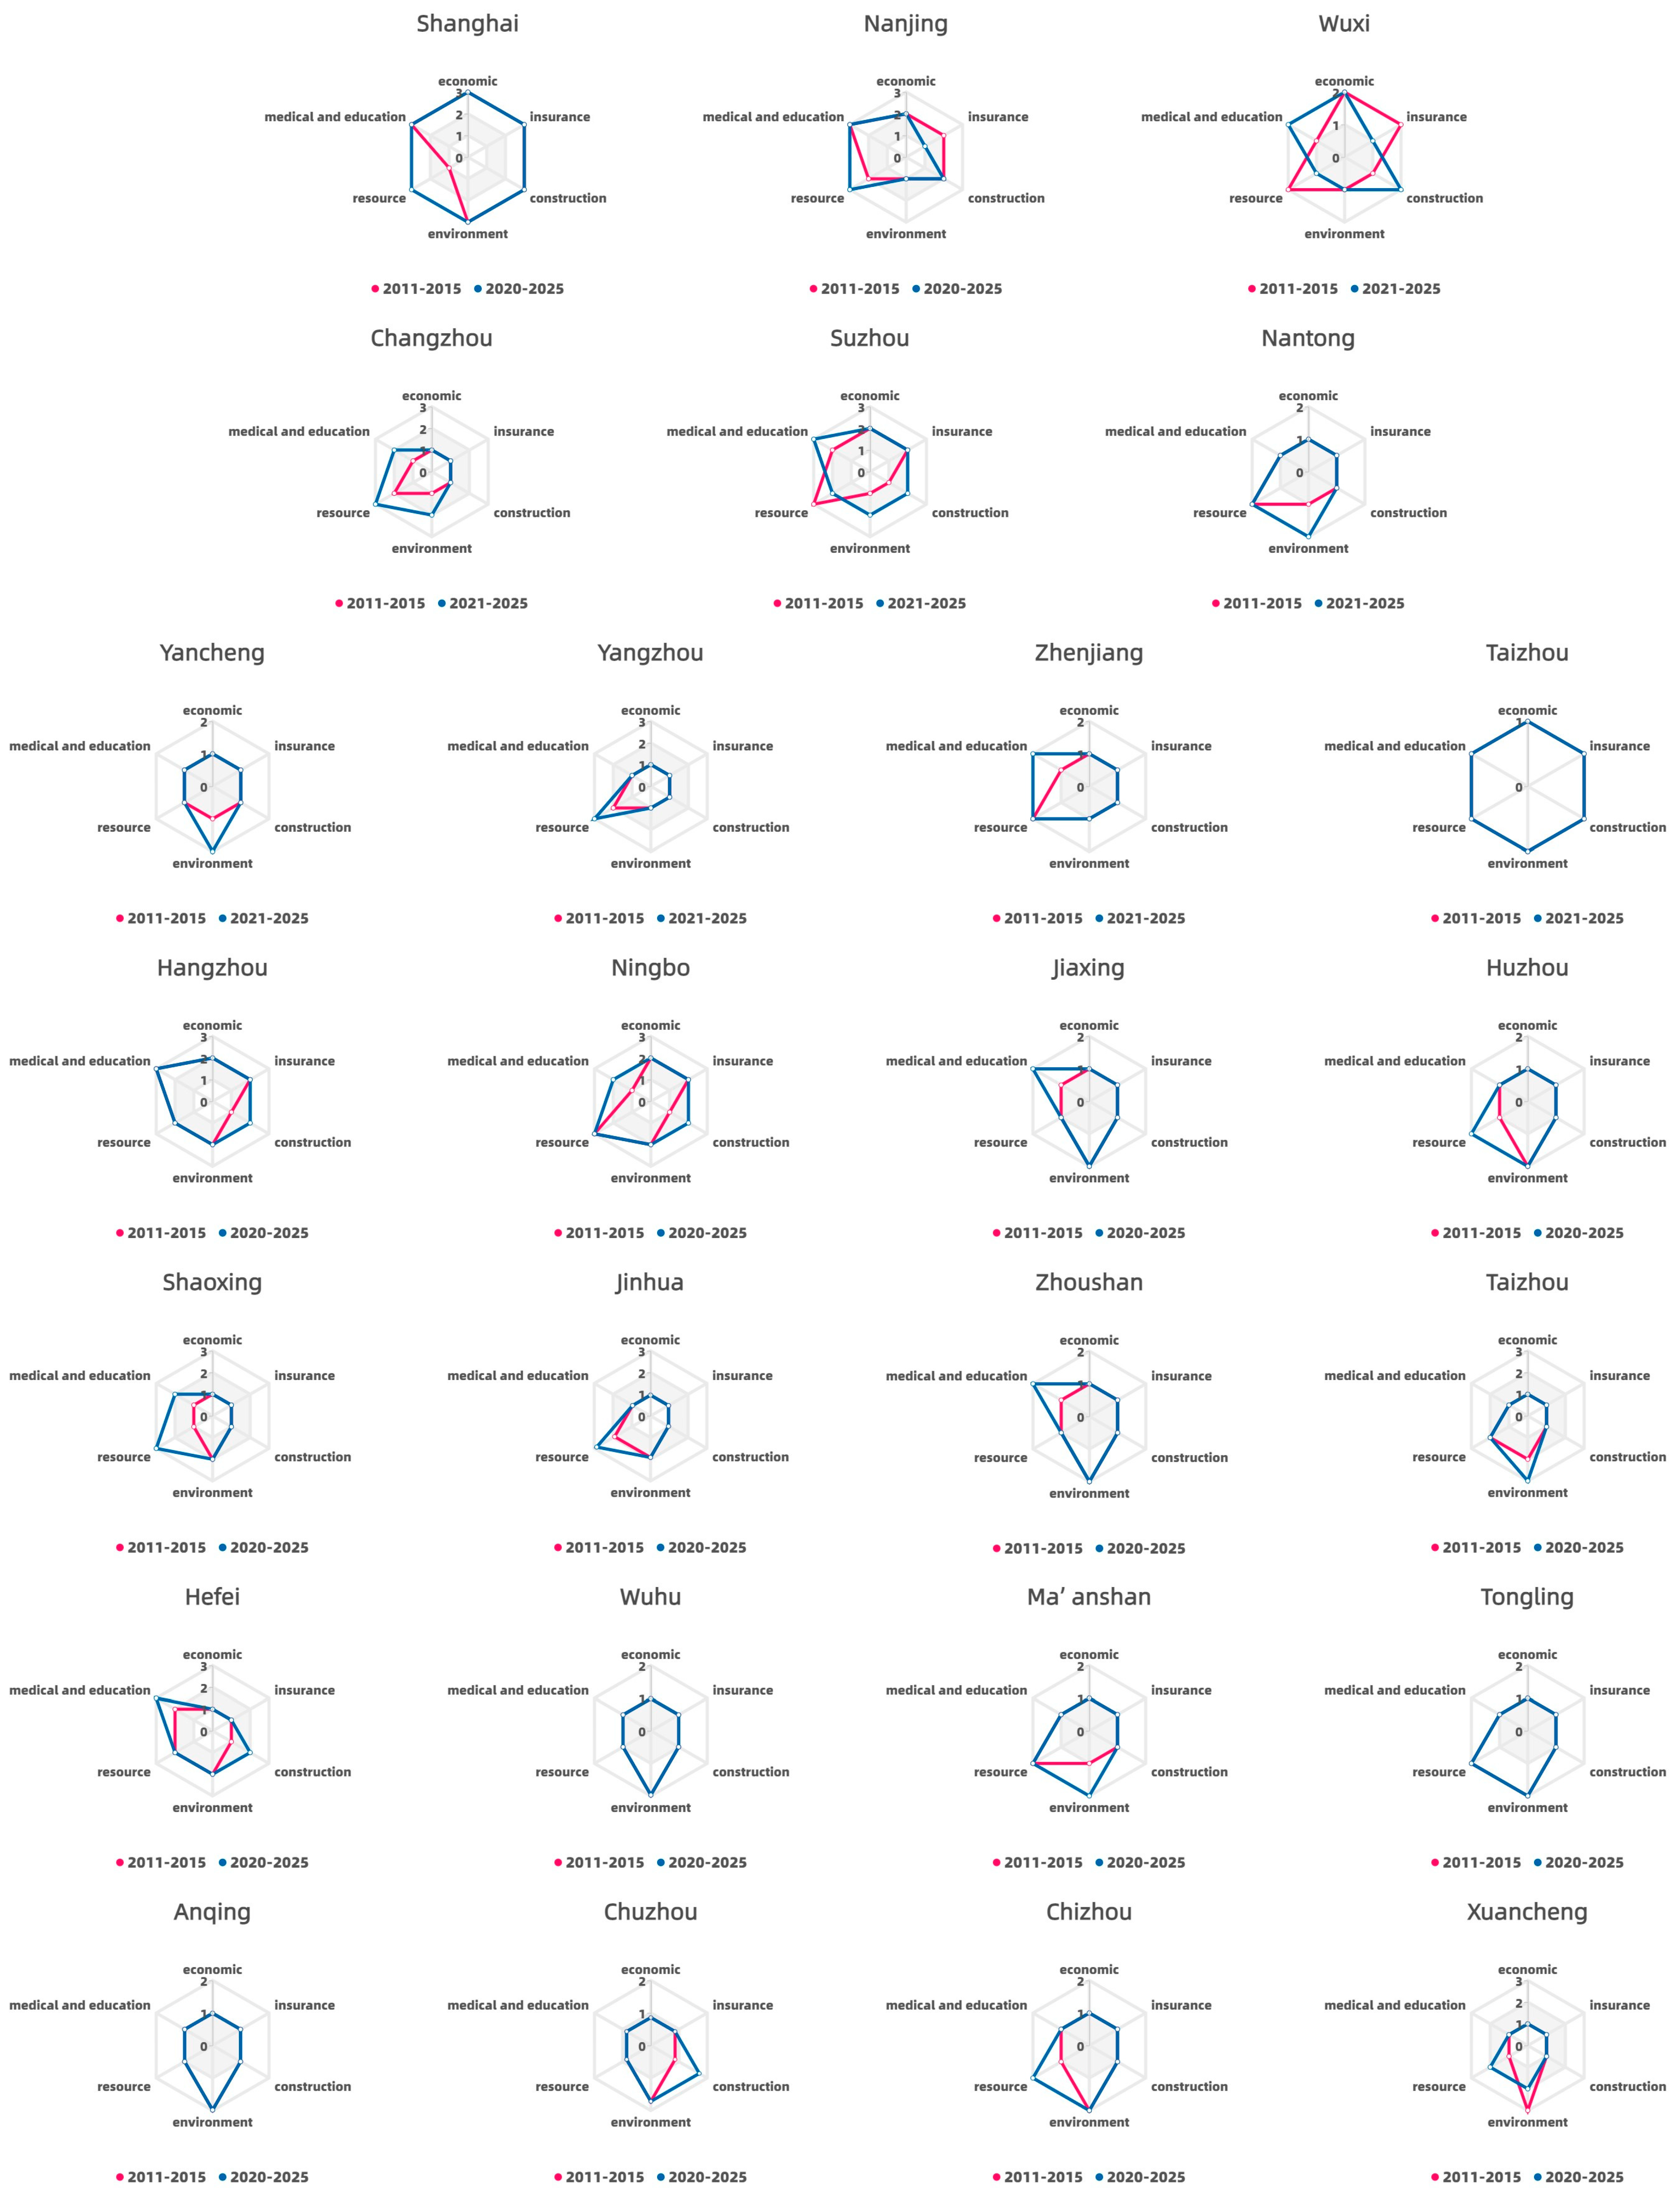
Figure 5.
Moran ’s I line Chart of Urban Livability.

Table 1.
Evaluation Index System of Urban Livability in Yangtze River Delta Agglomeration.
| System Layer | Subsystem Layer | Index Layer (Mean Value, Variance Value, and Weight Coefficient) |
|---|---|---|
| The urban livability evaluation system of Yangtze River Delta agglomeration | Economy | Gross regional output per capita (0.366, 0.044, 2.01%), Revenue from local general public budgets (0.084, 0.023, 7.95%), GDP growth rate (0.6, 0.016, 0.28%), Per capita disposable income of urban residents (0.381, 0.048, 1.96%), Proportion of tertiary industry in GRP (0.44, 0.033, 1.08%) |
| Insurance | Number of urban workers insured by basic old-age insurance (0.133,0.032,6.08%), Number of urban employees insured by basic medical insurance (0.134, 0.032, 6.27%), Number of people covered by unemployment insurance (0.129, 0.030, 6.42%), Number of registered unemployed persons in urban areas (0.76, 0.029, 0.34%), Number of criminal cases (0.879, 0.022, 0.22%) | |
| Environment | Days with air quality better than level 2 (0.574, 0.062, 1.19%), Urban built-up area green coverage (0.158, 0.007, 1.19%), Comprehensive utilization rate of industrial solid waste (0.74, 0.041, 0.52%), Sewage treatment rate (0.742, 0.047, 0.63%), Harmless disposal rate of domestic garbage (0.965, 0.012, 0.11%) | |
| Resource | Gas penetration (0.949, 0.022, 0.24%), Water supply penetration (0.978, 0.008, 0.08%), Per capita household water supply (0.328, 0.037, 2.12%), Per capita power supply (0.386,0.050,2.02%), Average selling price of residential commercial housing (0.807, 0.028, 0.32%) | |
| Construction | Number of mobile phone users at year-end (0.169,0.028,4.15%), Number of internet broadband access users (0.192, 0.033, 4.13%), Urban road area per capita (0.32, 0.038, 2.16%), The number of urban buses and trams in operation per 10,000 people (0.377, 0.043, 1.81%), The number of taxis in operation per 10,000 people in cities (0.26, 0.051, 3.70%), Length of city subway lines (0.055, 0.030, 17.96%) | |
| Medical and education | Number of hospital beds per 10,000 people (0.335, 0.046, 2.28%), Number of doctors per 10,000 people (0.334, 0.032, 1.59%), Number of college students per 10,000 people (0.196, 0.037, 4.06%), Number of universities (0.188, 0.063, 6.97%), Education expenditure in financial expenditure (0.108, 0.023, 5.71%), Public libraries contain books for every hundred people (0.205, 0.045, 4.47%) |
Table 2.
Changes in Urban Livability in the Yangtze River Delta Agglomeration from 2011 to 2025.
| City | 2011 Scoring | 2011 Ranking | 2025 Scoring | 2025 Ranking | Change Curve | City | 2011 Scoring | 2011 Ranking | 2025 Scoring | 2025 Ranking | Change Curve |
|---|---|---|---|---|---|---|---|---|---|---|---|
| Shanghai | 0.54 | 1 | 0.86 | 1 |  | Huzhou | 0.10 | 19 | 0.15 | 18 |  |
| Nanjing | 0.29 | 2 | 0.60 | 2 |  | Shaoxing | 0.13 | 10 | 0.23 | 10 |  |
| Wuxi | 0.19 | 7 | 0.33 | 7 |  | Jinhua | 0.12 | 15 | 0.23 | 9 |  |
| Changzhou | 0.14 | 8 | 0.22 | 12 |  | Zhoushan | 0.10 | 21 | 0.14 | 19 |  |
| Suzhou | 0.25 | 4 | 0.57 | 3 |  | Taizhou | 0.11 | 16 | 0.22 | 11 |  |
| Nantong | 0.12 | 11 | 0.16 | 16 |  | Hefei | 0.22 | 5 | 0.40 | 5 |  |
| Yancheng | 0.08 | 23 | 0.11 | 26 |  | Wuhu | 0.12 | 12 | 0.14 | 20 |  |
| Yangzhou | 0.10 | 18 | 0.17 | 15 |  | Ma’anshan | 0.11 | 17 | 0.12 | 23 |  |
| Zhenjiang | 0.12 | 14 | 0.20 | 13 |  | Tongling | 0.12 | 13 | 0.11 | 24 |  |
| Taizhou | 0.09 | 22 | 0.13 | 21 |  | Anqing | 0.10 | 20 | 0.13 | 22 |  |
| Hangzhou | 0.28 | 3 | 0.57 | 4 |  | Chuzhou | 0.08 | 24 | 0.18 | 14 |  |
| Ningbo | 0.21 | 6 | 0.37 | 6 |  | Chizhou | 0.06 | 26 | 0.11 | 25 |  |
| Jiaxing | 0.13 | 9 | 0.24 | 8 |  | Xuancheng | 0.06 | 25 | 0.15 | 17 |  |
Table 3.
Panel Model Test Quantity.
| Test Type | Testing Purpose | Test Value | Inspection Conclusion |
|---|---|---|---|
| F test | FE and POOL models are compared and selected | F (25202) = 55.432, p = 0.000) | FE model |
| BP inspection | RE and POOL models are compared and selected | χ squared (1) = 460.278, p = 0.000) | RE model |
| Hausman test | FE and RE models are compared and selected | χ squared (6) = 60.601, p = 0.000 | FE model |
Table 4.
Panel Model Analysis Results.
| Item | Coef | Std. Err | T | p | 95% CI |
|---|---|---|---|---|---|
| intercept | 0.38 | 0.144 | 2.641 | 0.008 | 0.662~0.098 |
| Ln (Industrial SO2 emissions ) | 0.007 | 0.004 | 1.907 | 0.057 | 0.014~0.000 |
| Ln (General Public Budget Expenditure for Social Security and Employment) | 0.001 | 0.011 | 0.132 | 0.895 | 0.020~0.022 |
| Ln (Fixed assets investment in urban Public utilities construction) | 0.007 | 0.003 | 1.956 | 0.051 | 0.000~0.014 |
| Ln (Total Retail Sales) | 0.018 | 0.011 | 1.621 | 0.105 | 0.004~0.039 |
| Ln (Education and healthcare expenditures) | 0.039 | 0.013 | 2.903 | 0.004 | 0.013~0.065 |
| Ln (Urban construction land area) | 0.014 | 0.011 | 1.217 | 0.223 | 0.009~0.036 |
| F (6202) = 54.771, p = 0.000) | |||||
| R ² = 0.848, adjusted R ² = 0.844 | |||||
| p < 0.05 p < 0.01 | |||||
Table 5.
Results of Model Validity Analysis and Reliability Analysis.
| Check the Name | Statistic | The Numerical |
|---|---|---|
| Cronbach reliability analysis | Cronbach alpha coefficient | 0.852 |
| KMO test | KMO value | 0.907 |
| Bartlett test of sphericity | The approximate chi-square | 10,426.434 |
| df | 496 | |
| p-Values | 0 |
Table 6.
Simulation Accuracy and White Noise Test of Urban Livability.
| City | MSE | Q Statistic p-Value | City | MSE | Q Statistic p-Value |
|---|---|---|---|---|---|
| Shanghai | 0.00073 | 0.573 | Huzhou | 0.00005 | 0.33 |
| Nanjing | 0.00014 | 0.847 | Shaoxing | 0.00001 | 0.485 |
| Wuxi | 0.00003 | 0.867 | Jinhua | 0.00002 | 0.603 |
| Changzhou | 0.00003 | 0.172 | Zhoushan | 0.00013 | 0.574 |
| Suzhou | 0.00026 | 0.527 | Taizhou | 0.00006 | 0.784 |
| Nantong | 0.00008 | 0.569 | Hefei | 0.00010 | 0.991 |
| Yancheng | 0.00004 | 0.404 | Wuhu | 0.00009 | 0.584 |
| Yangzhou | 0.00001 | 0.403 | Ma’anshan | 0.00009 | 0.961 |
| Zhenjiang | 0.00006 | 0.445 | Tongling | 0.00018 | 0.584 |
| Taizhou | 0.00007 | 0.314 | Anqing | 0.00011 | 0.687 |
| Hangzhou | 0.00003 | 0.772 | Chuzhou | 0.00001 | 0.309 |
| Ningbo | 0.00003 | 0.992 | Chizhou | 0.00002 | 0.964 |
| Jiaxing | 0.00002 | 0.237 | Xuancheng | 0.00002 | 0.643 |
Publisher’s Note: MDPI stays neutral with regard to jurisdictional claims in published maps and institutional affiliations. |
© 2021 by the authors. Licensee MDPI, Basel, Switzerland. This article is an open access article distributed under the terms and conditions of the Creative Commons Attribution (CC BY) license (https://creativecommons.org/licenses/by/4.0/).
Share and Cite
MDPI and ACS Style
Yang, Y.; Fang, S.; Wu, H.; Du, J.; Tu, H.; He, W. Spatiotemporal Trends and Driving Factors of Urban Livability in the Yangtze River Delta Agglomeration. Sustainability 2021, 13, 13152. https://doi.org/10.3390/su132313152
AMA Style
Yang Y, Fang S, Wu H, Du J, Tu H, He W. Spatiotemporal Trends and Driving Factors of Urban Livability in the Yangtze River Delta Agglomeration. Sustainability. 2021; 13(23):13152. https://doi.org/10.3390/su132313152
Chicago/Turabian StyleYang, Yichen, Shifeng Fang, Hua Wu, Jiaqiang Du, Haomiao Tu, and Wei He. 2021. "Spatiotemporal Trends and Driving Factors of Urban Livability in the Yangtze River Delta Agglomeration" Sustainability 13, no. 23: 13152. https://doi.org/10.3390/su132313152
Note that from the first issue of 2016, this journal uses article numbers instead of page numbers. See further details here.