
Wind Conditions at Pedestrian Level in Different Types of Residential Urban Development for a High Degree of Land Use Efficiency


1
Department of Environmental Design, Faculty of Architecture, Gdańsk University of Technology, G. Narutowicza 11/12 Street, 80-233 Gdańsk, Poland
2
Faculty of Power and Aeronautical Engineering, Institute of Aeronautics and Applied Mechanics, Warsaw University of Technology, Nowowiejska 24 Street, 00-665 Warsaw, Poland
*
Author to whom correspondence should be addressed.
Sustainability 2021, 13(24), 13612; https://doi.org/10.3390/su132413612
Submission received: 19 October 2021
/
Revised: 21 November 2021
/
Accepted: 1 December 2021
/
Published: 9 December 2021
(This article belongs to the Special Issue Data and the Built Environment: Reconciling Resources and Information for a Sustainable Living)
Abstract
:This paper addresses wind conditions in urban building development at the pedestrian level. The article aimed to identify aerodynamic phenomena around three types of multi-family housing developments with different forms and the same urban parameters of building development density (high density was taken into account). The aim of the research was mainly to achieve qualitative results that would lead to understanding fundamental processes and phenomena. Wind tunnel experimental studies were conducted on physical models at a scale of 1: 400 using visualization and erosion methods. These experiments yielded data regarding the arrangement of airflow directions and changes in airflow velocity, expressed as the amplification coefficient (α), the occurrence of which was caused by the presence of buildings. An analysis was conducted concerning wind conditions that constitute pedestrian comfort and influence the possibility for ventilation of spaces between buildings for the three selected models. The research results were compared, and an attempt was made to assess the most beneficial and the least favorable building development types in this respect.
1. Introduction
Wind phenomena play vital roles in creating the mesoclimate quality of modern cities. In addition to the generally accepted principles concerning the protection of residential spaces against high wind conditions, proper ventilation of such spaces should be ensured. Providing an area with proper ventilation facilitates temperature regulation and the removal of air pollutants. In temperate climate zones, such an approach entails the necessity to limit phenomena that both excessively intensify airflow velocities (owing to the need to ensure pedestrian comfort and protect buildings against cooling) and limit air circulation. The latter goal seems especially important given the urban heat island phenomenon, which proves burdensome for large cities and in the light of smog-related issues.
The genesis of research on wind conditions around buildings and within urban tissue has been described in the literature [1,2,3]. Since the 1970s, efforts to connect aerodynamic research with architectural design and urban planning have intensified [4,5,6,7,8,9]. Protection against adverse wind effects and attempts to shape the human environment microclimate with wind affect both architectural solutions (e.g., optimization of building forms regarding their surrounding airflow or the use of natural ventilation) and urban solutions (e.g., taking into account the so-called aerodynamic effects in shaping building development complexes). Moreover, the two above factors influence landscape design in cities. They translate into the deliberate formation of built-up area layouts with regard to open areas, including green areas (e.g., city ventilation corridor systems).
The development of numerical methods proved to be a milestone in research on wind effects around buildings [3,10,11]. Such methods provide reliable results. At the same time, they are relatively fast and inexpensive in examining simplified systems of solids that fail to fully reflect the complexity of the actual geometric structure of the city [12,13,14,15,16,17,18]. Cases that involve complex, multi-element building development systems pose more difficulty and are less frequently found in the source literature [6,8,10,19,20,21]. Ventilation and wind comfort assessments are commonly conducted by commercial companies and consultancy companies. Primarily, the results are not published but only occasionally presented at conferences or workshops. A notable lack is observed concerning systematic scientific investigations to provide data and information at a higher level of abstraction than the regular consultancy work. The present article provides an attempt to partially fill this gap to better understand the processes around typical yet complex layouts. As an interdisciplinary team, the authors aimed at a level as profound as possible but understandable to specialists in architecture, urban planning, and wind engineering. Although the relationships between building shapes, winds, and the quality of the city’s mesoclimate have been demonstrated in the source literature [22], the issue is not yet adequately reflected in urban planning practice. In Poland, for instance, wind issues are only considered in relation to the requirements for the design of high-rise buildings and buildings within the city ventilation corridors. Meanwhile, in large cities subject to constant structure densification, most erected building developments fail to be designed with wind phenomena in mind [23,24,25]. Yet, such buildings exert a genuine impact on wind phenomena.
This article continues to search for methods to support architects and urban planners in making decisions at the early investment planning stages that affect the possibilities of ventilating urban spaces. At these stages, land use efficiency provides the leading criterion. Investors and development companies use it as a guiding aspect to maximize profit; city authorities apply the criterion (while issuing regulations, including those regarding the permissible density of building development) to develop the sparse land resources available as effectively as possible. Therefore, dilemmas in establishing local law and investment planning are closely related to the building development density. This is the case in Poland and other countries where cities are subject to intensive compaction. From this point of view, the ability to compare wind phenomena around buildings with different geometric forms but similar land use efficiency parameters seems crucial. This article attempts to propose a method for such comparisons.
The present article aims to analyze aerodynamic phenomena at the pedestrian level around the three most common types of multi-family residential developments characteristic of urban areas. Theoretical geometric models corresponding to these types were applied. They differ in shape but occupy the plot area of the same size, which allows the creation of a similar number of apartments for a comparable number of inhabitants. Differences were observed, and a comparison was made between various wind conditions that account for pedestrian comfort and provide a possibility to ventilate spaces between buildings. Moreover, an attempt was made to assess the most and the least advantageous building developments in this respect.
Geometric models were applied to represent multi-family housing developments commonly found in European cities in temperate climate zones. Although the models are purely theoretical, they do include proper features from the scope of architectural design and urban planning.
The analyses were based on experimental research conducted in a wind tunnel using two complementary visualization techniques described below. Most importantly, the selected methods provide qualitative results that allow for a thorough recognition of the nature of flow phenomena in a given building layout configuration. The results may also offer a chance to develop an intuitive understanding of these phenomena.
2. The Research Subject
The research was focused on multi-family residential buildings developments, which constitute the majority of buildings in large cities. The research subject comprised three basic types of housing development:
- ▪
- Sectional developments—buildings with rectangular, not elongated layouts;
- ▪
- Linear developments—buildings with elongated layouts;
- ▪
- Quarter developments—buildings with inner courtyards.
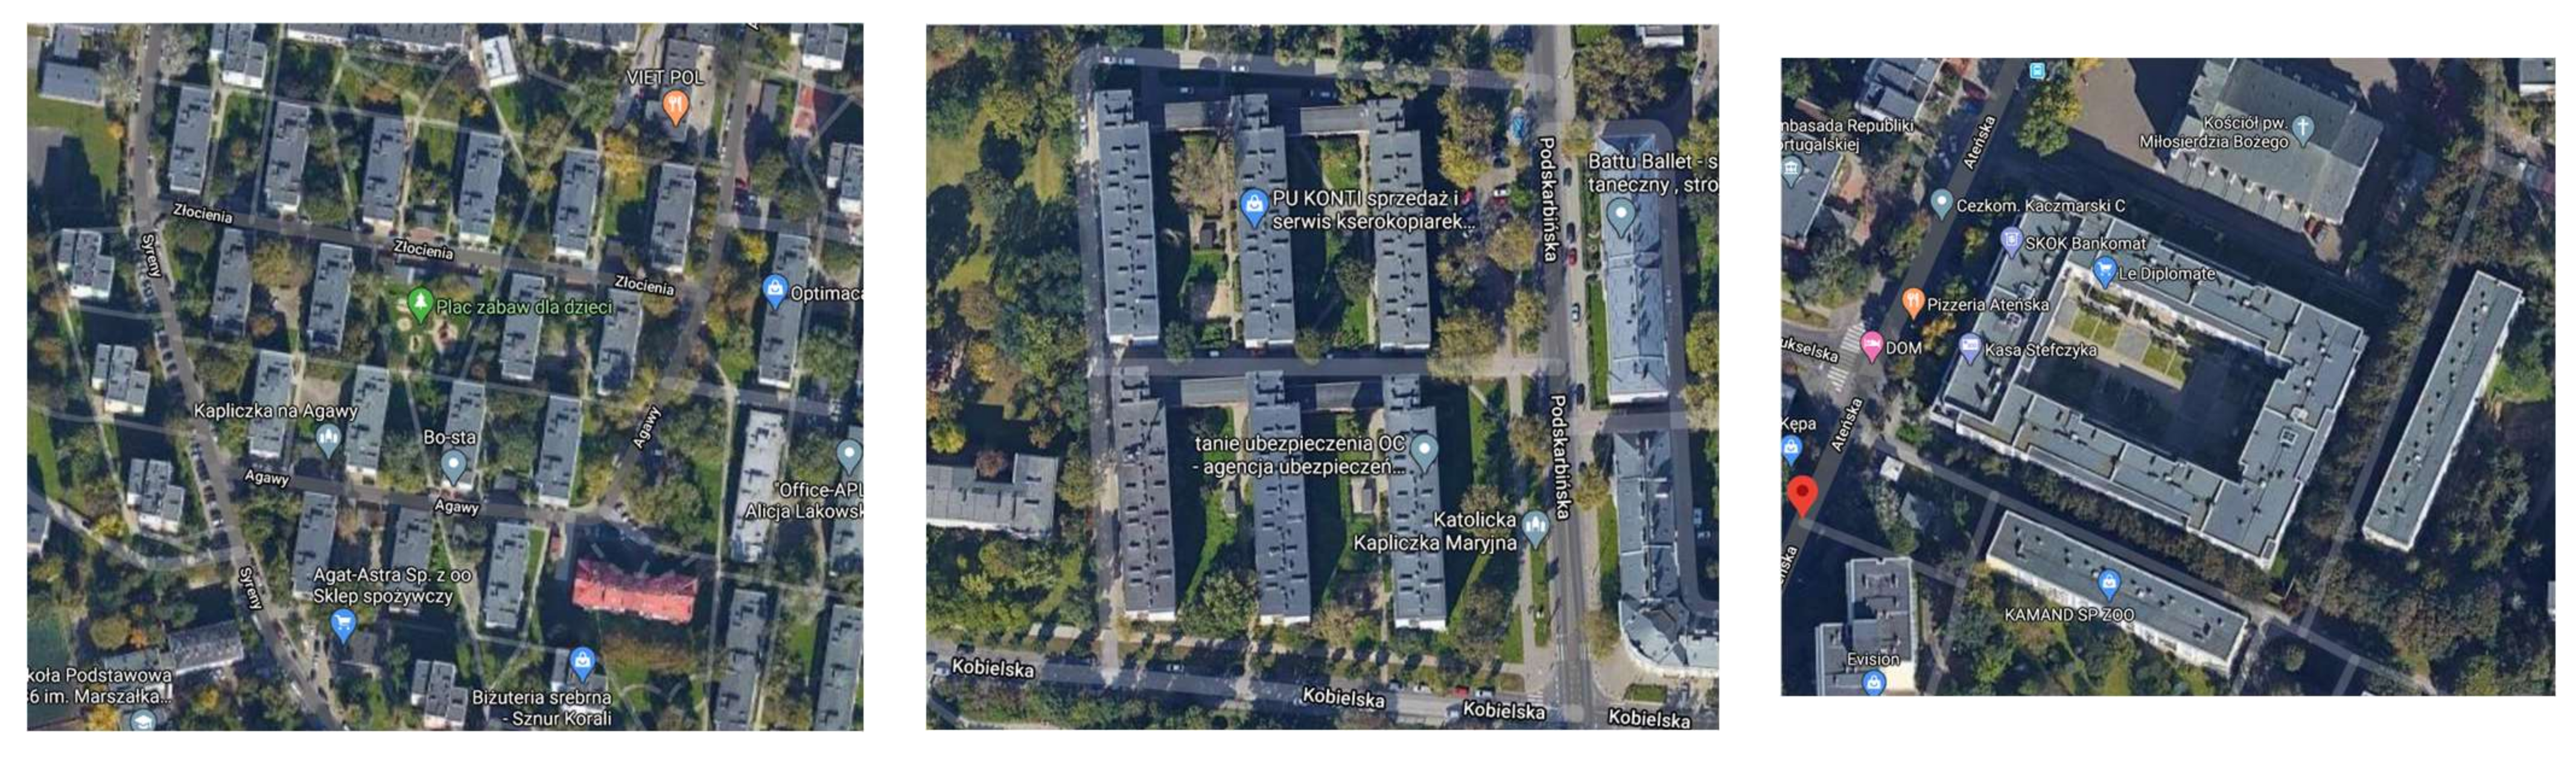
The first two types of building development mentioned above are characteristic of modernist trends from the beginning of the 20th century. On the other hand, the third one is based on the quarterly building pattern typical of historic urban layouts. Such geometric systems can be readily found in the spatial structure of many European cities. They also constitute the majority of multi-family building developments in Polish cities (Figure 1).
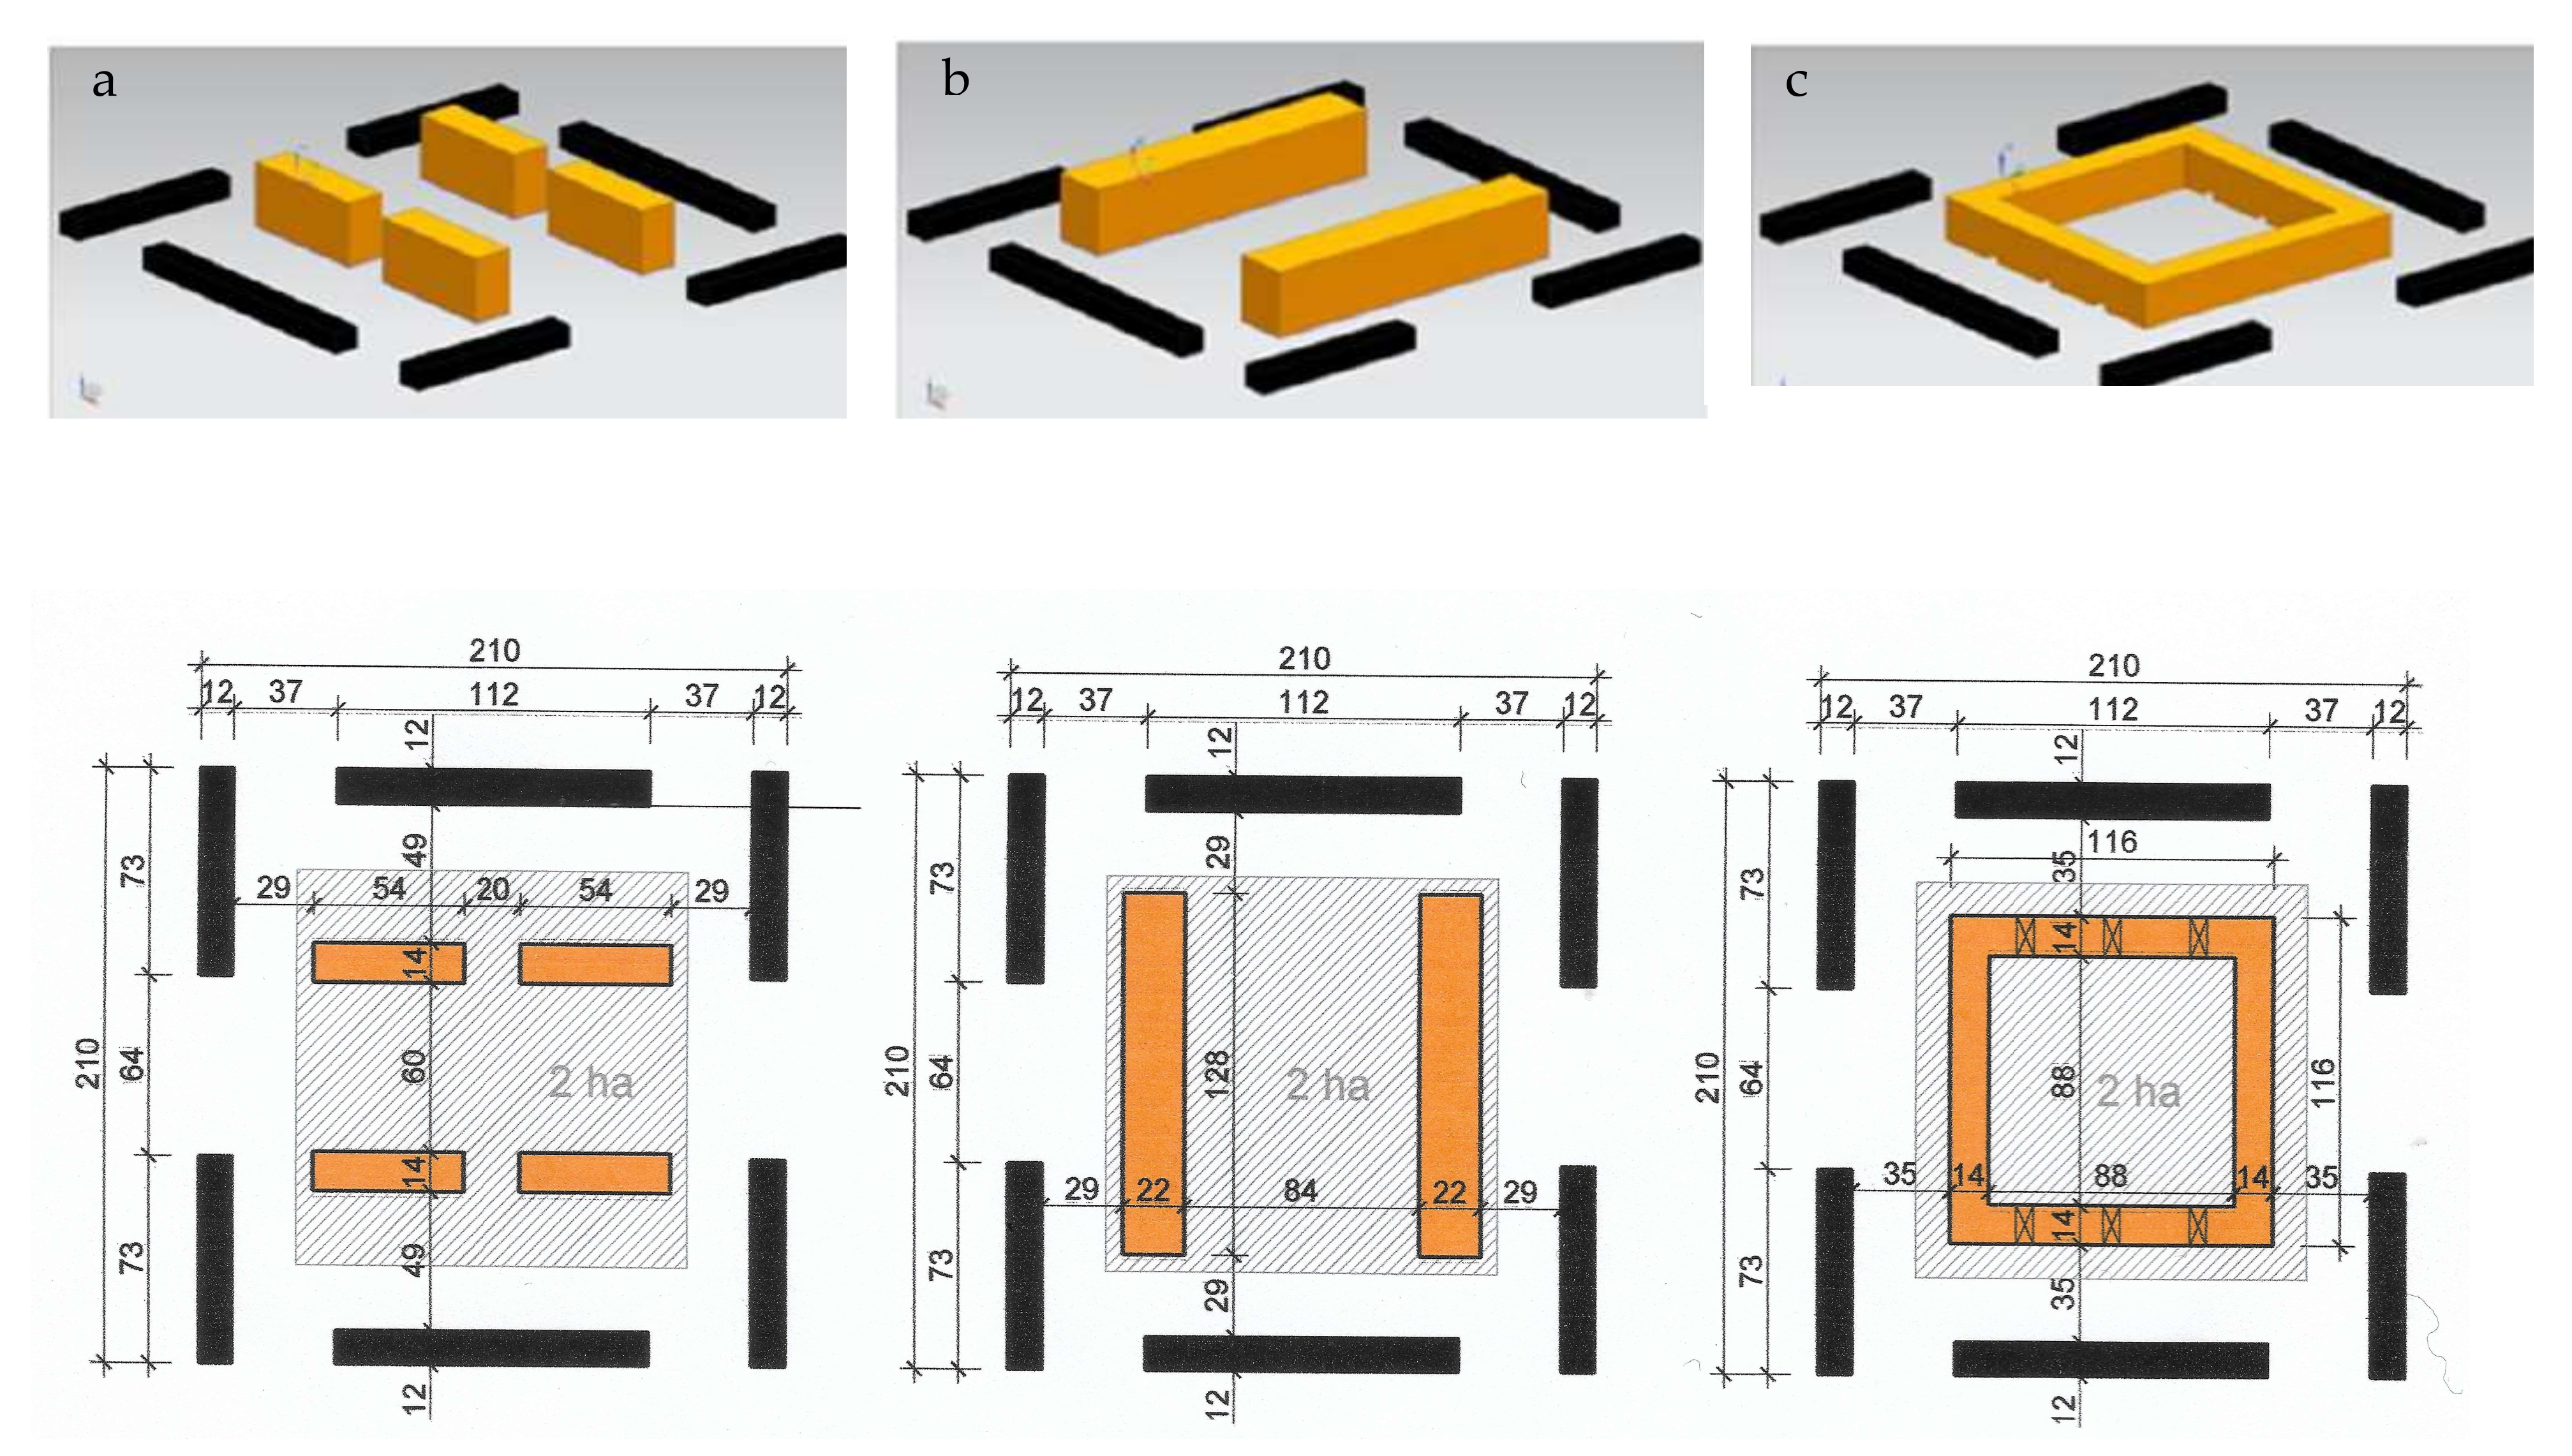
The research aimed to identify the phenomena within urban conditions that are the most problematic in terms of ventilation and the city’s mesoclimate quality. Undoubtedly, these conditions are observed in buildings with high land use density [26], which is typical for the central city zones as well as in the city outskirts. This situation results from the "urban sprawl" phenomenon referred to in the source literature. Therefore, models developed by Jan Pallado, an architect, were applied to illustrate the three types of multi-family building development [27]. The examples demonstrate how these building developments may be designed for different densities on a square-shaped plot of land, 2 ha in total. The models account for the most significant urban planning and architectural conditions, such as the necessary roads, car parks, biologically active and recreational areas, and daylighting conditions in apartments. The above conditions result from the regulations and standards in force in Poland and good design practices [28]. Among the models developed by Pallado, the ones that illustrate a high degree of land use efficiency were selected (Figure 2). They are described by the following parameters:
- ▪
- Number of flats per a hectare of the plot area, assumed 200–300 flats/1 ha;
- ▪
- Population density expressed in the number of residents per hectare of the plot area, assumed 600–900 residents/1ha;
- ▪
- Building development density expressed as floor area ratio (FAR, the ratio of the total area of building developments, all above-ground stories, to the plot area on which it is situated), assumed 200–300.
3. Research Methods
3.1. Research Techniques
The research was conducted in a wind tunnel with a closed measuring space of 1 m by 1 m (the tunnel’s cross section also equals 1 m by 1 m).
The wind structure at the ground level was modeled by designing the velocity profile and turbulence intensity distribution according to the following norm: PN-EN 1991-1-4: 2008 [29]. The velocity profile was obtained from the following formula: , where is wind velocity at a height of 10 m above the ground (m/s), and z is the height above ground level, in meters. The adopted wind velocity profile corresponds to the characteristics of building developments in suburban areas. The profile was assumed because many newly built housing estates in large cities are erected in satellite districts in the outskirts of cities. The intensity of turbulence was calculated from the following formula: Iv (z) = 1/ln (z/zo).
The boundary layer in the model tests above the wind tunnel’s floor was obtained by converting the dependencies for the ground layer onto the model scale of 1:400 (, where is wind velocity 400 mm above the tunnel floor (m/s)).
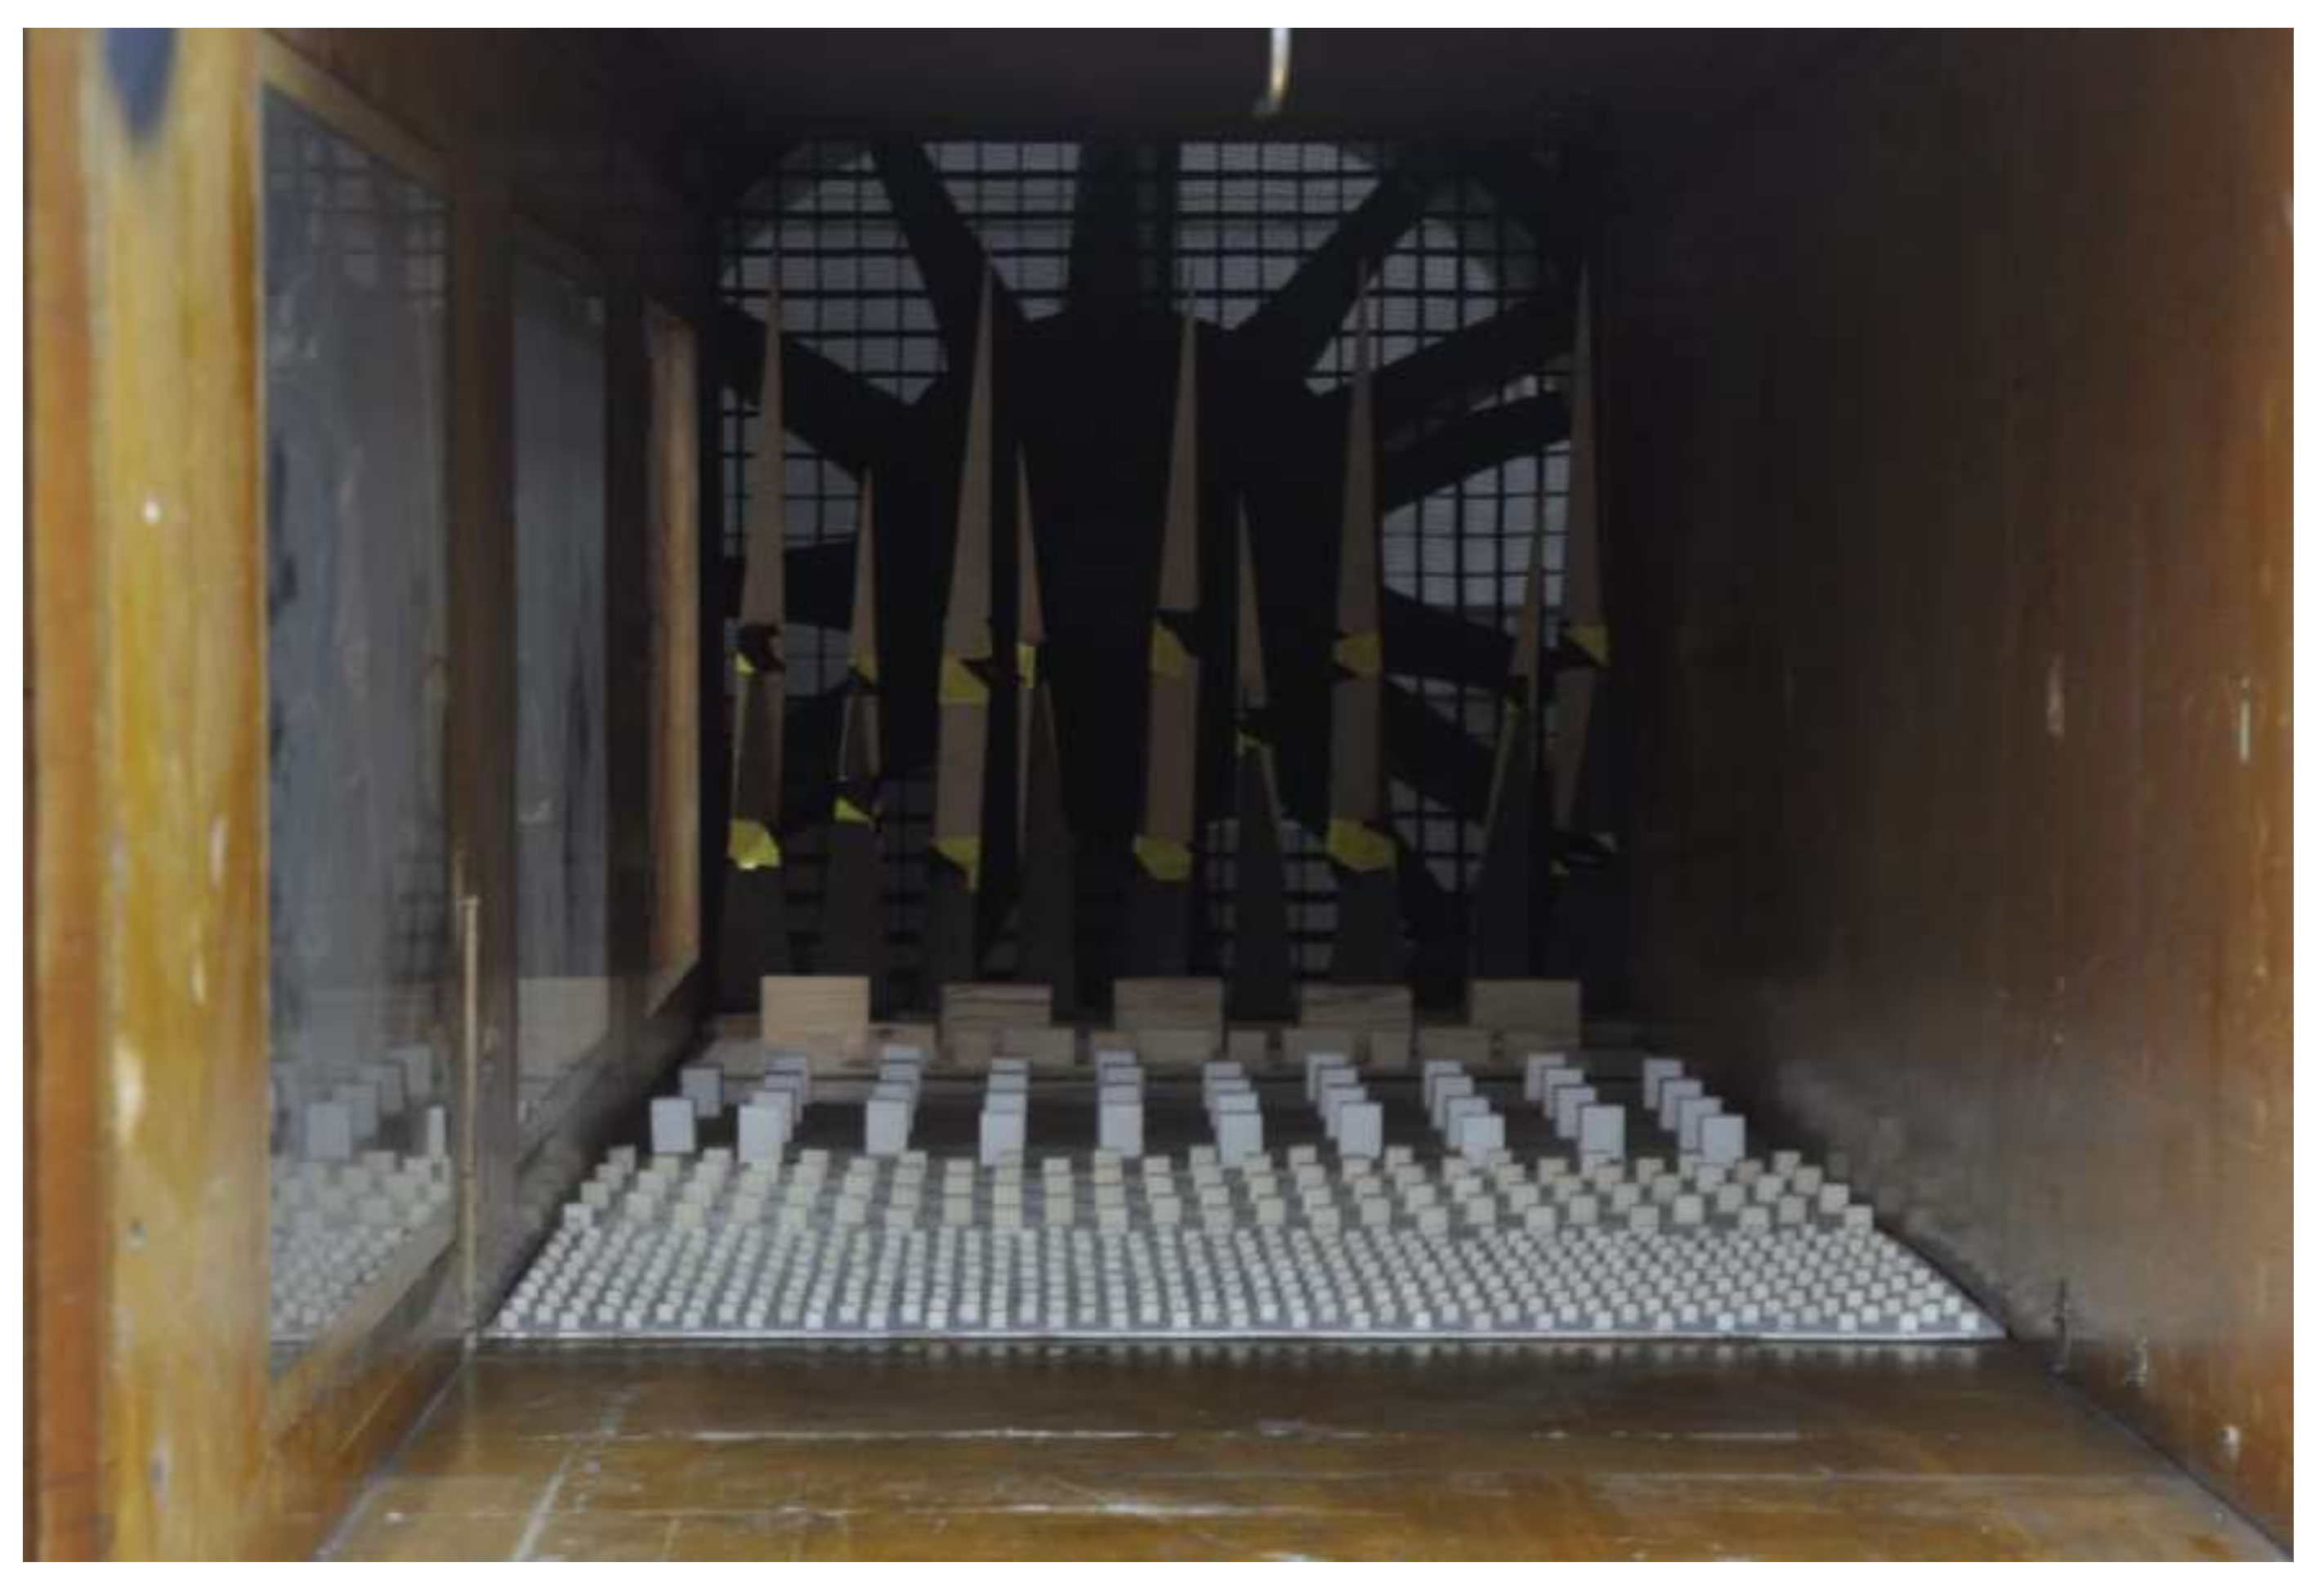
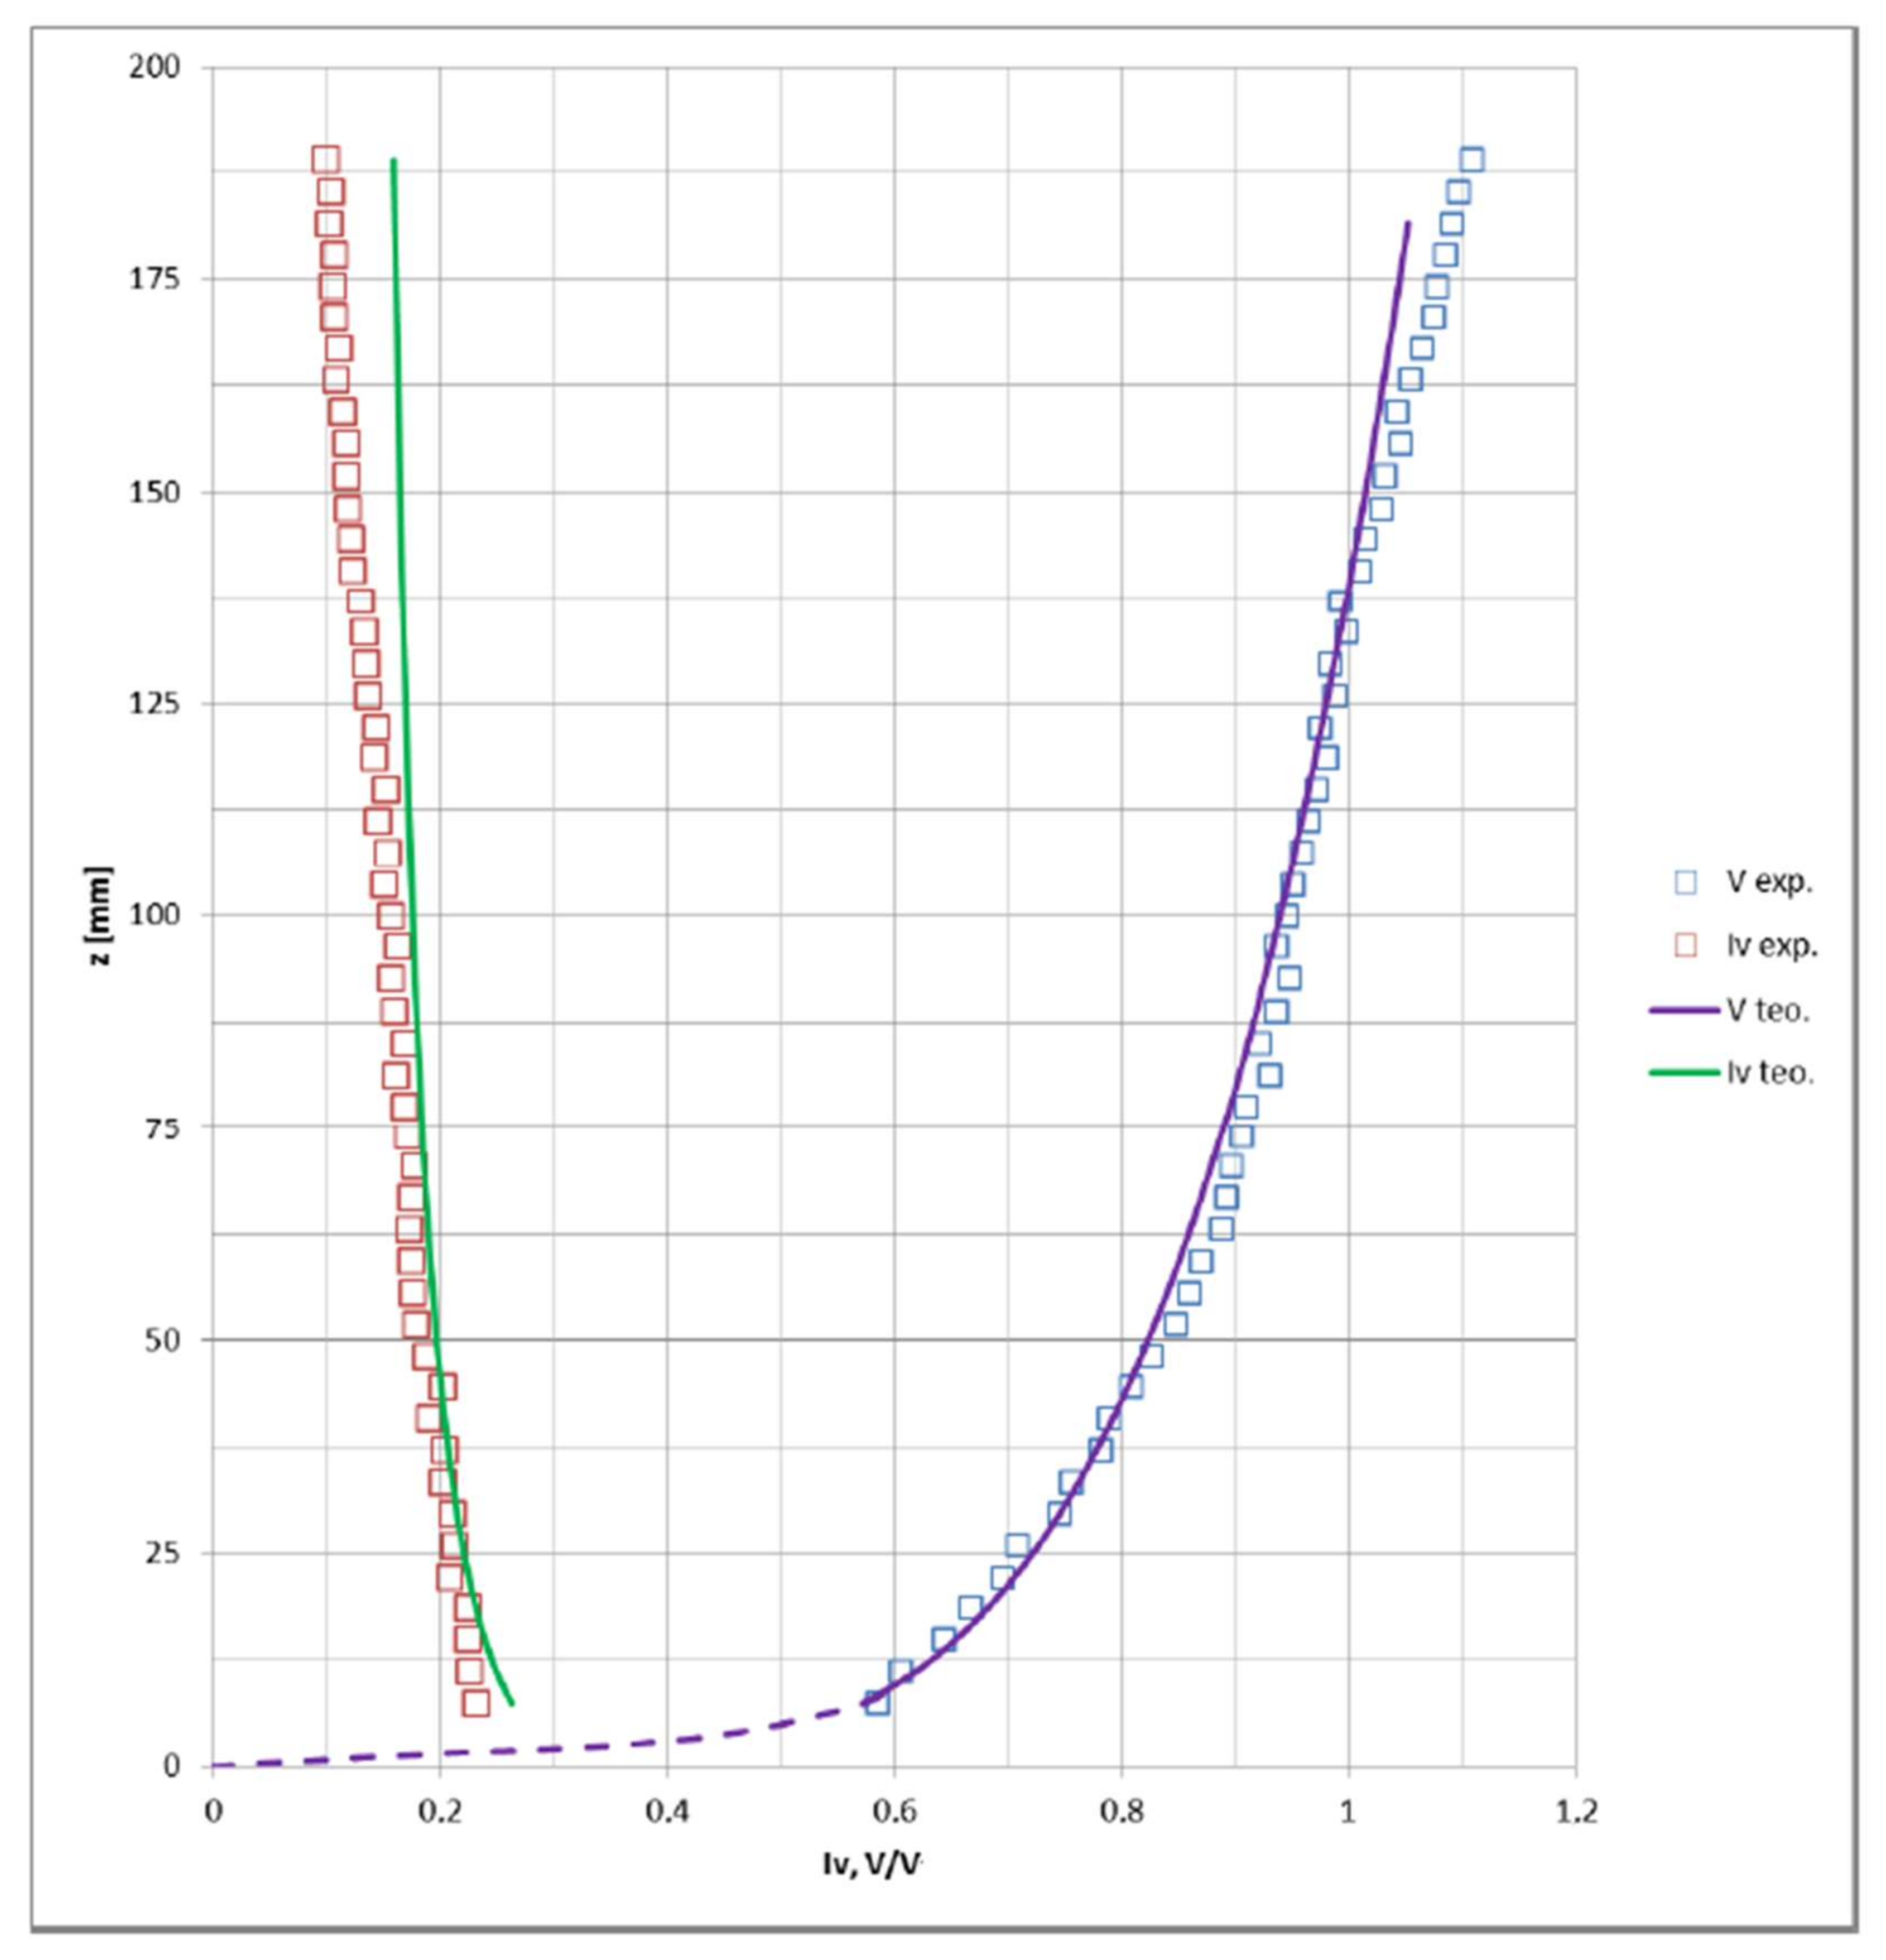
In order to map the ground layer within the tunnel, elements in the form of spikes and blocks were installed to disturb the wind flow and provide roughness (Figure 3). The elements were placed at the tunnel’s base in front of the study area where the modeled building development was set. Relatively good compliance was observed between the average velocity profile measurement results and the intensity of turbulence with the desired characteristics at the height of up to 100 m. This correspondence is sufficient for the study of the pedestrian area level (Figure 4).
Velocity was measured with a thermo-anemometer at 90 points along the entire length of the tunnel. As the probe was lowered, the distance between successive measurement points was reduced. The accuracy of the measurement was 0.2 m/s. Five measurements were taken for each measured point. Each measurement was obtained by averaging the probe readings by over 3 seconds.
To perform tests for this research study, the assumed Reynolds number was greater than . In the case of actual flow, it is higher by several orders. In tunnel studies, it is challenging to obtain a Reynolds number equal to the actual value. However, for objects with sharp edges, the flow is highly turbulized, and detachments and vortices appear. Therefore, the flow is relatively insensitive to the Reynolds number. Methods for ground-layer modeling similar to those applied in this research were described in [10,11,30,31] and elsewhere.
During the tests, fan operation parameters were controlled to ensure identical run-up of the wind tunnel at each measurement.
The model’s scale, i.e., 1:400, was adjusted to the size of the measurement area, i.e., a circle with a diameter of 1 m. The buildings were centrally located at a certain distance from the tunnel’s sidewalls so that their proximity would not significantly affect the flow.
Two complementary field methods—oil visualization and sand erosion technique— were chosen. Both techniques yield results that are understandable to non-specialists in the field of wind engineering. In addition, they are relatively simple and effective. Oil visualization reflects the wind flow directions, mainly when a series of images are analyzed that are recorded during the entire test (from the beginning of the tunnel’s run until the visualization image is made). The erosion method, in turn, shows the alterations in wind velocity.
The oil visualization method reflects the nature of physical phenomena better than the erosion method. It makes it possible to understand the structure of airflows at the ground level, lines of airflow currents, and the penetration of airstreams in built-up areas. A characteristic feature of this method is that oil, having high viscosity and due to its inertia feature, precisely depicts the main high-energy air stream. Moreover, oil resists lower-energy secondary movements in the flow, which result from a turbulized airflow. Visualization of flows by erosion method is more sensitive to minor local disturbances in the flow.
On the other hand, the erosion method makes it possible to obtain colorful images that depict zones with contours where constant airflow velocities occur in the examined area. Thus, zones in which the variable area ventilation intensity occurs are identified and visualized. As they present the amplification coefficient distribution, results obtained with the erosion method indicate areas where the velocity can increase or decrease significantly. Thus, erosion points to the spots that might become dangerous at high wind velocities, especially those that significantly exceed the pedestrian comfort limit, i.e., 5 m/s. Erosion also indicates the least ventilated places, where the airflow is relatively slow, i.e., airflow velocity drops below 2 m/s.
The results yielded by applying the two methods, despite being of qualitative nature, accurately reflect the flow image and allow for a meticulous analysis [1,11]. Most importantly, such analysis aims to properly recognize the nature of airflow phenomena in a given configuration of building layouts and develop an intuitive understanding of these phenomena.
3.1.1. Oil Visualization Technique
The building development model, on a scale of 1:400, was attached to the base made of black glass in the shape of a circle, whose diameter equaled 1 m. The surface of the base between the buildings was painted with oil with the addition of a white marker. In the case of the presented study, the model was exposed to airflow at a velocity of 16 m/s for 15 min. Pictures were taken every 15 seconds. On the basis thereof, a video was made to observe the nature of the flow around building models. Selected attempts were repeated, and no significant differences were revealed. The last photo from the sequence provided the final research result. It was marked with graphic symbols observed based on the entire material of the phenomenon (Figure 5).
3.1.2. Sand Erosion Technique
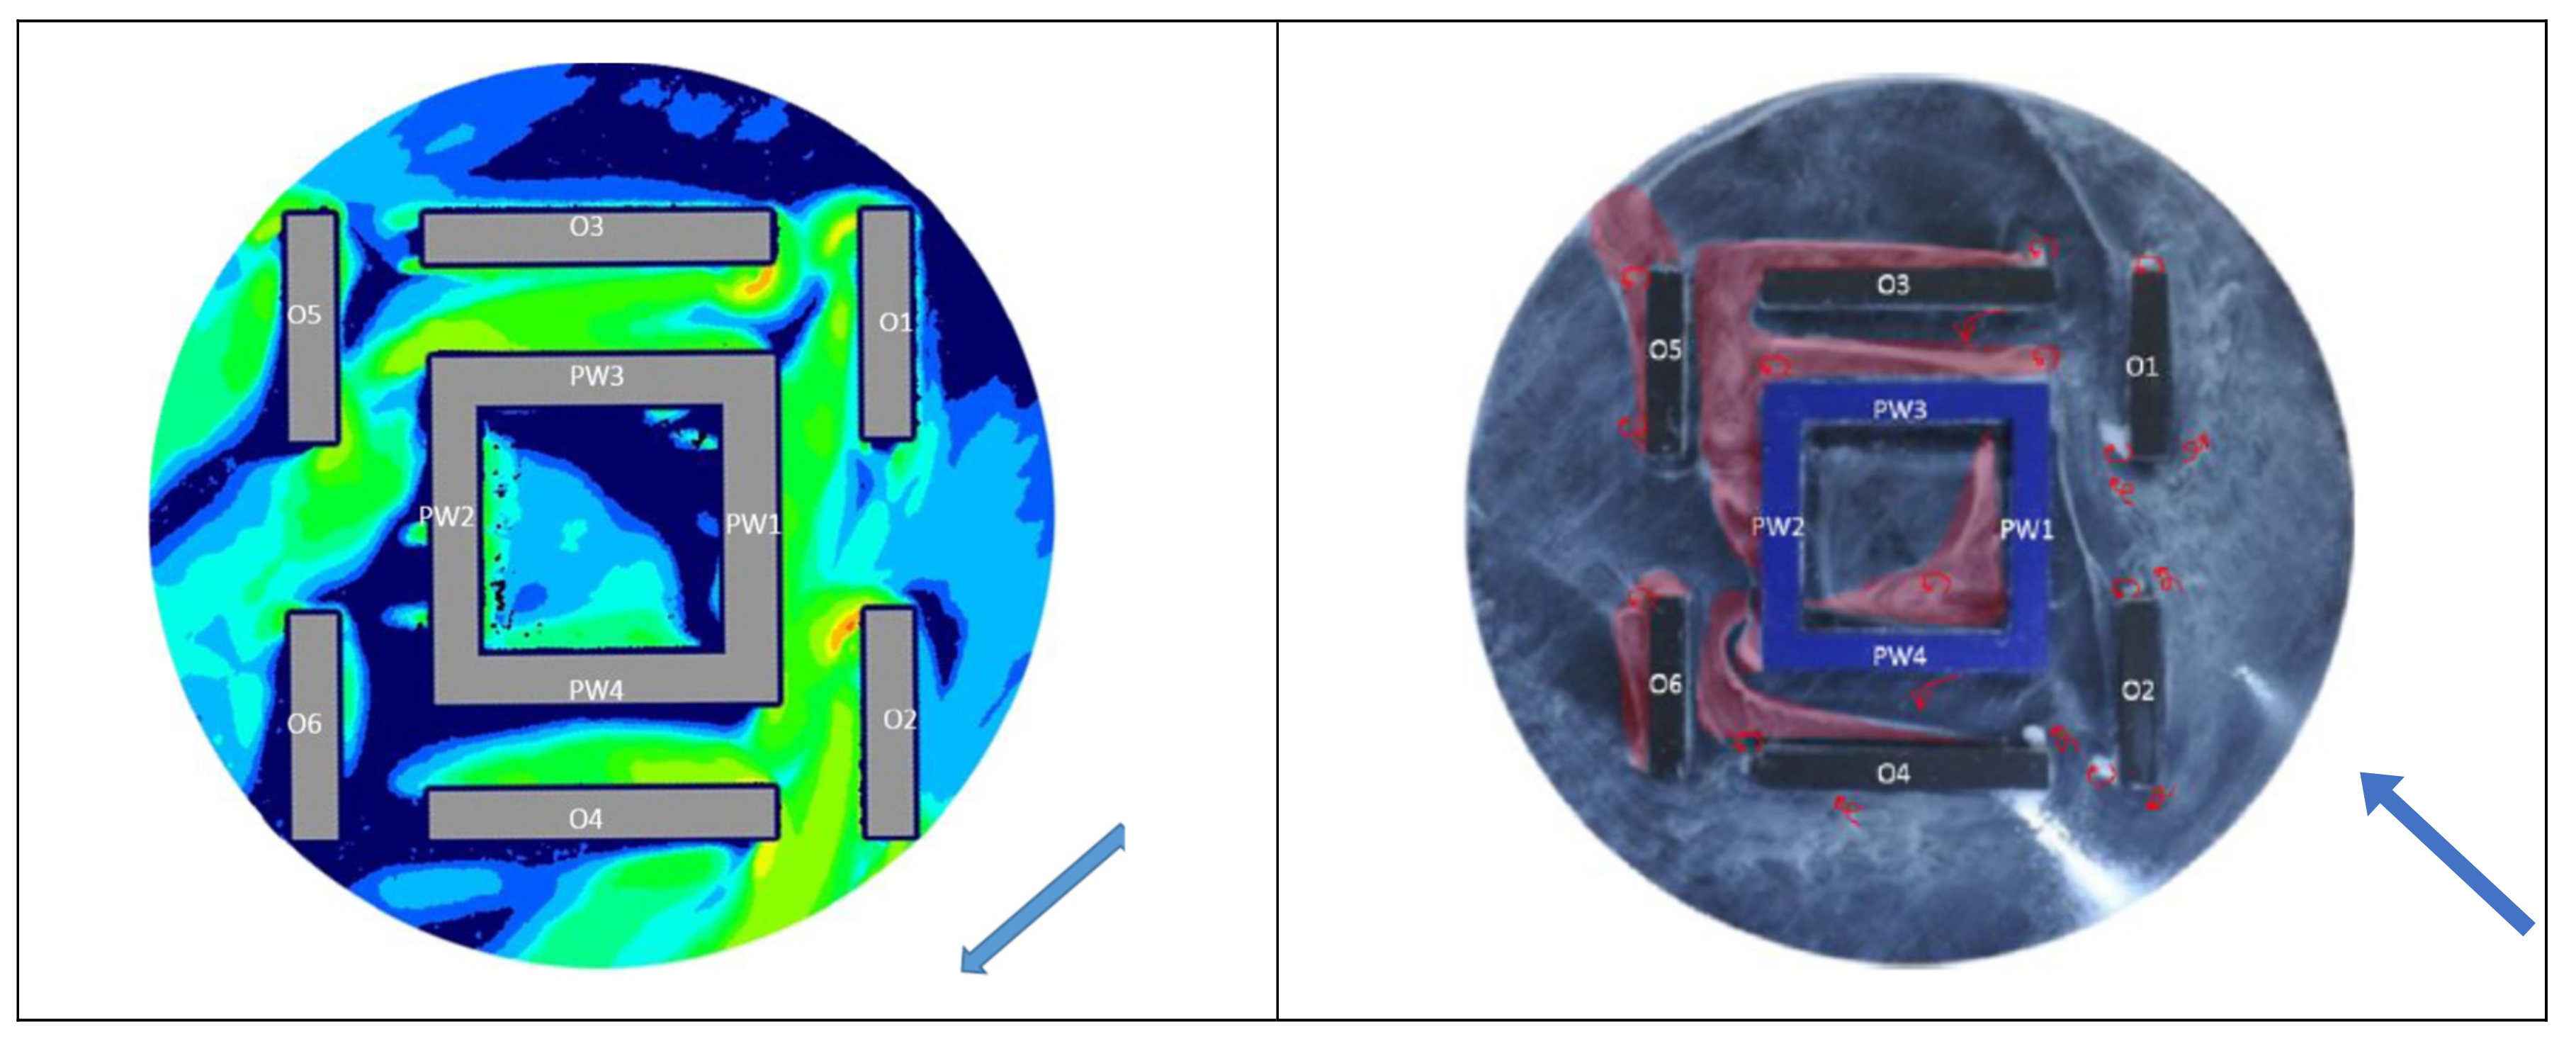
A detailed description of the sand erosion technique can be found in [1,30]. The research was conducted in accordance with the principles given therein. The study was conducted for a gradually increasing velocity, starting with the value of 7.3 m/s up to 16 m/s, approximately every 0.8 m/s. For velocities below 7 m/s, no erosion phenomenon was observed in the studied area. Based on the research, maps were developed on which the distribution of the amplification coefficient–α was marked in various colors (Figure 6). The factor shows the ratio of velocity that occurs in the flow at the ground level (at a distance of 1.75 m from the ground) in the presence of buildings to the reference velocity at the same altitude if the flow is undisturbed. As shown in [1,11], it is not necessary to measure the velocity in the boundary layer to determine the abovementioned coefficient. It is enough to arrive at the flow velocity for which the sand is blown off, present anywhere in the tunnel (in the case discussed here, at the height of 0.6 m from the base), and identify the currently set velocity. In zones where α > 1, the airflow accelerates due to the presence of buildings. These areas are defined as places of good ventilation. Though the likelihood of strong gusts of wind is present, this technique does not make them apparent. However, if α < 1, the flow in these areas slows down or forms stagnation zones (pollutant concentrations might maintain high levels or unpleasant odors might be captured, and natural ventilation inside buildings can be reduced, as external conditions trigger such ventilation).
When the average or maximum wind velocity (v) in the city is identified at the pedestrian level, an approximate velocity in the presented built-up areas can be determined as w = αv, based on the amplification coefficient.
Wind velocity occurring in Polish climate conditions fluctuates on an annual scale from 1.16 to 12.09 m/s, the average velocity equals about 3.5 m/s, while in the case of a city such as Warsaw, it reaches about 4 m/s [32]. Taking into account the wind comfort conditions described in numerous publications [33,34,35,36,37,38], the color layout may be interpreted as follows:
- ▪
- Red α ∈ (1.36–1.25)—the most intense ventilation; even at low wind velocities, the conditions are very uncomfortable for pedestrians;
- ▪
- Yellow α ∈ (1.07–1.15)—lower ventilation intensity; conditions are comfortable for pedestrians at moderate wind velocities, less so at strong winds;
- ▪
- Green α ∈ (0.83–1)—good ventilation regardless of wind velocity;
- ▪
- Blue α ∈ (0.71–0.77)—limited ventilation; good conditions only at strong winds;
- ▪
- Navy blue α ∈ (0.66–0.00)—poor ventilation.
3.2. Research Methodology
Each building development model was tested using both techniques for parallel, perpendicular, and oblique (at 45° angle) wind directions. All three tested variants of building developments were almost symmetrical. It could, thus, be assumed that the results for winds of the same courses but opposite directions would be analogous. Altogether, nine tests were performed using both techniques, and the results were compared.
In the first stage of the research, the characteristics of wind conditions were defined for each type of the examined building development, taking into account the three adopted wind directions. The results were then compared, to analyze the advantages and disadvantages each type of wind caused. Furthermore, an attempt was made to assess which types of developments are the most and the least advantageous in this respect.
4. Results
4.1. Sectional Developments
Based on the results of the oil visualization and erosion study (Figure 7), it can be observed that for all wind directions, wind conditions vary in different areas due to the large numbers of individual buildings. For the perpendicular wind direction, distinct horseshoe vortices are observable (a detailed description of such a wind structure can be found in [1] on the windward side of buildings set perpendicularly to the wind; recirculation zones are visible on the leeward side of building developments. Moreover, zones of limited air exchange (marked in navy blue in the erosion study) can be detected.
In the case of paralleled wind direction, the main airflow follows in a wide, open avenue between the OW1–OW3 and OW2–OW4 building lines. More closely enclosed by the adjacent building development layout, the spaces above and below this avenue tend to be less ventilated. In the corners on the windward side (mainly at the corners of O1 and OW1 buildings), not too extensive areas with accelerated airflow (orange and red for erosion study) are observed.
In the case of the oblique wind direction, the air exchange tends to be more intense than for other directions. Areas of restricted airflow are slight and occur only on the leeward side of elongated buildings (e.g., OW2, OW3, OW4 buildings). Beyond building edges, numerous air recirculation zones are visible. Areas of an increased amplification coefficient, i.e., with potentially more intense air exchange, can be observed around the OW1, OW3, O2, and O5 buildings.
4.2. Linear Development
Based on the results of the oil visualization and the erosion study (Figure 8), it can be noted that for the perpendicular wind direction, the flow is divided into three parallel courses along two narrow by-streets (between the layouts of the O1, O2, and LW1 buildings, as well as the O5, O6, and LW2 buildings), and along the avenue running between the elongated buildings (LW1 and LW2). The main avenue is enclosed by the surrounding building development; thus, the airflow in its area becomes inhibited. In the upper part of the avenue, a stagnation zone may be observed. Characteristic corner streams and small rotating vortices appear at the corners of the buildings. Zones of noticeably accelerated airflow can be observed on the windward sides of the gable walls of elongated buildings (orange and red in the erosion study).
In the case of the paralleled wind direction, a significant part of the space is quite well ventilated (the green color, which indicates the conditions most comfortable for pedestrians, predominates in the erosion study). The areas of inhibited airflow are not extensive and are located on the leeward side of the LW1 and LW2 buildings. Zones of potentially least comfortable airflow for pedestrians, i.e., those marked with the highest amplification coefficient value, occur only at the corners of these buildings on their windward side.
In the case of the oblique wind direction, the situation proves slightly more diverse. In this case, two opposing configurations were tested using the oil visualization and sand erosion methods (see arrows in Figure 6). The obtained results are analogous—on the windward side, near the gable walls of elongated buildings (LW1 and LW2), small zones of accelerated airflow are formed. Concurrently, airflow in the main wide avenue becomes slightly inhibited.
4.3. Quarter Development
Based on the results obtained from the oil visualization and erosion studies (Figure 9), very weak air movement can be observed for the perpendicular wind direction within the inner courtyard. This situation is caused by the deflection of wind from the windward wall of the building (PW3). The ventilation of the courtyard space fails to function in this case. An air stagnation zone covers almost the entire courtyard area. Gateways in the side wings of the main building (PW1 and PW2) manage only slightly to intensify the airflow. Minor stagnation zones became visible also on the leeward side of the remaining buildings.
Minor zones of intensified airflow are present at the windward corners of the buildings that surround the main building. Generally speaking, the space in the vicinity of the studied building is characterized by a reduced airflow amplification coefficient and, thus, with a lower level of ventilation.
For paralleled wind direction, a large stagnation zone becomes noticeable in the courtyard of the main building, although streams of air that flow in through the gateways of the courtyard can be seen. Clear stagnation zones can be observed on the leeward side of the main building and several surrounding buildings (O3, O4, O5, O6). The highest flow velocity zones appear in the corners of the windward edges of the O1 and O2 buildings and at the windward walls of the main building, as well as in the spaces between the buildings mentioned.
For oblique wind direction, the stagnation zone forms in the corner of the courtyard and on the leeward side of the main building, also from its corner. In this case, two opposing configurations were tested with the oil visualization and sand erosion methods (see arrows in Figure 7). In both cases, the results were analogous and comparable. The courtyard area can be assessed as poorly ventilated. The space surrounding the main building is efficiently ventilated (few air acceleration zones visible at the corners of several buildings), except for the aforementioned restricted airflow zone from the leeward side of the building.
4.4. Comparison of the Results for All Types of Development
Studies conducted using the oil visualization and sand erosion methods for all three types of building developments were compared. In the case of all layouts, areas with an increased amplification coefficient (α > 1.25) are present. These zones appear mainly at building corners. However, the areas where this risk occurs are scarce and appear mostly for one of the investigated wind directions. It also seems that such areas can be minimized with a slight geometrical modification of buildings (e.g., by slightly shortening the building layout or by correcting the shape of building corners).
Moreover, air stagnation zones (α ∈ (0.6–0.00)) appear in all types of layouts tested. In some cases, these zones are extensive. This limits air exchange and, consequently, overheats the space during the summer, hinders natural ventilation that buildings receive, and results in air pollution and unpleasant odor retention.
Based on analyses of all building development types, the linear building development seems the most favorable in terms of wind conditions observable in the pedestrian zone. The airflow detected during the experiments was least restricted in this type of building development. Moreover, air stagnation zones and accelerated wind zones were relatively small here for all the tested wind directions.
However, the comparison between the linear and the quarter building developments in terms of wind conditions at the pedestrian level is inconclusive. When analyzing section building development, it may be observed that the space between buildings is better ventilated. However, due to many corners and narrow openings between buildings, numerous local air swirls and instances of air movement acceleration appear. The aerodynamic layout is somewhat varied in a relatively small area, which can prove uncomfortable for pedestrians and residents of buildings.
Quarter building development seems less exposed to such diversification; however, in this case, research yields the most extensive air stagnation zones. The inner courtyard is relatively large, as the proportion of its width to the height of the building development (W/H ratio) equals 4.89. Despite this feature, as shown by the research presented above, the courtyard is still poorly ventilated for all the wind directions considered. The problem becomes particularly intensified in the case of the vertical wind direction, i.e., when the wind exerts an impact on the building, on the side with no gates, which tends to be more enclosed by the surrounding building development.
5. Discussion
The presented results do not fully reflect transient wind flow and ventilation. The result rather refers to the wind blowing at a constant speed from a given direction. The picture obtained in the study is incomplete, compared with actual wind conditions. To fully assess wind comfort, it would be necessary to accurately determine the location of a given fragment of building development within the city tissue and perform measurements using pressure sensors for more wind directions. However, as mentioned in the introduction, the presented research is not aimed at a quantitative but rather at a qualitative analysis to recognize the nature of phenomena in simple architectural systems. The obtained results are sufficient in this respect.
The method presented here is relevant concerning model situations, the analysis of which provides general knowledge and develops an intuitive understanding of wind phenomena. This issue is of high importance to architects and urban planners. The method is also helpful as a support in the design process. It can be applied to evaluate selected situations at an early urban design stage when basic decisions are made to select the most appropriate type of development. Thus, despite the reservations concerning results’ accuracy, especially the quantitative aspect thereof, the method used in the study can be considered sufficient for the research purposes indicated in the introduction. Later, its effectiveness (e.g., quality of results, time consumption, costs) should be compared with CFD techniques [10]. The study could perhaps serve as an initial design support stage and simultaneously optimize digital model parameters and verify the CFD research results in further stages.
6. Conclusions
The research presented in the above sections made it possible to recognize and compare airflow around buildings for three types of housing developments (sectional, linear, and quarter) for a high degree of land use efficiency. The research was conducted based on theoretical models. However, it seems that by considering a variety of aspects regarding architectural design and numerous urban planning issues, these models manage to reliably depict the spatial conditions for these three types of building developments. It cannot be assumed that the same phenomena will occur around actual buildings constructed according to the typology mentioned above, but the nature of phenomena may be similar.
In the studied models, the problem of limited ventilation possibilities is more complex than the issue associated with wind acceleration to speeds uncomfortable for pedestrians. Similar conclusions can be found in studies on downtown building development [39] with a much denser development density and more complex geometry than the one adopted in the study above. Regarding the urban climate quality, it is significant to confirm the conclusion for much simpler models than those adopted above, characterizing housing estates across large urbanized areas.
The studies failed to provide the data required for a detailed comparative assessment. It was shown that in the case of linear building development, the most favorable wind conditions at the pedestrian level occur. In most parts of the area surrounding the buildings, favorable conditions for both ventilation and providing pedestrian comfort are observable. Sectional and quarter developments prove less advantageous, each so for a different reason, as described above. From the point of view of city climate issues, it seems that special attention should be paid to shaping quarter building developments, as such layout tends to be most exposed to the air stagnation phenomenon. Although open toward the sky, the courtyard space is surrounded by buildings on all its sides. Studies that address insufficient ventilation in the case of this type of building development can be found in [40]. The research presented above confirms that the problem arises for a simplified urban geometry and the investigated wind directions. This type of building development prevails in the case of newly designed multi-family residential buildings (e.g., this fact may be observed in large Polish cities). If quarter building developments are appropriately designed, the most efficient land use would be achieved, given the restrictions on building height. Research has shown that in the case of quarter building developments, the location of the gateways (or other "openings" of internal courtyards) concerning the surrounding buildings is of great importance to the airflow. Therefore, optimizing airflow in the surroundings of quarter building developments should constitute an essential criterion in design.
The research conducted in this paper also induces a more general reflection on urban planning methods. The studied building development models are correct regarding the regulations in force in Poland and other informal design principles that result from practical conditions. Despite this fact, the weakness of one type of building development (it seems that the one most widespread currently in Poland) was demonstrated in the scope of ventilation of urban spaces. This fact means that the problem is not well recognized yet and is associated with urban planning practice, which justifies further research in this field. From this point of view, more extensive research should be conducted to establish the interdependencies between the possibility of proper city ventilation and various urban indicators that regulate building shapes, as in [21,39]. This would allow for the development of new indicators to be introduced into design practice, as stated in [7].
Author Contributions
Conceptualization, K.Z.-J., M.P. and R.I.; methodology, K.Z.-J. and M.P.; validation, K.Z.-J., M.P. and R.I.; writing—original draft preparation, K.Z.-J.; writing—review and editing, K.Z.-J., M.P. and R.I.; visualization, R.I.; supervision, M.P. and K.Z.-J.; project administration, R.I.; funding acquisition, R.I. All authors have read and agreed to the published version of the manuscript.
Funding
This research received no external funding.
Institutional Review Board Statement
Not applicable.
Informed Consent Statement
Not applicable.
Data Availability Statement
Not applicable.
Conflicts of Interest
The author declares no conflict of interest.
References
- Blocken, B.B.; Carmeliet, J. Pedestrian Wind Environment around Buildings: Literature Review and Practical Examples. J. Therm. Envel. Build. Sci. 2004, 28, 107–159. [Google Scholar] [CrossRef]
- Blocken, B.; Carmeliet, J.; Stathopoulos, T.; Hensen, J. Application of computational fluid dynamics in building performance simulation for the outdoor environment: An overview. J. Build. Perform. Simul. 2011, 4, 157–184. [Google Scholar] [CrossRef]
- Blocken, B. 50 years of Computational Wind Engineering: Past, present and future. J. Wind. Eng. Ind. Aerodyn. 2014, 129, 69–102. [Google Scholar] [CrossRef]
- Daniels, K. The Technology of Ecological Building; Birkhauser: Berlin, Germany, 1998. [Google Scholar]
- Blocken, B.; Persoon, J. Pedestrian wind comfort around a large football stadium in an urban environment: CFD simulation, validation and application of the new Dutch wind nuisance standard. J. Wind. Eng. Ind. Aerodyn. 2009, 97, 255–270. [Google Scholar] [CrossRef]
- Wong, M.S.; Nichol, J.E.; To, P.H.; Wang, J. A simple method for designation of urban ventilation corridors and its application to urban heat island analysis. Build. Environ. 2010, 45, 1880–1889. [Google Scholar] [CrossRef]
- Krautheim, M.; Pasel, R.; Pfeiffer, S.; Schultz-Granberg, J. City and Wind. Climate as an Architectural Instrument; DOM Publishers: Berlin, Germany, 2014. [Google Scholar]
- Liu, C.-H.; Ng, C.-T.; Wong, C.C. A theory of ventilation estimate over hypothetical urban areas. J. Hazard. Mater. 2015, 296, 9–16. [Google Scholar] [CrossRef] [PubMed]
- Ramponi, R.; Blocken, B.; De Coo, L.B.; Janssen, W.D. CFD simulation of outdoor ventilation of generic urban configurations with different urban densities and equal and unequal street widths. Build. Environ. 2015, 92, 152–166. [Google Scholar] [CrossRef] [Green Version]
- Gumowski, K.; Olszewski, O.; Poćwierz, M.; Zielonko-Jung, K. Comparative analysis of numerical and experimental studies of the airflow around the sample of urban development. Bull. Pol. Acad. Sci. Tech. Sci. 2015, 63, 729–737. [Google Scholar] [CrossRef]
- Blocken, B.; Stathopoulos, T.; van Beeck, J. Pedestrian-level wind conditions around buildings: Review of wind-tunnel and CFD techniques and their accuracy for wind comfort assessment. Build. Environ. 2016, 100, 50–81. [Google Scholar] [CrossRef]
- Murakami, S.; Mochida, A.; Hayashi, Y.; Sakamoto, S. Numerical study on velocity-pressure field and wind forces for bluff bodies by κ-ϵ, ASM and LES. J. Wind. Eng. Ind. Aerodyn. 1992, 44, 2841–2852. [Google Scholar] [CrossRef]
- Köse, D.; Dick, E. Prediction of the pressure distribution on a cubical building with implicit LES. J. Wind. Eng. Ind. Aerodyn. 2010, 98, 628–649. [Google Scholar] [CrossRef] [Green Version]
- Köse, D.; Fauconnier, D.; Dick, E. ILES of flow over low-rise buildings: Influence of inflow conditions on the quality of the mean pressure distribution prediction. J. Wind. Eng. Ind. Aerodyn. 2011, 99, 1056–1068. [Google Scholar] [CrossRef]
- Mittal, H.; Sharma, A.; Gairola, A. Numerical simulation of pedestrian level wind conditions: Effect of building shape and orientation. Environ. Fluid Mech. 2019, 20, 663–688. [Google Scholar] [CrossRef]
- Reiter, S. Validation Process for CFD Simulations of Wind Around Building. Available online: https://pdfs.semanticscholar.org/7703/d25a7e87787f1b85638b62a396daa369954c.pdf/ (accessed on 15 September 2018).
- Carpentieri, M.; Robins, A.G. Influence of urban morphology on air flow over building arrays. J. Wind. Eng. Ind. Aerodyn. 2015, 145, 61–74. [Google Scholar] [CrossRef] [Green Version]
- Gnatowska, R. Wind-induced pressure loads on buildings in tandem arrangement in urban environment. Environ. Fluid Mech. 2018, 19, 699–718. [Google Scholar] [CrossRef] [Green Version]
- Yuan, C.; Ren, C.; Ng, E.Y.Y. GIS-based surface roughness evaluation in the urban planning system to improve the wind environment—A study in Wuhan, China. Urban Clim. 2014, 10, 585–593. [Google Scholar] [CrossRef]
- Shirzadi, M.; Naghashzadegan, M.; Mirzaei, P.A. Improving the CFD modelling of cross-ventilation in highly-packed urban areas. Sustain. Cities Soc. 2018, 37, 451–465. [Google Scholar] [CrossRef]
- Palusci, O.; Monti, P.; Cecere, C.; Montazeri, H.; Blocken, B. Impact of morphological parameters on urban ventilation in compact cities: The case of the Tuscolano-Don Bosco district in Rome. Sci. Total Environ. 2021, 807, 150490. [Google Scholar] [CrossRef] [PubMed]
- Shi, X.; Zhu, Y.; Duan, J.; Shao, R.; Wang, J. Assessment of pedestrian wind environment in urban planning design. Landsc. Urban Plan. 2015, 140, 17–28. [Google Scholar] [CrossRef]
- Poćwierz, M.; Zielonko-Jung, K. Wind conditions in urban layout—Numerical and experimental research. In Proceedings of the (CMM2017), the 22nd International Conference on Computer Methods in Mechanics, Lublin, Poland, 13–16 September 2017; Volume 44. [Google Scholar] [CrossRef]
- Zielonko-Jung, K.; Poćwierz, M. The impact of forms of buildings on the air exchange in their environment: Based on the example of urban development in Warsaw. In Design Solutions for nZEB Retrofit Buildings; Ryńska, E., Koźmińska, U., Zinowiec-Cieplik, K., Rucińska, J., Szybińska-Matusiak, B., Eds.; IgiGlobal: Hershey, PA, USA, 2018; pp. 310–330. [Google Scholar]
- Zielonko-Jung, K. Analysis of wind conditions around a building development as a part of its form designing process, A case study. Arch. Civ. Eng. Environ. 2020, 12, 51–58. [Google Scholar] [CrossRef] [Green Version]
- Poćwierz, M.; Zielonko-Jung, K. An analysis of wind conditions at pedestrian level in the selected types of multi-family housing developments. Environ. Fluid Mech. 2021, 21, 83–101. [Google Scholar] [CrossRef]
- Pallado, J. Zabudowa Wielorodzinna. Zasady Projektowania (Multi-Family Housing. Design Principles); Politechnika Śląska: Gliwice, Poland, 2014. (In Polish) [Google Scholar]
- Regulation of the Minister for Infrastructure and Construction Amending the Regulation of the Minister for Infrastructure of 12 April 2002 on the Technical Conditions to be Met by Buildings and Their Location. Available online: https://ec.europa.eu/growth/tools-databases/tris/en/search/?trisaction=search.detail&year=2017&num=326 (accessed on 11 November 2021).
- PN-EN-1-1-4:2005 Warszawa: Polski Komitet Normalizacyjny, 2008. Available online: https://docer.pl/doc/x1vvesx (accessed on 11 November 2021).
- Dezsö, G. On Assessment of Wind Comfort by Sand Erosion. Ph.D. Thesis, Eindhoven University of Technology, Eindhoven, The Netherlands, 2006. [Google Scholar]
- Conan, B.; van Beeck, J.; Aubrun, S. Sand erosion technique applied to wind resource assessment. J. Wind. Eng. Ind. Aerodyn. 2012, 104–106, 322–329. [Google Scholar] [CrossRef]
- Dygulska, A.; Perlańska, E. Mapa Wietrzności Polski. Available online: https://kierunkizamawiane.apsl.edu.pl/pliki/czystaenergia/raport2_II.pdf/ (accessed on 20 November 2019).
- Lawson, T.V.; Penwarden, A.D. Effect of Wind on People in the Vicinity of Buildings. Available online: https://www.gsweventcenter.com/Draft_SEIR_References/1975_0101_WindEffects_People.pdf (accessed on 13 May 2018).
- Bottema, M. Wind Climate and Urban Geometry. Available online: https://pure.tue.nl/ws/files/13219080/388789.pdf (accessed on 18 September 2018).
- Bottema, M. A method for optimisation of wind discomfort criteria. Build. Environ. 2000, 35, 1–18. [Google Scholar] [CrossRef]
- Stathopoulos, T. Wind and Comfort. Available online: https://www.fupress.com/archivio/pdf/3469.pdf (accessed on 15 September 2018).
- Janssen, W.; Blocken, B.; van Hooff, T. Pedestrian wind comfort around buildings: Comparison of wind comfort criteria based on whole-flow field data for a complex case study. Build. Environ. 2013, 59, 547–562. [Google Scholar] [CrossRef]
- Stathopoulos, T. Introduction to Environmental Aerodynamics. In Environmental Wind Engineering and Design of Wind Energy Structures; Baniotopoulos, C.C., Borri, C., Stathopoulos, T., Eds.; Springer: Vienna, Austria, 2011. [Google Scholar]
- Ng, E.; Yuan, C.; Chen, L.; Ren, C.; Fung, J.C. Improving the wind environment in high-density cities by understanding urban morphology and surface roughness: A study in Hong Kong. Landsc. Urban Plan. 2011, 101, 59–74. [Google Scholar] [CrossRef] [PubMed]
- Walker, R.; Shao, L.; Wolliscroft, M. Natural ventilation via courtyards. Part I-theory and measurements. In Proceedings of the 14th AIVC Conference on Energy Impact of Ventilation and Air Infiltration, Copenhagen, Denmark, 21–23 September 1993; pp. 235–250. [Google Scholar]
Figure 1.
Types of housing building developments from the left: sectional, linear, and quarter models, examples of Warsaw housing estates from the last 30 years; source: Google maps.
Figure 1.
Types of housing building developments from the left: sectional, linear, and quarter models, examples of Warsaw housing estates from the last 30 years; source: Google maps.

Figure 2.
Axonometric views and plans of building development models used in the research: sectional (a), linear (b), and quarter (c); dimensions in meters; a study by the authors based on [27].
Figure 2.
Axonometric views and plans of building development models used in the research: sectional (a), linear (b), and quarter (c); dimensions in meters; a study by the authors based on [27].

Figure 3.
View from inside the tunnel with elements used to model the boundary layer.

Figure 4.
Distribution of velocity and intensity of turbulence.

Figure 5.
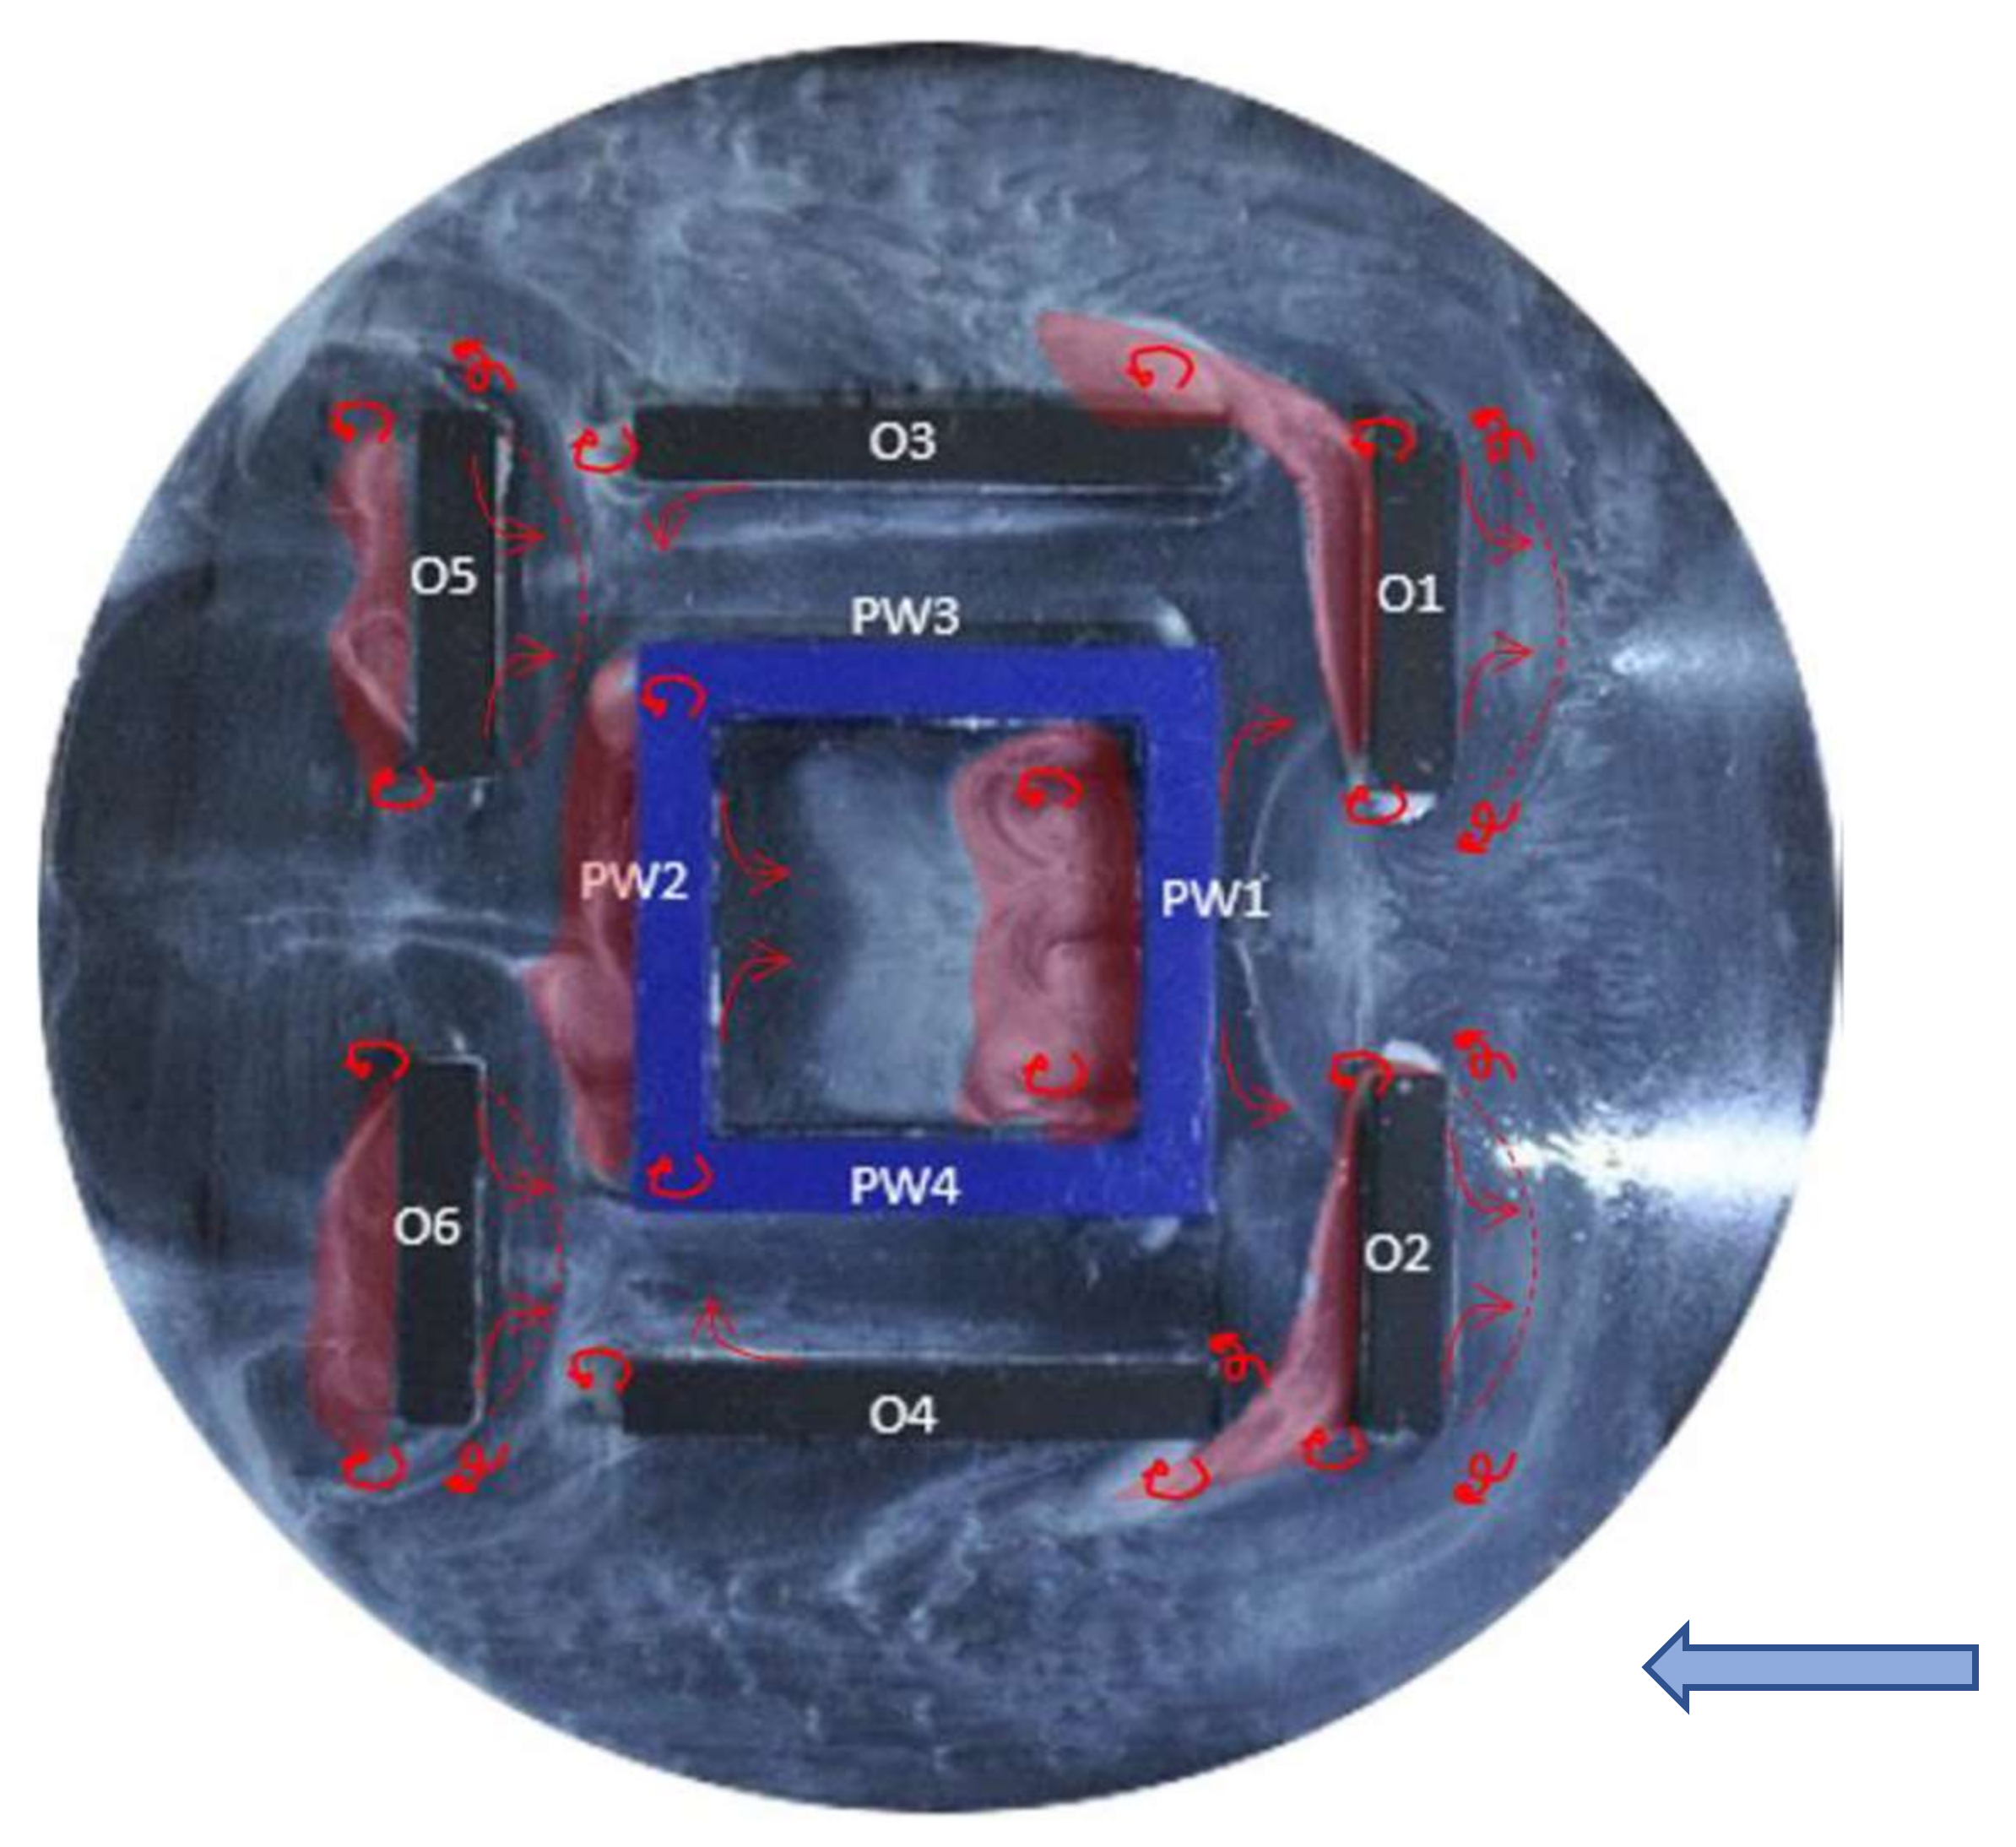
A photograph presents the result of the oil visualization, together with a graphical interpretation of the observed wind phenomena (on the example of quarter development); the arrows indicate the direction of airflow and airflow turbulences. Inside the courtyard, in the leeward zone (behind PW1), the zone of wake flows (hatched area) is visible; the stagnation zone is the area in the central part of the courtyard (marked with a white marker), and the reflected air zone is visible (no white marker) in the windward zone in front of PW2.
Figure 5.
A photograph presents the result of the oil visualization, together with a graphical interpretation of the observed wind phenomena (on the example of quarter development); the arrows indicate the direction of airflow and airflow turbulences. Inside the courtyard, in the leeward zone (behind PW1), the zone of wake flows (hatched area) is visible; the stagnation zone is the area in the central part of the courtyard (marked with a white marker), and the reflected air zone is visible (no white marker) in the windward zone in front of PW2.

Figure 6.
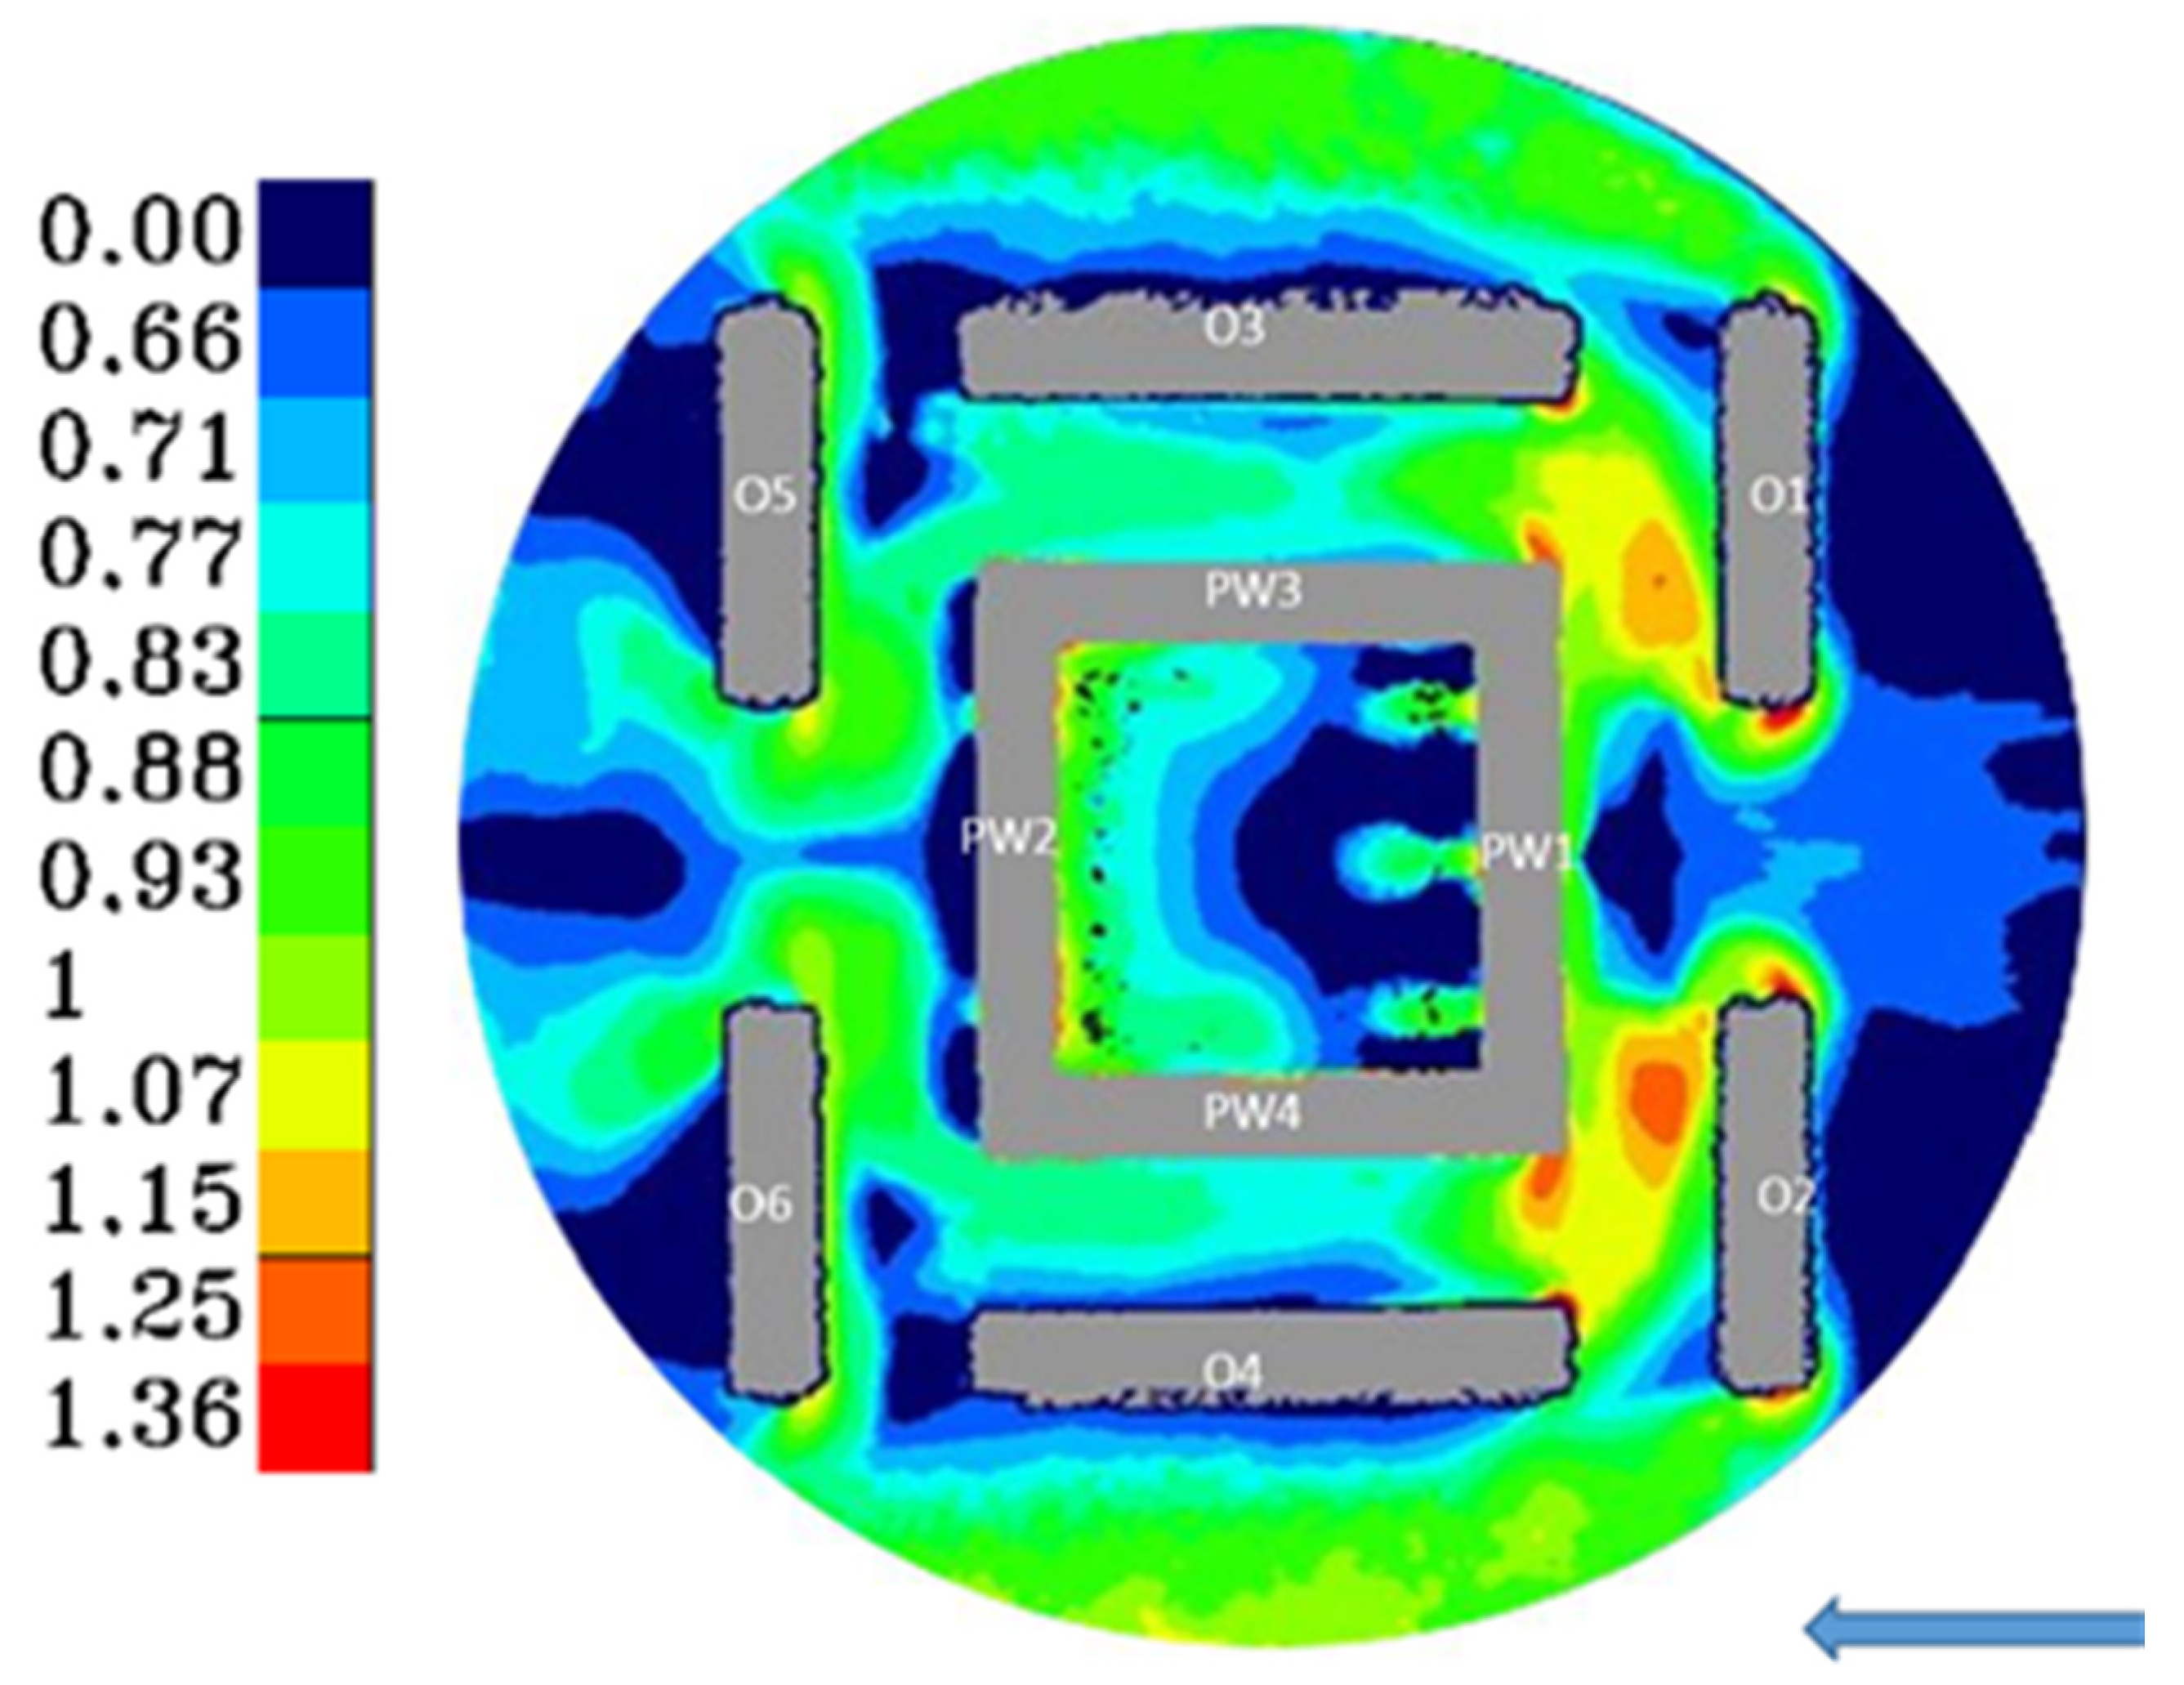
An example of the final colored map presenting the distribution of amplification coefficient–α, created based on sand erosion (on the example of quarter development); a study by the authors.
Figure 6.
An example of the final colored map presenting the distribution of amplification coefficient–α, created based on sand erosion (on the example of quarter development); a study by the authors.

Figure 7.
A comparison of research results made with the application of erosion technique (on the left) and oil visualization technique (on the right) for sectional developments: perpendicular, paralleled, and oblique wind direction; a study by the authors.
Figure 7.
A comparison of research results made with the application of erosion technique (on the left) and oil visualization technique (on the right) for sectional developments: perpendicular, paralleled, and oblique wind direction; a study by the authors.


Figure 8.
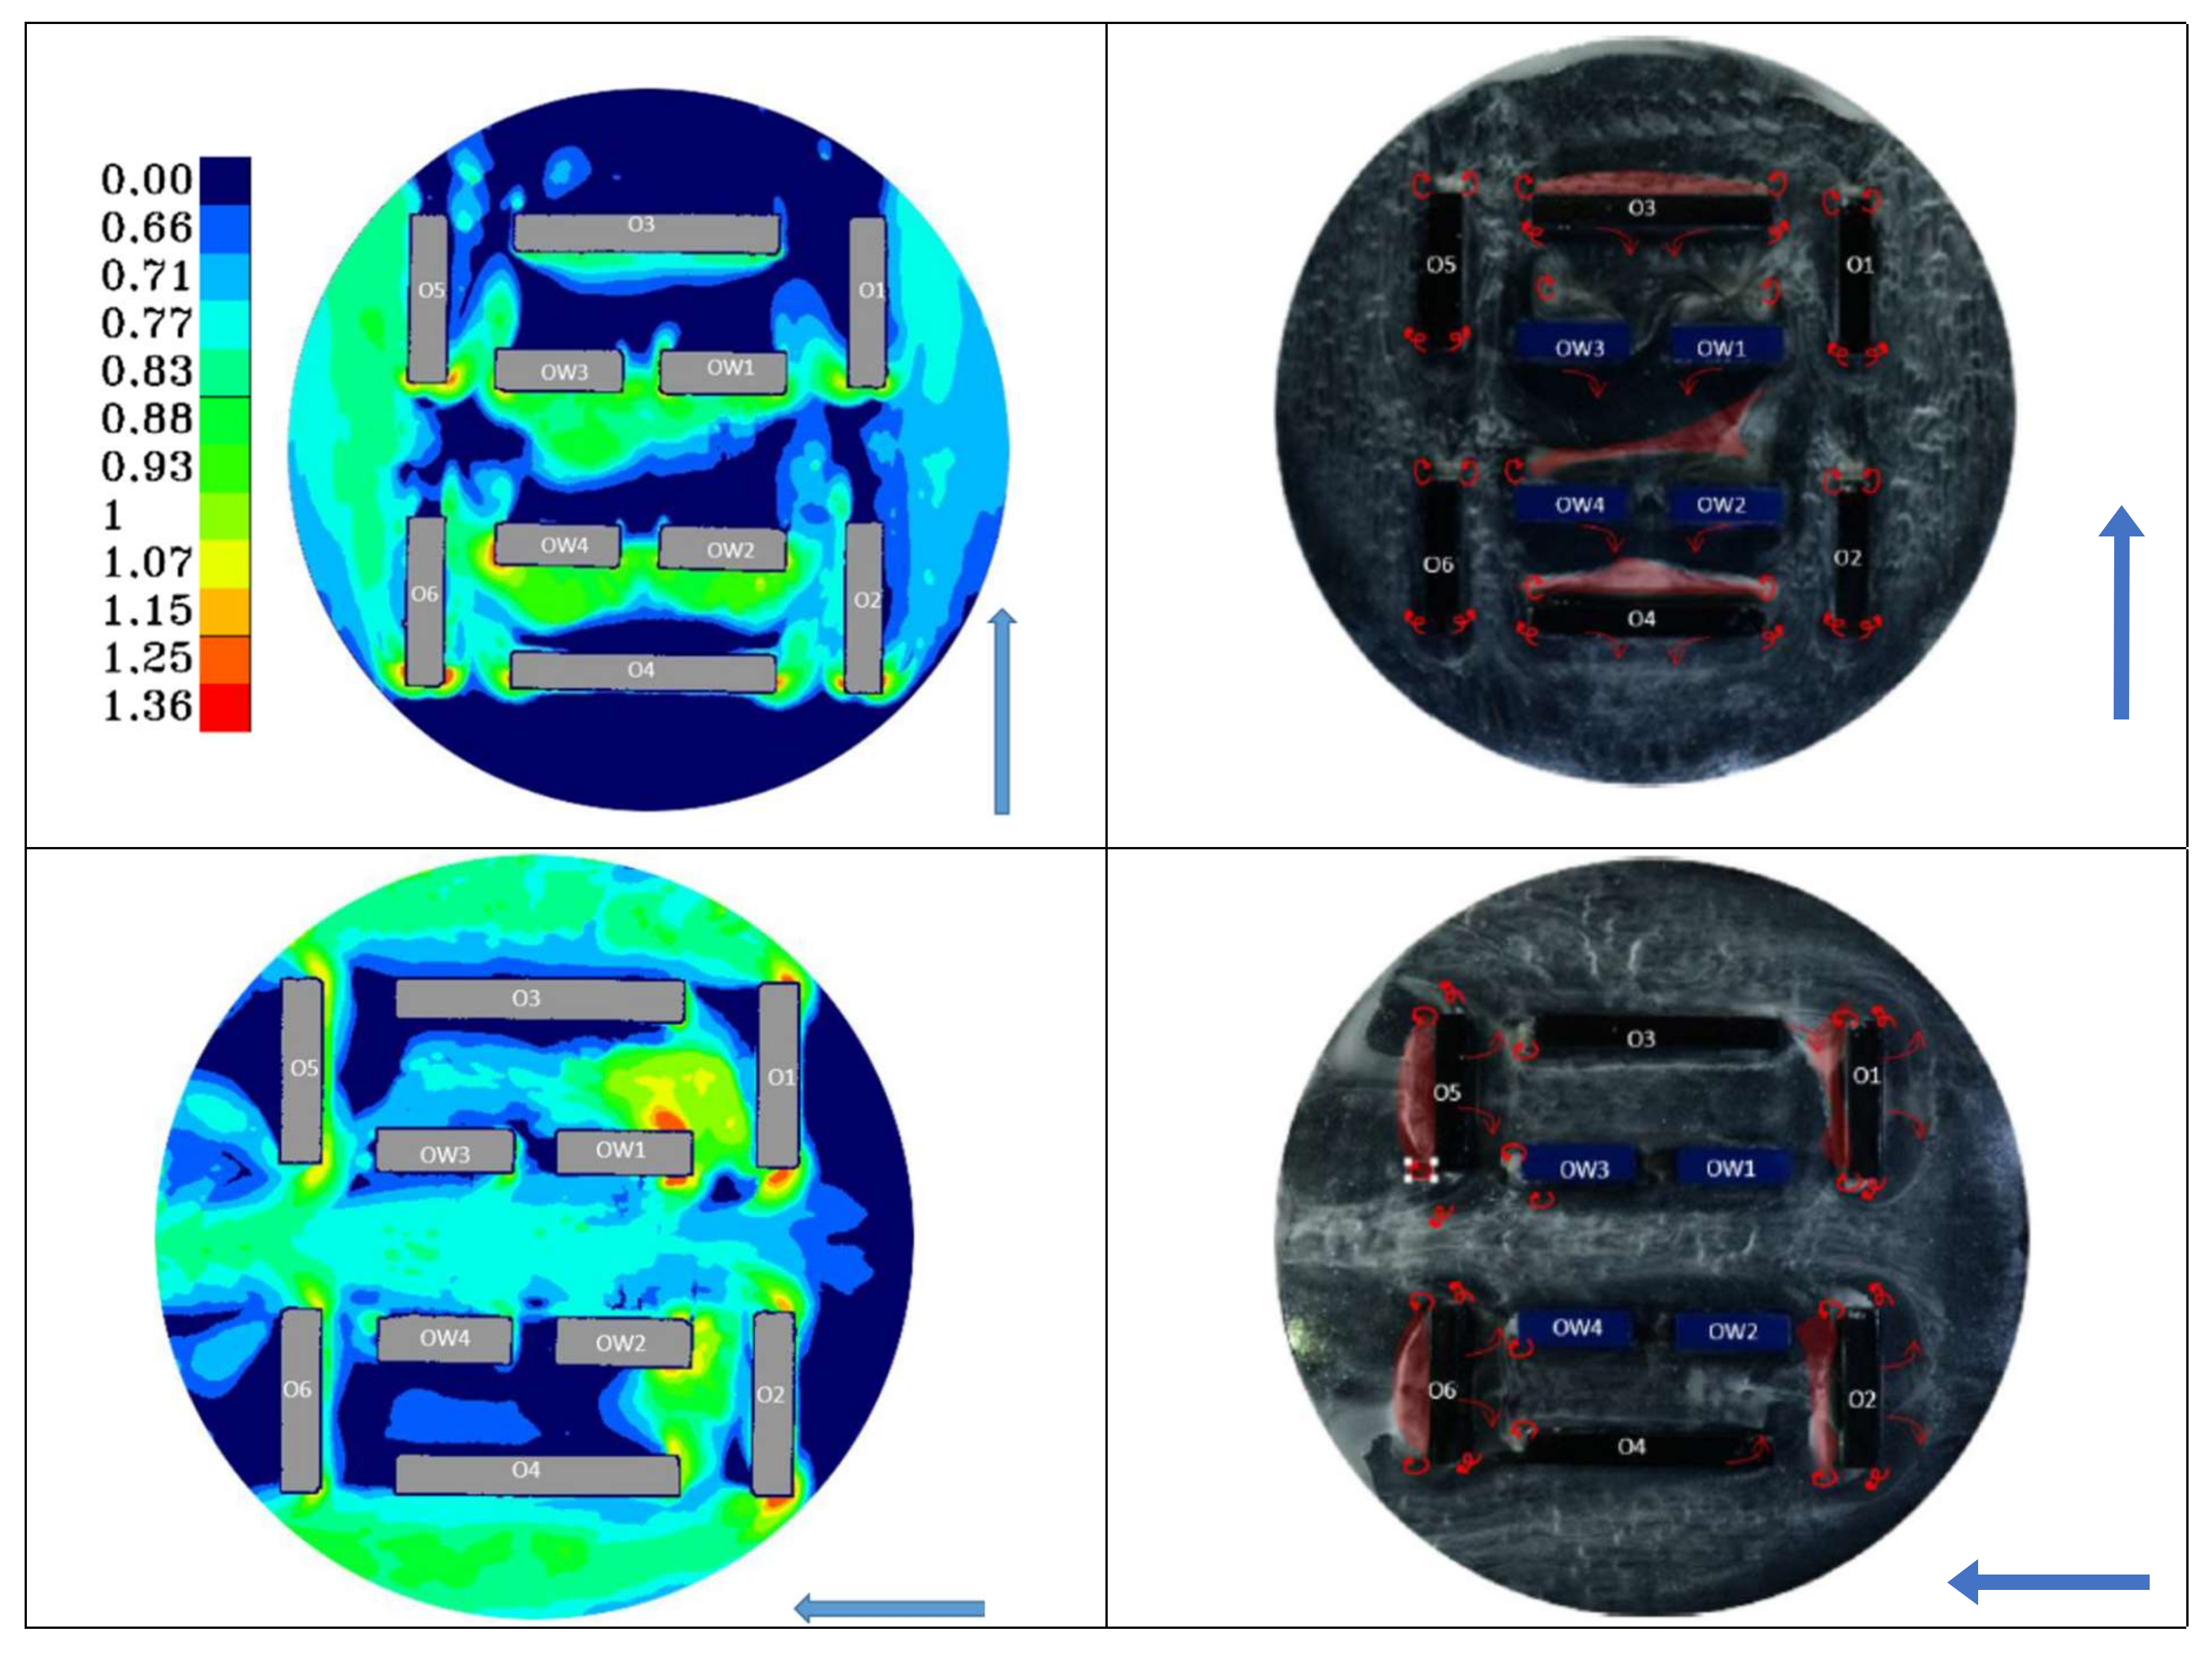
A comparison of research results made with the application of erosion technique (on the left) and oil visualization technique (on the right) for linear developments: perpendicular, paralleled, and oblique wind direction; a study by the authors.
Figure 8.
A comparison of research results made with the application of erosion technique (on the left) and oil visualization technique (on the right) for linear developments: perpendicular, paralleled, and oblique wind direction; a study by the authors.

Figure 9.
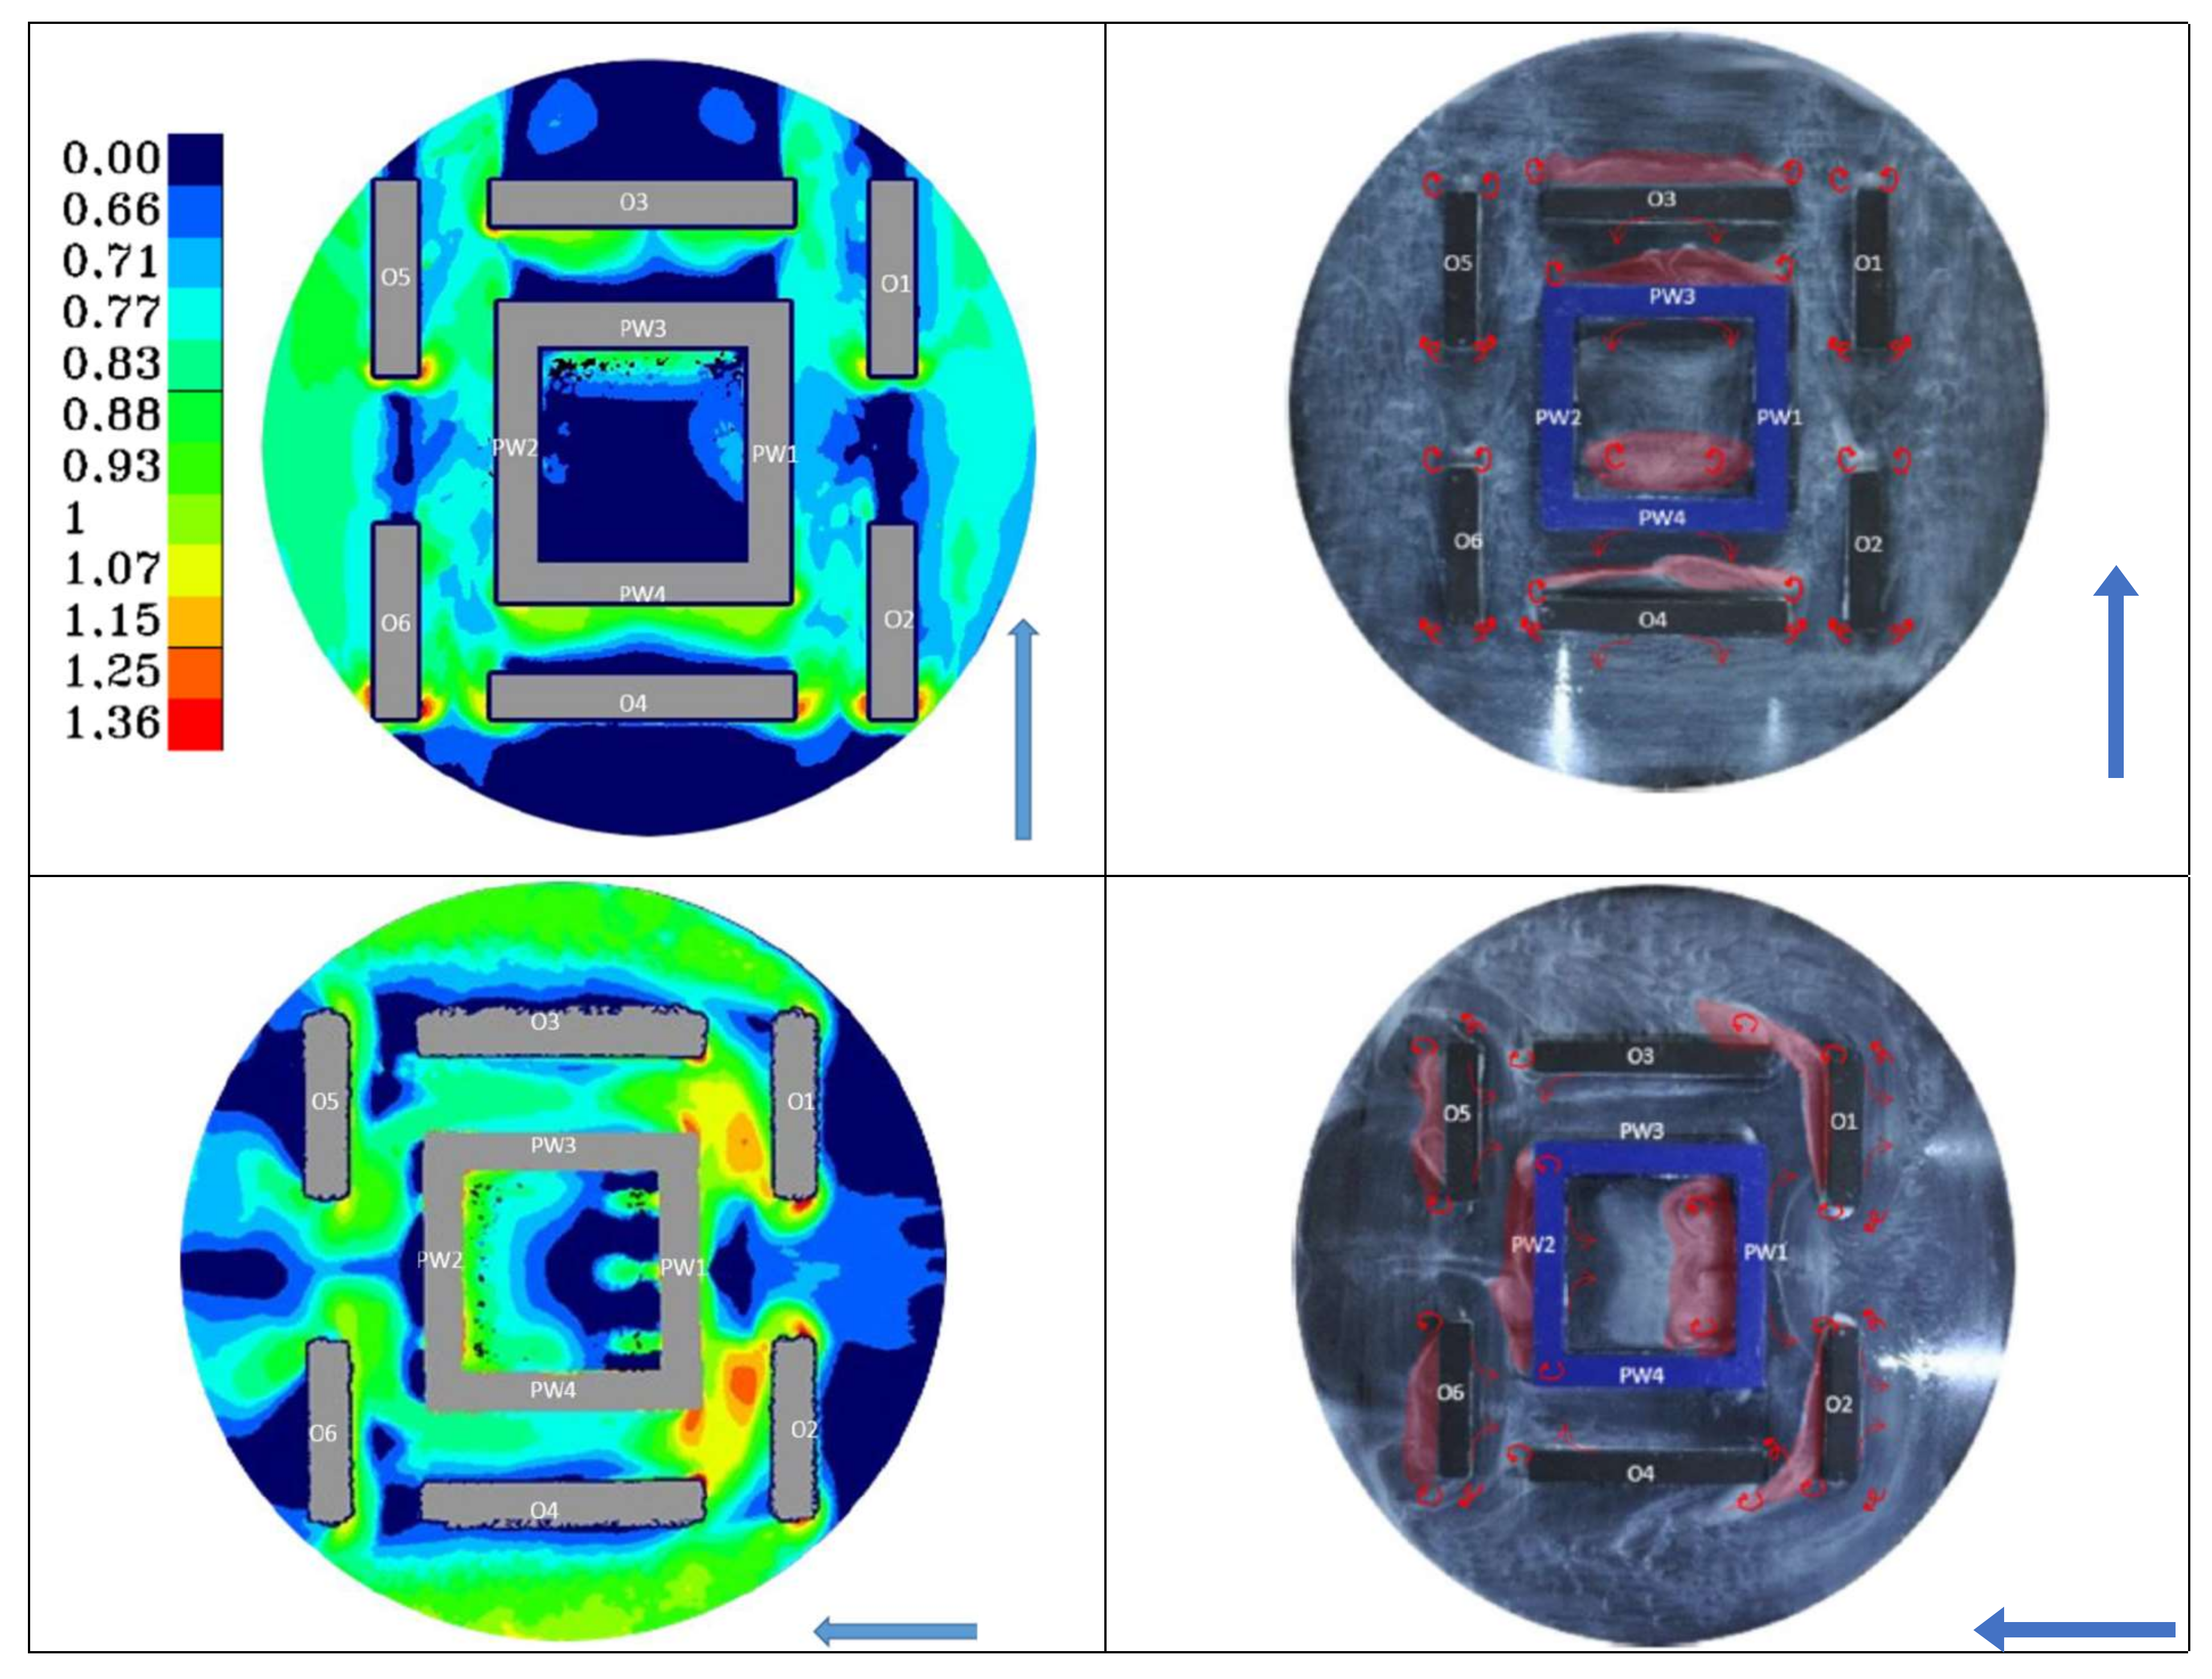
A comparison of research results made with soil erosion technique (on the left) and oil visualization technique (on the right) for quarter building developments: perpendicular, paralleled, and oblique wind direction; a study by the authors.
Figure 9.
A comparison of research results made with soil erosion technique (on the left) and oil visualization technique (on the right) for quarter building developments: perpendicular, paralleled, and oblique wind direction; a study by the authors.


Publisher’s Note: MDPI stays neutral with regard to jurisdictional claims in published maps and institutional affiliations. |
© 2021 by the authors. Licensee MDPI, Basel, Switzerland. This article is an open access article distributed under the terms and conditions of the Creative Commons Attribution (CC BY) license (https://creativecommons.org/licenses/by/4.0/).
Share and Cite
MDPI and ACS Style
Zielonko-Jung, K.; Poćwierz, M.; Idem, R. Wind Conditions at Pedestrian Level in Different Types of Residential Urban Development for a High Degree of Land Use Efficiency. Sustainability 2021, 13, 13612. https://doi.org/10.3390/su132413612
AMA Style
Zielonko-Jung K, Poćwierz M, Idem R. Wind Conditions at Pedestrian Level in Different Types of Residential Urban Development for a High Degree of Land Use Efficiency. Sustainability. 2021; 13(24):13612. https://doi.org/10.3390/su132413612
Chicago/Turabian StyleZielonko-Jung, Katarzyna, Marta Poćwierz, and Robert Idem. 2021. "Wind Conditions at Pedestrian Level in Different Types of Residential Urban Development for a High Degree of Land Use Efficiency" Sustainability 13, no. 24: 13612. https://doi.org/10.3390/su132413612
Note that from the first issue of 2016, this journal uses article numbers instead of page numbers. See further details here.