
A New Approach for Assessing Secure and Vulnerable Areas in Central Urban Neighborhoods Based on Social-Groups’ Analysis


1
Faculty of Architecture and Town Planning, Technion-Israel Institute of Technology, Haifa 3200003, Israel
2
Library Authority, Hebrew University of Jerusalem, Jerusalem 9190501, Israel
*
Author to whom correspondence should be addressed.
Sustainability 2021, 13(3), 1174; https://doi.org/10.3390/su13031174
Submission received: 1 December 2020
/
Revised: 14 January 2021
/
Accepted: 19 January 2021
/
Published: 22 January 2021
(This article belongs to the Special Issue Social Perspectives of Spatial Inequality and Sustainable Livelihoods)
Abstract
:Current urban planning of central neighborhoods is focused on mobility transformation towards more sustainable methods of public transportation and walkability that increase social interactions. Central urban neighborhoods in many cities may suffer from deterioration due to lack of personal security that result in diminished walkability. The lack of personal security might exclude residents from those areas and create a troublesome circle of deterioration, and may emphasize spatial inequality. It may also establish different patterns of the neighborhood infrastructure usage for different social groups, such as using specifically more secure streets and public spaces. The main goal of this paper is to define the routes and spaces where people walk and use in their neighborhoods in which they feel safe, and to understand how different social groups walk-through and use the same urban environment. This is analyzed by the security rating index (SRI) model, a GIS-based mapping model, which is used to identify and rate secure urban areas for better walkability. The SRI results are compared to an interview, which was given to different social-group representatives, urban data that was collected using a mobile application, and to vandalism data analysis from the municipality. The security and walkability analysis assessment took place in the Hadar neighborhood in Haifa, Israel.
1. Introduction
1.1. Secured and Walkable Environments
Secure and walkable environments play a meaningful and crucial role in the quality of life of urban residential environments. Although central urban neighborhoods usually are more walkable, poor infrastructure, such as unkempt sidewalks or unsecure environments, influence which streets people choose to walk through. In many cities, derelict areas suffer from urban deterioration and population abandonment and have the potential to emphasize spatial inequality for people living in these areas. In recent decades, communities (such as student communities, religious communities, etc.), choose to reside in these central urban neighborhoods for urban renewal reasons [1]. These local communities are defined in this article as social groups. These diverse social groups may use the city infrastructure in different modes and walk through the urban environment by using different streets. However, several secured walking routes and spaces where there is a good level of personal security and suitable walking conditions may be used across different social groups. These common secured and unsecured routes and areas in the city, especially in central urban neighborhoods, may bring forth better understanding of the neighborhood or the city as a whole and can contribute to future planning.
The main idea of this study is to measure personal safety in neighborhoods by using innovative GIS-based models that quantify security levels in the built environment, and to define safe and secured routes that people commonly use in their neighborhoods. In addition, this study aims to understand how different social groups walk and use the same urban environment, by using personal interviews and marked maps analyzed using a GIS application.
1.2. Evaluation and Measurement
Environmental quality is complex, addressing not only ecology and climate but also issues such as privacy, security, walkability, pedestrian access, and visibility. Today, there is an increasing interest in objective evaluation of environmental quality parameters, in order to improve the quality of life in residential areas and to support future urban planning [2,3]. Current research has addressed quality of life measures using advanced technology, such as measuring privacy in urban environments [4], walkability [5], solar and climate comfort [6,7], and investigation of landscape quality using models and methods developed with GIS analysis tools that are combined with satellite imagery, remote sensing, or census data [8,9,10].
In this paper, we assessed security in the built environment as a parameter of quality of life, using both quantitative and qualitative methods. The security was analyzed by the security rating index (SRI) model [11,12], a GIS-based mapping system that identifies and rates high-risk or insecure urban areas. The system is based on measurements of urban design parameters relating to security, employing urban morphology analysis. GIS enables aggregating multiparameter spatial evaluation of the built-up area through in-depth analysis of environmental, urban, neighborhood, and building characteristics, street and building-specific characteristics, and other community-generated information. The analysis of security identifies characteristics and vulnerability hotspots in a neighborhood in several aspects: urban form, open public spaces, gardens, insecure routes, etc. The security rating index (SRI) system aims to measure the qualitative aspects of the environment, the sense of security, in quantitative terms. Transferring security from the qualitative to the quantitative serves designers, planners, and decision-makers, allowing them to evaluate the level of security in the built environment and compare specific urban features of the city. This starts by defining the main required security needs for planning development and urban management of the city. Identifying specific validated variables that are used to scale the phenomena of urban security can eventually be used in future planning schemes and programs.
For reinforcing the quantitative results, we used two methods for assessment. (1) An interview analysis approach was used for analyzing the residents’ point of view. Interviews and maps drawn by different social groups showcase the ratio between secured and unsecured area, and the way people walk, use, and perceive the urban environment. Different social groups conceptualize and use urban areas in different ways that affect walking routes and idling areas. Hence, there is a need for a normalization method to capture the differences in walkability and security among various social groups. Interviews were carried out to validate the SRI model. By comparing stakeholders’ descriptions of their everyday walking routines to the qualitative results of the SRI, the actual walking patterns confirmed the security results. (2) Comparison of the unsecure hotspots with vandalism occurrences that take place in less secure areas were derived from the municipality data. Vandalism also causes reduction in the sense of security and diminishes the urban population’s desire to spend time in vandalized areas, which affects the use of the urban environment.
The sense of security was assessed in the case study of Hadar, a residential neighborhood of Haifa, Israel. The researchers conducted interviews with representatives from different social groups that live in Hadar, and recorded their views on the degree of safety, security in the neighborhood and walkability for better understanding the way they walk through the neighborhood. The results of this qualitative survey were digitized and analyzed through GIS analysis tools. This resulted in diverse analytic maps that highlight safe and secure walkable routes and streets in Hadar. The results also show how different social groups use the urban environment in different ways, walk through different streets, and define walkable, safe, and secure areas.
Understanding unsecure areas and factors that diminish security by applying the security rating index can aid designers in identifying unsecure urban areas, improve connectivity, and upgrade security levels of existing and new urban areas. The security rating index can isolate security issues in the urban decision-making process for potential urban renewal in order to create better and improved secured areas in the built environment.
Therefore, the main goals of the research are to (1) apply the security rating index (SRI) as a quantitative model, based on urban elements, to evaluate security in the urban environment according to their urban vulnerability level; (2) define the routes and spaces that people from different social groups walk through and use in the same urban environment that they perceive as safe and secure; and (3) define the association between the conceptualization of sense of security and walkability in the neighborhood.
2. Literature Review
The literature review relates to several main topics which form the basis of the research, the security in the built environment and how the communities move and function in the urban space, from different point of views: security in the built environment, community development in the built environment, the influence of walkability on the built environment, and spatial inequality in urban planning. The literature review is crucial to the article and establishes the main urban parameters of the SRI model; therefore, we focus on the literature review at the beginning of the article (Section 2) and at the model section (Section 4), we present the main parameters extracted from the literature review that affect security in the built environment.
Security in the built environment—Many researchers argue that sense of security in the city is one of the main and most important aspects for residents and for urban planning in general, as Jacobs [13] argues that the feeling of security in the city is a basic feature of any part of a successful city. Jacob argued in her seminal work that a good and successful urban street has three main features: a clear demarcation between public and private space, existence of “eyes on the street”, and allows incessant use of the sidewalk. Newman [14] explored the relationship between crime and urban space and proposed a mechanism to control security around residential units that relies primarily on surveillance and territory definitions. Marcus and Sarkissian [15] described observation situations for viewing and monitoring for security purposes and demonstrated them in illustrations and visual assets. Gehl [16] searched for architectural elements to create better sense of personal security in the city. He defined a number of urban elements that contribute to personal security, such as a clear definition between different urban territories, separation between private and public areas, definition of visibility distances, walkable distances, etc.
Evaluating urban security in the built environment-Garau and Pavan [17] consider urban security as part of the quality of life required for people in the city. Currently there are diverse urban security policies and management plans [18]. Little [19] evaluates urban security strategies and demonstrates a holistic strategy that incorporates people, institutions, and technology, for achieving long-term security. Virta [18] argues that crime prevention is part of a broader concept that sprouts from security coproduction involving municipal and state authorities, and urban security trends that focus on security management and regional safety. Jore [20] shows that urban planners are encouraged to implement urban security measures and elements only with understanding their accurate effectiveness over the city security values.
Several researchers investigated the relationship between crime and the built environment by using the spatial syntax method. Hillier [21] argued that determining real impact of crime on the built environment requires accurate data and development of a spatial analysis methodology. López and Van Nes [22] showed that there are urban situations allowing more feasibility for crime, such as distance between porches and street, location of store entrances, and deep accesses to complex urban spaces from the street. In addition, Shu [23] found that property crimes tend to occur in segregated areas where there is more distance separation between the houses and along short access lines. An additional tool is the security rating index (SRI) system [11,12], a GIS-based analysis tool that identifies and rates insecure urban environments. The model is based on measuring and evaluating urban parameters relating to security using urban morphology analysis.
The influence of urban elements on the sense of security in the built environment—There are diverse researchers and governmental-based studies relating to security in the built environment that demonstrate urban elements influencing the sense of security in the built environment. For example, Mulholland [24] pointed out several urban elements and situations that enhance security in the built environment, such as balconies overlooking central squares, improved acoustic capabilities such as gravel walkways around residential units, and CCTV and other automatic security measures. Llewelyn et al. [25] defined safer places and urban elements that can be measured, such as arrangements of access and movement in the city, building entrances, distinction between different land uses, better observation, sense of ownership, street lights, CCTV, fencing of territories, gated parking, closed rear gardens, setting up separate walkways, and rest areas in the city. One important guidebook in the field of security is CPTED—Crime Prevention through Environmental Design [26,27], based on the principle that the design of the physical area effects delinquent behavior, advocating that good design assists in reducing crime and increases personal security. The fundamental concept is based on four main strategies: (1) natural surveillance; (2) natural access control—location of physical elements, such as door entrances, fences, or other physical elements, in open areas for maximum visibility; (3) territorial reinforcement—preserving clear boundaries between public and private areas by using design elements such as fences, vegetation, etc.; and (4) maintenance and management.
Community development in the built environment—The new urbanism theory aims to promote a holistic approach to urban planning and design that focus on community development [28,29,30]. One of the main goals is to preserve community resilience, which is becoming one of the main concerns in every city [31]. Several models have been developed to promote community resilience, such as LEED for Neighborhood Development, BREEAM Communities, Green Star Communities, STAR Community, and others, mainly in large-scale cities [32]. Atreya and Kunreuther [31] introduced the concept of “Community Rating System (CRS)”, a holistic approach to evaluate community resilience by characterizing four aspects of resilience: redundancy, resourcefulness, robustness, and rapidity, and developed a system that rewards communities’ activities. Mulligan et al. [33] aimed to understand community resilience for planners. They argued that the idea of community, which combines multiple layers of meaning, is ignored in resilience planning, and proposed a framework for integrating meaningful community layers in normative planning policy and practice.
Walkability aspects—In addition to security, the walkability aspect revealed itself as an important complementary aspect to urban security [34]. Walkability may predict livability of a city [35,36,37,38]. Walkability is a known variable for measuring the built environment usually in the context of public health where various researches have pointed out the positive effect it has on recent health epidemics such as diabetics and obesity, and increases wellbeing as a whole [39,40,41].
Walkability increases the sense of security in the city [42]. Sohn et al. [42] argued that designing mixed-usage areas with shorter street segments increases pedestrian movement that allows more people to walk, and results in preventing crime opportunities. In addition, compact, mixed-use, and good public space for face-to-face encounters have strong influence on walkable and resilient cities [43]. Porębska et al. [44] aimed to understand the dual design of a walkable space for everyday life and for emergency time, and found that a good walkable space can be a countermeasure for emergency situations. Rogers et al. [45] argued that there is a positive correlation between walkability and social capital, and it can have a positive influence on community development. Walkability in Hadar was established through interviews, which served as a corroborating parameter for the GIS security analysis results.
Measuring walkability—Walkability can be measured using several models; for example, WalkScore that measures how accessible daily living activities by walking [46,47], Walkshed [48,49], and Walkonomics [50,51]. Wimbardana et al. [52] aimed at understanding and evaluating the environment of walkable routes by using the pedestrian environmental data scan (PEDS) tool, which records the physical data of the built environment and can present the data spatially. They found several parameters that enable a good walkable environment such as attractive sidewalks, flat slopes, dense shade trees, and a safe environment with low-volume traffic [52]. Zhang et al. [53] raised walkability potential in public housing neighborhoods by applying the form-based codes (FBC) system guidelines. These tools measure walkability in a technical aspect and do not examine the feeling of being secure in the walking paths.
Improving people’s quality of life is one of the main goals of a smart city design [54], where walkability plays a critical role in upgrading people’s quality of life [37]. However, many models for evaluating the quality of life mainly offer city-wide measures instead of considering walkability measures [55]. Orozco et al. [55] argues that the infrastructure network provided for pedestrians for walking in the city is the main core for city’s social life, and introduces the life quality index (LQI) based on urban environmental parameters such as pedestrian accessibility to services and amenities, safety, and more. Yamagata et al. [54] developed a comprehensive multidata wellbeing assessment system based on image assessment and machine learning technique, for smart communities for evaluating streetscapes, in which one of the main parameters for measurement was walkability. Gilderbloom et al. [46] investigated the impact of walkability on the quality of neighborhoods using Walkscore™ and discovered that walkable neighborhoods show a positive impact on housing foreclosure and neighborhood crime.
Spatial inequality in urban planning—Income inequality creates social and spatial inequality [56]. However, urban planning and regulation can help bridge these gaps and reduce the inequality [57]. Aharon-Gutman and Burg [57] developed a topographical landscape model that visualizes the spatial inequality of the socioeconomic characteristics in the urban environment. The findings and results of the research show that high levels of social inequality are correlated with crime events in the city. Grant [58] argues that spatial inequality in urban environments is not only based on infrastructure, proximity to services, and jobs, but also shows by using a combined social dynamics and geography framework how spatial poverty traps exist in diverse urban environments. The results show that there is a need for policy-making processes for better urban development. Kilroy [59] explores the spatial inequalities within cities and show that physical divisions of urban movement and spaces decrease socioeconomic interactions between diverse income groups, and especially diminished the flow of income into low-income of urban environments. Liu and Duan [60] searched for the impact of the street network on urban bus transit. They applied spatial regression models and found that unequal distribution is related to several parameters: transport-related services, nighttime light density, population density, and commercial and leisure services. Higgins et al. [61] argued that the influence of deprivation, education, and health inequalities influence only community safety and the city’s borough-level transport.
3. Methodology for the Security Analysis Model and Model Assessment
The aim is to establish a system that will be able to serve designers, planners, and decision-makers, allowing them to evaluate the level of security in the built environment. The security level of the neighborhood will be defined by using the security rating index (SRI) model [11,12]. These needs were based mainly on understanding which urban characteristics affect urban vulnerability from a planner’s perspective. The methodology was developed based on these needs.
Building Blocks of the Security Model and Evaluation Process
The methodological framework was conducted based on five main phases: phases 1 and 2 constitute the theoretical basis of the model, phases 3 and 4 describe the model development and demonstration in an urban environment, and phase 5 describes the evaluation process developed using two assessment approaches: (a) an interview and a mapping method and (b) vandalism hotspot analysis. The main phases are detailed as follows:
- Conducting a literature review—a comprehensive literature review was conducted for identifying urban elements and settings that affect personal security in the built environment.
- Selected quantifiable urban elements—through the literature review, a list was drawn of prominent urban elements and urban settings that are most influential to personal security in urban areas.
- Determining specific scale for each urban element—each selected urban element was weighted and measured individually in accordance to its influence on urban vulnerability and security of the built environment. Each urban element was first measured individually using GIS software.
- Superposition analysis and case study analysis—the analysis of the measured individual urban elements were integrated into a combined index, implemented on one case study, the Hadar neighborhood.
- Evaluation and validation—security assessment results were evaluated based on interviews of different social group representatives in Hadar. The results of these qualitative analyses were marked on maps and analyzed using GIS analysis tools. The validation method referred to was based on vandalism hotspot analysis for the Haifa municipality data. The results of both approaches were evaluated in comparison to the security analysis results and refined the model for better understanding the locations of unsecure and secure walkable routes and streets in Hadar.
4. Model Development and Demonstration
4.1. Urban Elements Identification and the Security Analysis
The SRI security model is a multiphase tool. The first phase was to determine the main urban elements and characteristics that are the most influential on personal security in built environments, and where comprehensive data are available for the whole measured area. The literature review resulted in a variety of urban elements classified into five main categories: (1) urban elements—street lights, fences, CCTV, entrances, vegetation located near entrances [25,62]; (2) aspects of urban context—proximity between buildings, street widths, sidewalk width [4,16]; (3) usage patterns—the level of mixed uses, parking, and industrial areas [13,63]; (4) integration/segregation—distance between junctions and number of intersections [22]; and (5) aspects related to human behavior—surveillance and visual distance, the opposite of privacy [16,25,64]. From each criterion, we singled out one or two measurable variables influencing the security in the built environment.
- Streetlights (urban elements). One of the main influential urban elements on personal security in the city at night are the streetlights [62]. Jacobs [13] argues that places with streetlights encourage positive occurrences and produce a positive effect of “eyes on the street”. Greenberg et al. [65] argued that street lights are the physical traits that increase the sense of security, and Llewelyn et al. [25] stated that street lights can be quantitatively measured by using a variety of geometrical terms, or by counting them at the site.
- Measuring proximity in the city (aspects of urban context). Proximity affects security in the built environment. The degree of the proximity and the distance between buildings, between the street and the buildings, and distance to emergency services, influences the safe city [12]. Shach-Pinsly [4] measured visual privacy in the built environment using distances between buildings. The level of personal security is inverted to the measured level of privacy; therefore, proximity increases the sense of security. An important element of the city’s reading is the territorial issue. Gehl [16] argued that clear definition between different urban territories, private or public, defines a safe city. Llewelyn et al. [25] determined that one of the five components that have significant impact on crime prevention and personal safety is territorial delimitation.
- Land uses and mixed uses (land uses). Mixed uses have significant impact on security in the built environment. Jacobs [13] criticized that separation of uses leads to the disintegration of urban communities and causes urban alienation, resulting in deterioration of personal security and quality of life in the urban environment. Greenberg et al. [65] pointed out that mixed land uses influence the level of crime in different neighborhoods. Cozens et al. [26] noted the importance of creating places containing active and safe mixed uses in order to deter crime. Saville and Cleveland [62] noted that parking lots are essential elements in the urban landscape, but are often a place with diminished sense of security. Clarke and Mayhew [66] argued that the temporary nature of public parking acts as a potential place for theft.
- Numbers of nodes (integration/segregation). Street intersections influence crime levels according to Weisburd et al. [67]. Van Nes and ZhaoHui [64] studied connectivity of intersections by examining different types of intersections using the spatial syntax method and concluded that intersections of more than two streets in a particular area improves connectivity and reduces crime potential.
- Surveillance (aspects related to human behavior). Surveillance as reflected by visual distance manifests the opposite of privacy. Schweitzer et al. [68] pointed out the influence of the arrangement of urban elements in the built environment on natural surveillance. The visible distance between individuals affects the level of safety, and based on this assumption, Gehl [16] developed a key index of visibility. Llewelyn et al. [25] determined that among the five fundamental components for increasing personal security are to observe and the subject of observation. The notion of observing and being observed lay at the basis of the CPTED concept, as one of its four strategies of action for natural surveillance [26,27,62].
Based on these five categories, we selected the urban variables used in the model for evaluating security in urban environments. It should be noted that the model presented in this paper applies only to hazards originated by crime and to urban elements that influence the level of crime.
4.2. The Security Sensitivity Index Development
The five categories extracted from previous research connect the sense of security with different urban features. This research ties together a sense of unease and avoidance to measurable urban elements. However, not all measurable features are being documented and measured. Therefore, six urban elements that are available in Haifa’s GIS department are singled out for the security analysis:
- Mixed uses—rated according to the literature review, evaluates whether the land use is mixed or homogenous;
- Proximity of buildings—distance between buildings, which shows density of the built environment;
- Proximity from junctions—distance between street intersections;
- Connectivity between intersections—number of streets that intersect in one junction;
- Streetlights—number of streetlights in a given area (a dense cluster of streetlights enhances security);
- Walkway paths—are narrow passageway and alleys that lay between the streets and buildings in many locations in Hadar. This walkway path usage is affected by the walkway path width and the ease of entrance to and exit from walkway paths (this aspect was examined as part of the interviews with the social groups).
4.3. GIS Base Analysis and Scale Design for Each Urban Variable
For each urban variable a scale design was developed, as shown in Table 1. Each variable was weighted in ArcMap, an ESRI GIS software. The neighborhood was divided into a grid in which each cell of the grid was 5 m long and 5 m wide, and each cell received a security grade for the urban variables. What follows is a short description of Table 1. Mixed uses were measured in relation to the number of uses in certain areas. The more diverse the land usage is, its security increases. In addition, several land uses were rated in accordance with precedents in the literature; for example, parking areas were rated with low levels of security. However, it should be noted that for some uses there are changes in their levels of security in relation to time of day (working hours vs. nonworking hours); for implementing these differences, further research is needed in the future—building typology proximity, distance between junctions—previous research defined social distances between buildings [4,16,69,70], relatively short distances were found good for privacy but with poor quality for sense of security or, long distances resulted in poor quality for personal privacy but good for the sense of security. The distances are spaced within intervals of five meters; number of intersections—for each junction, the number of streets coming in was counted, also, each cell was measured relative to the nearest intersection, where cells receive the value of the number of intersections. This analysis yielded a map of intersections where the darker colors indicated junctions in which more streets intersect. Streetlights—this parameter is of importance during nighttime only. Areas which have larger clusters of dense streetlights were defined as more secure than areas with sparse lighting. These differences are irrelevant during daytime.
Each urban element was measured individually using different GIS tools, such as kernel density, collected events, focal statistics, Euclidean distance, and shape-to-raster. The results were divided into five categories based on natural breaks, which groups similar values together and maximizes the differences between classes. The elements are drawn on a separate raster map on which the cells in the grid are 5 × 5 m to achieve granularity without significantly slowing data processing, showing the impact of each specific parameter on security in the city. During nighttime, barely lit spaces are perceived as less secure. Streetlights are represented as dots, and therefore kernel density method was used to interpolate the distance between the street lights while using the method’s default for search radius and creating clusters of better lit areas.
Table 1 summarizes each urban variable on a scale. The influence level of each selected urban element over the index has not yet been done, and the weight of each element will be evaluated in future research. The scale was chosen from 1 (least secure) to 5 (most secure) arbitrarily since we wanted an odd scale to allow a neutral number, and because the layers were to be aggregated, we did not want a scale that will accumulate with long numbers. A scale of five is short enough to allow the numbers added to be in the low tens, and at the same time allow some variance of security. The model was implemented on one case study, the Hadar neighborhood in Haifa city.
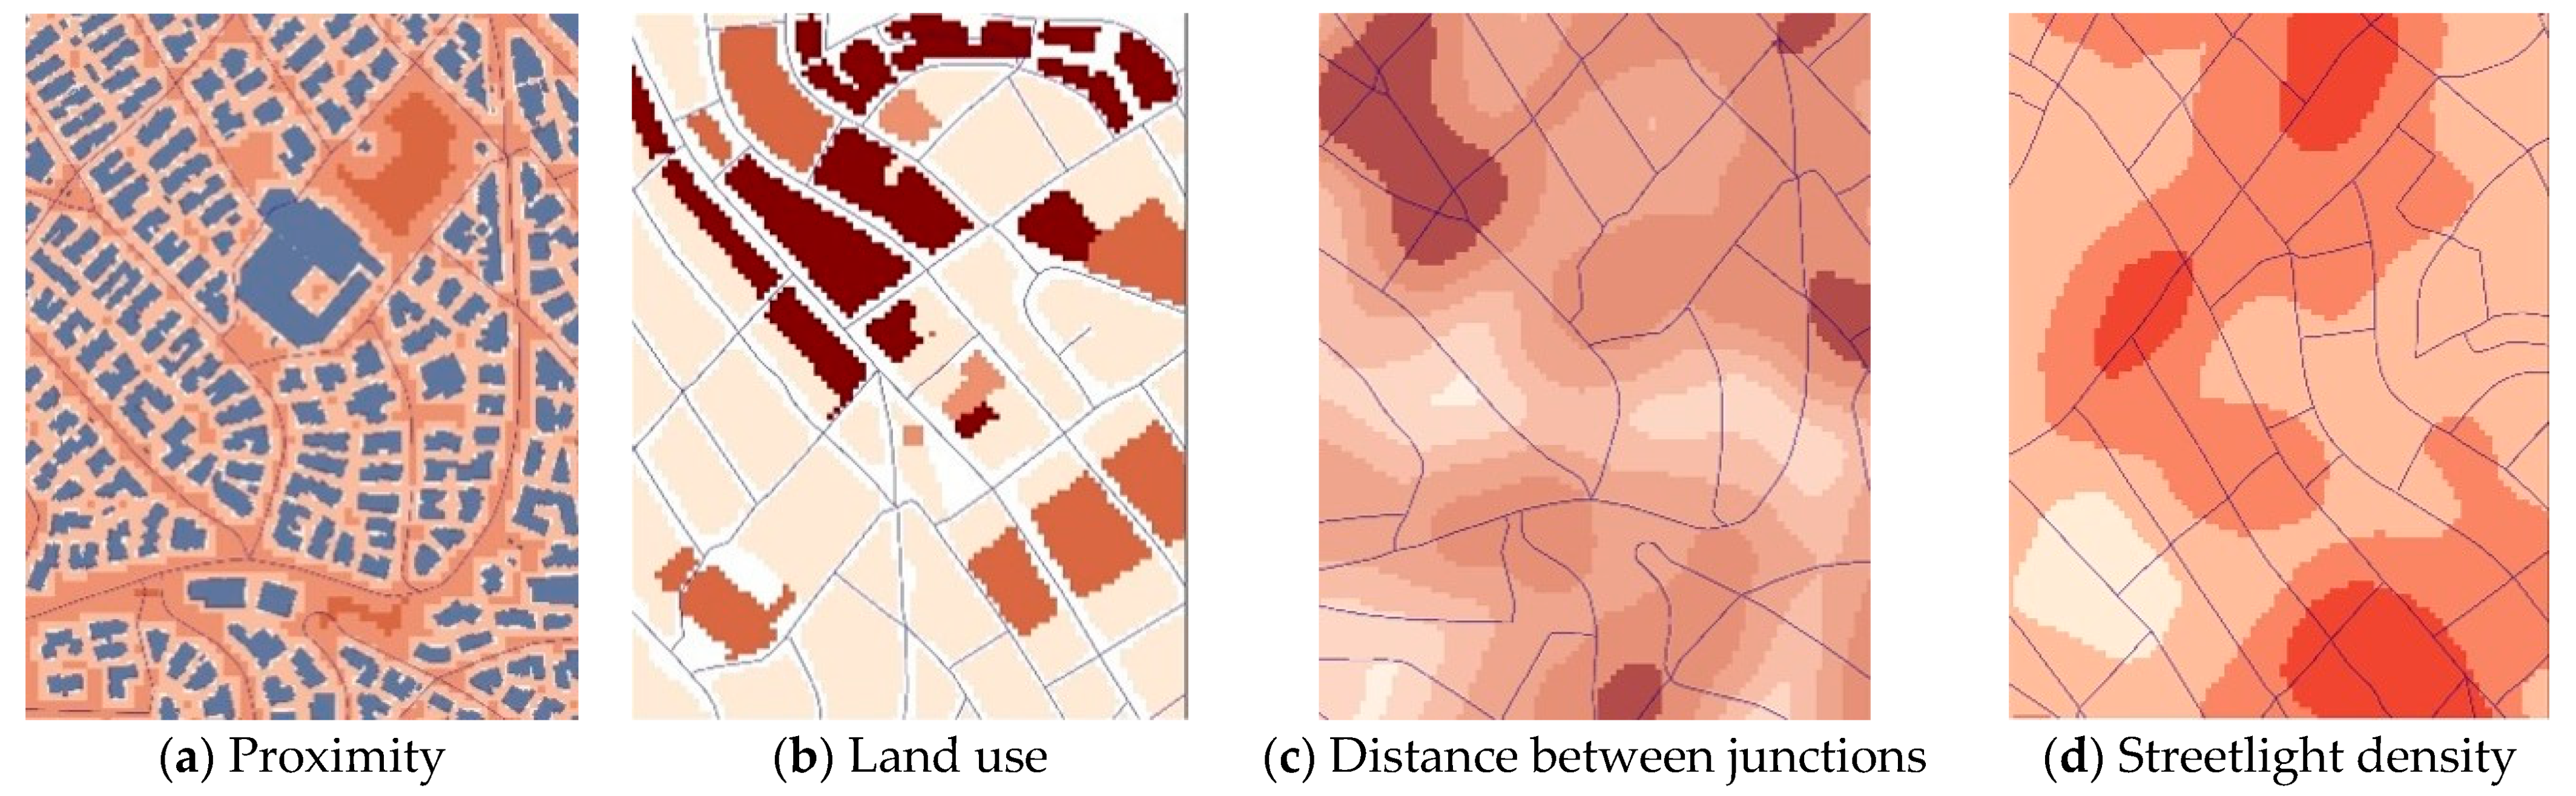
Each urban variable was measured separately following the designed weighted scale (see Table 1), and Figure 1 shows the GIS analysis of several urban parameters separately. The proximity analysis map shows the different distances that exist between the buildings; wider distances appear with darker (the browner hotspots) colors. The streetlight raster map demonstrates several hotspots with few streetlights at night (the redder hotspots). The land-use raster map shows the segmentation of the land use by the number of mixed-use areas (the browner hotspots are with the largest number of land uses). The intersection raster map points out the most integrated intersections in the neighborhood, where the most streets are present, and is shown by an intersection hotspot map.
Separate analysis of each urban variable:
5. Findings and Results
Findings and Results—Superposition Maps for Daytime and Nighttime Analysis
The next step was an integrated raster map of the analyzed urban elements to display the comprehensive security analysis for Hadar. This map highlights urban areas with low levels of urban security, as opposed to urban areas with high levels of sense of security based on the parameters in Table 1. The analysis for the daytime security was developed using five urban variables, the analysis for the nighttime security included in addition the streetlight—a total of six urban variables. Figure 2 and Figure 3 and Scheme 1, Scheme 2, Scheme 3 and Scheme 4 show the integrated inclusive raster map for daytime and nighttime security.
Figure 2 shows the security analysis at daytime. The daytime security indicates that there are several areas with reduced sense of security. These segments differ in size and perimeter and are scattered across the neighborhood. In the northern part, there is a wide unsecure area that surrounds three streets of the neighborhood on the way to the old town of Haifa to the north. The interviews confirm that these areas are considered unsecure and were not part of the daily walkable routine for the different groups.
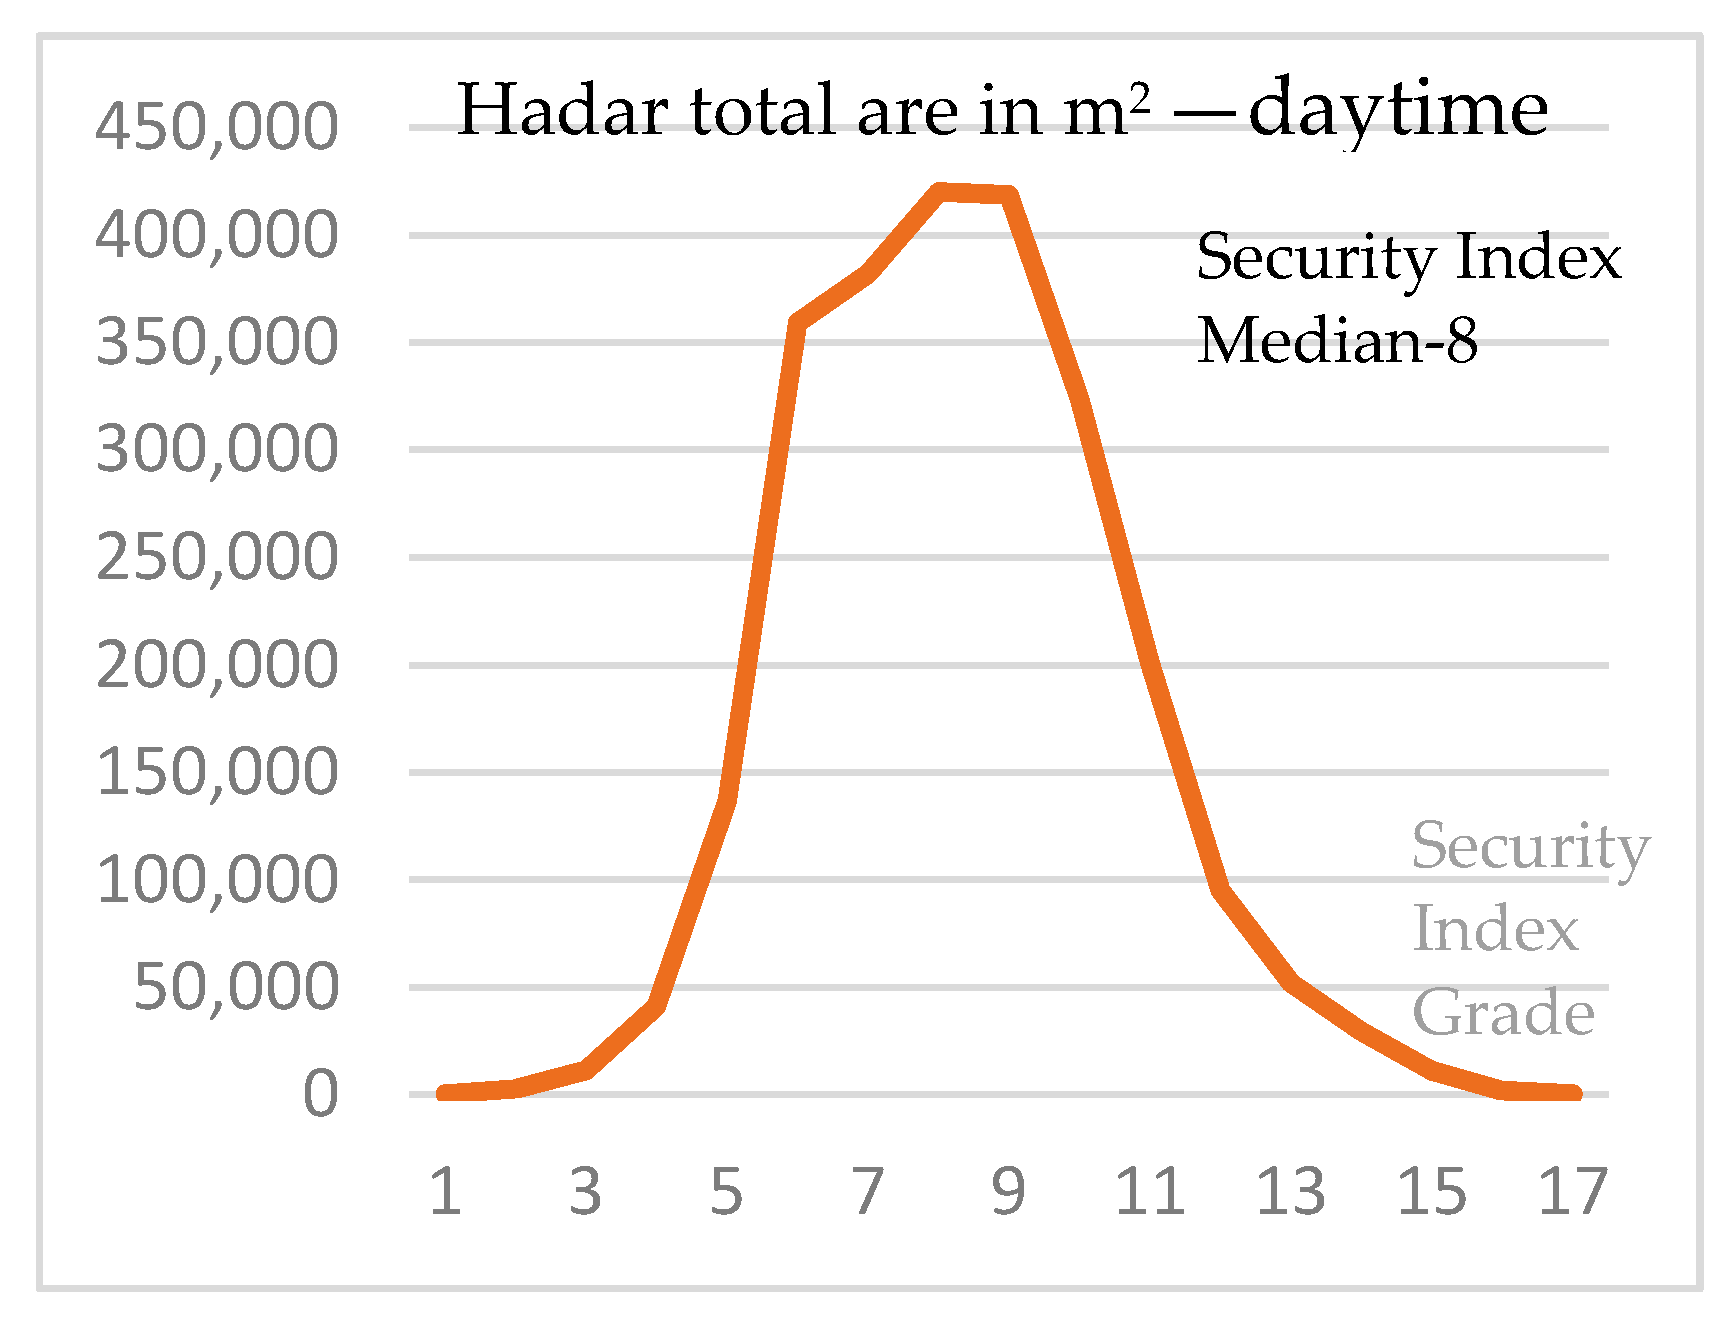
Scheme analysis 1 and 2 show that the Hadar neighborhood scored relatively medium levels of security. About a third of the area scored a high security level of “between 1 and 6”; another third scored between 6 and 11, and the rest of the area scored relatively low security, between 12 and 17 during daytime. However, the raster map shows that the lower level areas of security are distributed around the neighborhood, creating many hotspots of unsecured areas. Several hotspots cluster are present in the northeast side of the neighborhood.
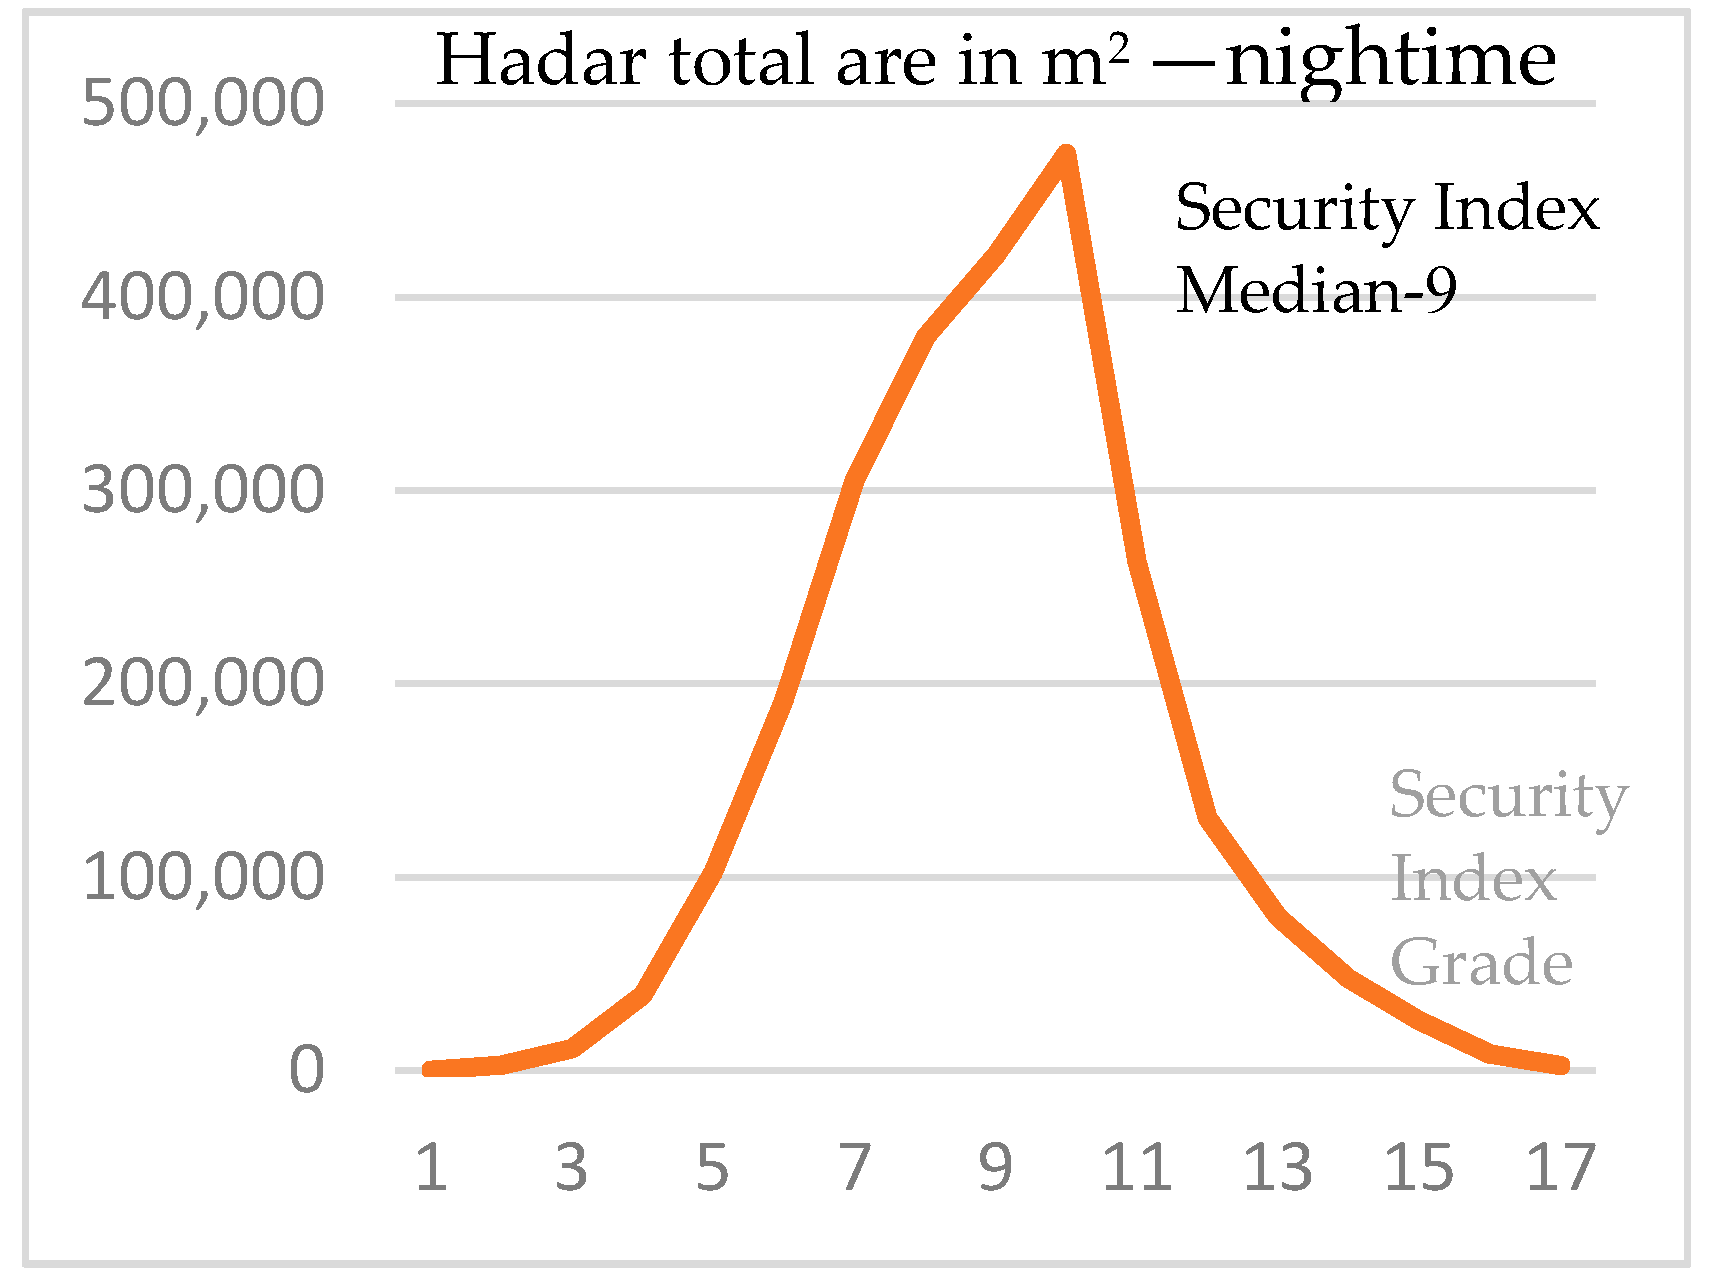
The additional layer of streetlights shows that areas that are defined unsecured during daytime and marked dark become darker and relatively more unsecure during nighttime. The interview results confirm that these areas are considered dangerous, and people avoid these areas during nighttime. Adding the streetlight raster map shows additional areas with a low level sense of security that were not defined as unsecure in the daytime analysis map (Figure 3). Scheme analysis 3 and 4 for nighttime security shows that there is an intensity growth in the security levels towards additional unsecure areas with lower levels of security grades spreading in the neighborhood. This means that during nighttime the scheme peak shifts to the right, showing that areas that were secure during the day joined the nonsecure nighttime areas, thus, decreasing the total sense of security and broadening the nonsecure total area.
In addition to the comprehensive security analysis for the whole neighborhood, we conducted a detailed security analysis for specific urban spaces: the Bahai garden, Figure 4, and Benjamin garden, Figure 5, having clear security differences for daytime and nighttime. Figure 4 and Figure 5 show the security analysis of these areas in detail.
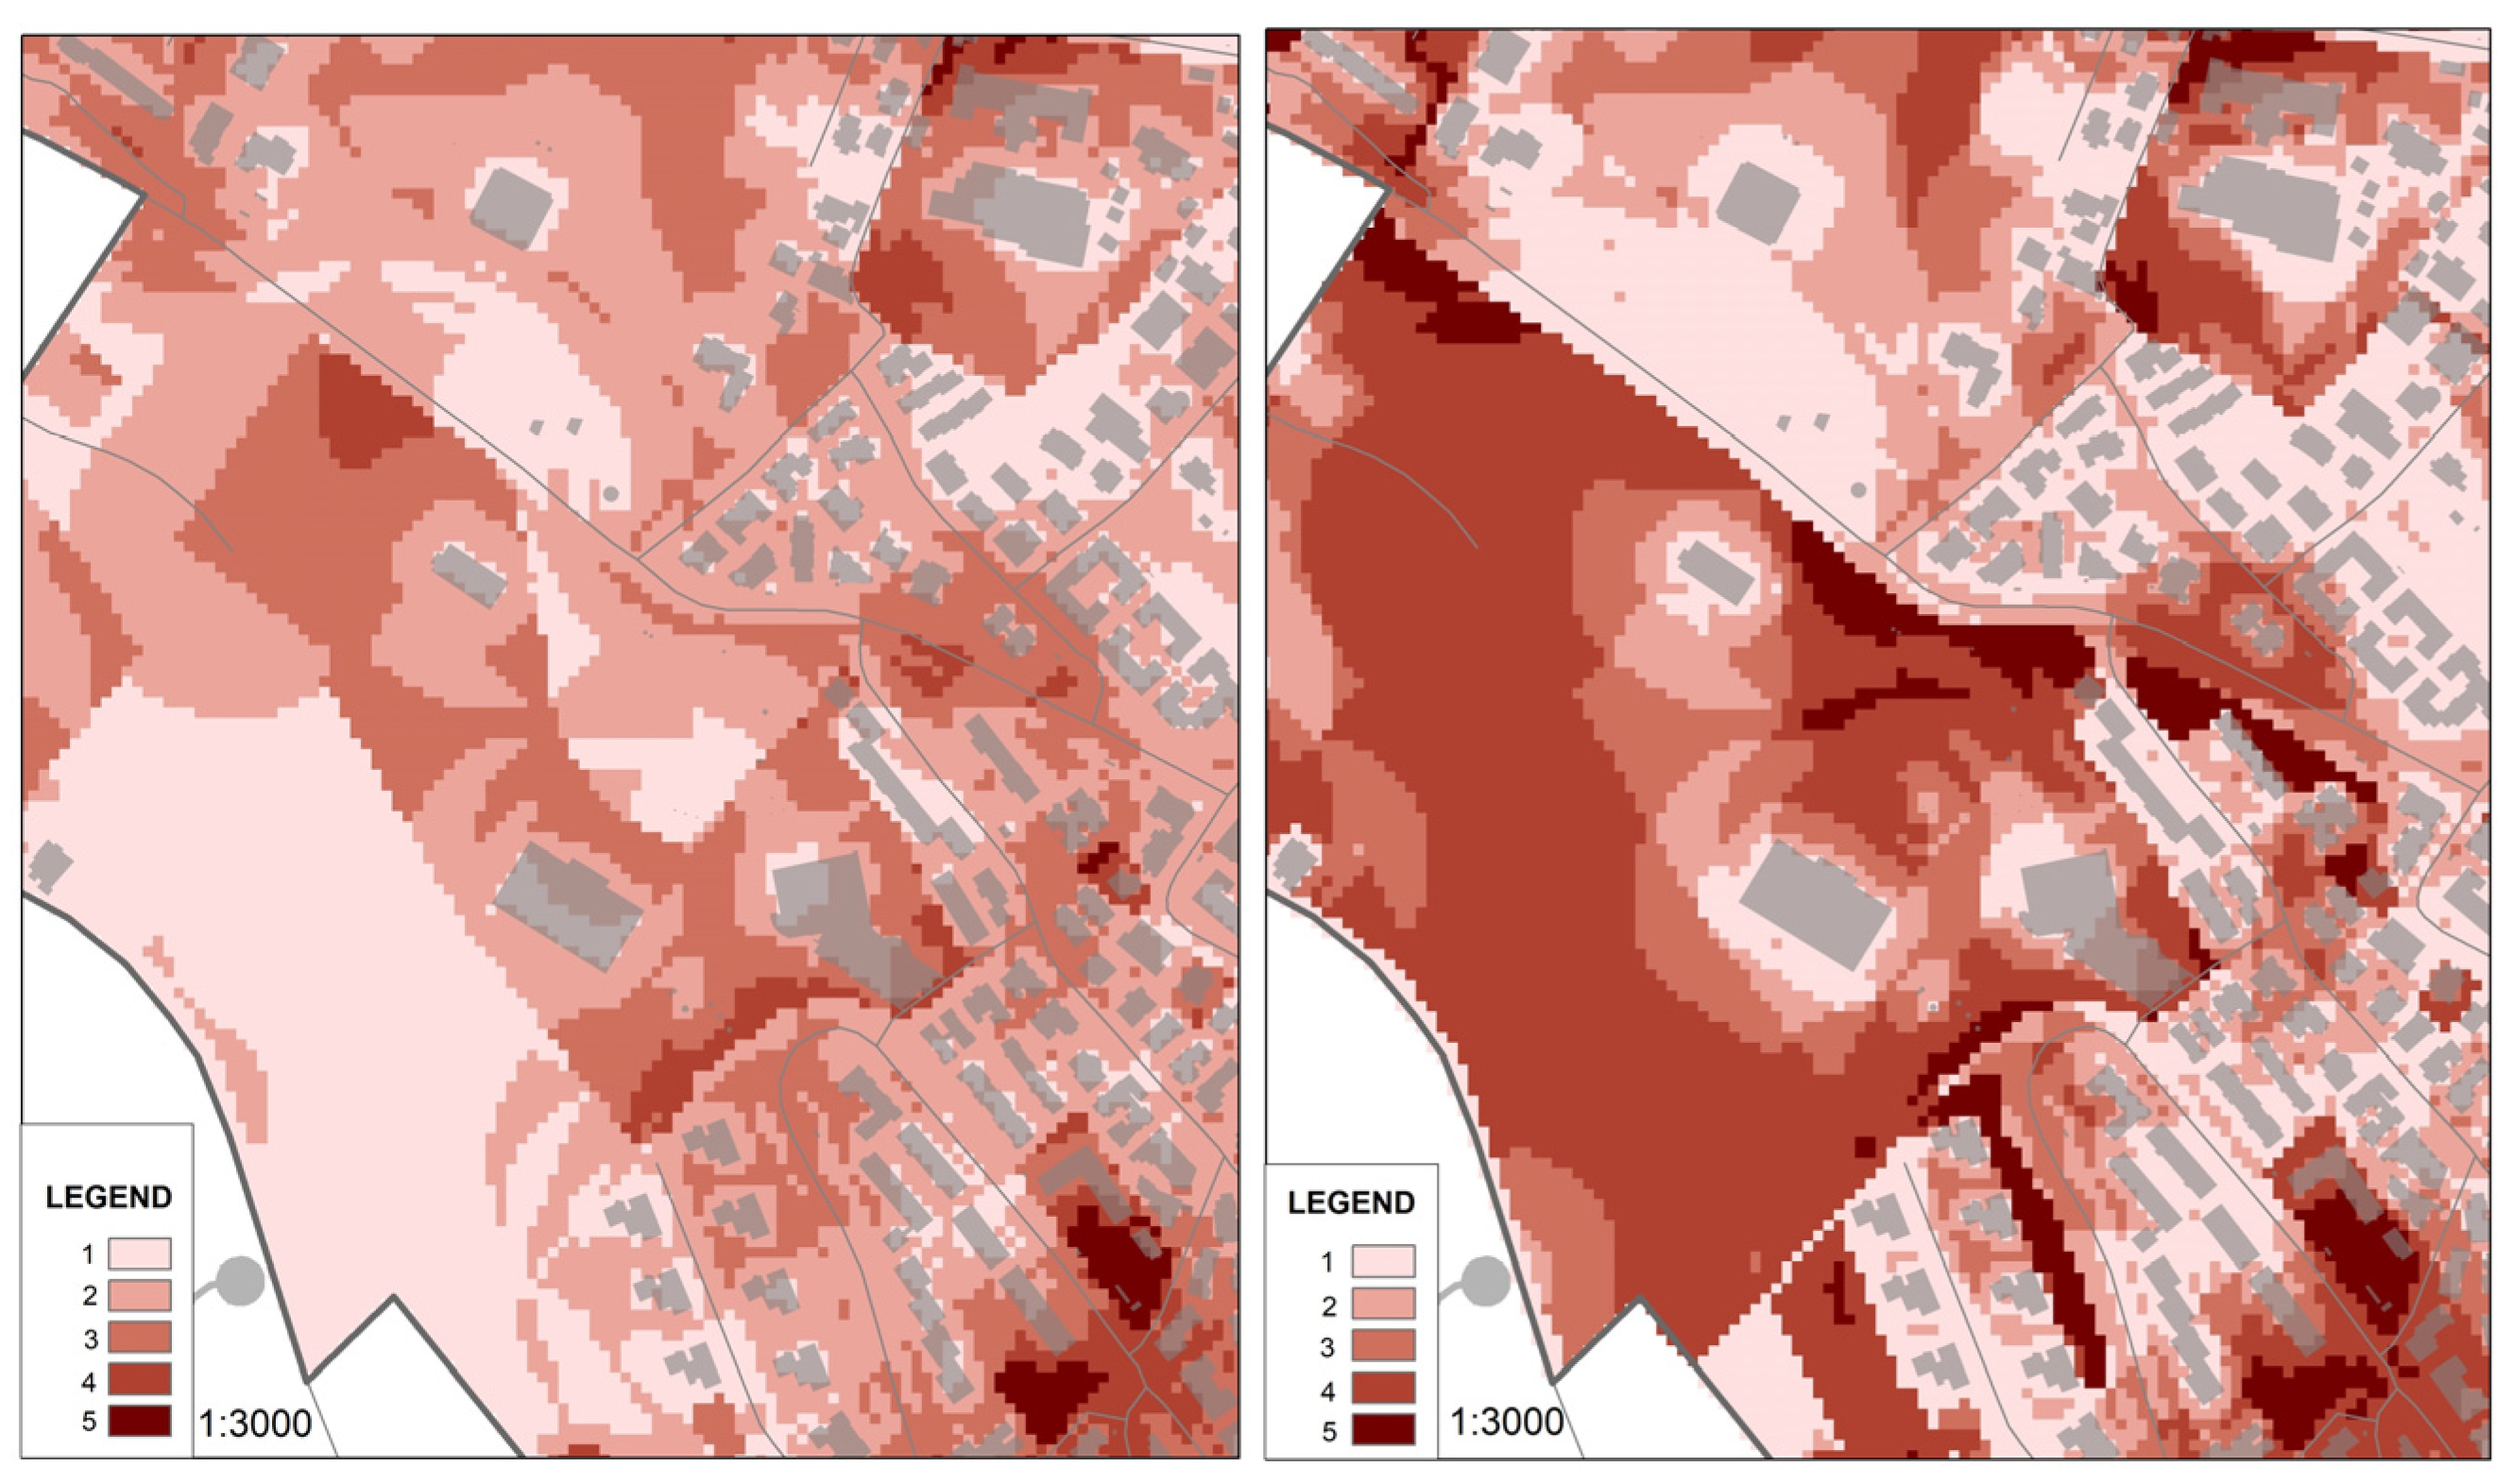
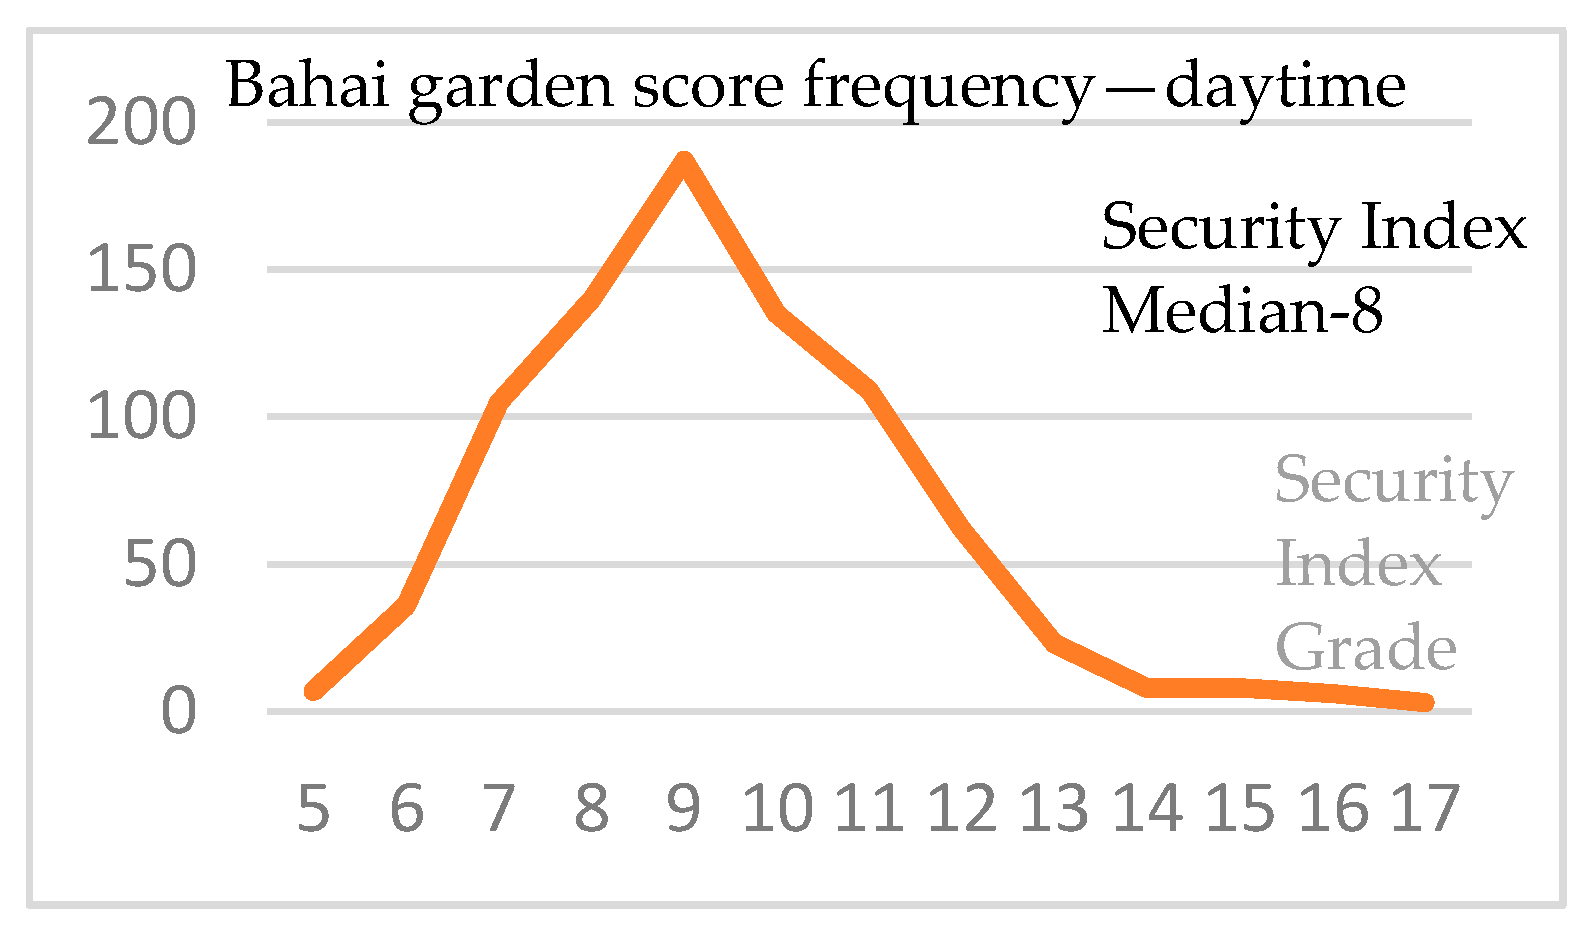
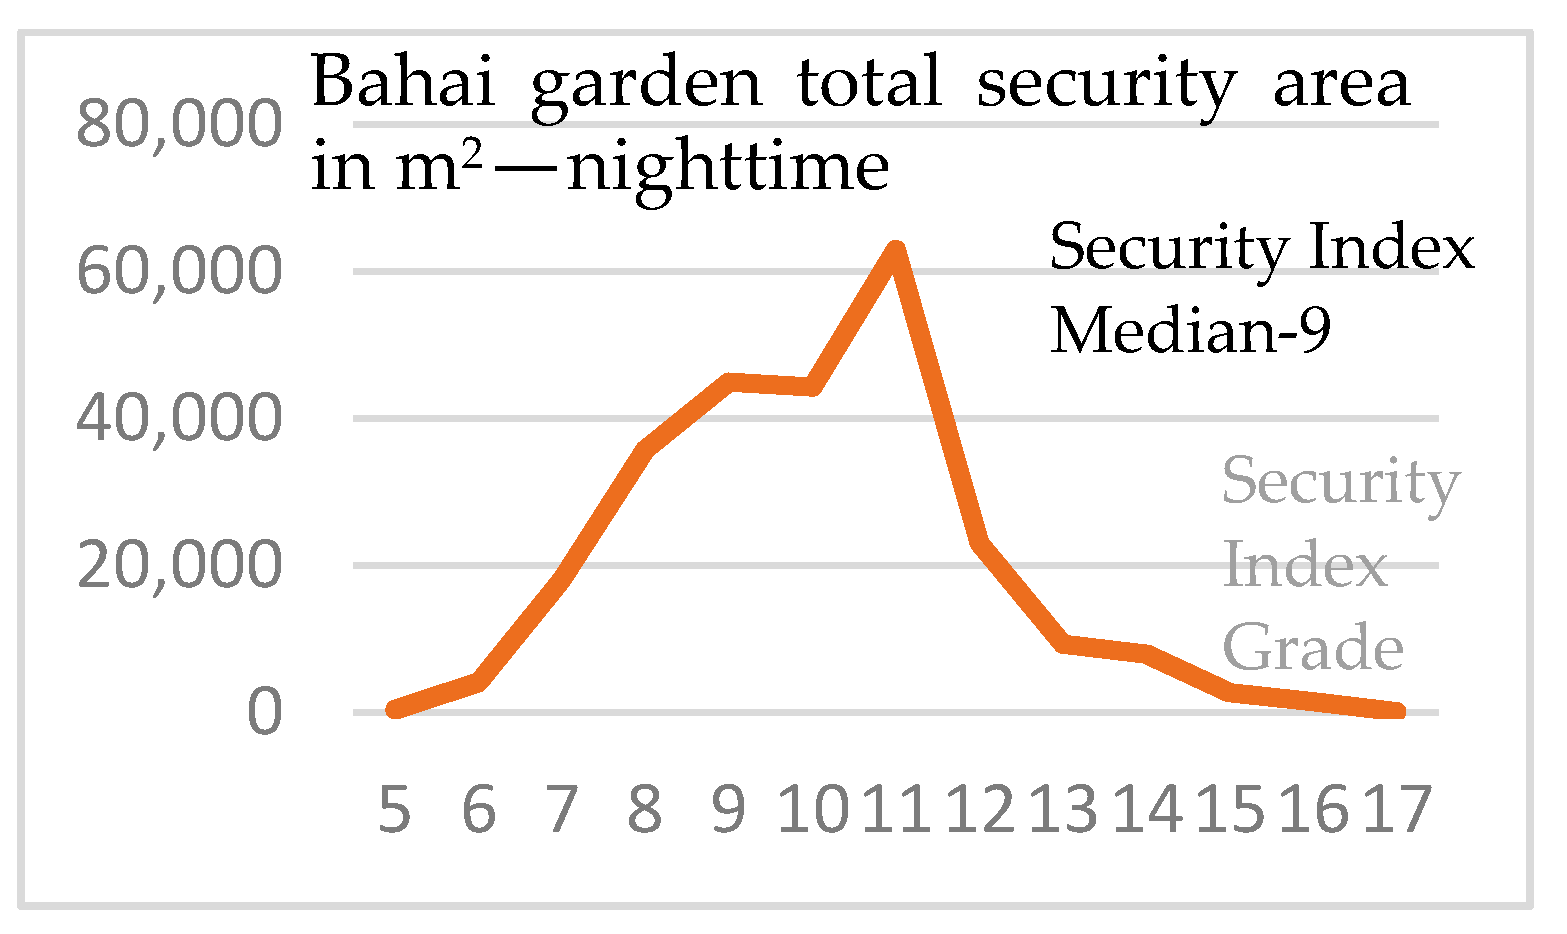
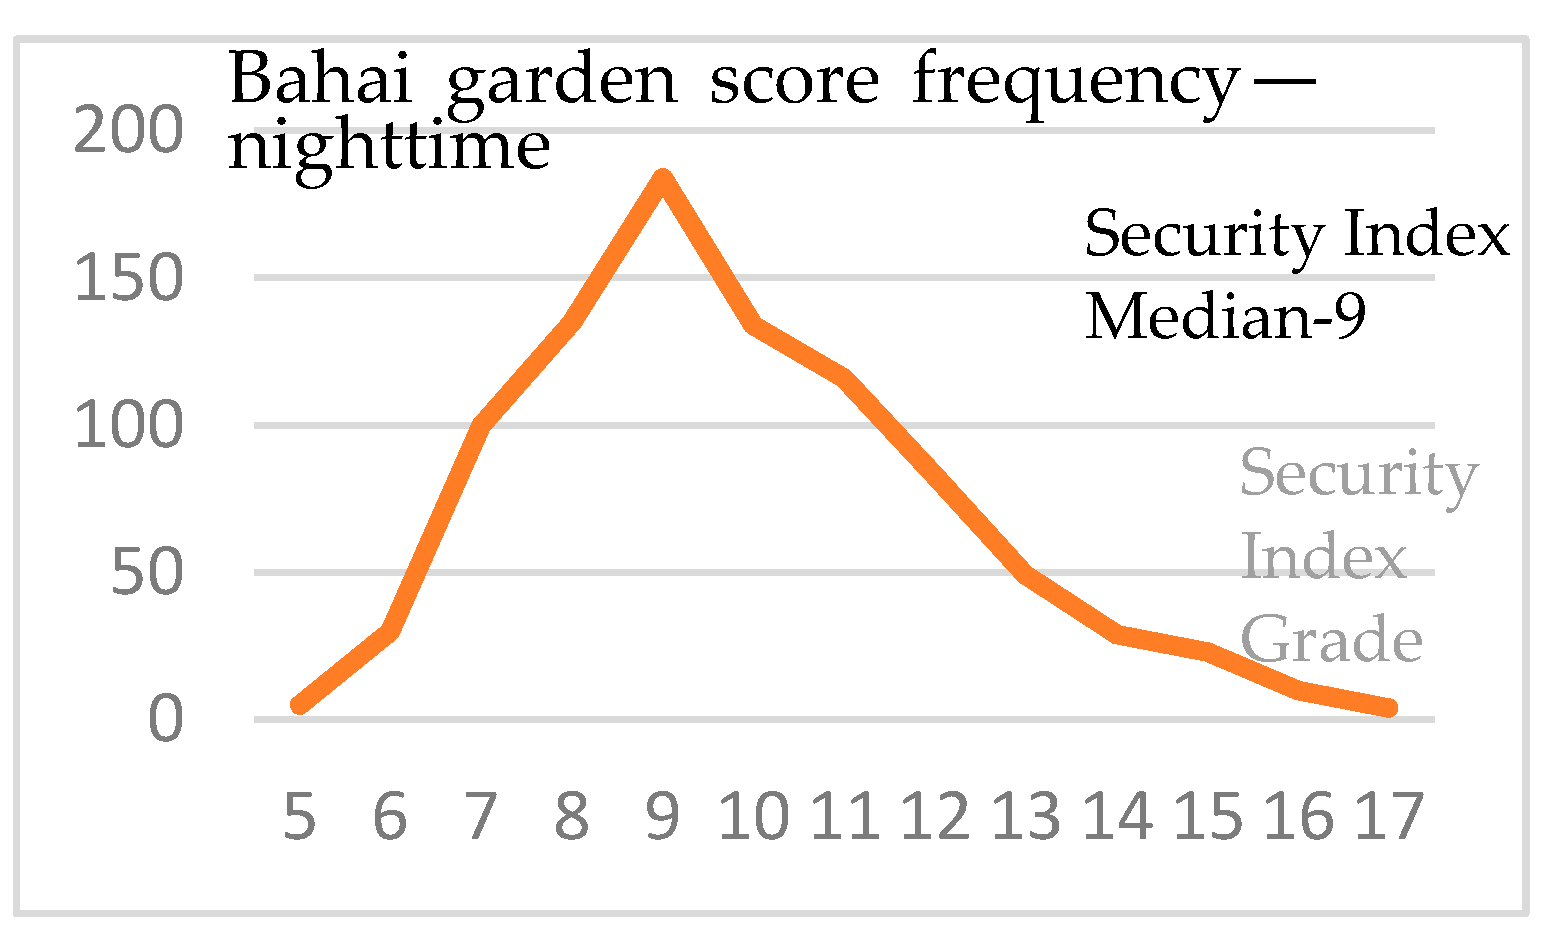
A clear difference in security levels is recognized in the Bahai garden. The analysis map shows that during the day, high levels of security were recorded. However, during the night it appears as an area with low levels of security. Because this garden is a private garden and is closed to the public during the night, the issue of nighttime security does not pose a substantial threat to the public (Figure 4). Scheme 5 and Scheme 6 show the same tendency in the security levels, where most of the Bahai garden area scored relatively high levels of security. Scheme 7 and Scheme 8 show that during nighttime there is a shift towards lower level of security. However, their frequency does not change in the same tendency, meaning that the amount of unsecured area does not increase. The frequency was counted as the number of occurrences of each security ranking. After calculating the different parameters, every cell ranking was counted and the number of cells for each ranking was summed and compared for different areas. The frequency measurement was important to evaluate and compare to the total square meters because the accumulation of the security categories is different than their overall sum of area. This comparison proves that most of the neighborhood’s security is repeatedly calculated as neutral and neither extremely safe nor extremely unsafe.
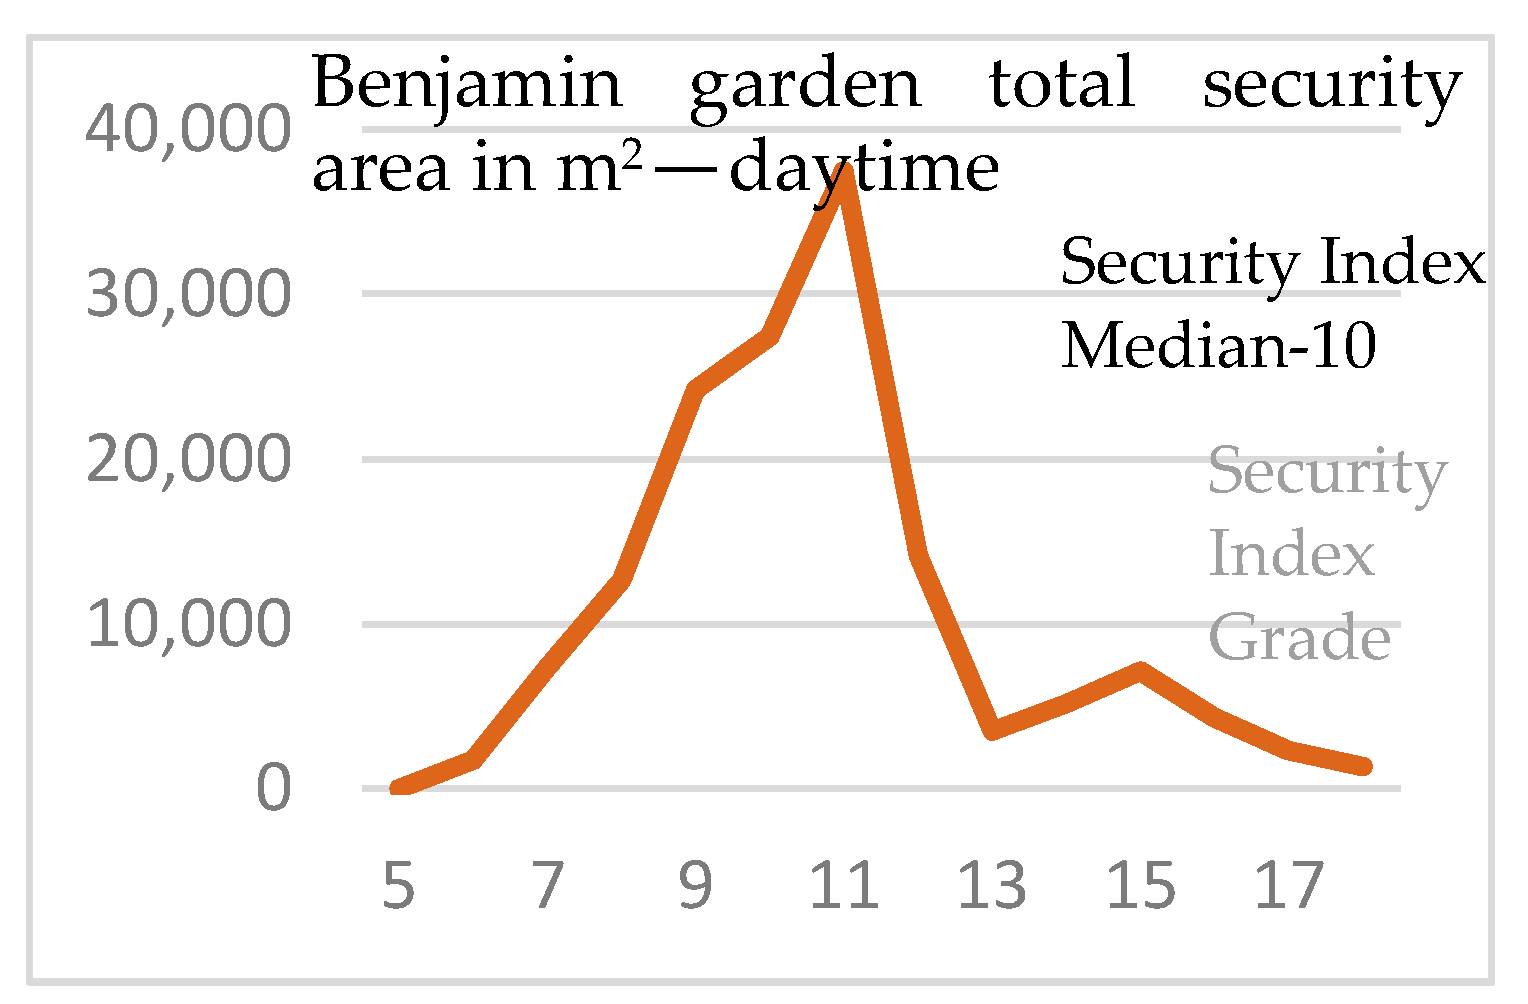
A difference in security levels was also noted in Benjamin garden at nighttime. The difference was clear; the low levels were deeper and widely spread in Benjamin garden. The interviews revealed that the Benjamin garden serves as a place for substance abuse during different times of the day, which increases during the night. The security model points out a sense of insecurity and future detailed research may be able to focus on specific dangerous spaces within the garden (Figure 5). Scheme 9 and Scheme 10 show the same tendency in the security levels, where most of Benjamin garden area scored relatively low levels of security. At night there is not a drastic shift in tendency, Scheme 11 and Scheme 12 show stable or slight movement of the security levels towards lower levels. This emphasizes that Benjamin garden is unsecure during nighttime and with wide hotspot of unsecured area during daytime.
6. Validation Methods
Measuring security is a challenging task, as it is made up of many intertwined components that affect each other. Any tug of this delicate fabric on one side, pulls the threads and tears a hole in a loose, unstable piece of the cloth. Evaluating the strength of the fabric depends on the many threads that build it. In this research, we applied two evaluation methods to strengthen the SRI results. (1) One method of objectively validating the security index is by comparing the unsecure hotspots with vandalism occurrences that take place in less secure areas (vandalism calls to the 106 call center from the municipality of Haifa). Vandalism also causes reduction in the sense of security and decrease the urban population’s use of the vandalized areas. (2) The other method conducted an interview with representative residents from different social groups in Hadar and several stakeholders, and applied the ESRI collector app. These validation methods challenge the results shown in the qualitative SRI tool. Thus, this brings an independent, nonrelated context to a new way of evaluating hotspots of insecurity and their causes. The interviewees drew their most and least secure perspectives on maps, and graded their preferences of the neighborhood. These datasets were digitized and arranged in tables so that they can be transferred to ArcMap. Both validation methods are described in the following sections.
6.1. Assessing Street Crimes with Vandalism Map Calls to the 106 Call Center
The security index demonstrates how chosen urban features have a cumulative effect on the urban population. The features that were singled out from previous research were accumulated into hot spots and unsecure areas. In addition to this groundbreaking method of isolating specific urban features that affect the inhabitants’ sense of security, there is a need to validate the findings.
One objective factor that can validate the security fabric of the urban landscape is vandalism incidents. Vandalism is rooted in aggression, and that aggression is influenced by numerous factors such as substance abuse, gender, and other contextual factors [71]. Such factors can be perceived as driven by equity seekers—those who feel they are treated unfairly, and have low levels of self control, engage aggressively with their environment, and practice vandalism [72,73]. These factors and others suggest that urban areas may be more susceptible to vandalism based on diminished equity, substance abuse, and low levels of control, meaning these areas are less secure. In that aspect, a sense of community can lower vandalism, strengthen the levels of control over its members’ behavior, and in turn it can help reduce perceived threats [74].
The method used for analyzing the vandalism hotspots was kernel density. This tool works well with point incidents, and by interpolating proximity and density, creates a layer of hotspots. The search radius that formed the clusters of reported vandalism was calculated automatically (bandwidth). By smoothing the surface over each point, kernel density calculates the value of the surface based on clusters of incidents and the distance between them. This means that if there is a condensed cluster over a small area, then the surface is graded as a high density hotspot of incidents. However, if the same number of incidents is recorded over a larger area, the surface between these incidents is displayed as a low density perimeter and not as a hotspot [75,76].
The vandalism surface is shown alongside the security rating index nighttime analysis (Figure 6). The comparison shows that some areas that are less secure during the night indeed suffer from increased vandalism reported to the municipality. These hotspots of vandalism indicate that the weak urban fabric is attracting chaos and encourages destructive behavior, and according to the security rating index the urban features are reducing the safety of these areas.
This corroboration is most important in fine tuning the security rating index and validating the findings, as the areas inflicted by vandalism are indeed less safe for passersby due to this type of criminal activity.
6.2. Urban Survey, Interview Design, and Mapping
For validating the security analysis results, we conducted two formats of survey: frontal interviews and an on-site application (ESRI collector app). We developed a pilot interview of representative residents from different social groups in Hadar and several stakeholders who are involved in different urban aspects of Hadar. From both app information and interviews, the security related findings were (1) mapped and analyzed using the GIS system; and (2) an embedded questionnaire in the ESRI collector app mapped different aspects of the urban environment while grading various parameters of urban features. The ESRI collector app allowed interviewees to pinpoint their exact location in a granular scale and sentiment, and was used actively on-site for street evaluation mapping of different aspects of the urban environment.
In the Hadar neighborhood, there is an interesting phenomenon: most residents ascribe to a specific homogeneous community network of a certain type. For example, social groups of students, volunteer-scouts’ community, Jewish-orthodox community, and more. Each of defined homogeneous social community lives in distinct streets, some in specific buildings. For the pilot interview, we asked representative from each group to participate. In addition, we interviewed several stakeholders representing people who work in Hadar, the city planning department, police, and urban planners and designers. Due to research limitation, we conducted only a pilot validation to confirm the security model results. This pilot yielded sample data for indicating phenomenon and trends of sense of security in the neighborhood; further in-depth research will be developed in the future.
The interviews were conducted among various stakeholders: scouts movement activists, Garin Torani (Torah-based individuals and families who live in shared facilities), activists in various community groups who reside in Hadar, students who live in Hadar, representatives of residents’ organizations (for example, a group of people who live in a certain street in Hadar), merchants representatives, representatives from a local police station, social workers from the municipality, free profession (architects), and the municipality manager of “Hadar Community” located in Hadar. The interviews were conducted face-to-face, by several research assistants and took place at several locations in Hadar in relation to the interviewee’s location. The interviews were done during the winter of 2015. The analysis of the questionnaire was developed during 2016–2017.
The interviews included questions regarding streets and spaces that the different representatives from the social groups use at all hours of the day or night, streets and spaces they do not walk through due to low level of sense of security, urban regulations that dictate form, etc. In addition to the verbal questions and descriptions, the interviewers asked the participants to draw over a map of Hadar the streets they used in their everyday life, spaces they walk through, areas they stay in, etc. In addition, they pointed out, literally and by drawings, streets and urban spaces with low or high sense of security, especially streets and urban spaces they use, or those they avoid.
One of the main findings was that people who belong to different social groups use the urban area differently (Figure 7). It appears to be that different social groups use different functions in the same neighborhood according to their specific needs. For example, different social groups shop in different grocery stores, located in specific areas of the neighborhood that affect the infrastructure and routes they use. However, we noticed that people from two social groups, volunteer-scouts’ community and students community, walk in the same urban routes. In both groups the people are relatively young, between 18–20 years for volunteer-scouts’ community and 20–25 years for students community; however, this issue needs more investigation in future research. Figure 6 demonstrates this phenomenon for four different social groups that live in the same neighborhood: the Kibbutz group, the Jewish-orthodox social group, the scouts group, and respondents who work in the neighborhood but do not live there.
The interviews yielded the most complex data source to analyze and quantify. The text included information that described demography, activity, landscape, and other aspects of the Hadar neighborhood. Most of the respondents described fragmented open spaces (parks, small gardens, inside areas, etc.) and streets (or sidewalks, open stairs, etc.) in the neighborhood with relatively high or low levels of security during daytime or nighttime in different parts of the neighborhood, but did not point out one homogeneous large area with low or high levels of security. This information was considered while reviewing the parameters and applied during the SRI sensitivity index scale adjustment.
All the interviews were accompanied by maps of the neighborhood, which were printed and taken by the interviewers so that they could mark on the maps the information that was given orally and was recorded later in the texts and tables. The maps allowed the interviewers to focus their interviews and to confront the interviewees with their sense of space and security in space. Sometimes impressions and grades given to certain areas in an interview, once asked to pinpoint on a map, were readjusted and caused reevaluation of the urban space.
6.2.1. Designing the Weighted Scale Table
The GIS analysis was based on the two information sources: interviews and ESRI collector app. Interviewees maps were analyzed, and each urban form (square, street, garden, etc.) was identified and assigned a unique ID.
The interviewees were asked to grade the urban areas between 5 (least safe, accessible, and walkable) and 1 (most safe, accessible, and walkable). These scores were coded into an Excel table using the 1–5 scale used by the other datasets. Thus, the textual definitions and observations were transferred to an Excel table using a scale from 1 to 5, and were associated with unique IDs of specific urban forms. The parameters that were measured were security and additional influencing aspects such as privacy, walkability, and accessibility in the built environment. However, other issues were pointed out during the interviews that affected the quality of life in Hadar, such as amount of shade, sidewalk quality, and presence of people without permanent housing. These indicators were also mentioned in the table and affected the total score of the urban space. These parameters were measured during daylight hours and nighttime hours. Table 2 demonstrates insights from the interviews of social groups in Hadar.
Another flaw in the scale design is that the data were displayed in too large a scale and could only be drawn for houses and streets. These ratings, though they showed correlation especially when reviewing the night data versus the day data, are subjective and reflect the interviewees own perception of the space affected by their gender, cultural background, and other sociological parameters, which were not addressed in this research.
Every street received a four-digit street code and every feature in the street received a three-digit street code. The urban elements that were coded (because they were frequently mentioned by the interviewees) were building, stairs, street, marketplace, and public garden. Each of these urban elements was mentioned as landmarks or nodes that affected the privacy, walkability, and security of the urban environs. For instance, a street could have received high walkability scores until it morphed into a staircase in which case the walkability score had plummeted dramatically. Or a marketplace had turned a safe and bustling street to a scary environment with very low security score at night. Table 2 demonstrates the urban vulnerability assessment of social group in Hadar neighborhood.
6.2.2. Interview and Mapping Analysis Results
The results were summarized according to the parameters under review: security was mentioned 121 times, walkability was mentioned 129 times, accessibility was mentioned 53 times, visibility was mentioned 29 times, people without permanent housing were mentioned 13 times, and privacy was mentioned 3 times. Each reference was given a mark between 1 and 5 depending on the positive or negative nature of the report. All of these results came from twenty interviews. These scores break down the feelings and impressions people gather while walking in Hadar. Some streets were not mentioned at all since they serve only its residents. The streets that were mentioned are all main pedestrian arteries that serve the general population and social groups of Hadar for shopping, work, and recreation.
The maps visualize insights that were drawn from the interviews, demonstrating differences between daytime and nighttime for security and walkability. Later, these mapping results were compared to the SRI model. In the interviews, the streets were often referred to in their entirety, and not to specific segments and no suitable map signs accompanied this information. Drawing the maps did bring forth the problem of specifying street sections. The mapping visualization from the interview results created four main maps: (1) security during daytime, (2) security during nighttime, (3) walkability during daytime, and (4) walkability during nighttime. Analysis of the pilot maps show that a partial reference, even a nonreference, by the interviewees to the southeastern and northeastern parts of the neighborhood came from social groups that do not walk through or use these areas during their daily routine. Figure 8 and Figure 9 show the mapping results from the interviews for security and walkability during the daytime and nighttime of the different social groups.
7. Integrative Maps
Combining results of the SRI with the validation results allow for pointing out and better understanding unsecured hot spots in urban areas, and act as core setting for defining morphological characteristics of urban elements and situations that create an unsecure feeling in certain urban places. Both the integrated analysis of the model in Hadar and the interviews suggest that there is a high sense of security at nighttime in Massada Street. The model analysis pointed out several areas located at the northwestern part of the neighborhood as an area with low-level sense of security and was also noted as such by the interviewees and collector application results. In addition, several streets located at the center of Hadar mentioned by the interviewees as having low levels of security at nighttime (Nordau, Jerusalem, and Hertzel Streets) also received low levels of security scores by the model (Figure 10). All these aspects reinforce and validate the SRI results. However, when looking at the results of the interview analysis of daytime level of security (Figure 10), there are several contradictions—for secured streets mentioned by the respondents, the model showed segments with a low level of security. This contradiction may be a result of the respondents pointing out an entire street instead of segments in the street. The validation of the model analysis confirms that there are urban areas where there is a correspondence between the findings of the SRI model and the reaction of the respondents, both in the interviews and the collector application results, and there are number of places where there is a partial correlation. In addition, it should be noted that there are several areas in the neighborhood that were not mentioned by the stakeholders as having foci problematic locations; hence, it should be noted that comprehensive follow-up research is required to validate this phenomenon. The ability to measure the level of security in diverse urban environments can assist designers to develop better urban landscapes and prevent spatial inequality in urban planning. Stakeholders that use the SRI can easily breakdown hotspots to compromised urban parameters, and specific measures can be taken to improve the overall security. The specific urban security parameters can then be improved, and while some parameters may be impossible to change, security can still be enhanced by addressing other issues that emerge from the analysis as insecure. The validation done in the interviews can also direct the planners to the more influential parameters that if changed will have a significant bearing on the urban security. These different methods which enrich the toolkit of urban stakeholders can be used separately, but the added value of validation by interviews allows fine tuning and brings forth cultural, social, and historical singularities.
8. Conclusions and Discussion
The aim of this paper was to measure security in the urban environment by using the SRI model and to validate its results among social groups. The model singles out vulnerable areas in the city and places a spotlight over physical urban elements creating low levels of urban security. The evaluation process of the social group interviews validate the main secured and unsecured areas. The vandalism reports also validate the SRI model by comparing destructive behavior with the nonsecure areas highlighted by SRI. The SRI allows quantification of urban features identified in previous research as influential on urban security. Quantifying and rating in an equivalent scale allows for comparing different areas, and better understanding the differences in the sense of security. Quantifying urban elements can break down the sense of security into categories that can dictate and alter the human behavior. Using a scalable method, alongside testimonials and vandalism evidence, can change the way we perceive urban features that are sometimes overlooked in the planning process. By isolating specific urban features that come to light by the SRI, it is easier to plan ahead in order to improve the security as a whole.
The implementation of the SRI model, the pilot validation process, and the vandalism data analysis lead to several main conclusions: (1) There is a possibility to assess and rate in quantitative terms the impact of the built environment and urban elements on the sense of security. (2) The model allows for evaluation of a number of urban elements integrally and thereby identifying hotspots in the urban areas, which can indicate a recurrence of unsecured hotspots in these places. (3) The model forms new insights of the built environment, especially in understanding the functionality of various urban areas and their security level. (4) The validation process of the interviews and the vandalism data analysis reinforced the model implementation results. However, additional examination needs to be developed for analyzing detailed urban features. (5) The analysis shows that there is an interconnectivity between the methods presented in the article; the results show that the SRI method measures the level of security in the built environment, where different urban features are interconnected and influence each other, and that the security level is reflected in the walking path of people from diverse social groups and the vandalism calls from the municipality of Haifa.
The social group analysis enables better understanding of the relation and connection between the sense of security and the way people use the urban environment and how security influences their choice of routes to walk through, stay in, etc. In addition, although people who belong to different social groups use the urban environment differently, there are urban areas where people from all groups chose not to use or not to walk through due to security issues. This indicates that safe urban areas are unsafe for all social groups. Therefore, when planning a neighborhood, there is a need to explore the social groups who intend to use the neighborhood facilities. Taking into consideration various spatial needs from the built environment (functionality, commerce, education, etc.) and considering these during the design and planning process will result in developing safer urban areas.
The model may support creating new perspectives of the built environment, especially understanding the functionality of various urban areas, and in particularly their level of vulnerability and security. The fluctuation of sense of security may emphasize spatial inequality in urban planning; therefore, the ability to recognize low level areas of security can assist urban planning.
This study was based on an examination of urban elements only, without referring to socioeconomic, cultural, and other data. In the future, the aim is to include these elements as integrated aspects of the model for validation. This will result in developing capabilities to distinguish between urban spatial characteristics or social influence affecting the sense of security in the built environment, and further study is needed to define urban morphology contributing to urban environments. In the future, with accordance with crime data, a more accurate analysis may be implemented to assess the main detailed characteristics influencing security in various places of the built environment. The aspiration is to develop this model as a tool aiding urban planners and designers in future planning process for examining existing urban conditions and for improving the level of security in the city as a whole, as suggested in one alternative in Shach-Pinsly and Capeluto [7].
Author Contributions
All authors contributed equally to the compilation of this article and to the preparation of the final manuscript. Conceptualization, D.S.-P. and T.G.; formal analysis, D.S.-P. and T.G.; investigation, D.S.-P. and T.G.; methodology, D.S.-P. and T.G.; visualization, D.S.-P. and T.G.; writing—original draft, D.S.-P. and T.G.; writing—review and editing, D.S.-P. and T.G. All authors have read and agreed to the published version of the manuscript.
Funding
This research received no external funding.
Institutional Review Board Statement
Ethical review and approval were waived for this study, due to privacy and copyright.
Informed Consent Statement
Informed consent was obtained in Hebrew from all subjects involved in the study.
Data Availability Statement
The data presented in this study are available on request from the corresponding author. The data are not publicly available due to privacy and copyright.
Conflicts of Interest
The authors declare no conflict of interest.
References
- Ahlbrandt, R. Neighborhoods, People, and Community; Springer Science & Business Media: New York, NY, USA, 2013. [Google Scholar]
- Brasington, D.M.; Hite, D. Demand for environmental quality: A spatial hedonic analysis. Reg. Sci. Urban Econ. 2005, 35, 57–82. [Google Scholar] [CrossRef] [Green Version]
- Chen, H.; Hao, Y.; Li, J.; Song, X. The impact of environmental regulation, shadow economy, and corruption on environmental quality: Theory and empirical evidence from China. J. Clean. Prod. 2018, 195, 200–214. [Google Scholar] [CrossRef]
- Shach-Pinsly, D. Visual exposure and visual openness analysis model used as evaluation tool during the urban design development process. J. Urban. 2010, 3, 161–184. [Google Scholar] [CrossRef]
- Moura, F.; Cambra, P.; Gonçalves, A.B. Measuring walkability for distinct pedestrian groups with a participatory assessment method: A case study in Lisbon. Landsc. Urban Plan. 2017, 157, 282–296. [Google Scholar] [CrossRef]
- Capeluto, I.G.; Plotnikov, B. A method for the generation of climate-based, context-dependent parametric solar envelopes. Archit. Sci. Rev. 2017, 60, 395–407. [Google Scholar] [CrossRef]
- Shach-Pinsly, D.; Capeluto, I.G. From Form-Based to PerFormance Based Codes. Sustainability 2020, 12, 5657. [Google Scholar] [CrossRef]
- Lo, C.P.; Faber, B.J. Integration of Landsat Thematic Mapper and census data for quality of life assessment. Remote Sens. Environ. 1997, 62, 143–157. [Google Scholar] [CrossRef]
- Benz, U.C.; Hofmann, P.; Willhauck, G.; Lingenfelder, I.; Heynen, M. Multi-resolution, object-oriented fuzzy analysis of remote sensing data for GIS-ready information. ISPRS J. Photogramm. Remote Sens. 2004, 58, 239–258. [Google Scholar] [CrossRef]
- Ma, L.; Liu, Y.; Zhang, X.; Ye, Y.; Yin, G.; Johnson, B.A. Deep learning in remote sensing applications: A meta-analysis and review. Isprs J. Photogramm. Remote Sens. 2019, 152, 166–177. [Google Scholar] [CrossRef]
- Shach-Pinsly, D. Measuring Security in the Built Environment: Evaluating Urban Vulnerability in a Human-Scale Urban Form. Landsc. Urban Plan. 2019, 191, 103412. [Google Scholar] [CrossRef]
- Shach-Pinsly, D.; Ganor, T. Security Sensitivity Index: Evaluating urban vulnerability. Proc. ICE Urban Des. Plan. 2015, 168, 115–128. [Google Scholar] [CrossRef]
- Jacobs, J. The Death and Life of Great American Cities; Vintage: New York, NY, USA, 1961. [Google Scholar]
- Newman, O. Defensible Space; Macmillan: New York, NY, USA, 1972; p. 264. [Google Scholar]
- Marcus, C.C.; Sarkissian, W. Housing as If People Mattered: Site Design Guidelines for the Planning of Medium-Density Family Housing; University of California Press: Berkeley, CA, USA, 1986; Volume 4. [Google Scholar]
- Gehl, J. Cities for People; Island Press: Washington, DC, USA, 2010. [Google Scholar]
- Garau, C.; Pavan, V.M. Evaluating urban quality: Indicators and assessment tools for smart sustainable cities. Sustainability 2018, 10, 575. [Google Scholar] [CrossRef] [Green Version]
- Virta, S. Governing urban security in Finland: Towards the ‘European model’. Eur. J. Criminol. 2013, 10, 341–353. [Google Scholar] [CrossRef]
- Little, R.G. Holistic strategy for urban security. J. Infrastruct. Syst. 2004, 10, 52–59. [Google Scholar] [CrossRef] [Green Version]
- Jore, S.H. Ontological and epistemological challenges of measuring the effectiveness of urban counterterrorism measures. Secur. J. 2019, 1–16. [Google Scholar] [CrossRef] [Green Version]
- Hillier, B. Can streets be made safe? Urban Des. Int. 2004, 9, 31–45. [Google Scholar] [CrossRef]
- López, M.; Nes, A. Space and crime in Dutch built environments. In Proceeding of the 6th International Symposium on Space Syntax, Istanbul, Turkey, 12–15 June 2007. [Google Scholar]
- Shu, S. Housing layout and crime vulnerability. Urban Des. Int. 2000, 5, 177–188. [Google Scholar]
- Mulholland, H. Perceptions of Privacy & Density in Housing; Design for Homes Popular Housing Research; Mulholland Research & Consulting: London, UK, 2003. [Google Scholar]
- Llewelyn-Davies (Firm); Holden McAllister Partnership. Safer Places: The Planning System and Crime Prevention; Thomas Telford: London, UK, 2004. [Google Scholar]
- Cozens, P.M.; Saville, G.; Hillier, D. Crime prevention through environmental design (CPTED): A review and modern bibliography. Prop. Manag. 2005, 23, 328–356. [Google Scholar] [CrossRef] [Green Version]
- Cozens, P.; Love, T. A review and current status of crime prevention through environmental design (CPTED). J. Plan. Lit. 2015, 30, 393–412. [Google Scholar] [CrossRef]
- Bohl, C.C. New urbanism and the city: Potential applications and implications for distressed inner-city neighborhoods. Hous. Policy Debate 2000, 11, 761–801. [Google Scholar] [CrossRef]
- Congress for the New Urbanism. Charter of the New Urbanism. CNU. 2001. (New York City, New York, 7–10 June 2001). Available online: http://www.cnu.org/charter (accessed on 11 September 2020).
- Knaap, G.; Talen, E. New urbanism and smart growth: A few words from the academy. Int. Reg. Sci. Rev. 2005, 28, 107–118. [Google Scholar] [CrossRef]
- Atreya, A.; Kunreuther, H. Measuring Community Resilience: The Role of the Community Rating System (CRS). Available online: https://ssrn.com/abstract=2788230 or http://dx.doi.org/10.2139/ssrn.2788230 (accessed on 10 January 2021).
- Diaz-Sarachaga, J.M.; Jato-Espino, D. Do sustainable community rating systems address resilience? Cities 2019, 93, 62–71. [Google Scholar] [CrossRef]
- Mulligan, M.; Steele, W.; Rickards, L.; Fünfgeld, H. Keywords in planning: What do we mean by ‘community resilience’? Int. Plan. Stud. 2016, 21, 348–361. [Google Scholar] [CrossRef]
- Abdulla, K.M.; Abdelmonem, M.G.; Selim, G. Walkability in historic urban spaces: Testing the safety and security in Martyrs’ Square in Tripoli. Int. J. Archit. Res. Archnet-Ijar 2017, 11, 163–177. [Google Scholar] [CrossRef] [Green Version]
- Southworth, M. Designing the walkable city. J. Urban Plan. Dev. 2005, 131, 246–257. [Google Scholar] [CrossRef]
- Shamsuddin, S.; Hassan, N.R.A.; Bilyamin, S.F.I. Walkable environment in increasing the liveability of a city. Procedia-Soc. Behav. Sci. Behav. Sci. 2012, 50, 167–178. [Google Scholar] [CrossRef] [Green Version]
- Ewing, R.; Clemente, O. Measuring Urban Design: Metrics for Livable Places; Island Press: Washington, DC, USA, 2013. [Google Scholar]
- Forsyth, A. What is a walkable place? The walkability debate in urban design. Urban Des. Int. 2015, 20, 274–292. [Google Scholar] [CrossRef]
- Frank, L.D. Community design and individual wellbeing: The multiple impacts of the built environment on public health. In Division of Research Coordination, Planning and Translation; League, C.A., Dearry, A., Eds.; National Institute of Environmental Health Sciences: Research Triangle Park, NC, USA, 2004; pp. 55–61. Available online: https://www.niehs.nih.gov/news/events/pastmtg/assets/docs_n_z/supplementary_informationoverviewfrank_508.pdf (accessed on 11 September 2020).
- Fava, G.A.; Ruini, C. Well-being therapy. In Encyclopedia of Quality of Life and Well-Being Research; Springer Netherlands: Dordrecht, The Netherlands, 2014; pp. 7108–7109. [Google Scholar]
- Giles-Corti, B.; Vernez-Moudon, A.; Reis, R.; Turrell, G.; Dannenberg, A.L.; Badland, H.; Owen, N. City planning and population health: A global challenge. Lancet 2016, 388, 2912–2924. [Google Scholar] [CrossRef]
- Sohn, D.W.; Yoon, D.K.; Lee, J. The impact of neighborhood permeability on residential burglary risk: A case study in Seattle, USA. Cities 2018, 82, 27–34. [Google Scholar] [CrossRef]
- Lehmann, S. Advocacy for the compact, mixed-use and walkable city: Designing smart and climate resilient places. Int. J. Environ. Sustain. 2016, 5, 1–11. [Google Scholar] [CrossRef]
- Porębska, A.; Rizzi, P.; Otsuki, S.; Shirotsuki, M. Walkability and Resilience: A Qualitative Approach to Design for Risk Reduction. Sustainability 2019, 11, 2878. [Google Scholar] [CrossRef] [Green Version]
- Rogers, S.H.; Gardner, K.H.; Carlson, C.H. Social capital and walkability as social aspects of sustainability. Sustainability 2013, 5, 3473–3483. [Google Scholar] [CrossRef] [Green Version]
- Gilderbloom, J.I.; Riggs, W.W.; Meares, W.L. Does walkability matter? An examination of walkability’s impact on housing values, foreclosures and crime. Cities 2015, 42, 13–24. [Google Scholar] [CrossRef]
- Walk Score. July 2007. Available online: https://www.walkscore.com/ (accessed on 25 November 2020).
- Sandalack, B.A.; Alaniz Uribe, F.G.; Eshghzadeh Zanjani, A.; Shiell, A.; McCormack, G.R.; Doyle-Baker, P.K. Neighbourhood type and walkshed size. J. Urban. Int. Res. Placemaking Urban Sustain. 2013, 6, 236–255. [Google Scholar] [CrossRef]
- Walkshed. 2010. Available online: http://www.walkshed.org/ (accessed on 25 November 2020).
- Betts, B. Software reviews-Apps for the smart city [Reviews Software]. Eng. Technol. 2016, 11, 82–83. [Google Scholar]
- Walkonomics. 2011. Available online: https://walkonomics.com/ (accessed on 25 November 2020).
- Wimbardana, R.; Tarigan, A.K.; Sagala, S. Does a Pedestrian Environment Promote Walkability? Auditing a Pedestrian Environment Using the Pedestrian Environmental Data Scan Instrument. J. Reg. City Plan. 2018, 29, 57–66. [Google Scholar] [CrossRef] [Green Version]
- Zhang, Y.; Azzali, S.; Janssen, P.; Stouffs, R. Design for walkable neighbourhoods in Singapore using Form-based Codes. In Proceedings of the 11th International Forum on Urbanism: Reframing Urban Resilience Implementation, Barcelona, Spain, 10–12 December 2018. [Google Scholar]
- Yamagata, Y.; Yoshida, T.; Yang, P.P.; Chen, H.; Murakami, D.; Ilmola, L. Measuring quality of walkable urban environment through experiential modeling. In Urban Systems Design; Elsevier: Amsterdam, The Netherlands, 2020; pp. 373–392. [Google Scholar]
- Orozco, L.G.N.; Deritei, D.; Vancsó, A.; Vasarhelyi, O. Quantifying Life Quality as Walkability on Urban Networks: The Case of Budapest. In International Conference on Complex Networks and Their Applications; Springer: Cham, Switzerland, 2019; pp. 905–918. [Google Scholar]
- Hurst, C.E.; Gibbon, H.M.F.; Nurse, A.M. Social Inequality: Forms, Causes, and Consequences; Routledge: London, UK, 2016. [Google Scholar]
- Aharon-Gutman, M.; Burg, D. How 3D visualization can help us understand spatial inequality: On social distance and crime. Environ. Plan. B Urban Anal. City Sci. 2019. [Google Scholar] [CrossRef]
- Grant, U. Spatial Inequality and Urban Poverty Traps; Overseas Development Institute: London, UK, 2010. [Google Scholar]
- Kilroy, A. Intra-Urban Spatial Inequality: Cities as” Urban Regions”; World Bank: Washington, DC, USA, 2009. [Google Scholar]
- Liu, C.; Duan, D. Spatial inequality of bus transit dependence on urban streets and its relationships with socioeconomic intensities: A tale of two megacities in China. J. Transp. Geogr. 2020, 86, 102768. [Google Scholar] [CrossRef]
- Higgins, P.; Campanera, J.; Nobajas, A. Quality of life and spatial inequality in London. Eur. Urban Reg. Stud. 2014, 21, 42–59. [Google Scholar] [CrossRef]
- Saville, G.; Cleveland, G. An introduction to 2nd Generation CPTED: Part 1. Cpted Perspect. 2003, 6, 7–9. [Google Scholar]
- Talen, E. Design for diversity: Evaluating the context of socially mixed neighbourhoods. J. Urban Des. 2006, 11, 1–32. [Google Scholar] [CrossRef]
- Van Nes, A.; ZhaoHui, S. Network typology, junction typology and spatial configuration and their impacts on street vitality in Singapore. In Proceedings of the 7th International Space Syntax Symposium, Stockholm, Sweden, 8–10 June 2009; pp. 1–11. [Google Scholar]
- Greenberg, S.W.; Rohe, W.M.; Williams, J.R. Safety in urban neighborhoods: A comparison of physical characteristics and informal territorial control in high and low crime neighborhoods. Popul. Environ. 1982, 5, 141–165. [Google Scholar] [CrossRef]
- Clarke, R.V.; Weisburd, D. Diffusion of crime control benefits: Observations on the reverse of displacement. Crime Prev. Stud. 1994, 2, 165–184. [Google Scholar]
- Weisburd, D.; Groff, E.R.; Yang, S.M. The Criminology of Place: Street Segments and Our Understanding of the Crime Problem; Oxford University Press: Oxford, UK, 2012. [Google Scholar]
- Schweitzer, J.H.; Kim, J.W.; Mackin, J.R. The impact of the built environment on crime and fear of crime in urban neighborhoods. J. Urban Technol. 1999, 6, 59–73. [Google Scholar] [CrossRef]
- Shach-Pinsly, D.; Fisher-Gewirtzman, D.; Burt, M. Visual Exposure & Visual Openness integrated approach and comparative evaluation. J. Urban Des. 2011, 16, 197–220. [Google Scholar]
- Mitrany, M. Subjective Housing Density and the Housing Context. Ph.D. Thesis, Department of Architecture and Town Planning, The Technion–IIT, Haifa, Israel, 2001. [Google Scholar]
- Brown, G.; Devlin, A.S. Vandalism: Environmental and social factors. J. Coll. Stud. Dev. 2003, 44, 502–516. [Google Scholar] [CrossRef]
- Fisher, J.D.; Baron, R.M. An equity-based model of vandalism. Popul. Environ. 1982, 5, 182–200. [Google Scholar] [CrossRef]
- DeMore, S.W.; Fisher, J.D.; Baron, R.M. The Equity-Control Model as a Predictor of Vandalism among College Students 1. J. Appl. Soc. Psychol. 1988, 18, 80–91. [Google Scholar] [CrossRef]
- Goldstein, A.P. The Ecology of Aggression; Springer Science & Business Media: New York, NY, USA, 1994. [Google Scholar]
- E”SRI” Documentation. Available online: https://pro.arcgis.com/en/pro-app/tool-reference/spatial-analyst/how-kernel-density-works.htm (accessed on 11 September 2020).
- Levine, N. CrimeStat II: A Spatial Statistics Program for the Analysis of Crime Incident Locations, Part I; The U.S National Institute of Justice: Washington, DC, USA, 2002.
Figure 1.
Individual raster map analysis of each urban variable shown separately: (a) proximity of distance between buildings; (b) land use; (c) distance between junctions; and (d) streetlight density.
Figure 1.
Individual raster map analysis of each urban variable shown separately: (a) proximity of distance between buildings; (b) land use; (c) distance between junctions; and (d) streetlight density.
Scheme 1.
Hadar total security index grade area in m2 for daytime.
Scheme 2.
Hadar total security index grade frequency for daytime.
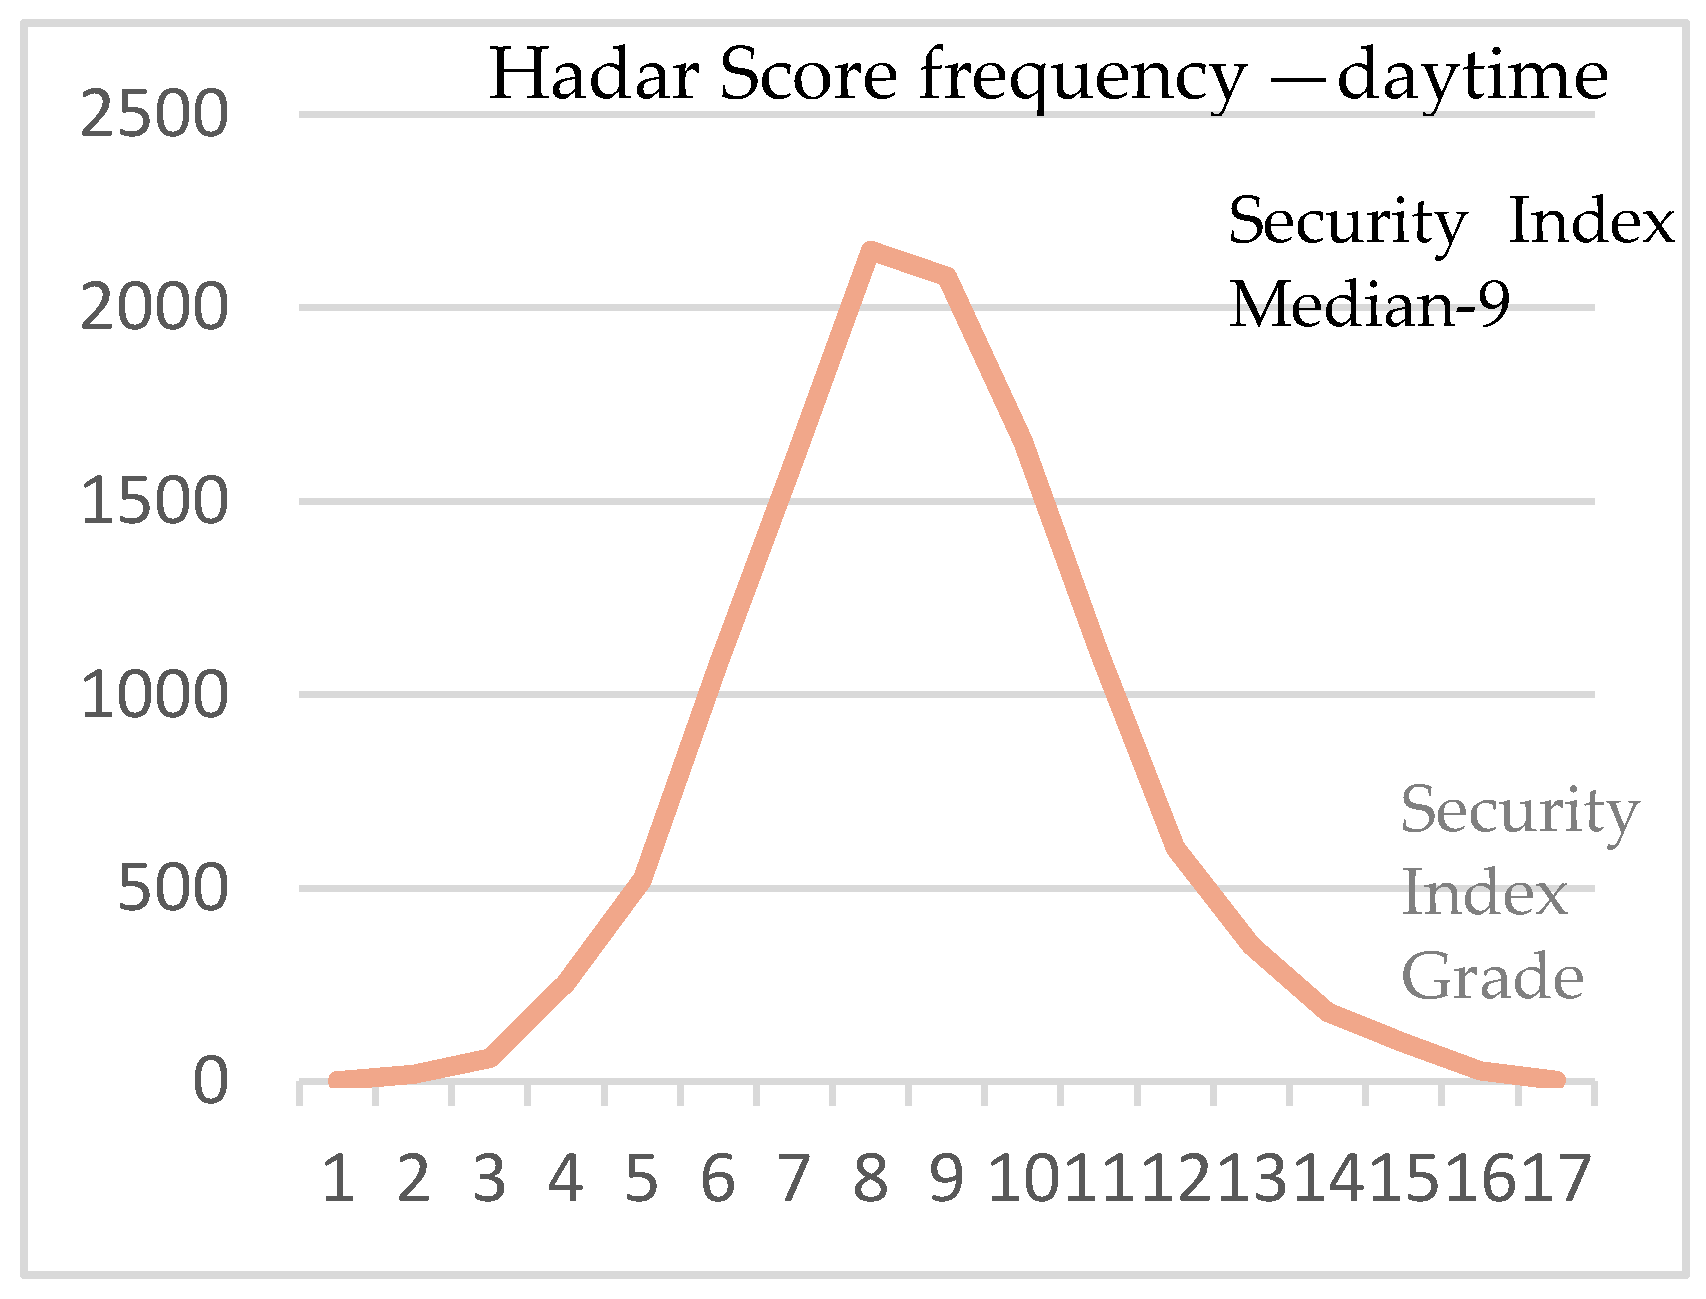
Figure 2.
Hadar neighborhood daytime security raster map.

Scheme 3.
Hadar total security index grade area in m2 for nighttime.
Scheme 4.
Hadar total security index grade frequency for nighttime.
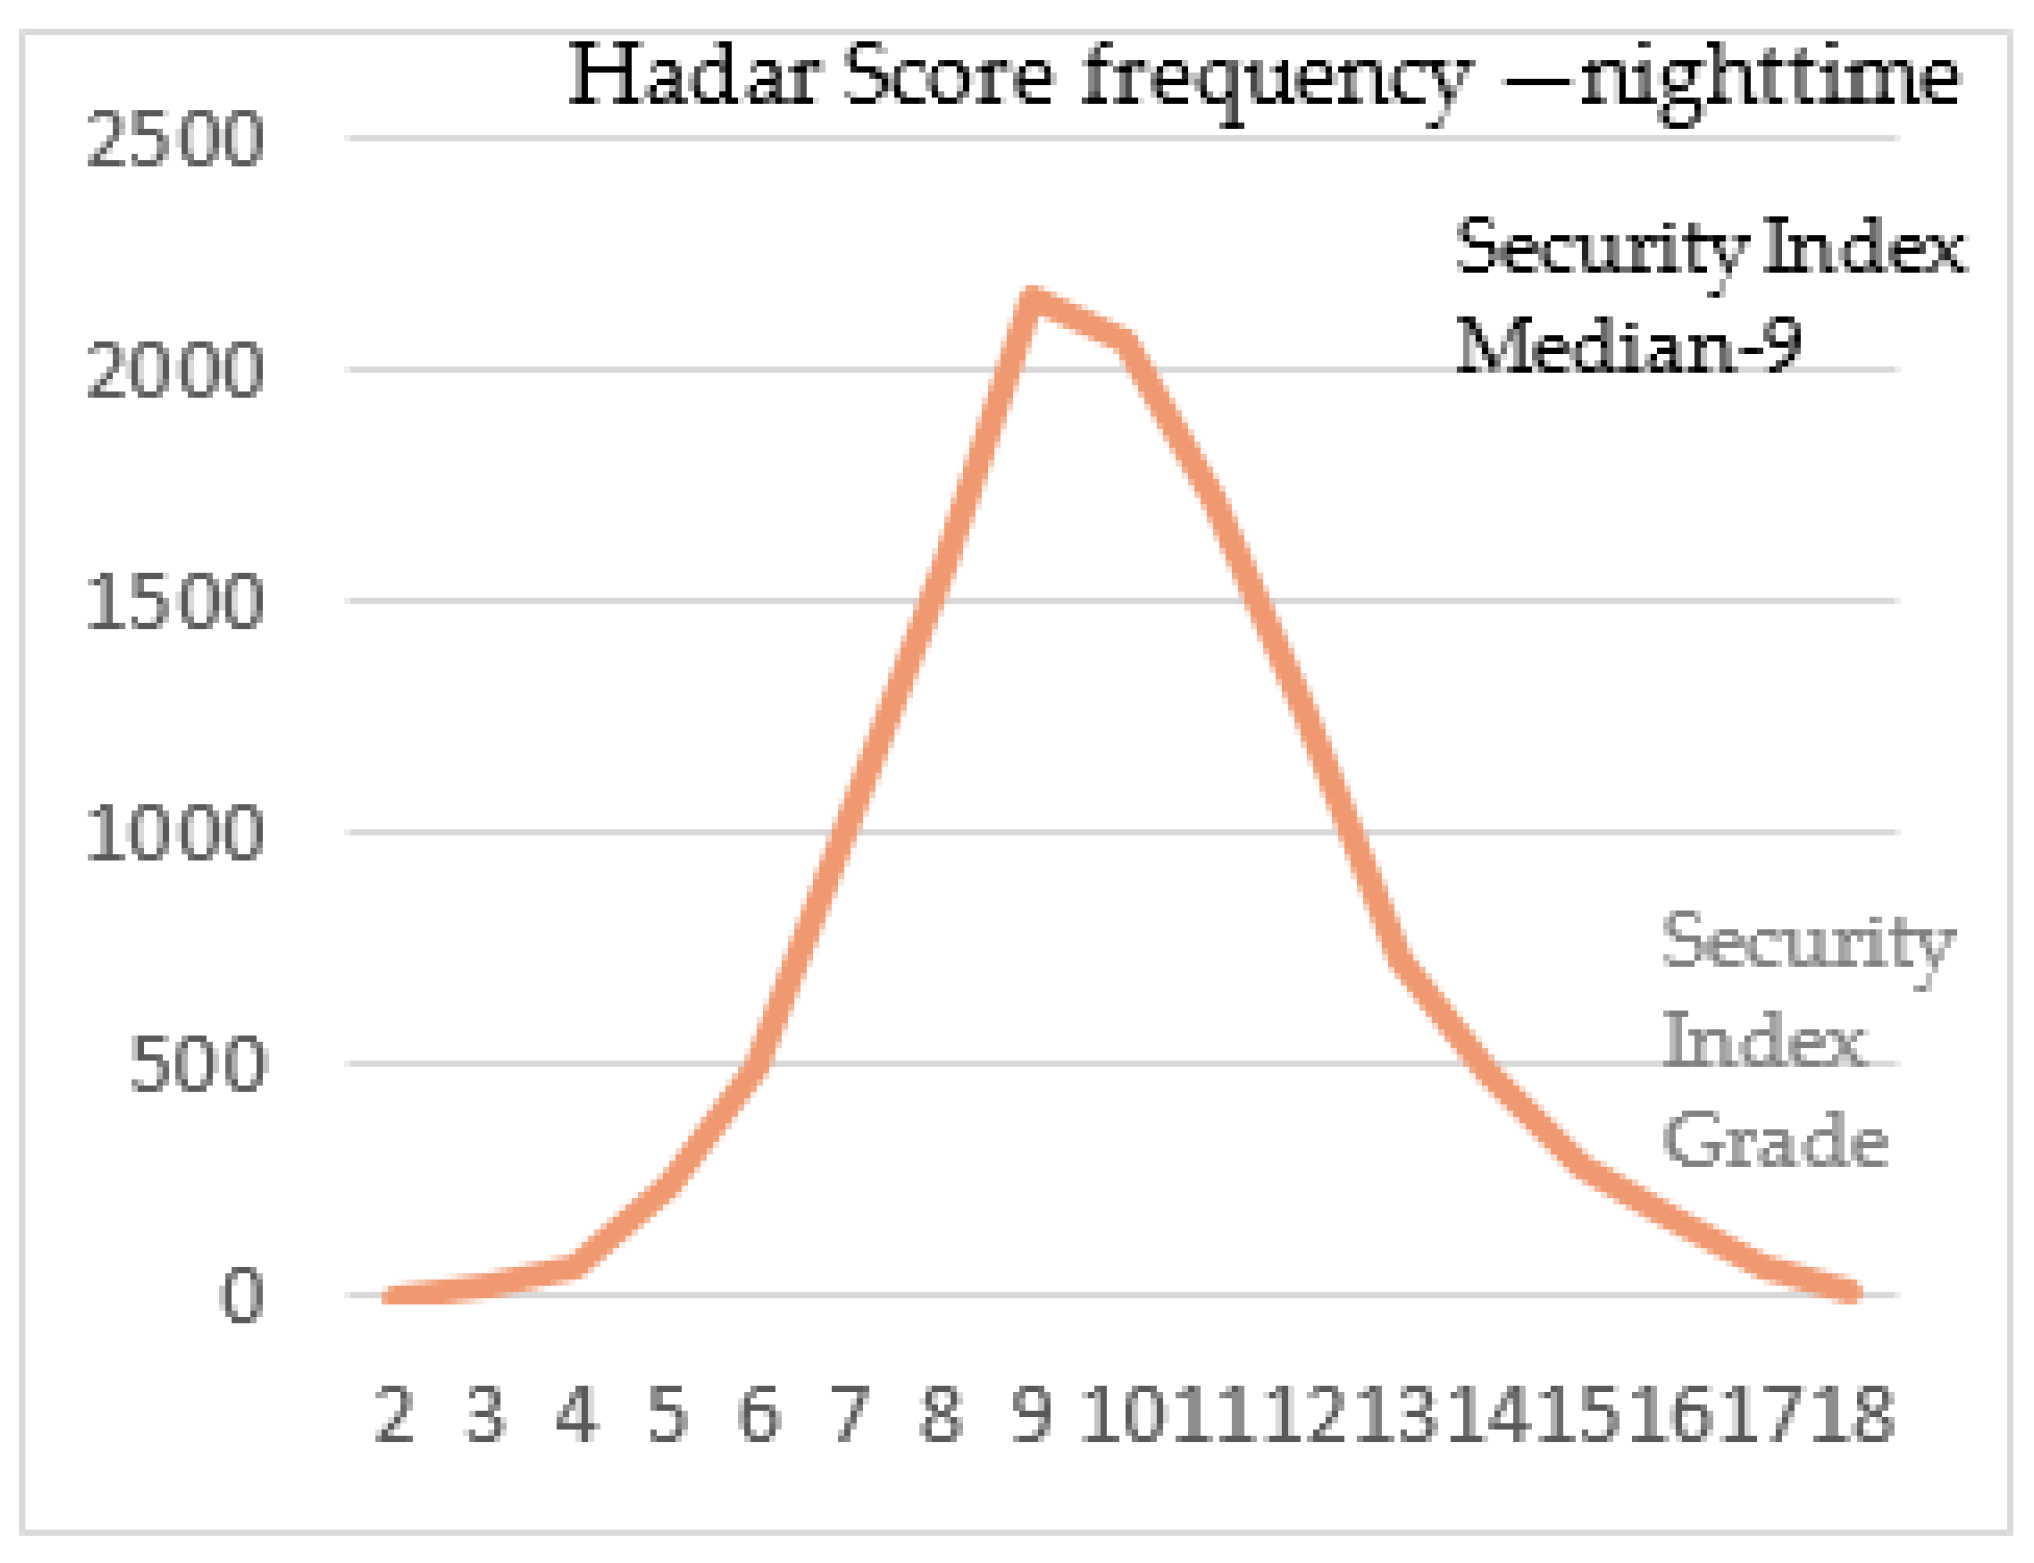
Figure 3.
Hadar neighborhood nighttime security raster map.
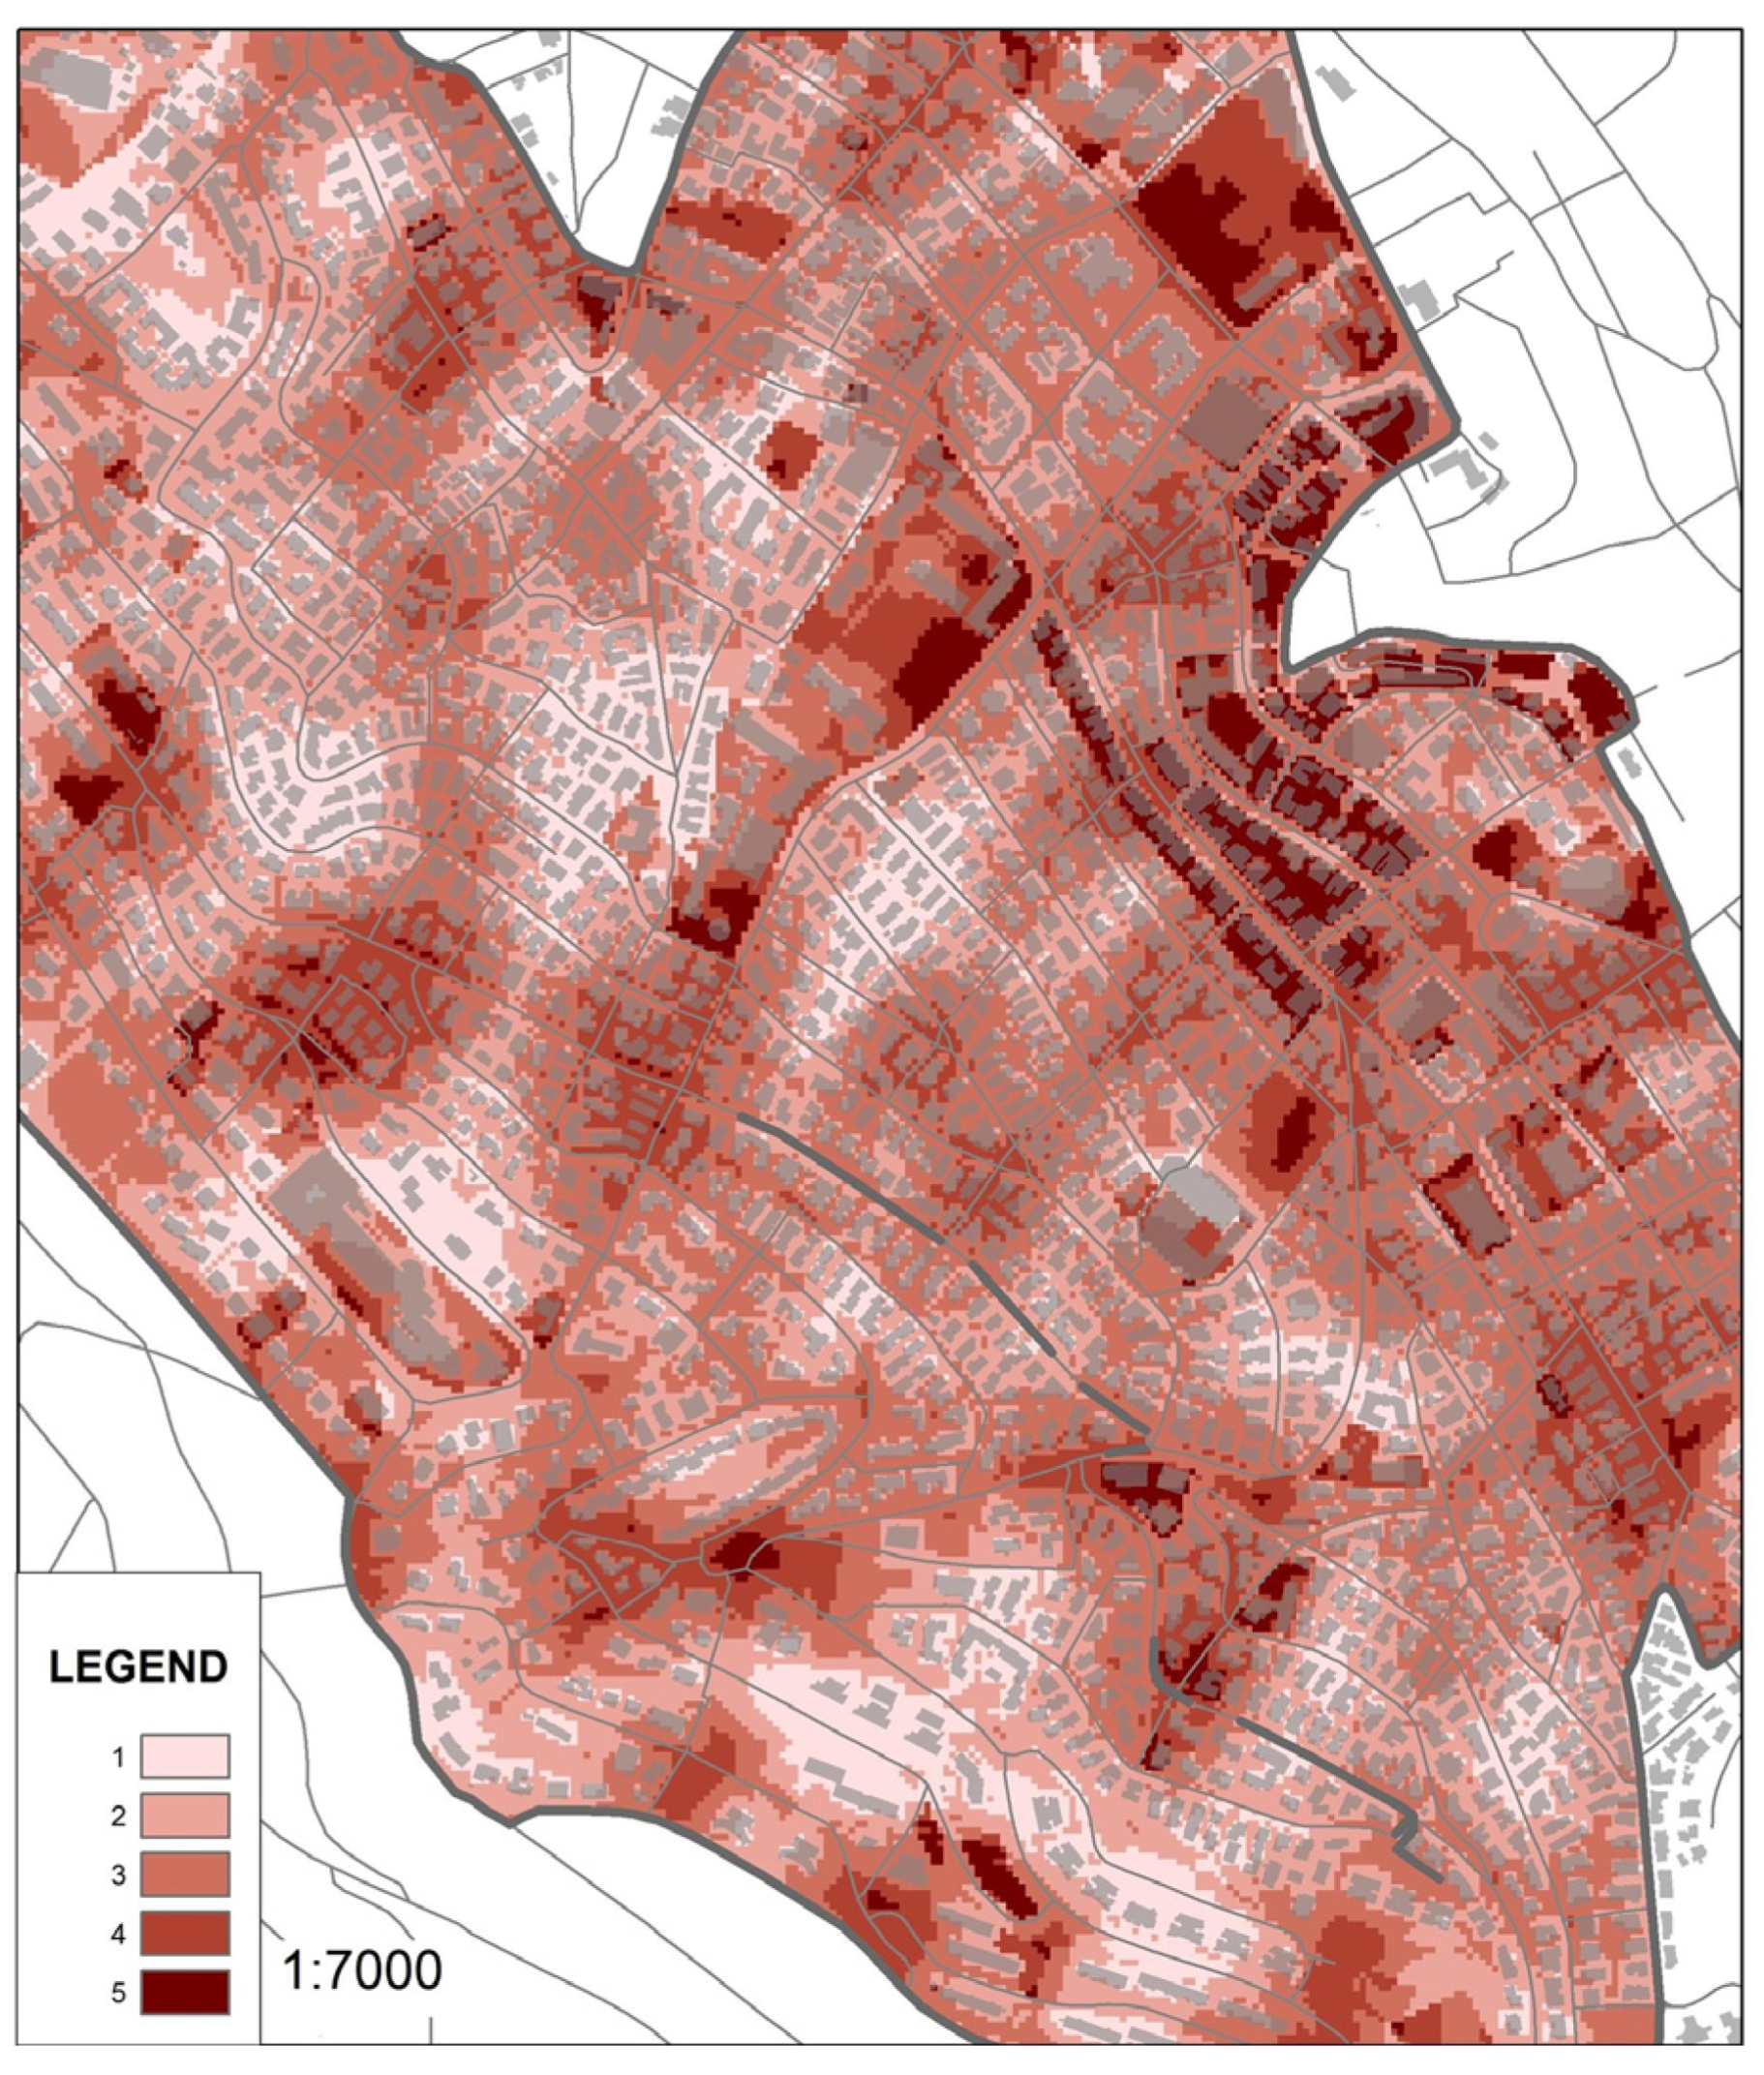
Figure 4.
Daytime (left) and nighttime (right) security in the Bahai garden.
Scheme 5.
Bahai garden area in m2 by security index—daytime.
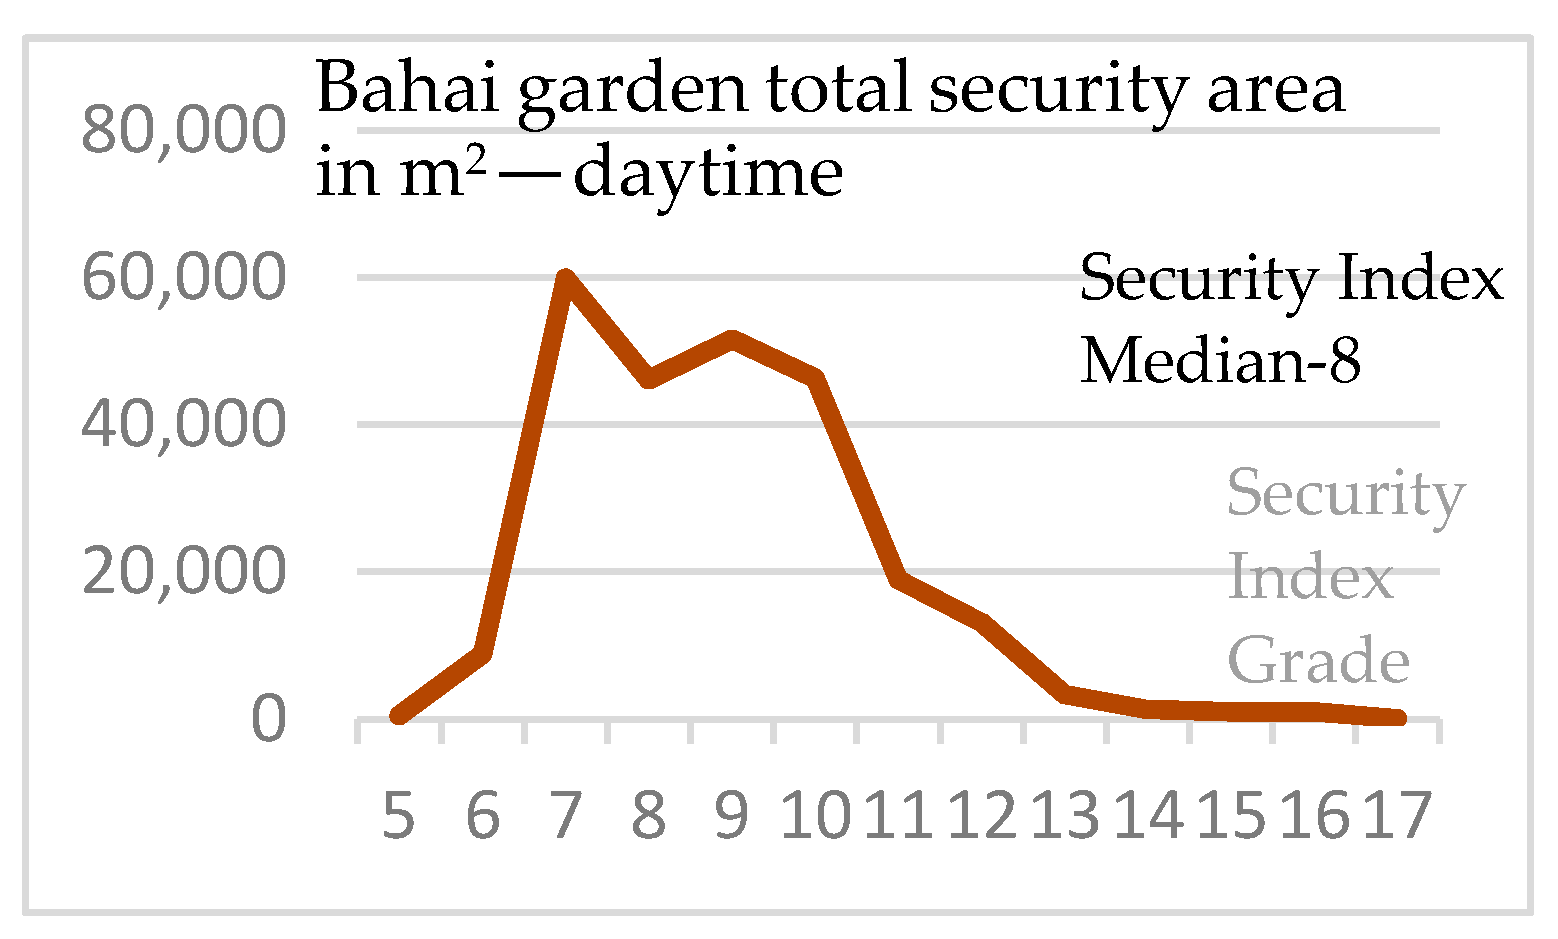
Figure 5.
Daytime (left) and nighttime (right) security in Benjamin garden.

Scheme 6.
Bahai garden score frequency—daytime.
Scheme 7.
Bahai garden area in m2 by security index—nighttime.
Scheme 8.
Bahai garden score frequency—nighttime.
Scheme 9.
Benjamin garden area in m2 by security index—daytime.
Scheme 10.
Benjamin garden score frequency—daytime.

Scheme 11.
Benjamin garden area in m2 by security index—nighttime.

Scheme 12.
Benjamin garden score frequency—nighttime.

Figure 6.
Vandalism map calls to the 106 call center (left), Hadar neighborhood nighttime security raster map (right).
Figure 6.
Vandalism map calls to the 106 call center (left), Hadar neighborhood nighttime security raster map (right).
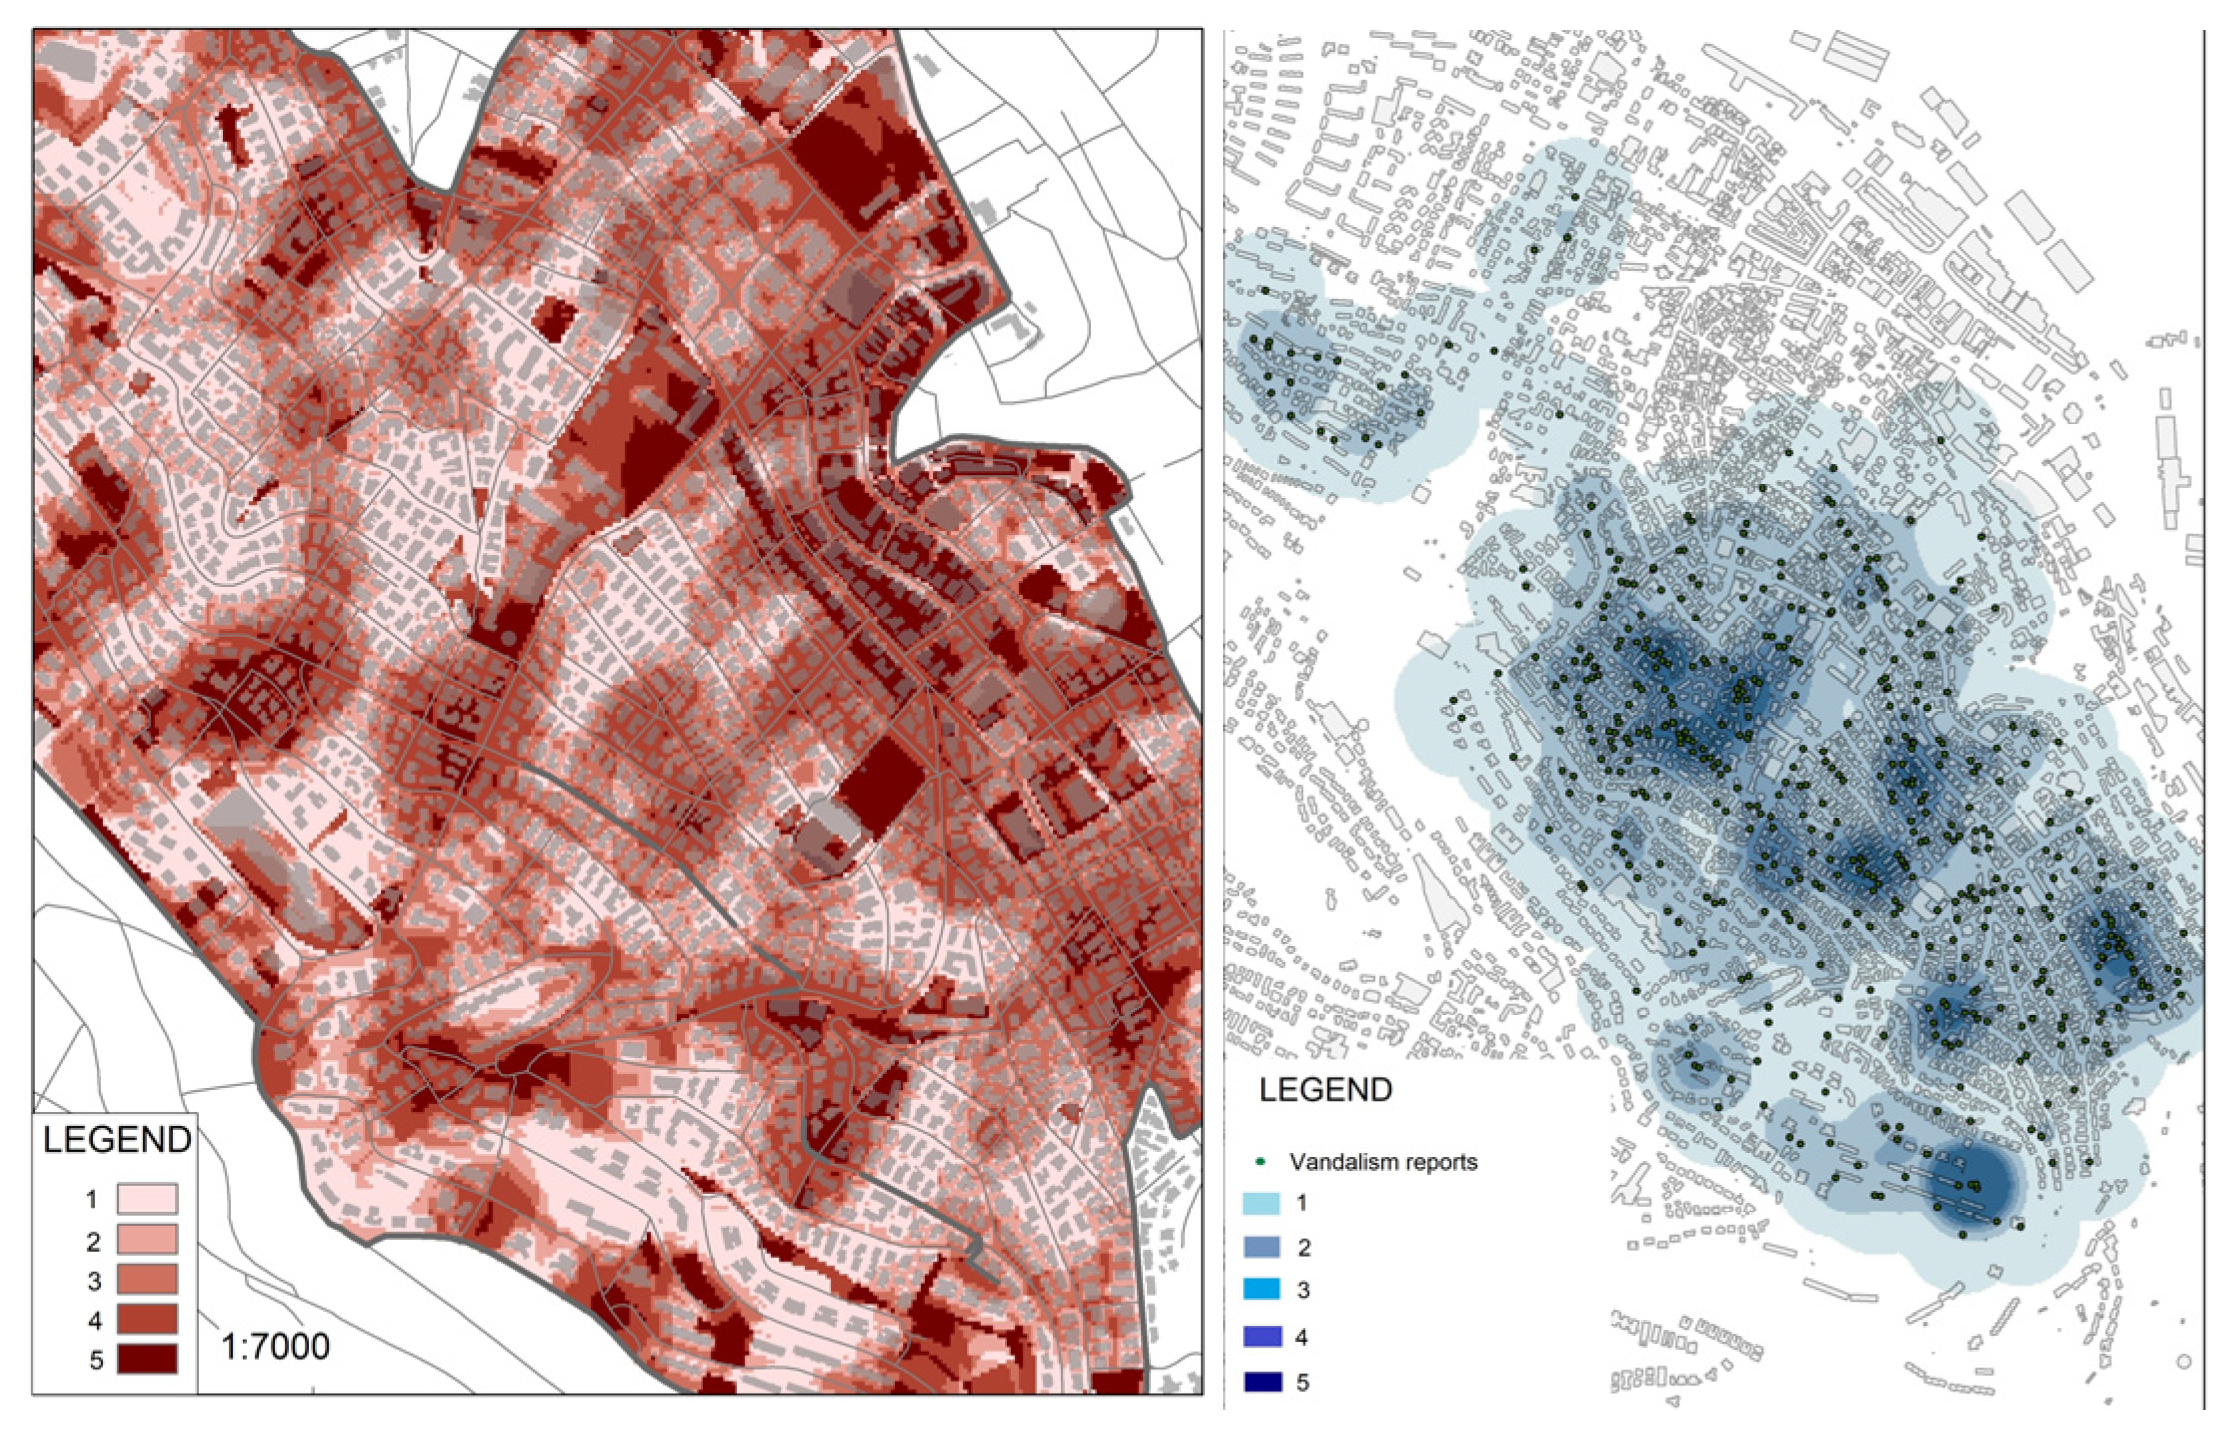
Figure 7.
Paths most used by the different social groups in Hadar neighborhood: volunteer-scouts’ community (left), Jewish-orthodox community (left-middle), students community (right-middle), residents (right).
Figure 7.
Paths most used by the different social groups in Hadar neighborhood: volunteer-scouts’ community (left), Jewish-orthodox community (left-middle), students community (right-middle), residents (right).
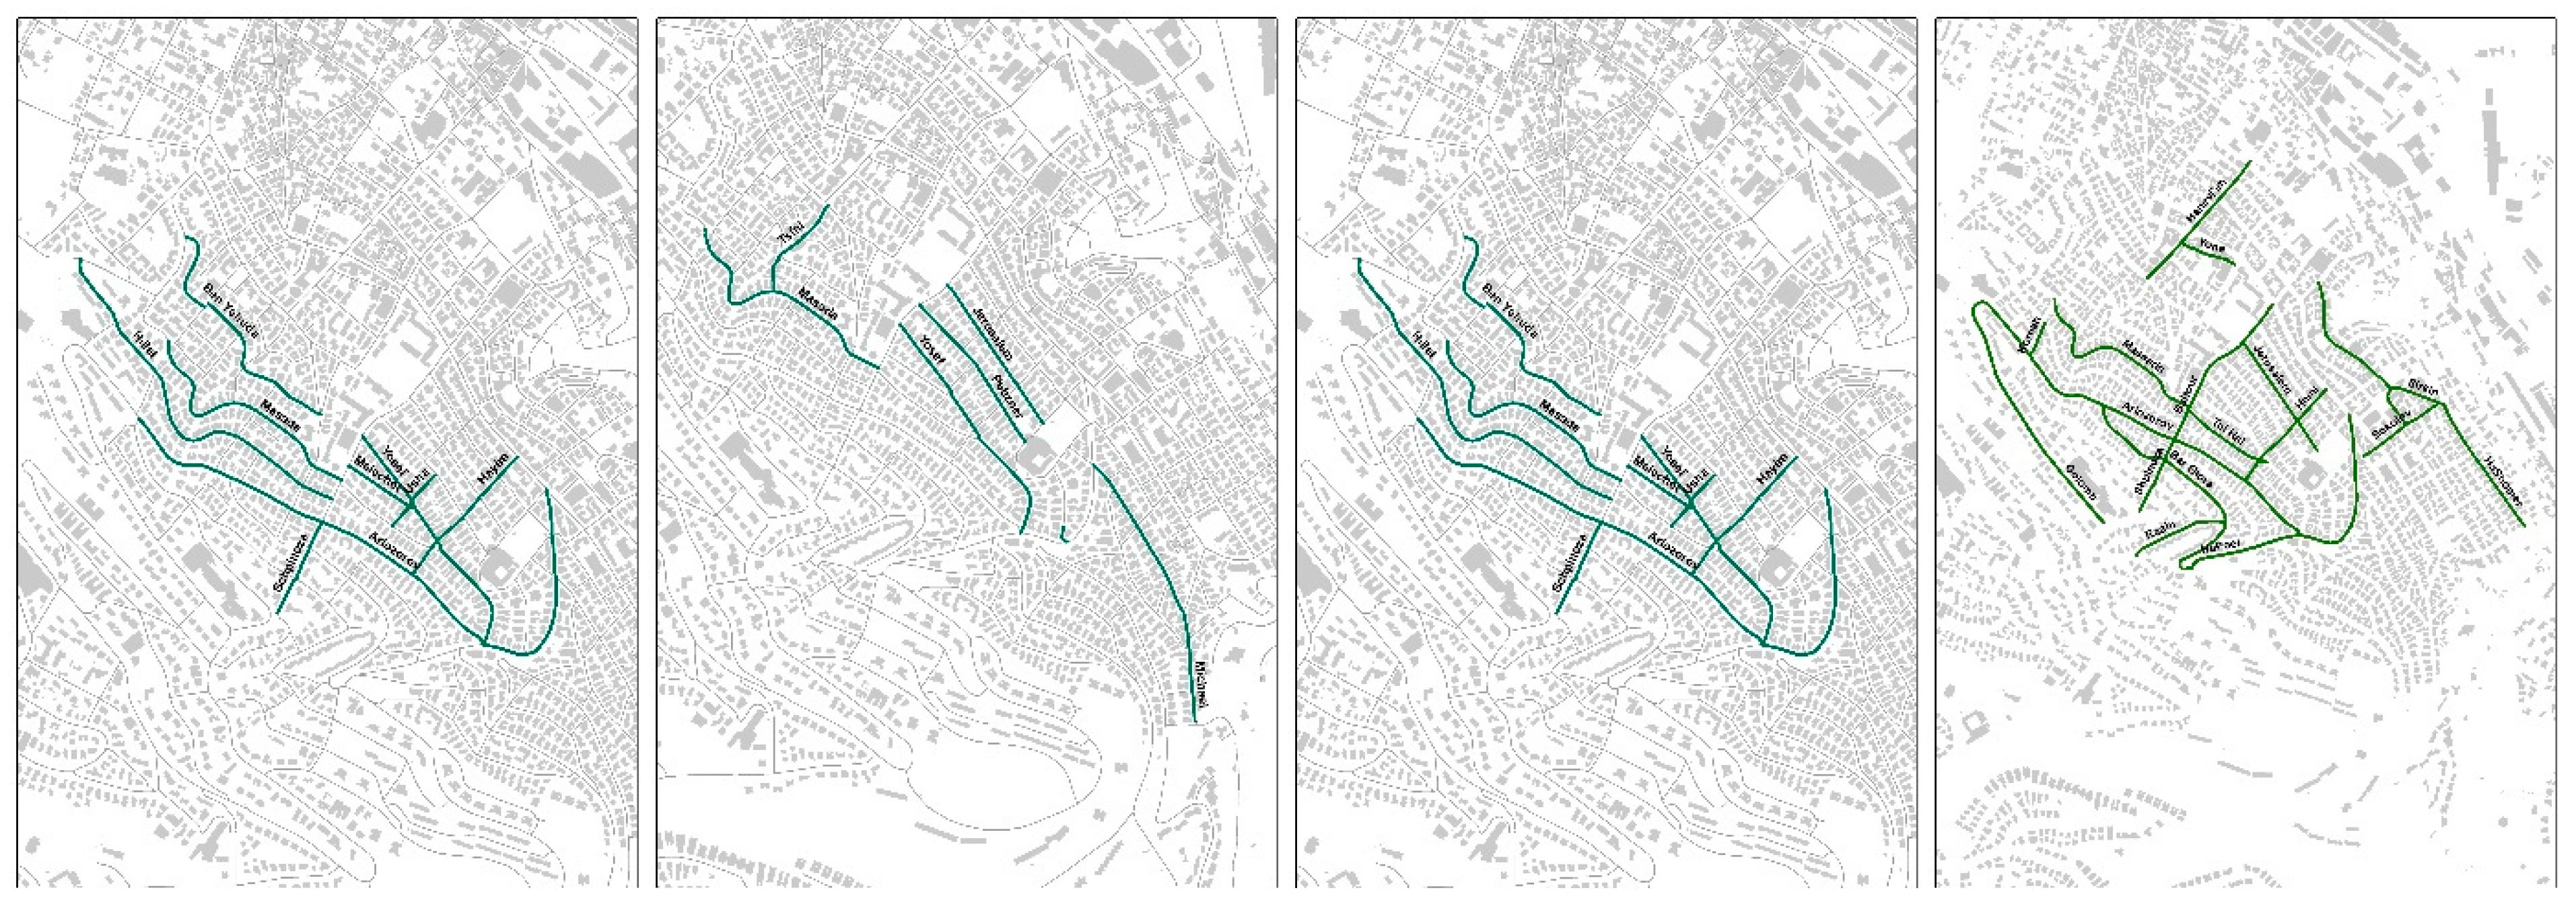
Figure 8.
Social groups’ security paths during daytime (left) and nighttime (right).

Figure 9.
Social groups’ walkability paths during daytime (left) and nighttime (right).

Figure 10.
A matrix presentation of social groups paths and security index map: daytime security (top left) and daytime walkability (top right); nighttime security (bottom left) and nighttime walkability (bottom right).
Figure 10.
A matrix presentation of social groups paths and security index map: daytime security (top left) and daytime walkability (top right); nighttime security (bottom left) and nighttime walkability (bottom right).


Table 1.
Urban security assessment index defined by urban elements in the urban environments.
| Theme | Most Secured | Least Secured | ||||||||
|---|---|---|---|---|---|---|---|---|---|---|
| Mixed Uses | Most Mixed 5 | 4 | 3 | 2 | Least Mixed 1 | |||||
| Street Lights | Many 5 | 4 | 3 | 2 | Few 1 | |||||
| Building typology proximity | 0 < X < 5 m | 5 < X < 10 m | 10 < X < 15 m | 15 < X < 20 m | 20 < X < 25 m | 25 < X < 30 m | 30 < X < 35 m | 35 < X < 40 m | 40 < X < 50 m | X > 50 m |
| Distance between junctions | 0 < X < 5 m | 5 < X < 10 m | 10 < X < 15 m | 15 < X < 20 m | 20 < X < 25 m | 25 < X < 30 m | 30 < X < 35 m | 35 < X < 40 m | 40 < X < 50 m | X > 50 m |
| Walkway paths | 0 < X < 5 m | 5 < X < 10 m | 10 < X < 15 m | 15 < X < 20 m | 20 < X < 25 m | 25 < X < 30 m | 30 < X < 35 m | 35 < X < 40 m | 40 < X < 50 m | X > 50 m |
| Number of intersections | Many streets (5) | 4 | 3 | 2 | Few streets (1) | |||||
Table 2.
Urban vulnerability assessment of social groups in the Hadar neighborhood based on the interviews.
Table 2.
Urban vulnerability assessment of social groups in the Hadar neighborhood based on the interviews.
| Theme | Secured 1 | 2 | 3 | 4 | Not Secured 5 |
|---|---|---|---|---|---|
| Daytime Security | Feeling secured | Feeling less secured | Moderate sense of security | Unsecured feeling | Absolute unsecured feeling |
| Nighttime Security | Feeling secured | Feeling less secured | Moderate sense of security | Unsecured feeling | Absolute unsecured feeling |
| Vegetation | Substantial vegetation | Moderate vegetation | Lack of vegetation | ||
| lighting | Sufficient lighting | Moderate lighting | Lack of lighting |
Publisher’s Note: MDPI stays neutral with regard to jurisdictional claims in published maps and institutional affiliations. |
© 2021 by the authors. Licensee MDPI, Basel, Switzerland. This article is an open access article distributed under the terms and conditions of the Creative Commons Attribution (CC BY) license (http://creativecommons.org/licenses/by/4.0/).
Share and Cite
MDPI and ACS Style
Shach-Pinsly, D.; Ganor, T. A New Approach for Assessing Secure and Vulnerable Areas in Central Urban Neighborhoods Based on Social-Groups’ Analysis. Sustainability 2021, 13, 1174. https://doi.org/10.3390/su13031174
AMA Style
Shach-Pinsly D, Ganor T. A New Approach for Assessing Secure and Vulnerable Areas in Central Urban Neighborhoods Based on Social-Groups’ Analysis. Sustainability. 2021; 13(3):1174. https://doi.org/10.3390/su13031174
Chicago/Turabian StyleShach-Pinsly, Dalit, and Tamar Ganor. 2021. "A New Approach for Assessing Secure and Vulnerable Areas in Central Urban Neighborhoods Based on Social-Groups’ Analysis" Sustainability 13, no. 3: 1174. https://doi.org/10.3390/su13031174
Note that from the first issue of 2016, this journal uses article numbers instead of page numbers. See further details here.