Article

Natural Assurance Schemes Canvas: A Framework to Develop Business Models for Nature-Based Solutions Aimed at Disaster Risk Reduction

1
I-CATALIST S.L, 28232 Las Rozas, Madrid, Spain
2
BGRM, Université de Montpellier, 34000 Montpellier, France
3
Field Factors, 2628 CS Delft, The Netherlands
4
INRAE, 34000 Montpellier, France
5
Caisse Centrale de Réassurance, 75008 Paris, France
6
Business Development Group, 10638 București, Romania
7
Geoecomar, 030167 București, Romania
8
Department of Business Economics, Universidad Politécnica de Cartagena, 30202 Cartagena, Spain
9
Department of Mining and Civil Engineering, Universidad Politécnica de Cartagena, 30202 Cartagena, Spain
*
Author to whom correspondence should be addressed.
Sustainability 2021, 13(3), 1291; https://doi.org/10.3390/su13031291
Submission received: 14 December 2020 / Revised: 4 January 2021 / Accepted: 22 January 2021 / Published: 26 January 2021

Abstract

:
Nature-based solutions (NBS) are increasingly being promoted because they can solve different pursued aims together with providing an additional array of multiple ecosystem services or co-benefits. Nevertheless, their implementation is still being curbed by several barriers, for example, a lack of examples, a lack of finance, and a lack of business cases. Therefore, there is an urgent need to facilitate the construction of business models and business cases that identify the elements required to capture value. These are necessary to catalyze investments for the implementation of NBS. This article presents a tool called a Natural Assurance Schemes (NAS) canvas and explains how it can be applied to identify business models for NBS strategies providing climate adaptation services, showing an eye-shot summary of critical information to attract funding. The framework is applied in three case studies covering different contexts, scales, and climate-related risks (floods and droughts). Finally, a reflective analysis is done, comparing the tool with other similar approaches while highlighting the differential characteristics that define the usefulness, replicability, and flexibility of the tool for the target users, namely policymakers, developers, scientists, or entrepreneurs aiming to promote and implement NAS and NBS projects.

1. Introduction

Extreme weather events and water challenges have ranked within the top three greatest risks to the global economy consistently over the last five years, according to the World Economic Forum annual assessments [1]. Around 70–90% of the predicted economic losses caused by flooding in Europe, from now until 2050, can be attributed to the increase in the value of assets in floodplain areas, with the rest attributed to climate change [2]. Yet, those vulnerable to these extreme climatic events, like businesses, farmers, and institutions, do not have the knowledge or capacities to tackle these risks. Conventional infrastructural measures are expensive. For example, the estimated investment needed in water infrastructure over the next 15 years is around 22 trillion dollars, which is more than half of the total expected infrastructure investment demand (41 trillion USD) [3]. There is a new emerging approach that looks to expand the portfolio of solutions by looking at, for example, nonstructural measures or nature-based solutions (NBS). Examples of nonstructural measures include management and regulation measures, such as water rights management, water allocation management, revision of dam regulation regimes, and so forth. Meanwhile, nature-based solutions for risk reduction span interventions to enhance the intrinsic capacity of nature to mitigate extreme events, such as river and flood plain restoration initiatives, dike removal, permeable surfaces, and the reforestation of upstream highlands, among many others. These are gaining strength as alternatives or complements to conventional grey solutions to help build resilience and response capacity to water-related hazards. However, NBS are still at an early stage in terms of implementation and face a number of specific barriers for both scaling up and making their implementation mainstream. One of the main barriers is the difficulty to access funding and finance that help either reduce or share the investment efforts from across a number of stakeholders, including public entities, which often hold the main water risk management responsibility. Thus, developing a clear and strong business case that can attract private and impact investors into, for example, blended finance projects, can help increase the uptake of NBS for risk mitigation based on, for example, avoided losses. The current lack of a clear business case is partly due to the limited data and evidence on the full range of environmental, economic, and social benefits provided by NBS. Thus, the full value (and possible revenue streams) these solutions offer is underestimated, as well as how this value can be captured and turned into a business that provides risk reduction and climate adaptation services to a range of beneficiaries, which constitute a potential pool of beneficiaries, clients, and funders/financiers capable of mobilizing the required economic resources.
In this context, there is a recognized need for user-friendly tools and instruments that support the identification and description of business models as a basis to further develop a strong business case for nature-based solutions [4,5,6]. A number of recent works, mainly emerging from the cluster of NBS-related projects funded by the H2020 program of the European Union, have proposed a range of frameworks, tools, and catalogs to describe business models for NBS [4,7,8]. However, most of these frameworks and projects are focused on urban and relatively small-scale interventions. As a result, these tools overlook some scale and institutional-related trade-offs and potential synergies, and thus fall short when applied to larger NBS schemes, such as those aimed at disaster risk reduction (DRR) and climate change adaptation (CCA) at territorial scales, such as catchments or aquifers. Furthermore, one of the primary (although not necessarily the highest) values of NBS interventions aimed at DRR and CCA is the potential to reduce the scale of natural hazards, vulnerability, risks, and damages, and thus, this value needs to be very well-defined and assessed to build a robust business case to make the implementation of these NBS projects bankable. However, the inclusion and accounting of additional benefits, or co-benefits, may be equally or even more critical to making the case for certain investors looking for minimum rates of return [9], or to developing blended finance bankable projects that combine public and private finance. Therefore, any tool that identifies viable business models for NBS interventions aimed at DRR and CCA should be able to characterize all the values generated, distinguishing between the risk reduction value and the additional values to deliver a range of impacts, as well as the set of elements, agents, and economic returns that make it viable.
Under the framework of the H2020 NAIAD (NAture Insurance value: Assessment and Demonstration) project, a tool called the Natural Assurance Schemes (NAS) canvas has been developed to characterize the process of value capture from the supply side (service providers through the implementation of the NBS) to the demand side (service beneficiaries), and to identify potential business models for NBS as NAS strategies aimed at DRR and CCA, the so-called Natural Assurance Schemes. Natural Assurance Schemes (NAS) are defined as NBS-based strategies to internalize the insurance value of ecosystems [10]. This concept has been developed and applied as a conceptual framework to raise awareness, valuation, and service-focused planning [10]. Meanwhile, the assurance and the insurance values are defined as reflecting an ecosystem’s capacity to remain in a given regime and retain its capacity to deliver vital ecosystem services in the face of disturbance and change [11], including the insurability of green assets. The NAS canvas tool aims to structure and guide the identification of the elements required to generate business models around NAS that can catalyze the economic resources required for their implementation, as well as to drive possible service or economic transactions around the provision of (ecosystem or nature-based) eco-DRR and climate adaptation services.
This paper presents the NAS canvas tool and methodological framework and applies it to three NAS strategies at different scales in three European sites that served as demonstration cases in the H2020 NAIAD project. These are the implementation of an Urban Water Buffer in the Spangen district in the city of Rotterdam (The Netherlands) at the urban scale, a combined NBS strategy, including multiple green infrastructure interventions at the sub-catchment scale in the Lez basin (France), and a hybrid NBS-soft strategy including non-structural (institutional) NBS and water management response measures at the large scale in the Medina del Campo aquifer (Spain). Insights from the applications of the tool to these cases are discussed and put into context when compared to other emerging business model canvas tools.

2. Materials and Methods

2.1. The NAS Canvas: A Framework and Tool to Identify and Describe NAS Business Models

The Natural Assurance Schemes canvas (NAS canvas) is aimed at identifying and describing business models for NAS by sequentially describing three aspects: (i) the process and elements involved in the provision of climate adaptation and risk reduction services by an NBS or a set of measures (NBS and soft, non-structural/hybrid/grey measures), or NAS strategies, from both the supply and the demand sides; (ii) the actors involved and their potential roles; and (iii) how the value of these services can be translated into economic revenue streams, funding, and the financial resources required for the execution and maintenance of these NBS measures and strategies. Hence, the NAS canvas can be used for the identification of potential business models and the required elements for NBS implementation, and also serves as a comprehensive methodological framework to describe the features of an NBS implementation project. It also helps to diagnose the type of information required and available or not available to document the results in a structured and clear way that is useful for engaging and convincing investors and promotors, and for potentially attracting interest in this type of project initiative.
The NAS canvas is an adaptation of the traditional business model canvas developed by Osterwalder, Pigneur, & Clark, 2010 (https://strategyzer.com/canvas) [12], tailored to the specificities of nature-based solutions and their contextual framework. A business model is defined as a description of the rationale of how an organization creates, delivers, and captures value in economic, social, cultural, or other contexts (adapted from [12]). It defines the way by which an organization offers value to customers, entices customers to pay for value, and converts those payments into benefits. The business model canvas is traditionally used to support companies and businesses in identifying and structuring their value proposition and the elements required to develop a strong and feasible business model for the delivery of a product or service to the market. In the context of NBS, the nature of services provided are usually related to public services from public goods, such as water, ecosystems, or hybrid services involving public and private goods, (e.g., green walls in buildings). Therefore, the business model concept was taken out of the classic private goods market concept and broadened to consider how an organization—be it public, private (e.g., an enterprise), an NGO, a community of citizens, or a mixture of these actors acting collectively—could deliver value to end users. Nevertheless, the term “business model” was deliberately maintained and applied to the case of NBS projects in order to highlight and give attention to the parallelism with the private goods system, albeit with certain particularities, such as the inclusion of environmental and social values (the so-called additional benefits or co-benefits) [9,13].
The NAS canvas was thus built on this traditional business canvas model, which was expanded and tailored to account for the specificities of climate adaptation and the services and risk reduction offered by nature-based solutions. To do so, a review of existing canvases and approaches developed and applied to nature-based solutions and ecosystem services was carried out to identify the state-of-the-art advances in this field. After careful analysis, the so-called “PPP canvas”( https://ppplab.org/2017/11/pppcanvas/) for ecosystem services developed by the Inclusive Business Hub [14] was considered the most applicable and aligned with our purpose, and it inspired the introduction of three new elements into the traditional canvas: direct beneficiaries, indirect beneficiaries, and impacts of the NAS strategies. Finally, the canvas was also expanded to incorporate the essence and elements of NAIAD’s economic framework [13]. This process resulted in our NAS canvas, which captures the extended array of co-values, actors, and contextual settings inherent to NBS aimed at DRR and CCA that will ultimately determine and condition the structure and feasibility of an NAS business model.

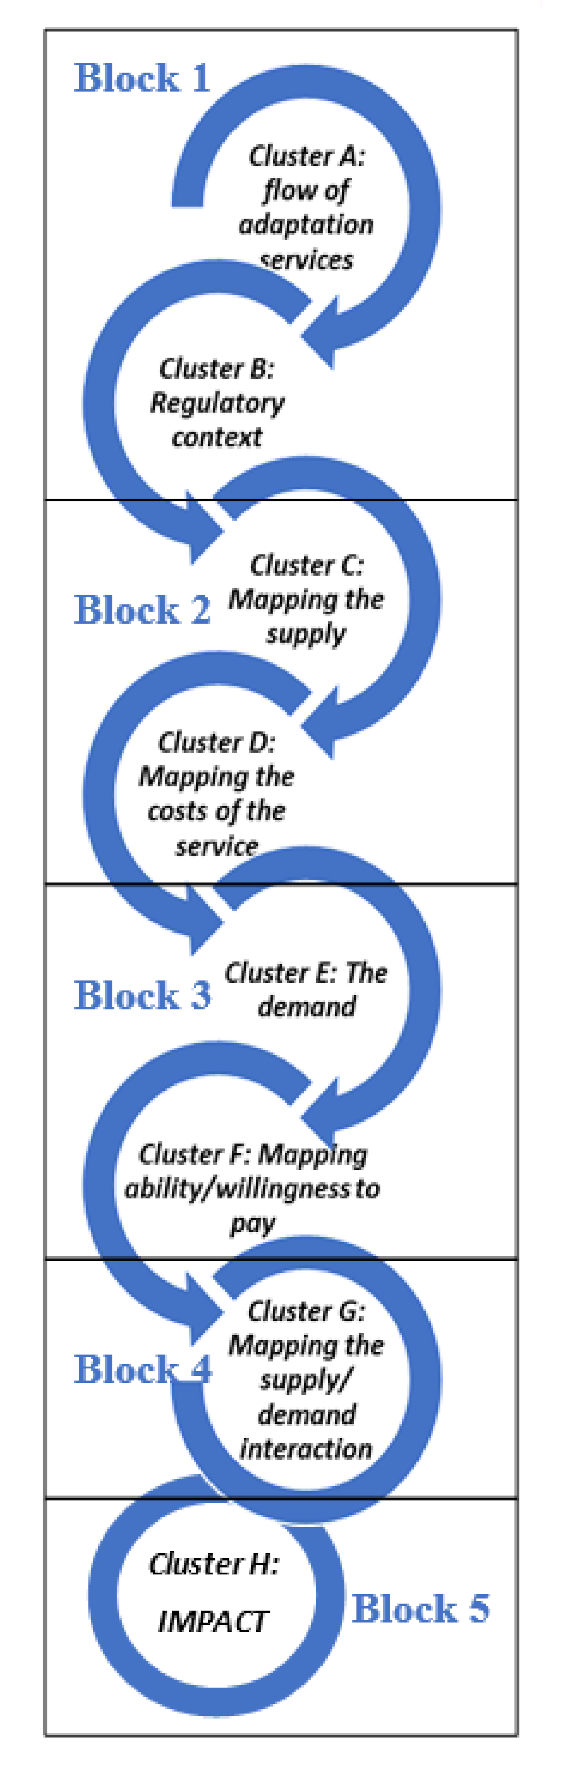
2.2. The NAS Canvas Methodological Framework: A Sequential Flow Process to Facilitate the NAS Canvas Understanding and Application

The canvas is a quick visual way to compile key information in a simple eye-shot format. However, it can sometimes become difficult to read and follow and falls short of space when more detailed descriptions with substantial information need to be reported. Therefore, a sequential NAS canvas methodological framework is presented, consisting of a flow of steps that can be reported in a table format for detailed descriptions. The steps are structured in a linear sequence of blocks that cluster the different components describing how the value provided by the NAS flows from the supply to the demand side, and the different elements required for this process. This set of steps also provides a structure and logic that underpins the canvas display (what we call the NAS canvas tool), presented in Section 2.3, which also facilitates the reading and understanding of the more visual and traditional canvas format.
The flow diagram in Figure 1 shows the sequence and clustering of the different NAS canvas components and the sequential process of steps composing the NAS canvas methodological framework. The descriptions and definitions of the different clusters and components are described here below.
The steps and clusters are grouped in five blocks, following the flow process of natural assurance services in a potential market: (1) the problem, service, and value; (2) the supply side; (3) the demand side; (4) supply–demand interactions; and (5) the final impact.
BLOCK 1: PROBLEM, SERVICE, AND VALUE
CLUSTER A: Flow of Adaptation Services
This cluster defines the main problem to be addressed and the value proposition provided by the particular NAS to address the challenge identified.
STEP 1: The problem to be addressed. Identify the main problem to be addressed by the NAS project initiative.
STEP 2: Service provided and value proposition. In the traditional canvas, the Value Proposition is the reason why customers choose one company over another. It solves a customer problem or satisfies a customer need. The main service and value of an NAS strategy is the capacity to solve the problem (risk reduction function: reduce hazards, vulnerability, risks, or damages). An NAS strategy also provides additional or secondary services or co-benefits (secondary values) that are not provided by other grey alternatives. Therefore, the value proposition is composed of the following: (A) the primary service and value generated by the main function (risk reduction); and (B) the secondary service and value generated (co-benefits and their associated values). The total value is estimated as the sum of primary and secondary services (Steps 2A and 2B of the NAS canvas), and it will reflect the comparative advantage with other alternatives.
Step 2A. Primary service and value. In the presented NAS canvas framework, the main service and value is the reduction of impacts from extreme water-related climate events expressed as economic losses (risk function—avoided costs or damage costs) through risk reduction, mitigation, and prevention. The approach to estimating the avoided costs or damage costs can be found in [9].
Step 2B. Secondary service and value. Secondary services are all the additional services or co-benefits generated by the strategy that are not obtained with grey infrastructure and entail a competitive advantage. The values generated by these co-benefits are difficult to express and make explicit. Le Coent et al. (2019) [9] proposed several co-benefit valuation methods to undertake this co-benefit valuation. These span quantitative approaches for monetary valuation, such as contingent use values, travel costs, and so forth, and qualitative valuation through qualitative indicators or ranked preferences that gather public or stakeholder perceptions.
CLUSTER B: Regulatory Context
STEP 3: Regulation. Frame the regulation or articulate the target problem objectives and the specific areas to be covered by the solution, for example, land use management, water management, soil and agricultural regulations, and so forth, or the lack of regulation.
BLOCK 2. SUPPLY SIDE
CLUSTER C: Mapping the Supply
STEP 4: Who implements. Identify the main agent(s) responsible for implementing the strategy. For NAS strategies involving multiple measures, these can be specified by measure.
STEP 5: Key activities. List the activities required for the implementation of the measures that constitute the NAS strategy (NBS/hybrid/grey/soft non-structural). This includes the set of measures applied and a breakdown of specific activities within each measure.
STEP 6. Key resources. List the non-monetary resources needed to implement the strategy (existing and non-existing at present) for example, knowledge, people, capacity, and political support.
STEP 7. Key partners. List the partners required to implement the solutions and provide the service, for example, technology centers, regional public administrations, developers, operators, or funding partners.
CLUSTER D: Mapping the Costs of The Service
STEP 8. Cost structure. Identify the different types of costs associated with the implementation of the strategy.
8A. Lifecycle costs: Include capital costs and operation and maintenance costs.
8B. Opportunity costs: Include the benefit, profit, or value that would have been generated by implementing other alternatives.
BLOCK 3. DEMAND SIDE
CLUSTER E: Mapping the Demand
STEP 9: Who owns the problem. Identify who is directly affected by the problem or suffers the problem that the NAS is addressing (flood or drought damages, water shortages, etc.).
STEP 10: Customer segments. The demand side of the service provision can be segmented into different groups based on needs, behaviors, and other traits that these groups share. A customer segment for NAS may be defined through spending behaviors (customers, clients), interests, and motivations.
10A. Direct beneficiaries of primary value: Identify the agents that benefit from the solution through damage costs/avoided damages.
10B. Clients: Identify the ones who are paying for the service. They may or may not own the problem and be solely responsible for it.
10C. Indirect beneficiaries: Identify the extended beneficiaries of real and potential benefits and co-benefits who are currently not paying for the service but may be potentially interested in paying for the co-benefits generated when they are made fully aware of their value.
CLUSTER F: Mapping the Ability/Willingness to Pay
STEP 11: Revenue streams. This component relates to the cash an organization generates from each customer segment. In the NAS canvas framework, it identifies the possible income streams generated as a result of the service provision/value generated (including both private streams and public goods) for which each customer segment is willing to pay, and which ones can provide an economic return.
STEP 12: Funding. Funding is the money required to implement the measures. It can be obtained from a single source upfront, or from the customer segments. Some of the revenue streams identified in the previous step may need to be devoted to cover the lifecycle costs of the measure through the economic instruments explained below. Funding sources can include a mixture of the following instruments:
12A. Tariffs: Charges paid by the users of the product or service as a “price” (e.g., water tariff)
12B. Taxes: Charges paid by the users of the product or service as a fixed percentage of the value (i.e., Value Added Tax (VAT)) or local taxes raised by municipalities for sectoral policies that may be used to fund NAS.
12C. Transfers: Money provided by external actors, such as official development assistance, philanthropic donations, grants, or governmental/institutional funds.
12D. Private funds or investment: Money invested by the private sector, finance, or private investors.
BLOCK 4. SUPPLY–DEMAND INTERACTIONS
CLUSTER G. Mapping the Supply–Demand Interactions
STEP 13: Customer relationship. Identify the type of relationship between the customer and the service provider or implementor. The possible types of relationships are personal assistance (human interaction), dedicated personal assistance (dedicating a customer representative to an individual client), self-service (no direct relationship with the customer), transactional (through a transaction that can be economic, contractual, etc.), automated (self-service with automated processes), communities (creation of a community of users that communicates through a representative), or co-creation (both customer and implementer/service provider generate value). In terms of the duration of the relationship, it can be transactional, long-term, or purpose-based.
STEP 14: Channels. In the traditional canvas, the communication, distribution, and sales channels comprise a company’s interface with its customers. Channels are customer touch points that play an important role in the customer experience. In the NAS canvas, channels are the vehicles by which the implementing and beneficiary stakeholders communicate, such as periodical meetings, public participation initiatives, email, social media, formal letters, and so forth.
BLOCK 5. IMPACT
CLUSTER H: Impact
STEP 15: Impact Key Performance Indicators (KPIs).Identify a list of tangible and measurable impacts achieved through the implementation of the NBS measure or NBS strategies, described by Key Performance Indicators (KPIs), that should be used to track the performance and efficiency of the strategy.
The five blocks presented above gather all the elements required to describe a business model and were the ones included in the NAS canvas tool. Nevertheless, aside from the canvas, presented here is an additional block that describes some subsequent elements necessary to prepare the business case and the groundwork for the implementation of the NAS. Within the NAIAD framework, these elements are not considered to be part of the business model but rather part of a later phase of the business case development and design of the implementation arrangement [15]. However, these are very important when considering/assessing the viability of an NAS or NBS project. Hence, these will be mentioned and described here as additional steps beyond the business model on the way towards defining viably implementable NAS or NBS projects that create an appetite for potential funders and investors.
BLOCK 6. FURTHER STEPS TOWARDS DEFINING THE BUSINESS CASE
STEP 16: Financing mechanism. Identify the type of financing formula that could be used to obtain the funds or capital investment required upfront, to be paid back over time. Examples include credits, loans, and grants.
STEP 17: Governance model. These are collective action arrangements designed to achieve the implementation of NBS [16] as well as their management and maintenance over time. Egusquiza (2018) [16] identifies five types of governance models: Traditional Public Administration, New Public Management, Private–Private People Partnership, Societal Resilience, and Network Governance. An additional one is proposed here: Public–Private Partnership, which describes a hybrid model of shared public and private responsibility. This last model is increasingly being identified as critical to mainstreaming NBS, given the need to reduce the burden for public administrations, while engaging private actors who hold stakes as co-beneficiaries, and potentially even community groups through, for example, crowdsourcing, and so forth.
STEP 18: Success conditions. Identify the determinant factors that would enable successful implementation, including from the experiences of similar examples.
STEP 19: Barriers to implementation. Identify the elements or factors that could constrain the feasibility or success in the implementation of the NAS strategy.

2.3. The NAS Canvas Tool: A Visual Representation of NAS’ Service Delivery and Value Capture Logic

The NAS canvas tool developed for NAIAD is presented in Figure 2, where the color code of the different elements indicates the source where it originates, namely the traditional business canvas, the “PPP canvas”, or the NAIAD’s economic cost-benefit analysis framework [13]. Meanwhile, the brown boxes indicate the five blocks underpinning the NAS canvas structure: (1) problem, service and value; (2) supply side; (3) demand side; (4) supply-demand interactions; and (5) final impact.

2.4. Application of the NAS Canvas to Demonstration Cases and Validation/Co-Development with Stakeholders

The NAS canvas tool was applied to three NAS strategies at different scales in three European sites that served as demonstration cases. Table 1 summarizes the main characteristics of the three study cases. Data for the different canvas components were obtained from assessments, interviews, and participatory workshops with stakeholders carried out in the three demo sites. Hence, the canvases were co-developed with the inputs of stakeholders, including a preliminary phase of data collection and pre-filling by the project team, and a secondary phase of discussion, revision, and validation with the stakeholders via either a participatory stakeholder workshop (Medina del Campo aquifer) or individual stakeholder consultations (Lez basin and Rotterdam). The economic estimation of primary values (avoided damage costs or insurance values), secondary values (value of co-benefits), and costs were obtained from Le Coent et al. (2019) [9]. The economic framework described by Graveline et al. (2017) [13] was applied to the demos to carry out a complete cost–benefit analysis, including co-benefit valuation. It should be noted that in the cited work, there is large variability in the valuation of co-benefits, which skews the interpretation of the results and hinders any comparisons among the demos. Therefore, the type of co-valuation method applied is specified in Table 1, and an explanatory note on how to interpret the results is provided as an explanatory footnote below the table. Thus, any discussion based on the comparisons of the specific values has been avoided since it would not be valid. More details on the specific methods and correct interpretation of the full economic results can be found in Le Coent et al. (2019) [9].

3. Results

Figure 3, Figure 4 and Figure 5 below present the NAS canvas tool describing the business models for the three case study NAS strategies, that is, the large-scale NAS strategy in Medina del Campo Aquifer; the medium-scale NAS strategy in the Lez basin; and the small-scale NAS strategy in the Spangen district in Rotterdam.
The first NAS canvas in Figure 3 shows the business model of a large-scale NAS to address drought risk in the area fed by the Medina del Campo Aquifer, in north-central Spain. The NAS strategy was composed of four measures (as described in Step 5: Key Activities): a crop change towards high-value, less water-consuming species (NBS), the creation of Groundwater User Associations (soft non-structural), the control of groundwater abstractions through meters and surveillance (soft non-structural), and the raising of environmental awareness (soft non-structural). The first outstanding aspect relates to the primary service and value, which, in this case, spans beyond the main drought risk reduction goal to include aquifer restoration, strongly driven by the requirements of the Water Framework Directive to achieve good groundwater status (Step 3: Regulation). This linked environmental value was a critical objective for the main stakeholder—the Duero River Basin Authority—and was also prioritized by other stakeholders, sometimes even higher than the drought risk reduction objective itself. Therefore, this objective had to be included as a primary value of the main problem that drove the main potential implementers. This highlights the importance of the multi-value or multi-functionality nature of NBS, which constitutes one of the strongest comparative advantages when compared to grey solutions. The second outstanding aspect is the mixed composition of public and private implementers (Step 4), including the institution (“Confederación Hidrográfica del Duero”, or the Duero River Basin Agency), responsible for water planning and management and supply and control measures, and the farmers, responsible for implementing the agricultural-based management measures like crop change. This partnership was necessary for the strategy to be effective and deliver the described impacts (Step 15), since, on the one hand, the isolated implementation of measures by farmers would be insufficient to stop the aquifer’s decreasing trends, while on the other hand, the application of groundwater management measures alone would incur insubstantial impacts for the agricultural economy in the area.
The second NAS canvas in Figure 4 shows the business model of a medium-scale NAS to address flood risk in the Lez sub-catchment in southeast France. The NAS strategy was composed of five types of NBS measures along the course of the river, mainly urban-focused interventions in the riverine city of Montpellier (open-vegetated retention basins, bioswales, green roofs, parking with permeable pavement, and rain gardens) and peri-urban centers. In this case, the risk reduction primary value alone was considerably lower than the costs of implementation, and probably insufficient for building the case for investment. However, the public perception of the secondary values from the co-benefits was remarkably high, thus largely outweighing the costs, which opened the case to involve both the direct beneficiaries (Step 10A: Municipality and Citizens) and the indirect beneficiaries (Step 10C: Insurance Companies) as clients to pay for the solution. Especially remarkable in this case was the combination of funding instruments through which these clients contributed, which include taxing and transfer mechanisms such as the GEMAPI tax (Taxe GEstion des Milieux Aquatiques et de Prévention des Inondations) and the Barnier Fund. The GEMAPI tax has been levied in France at the municipal level to fund activities aimed at the prevention of floods and the management of aquatic ecosystems, and involves, in this case, the direct beneficiaries. Its aim, as long as this responsibility is decentralized to municipalities, is to ensure appropriate synergies between flood prevention and the conservation of aquatic systems. It, therefore, represents an opportunity for the development of NBS. The insurance sector as an indirect beneficiary could also be involved in NBS funding through the Barnier Fund, a fund in which French insurance companies contribute 1.4% from all insurance policies for private homes and cars to be used to fund DRR interventions. These funding opportunities are nevertheless tied to the risk reduction benefit of NBS, which is limited according to other co-benefits. Other opportunities exist to turn these other benefits into funding opportunities. The Water Basin Agencies, which levies a tax on water bills, is funding activities for the attainment of the objectives of the Water Framework Directive, highlighted in the Masterplans for Water Development and Management (SDAGE). This agency has recently prioritized the funding of urban “deproofing” actions, including the NBS measures identified in our case study. Finally, municipalities, through their climate adaptation and green space development strategies, should be mobilized for the funding of NBS aimed at reducing water risks, considering the synergies previously highlighted.
The third NAS canvas in Figure 5 shows the business model of a small-scale urban NAS to address flood risk in the Spangen district in Rotterdam city, located in the southwest of the Netherlands. The NAS strategy included the implementation of a land-based biofilter with an associated groundwater storage system, using the existing underlying aquifer. A particularity of this strategy was that the NBS urban water buffer was fully implemented during the project timeframe, and thus the business model presented is based on real implementation and reflects the existing situation, rather than just a theoretical business model. Therefore, unlike the other cases, estimations of risk reduction values and co-benefits partially correspond to ex-post measurements based on empirical data. A very relevant result here is the magnitude of both the risk reduction value and the co-benefits (Steps 2A and 2B), which, summed together, clearly outweigh the costs of implementation (Step 8A). It should be noted, however, that the co-benefit assessment was conducted after implementation, and therefore, these insights on the economic impact of the co-benefits did not play a role in the decision to implement. Nevertheless, it clearly supports the case for investments by the local municipality and Water Authority, who together hold the responsibility for addressing the water nuisance problem in the area, lease the Field Factors systems, and are the clients paying for the solution (Step 10B). As such, it can inspire the replication of this business model for future implementations of similar NAS.
In addition, a side analysis of the keys for success and barriers for implementation (Steps 18 and 19) showed a series of common factors spanning across the three cases. The keys for success include funding availability (from the EU or other sources) to start or continue the intervention, cooperation between the stakeholders at different scales, the proven performance of the efficacy of the measures (critical in the demo where the solutions have been already applied, for example, Rotterdam), and political will or the enabling environment. With regards to implementation barriers, the most recurrent ones are uncertainty about funding for later maintenance; inertia, reluctancy, or a lack of cooperation from the stakeholders; possible political change or an unwillingness that blocks implementation; the need for systematic monitoring; lobbying and opposition from some organizations; and regulatory gaps.

4. Discussion

The importance of feasible and innovative business models for financing and mainstreaming NBS implementation, as well as the need for tools and approaches to identify these, has been increasingly raised by various institutions that assess and promote the role of NBS in a green and sustainable economy and recovery [23,24,25]. These include some national and supranational governmental institutions, such as the European Commission [26]. A proof of this is the inclusion of research lines to explore the business model potential for NBS in most of the NBS-based projects funded under several calls of the Horizon 2020 program since 2016. These initiatives have resulted in an array of new or adapted tools to describe NBS-related business models. Some examples include different adaptations of the traditional business model canvas [7,8,27,28,29], as well as catalogs of successful examples documented around the world [30,31]. Although these might appear similar, in fact, each of these tools has been developed with a different focus and applied to different contexts and scales, and thus, they provide different features that may be better suited and specific to some NBS projects than to others. Table 2 provides an overview of some of the most recent tools on business models for NBS, highlighting their focus and scales of application.
Table 2 illustrates where the NAS canvas stands and how it differentiates from other existing tools, as the only one tailored specifically for DRR- and CCA-related NBS and strategies (composed of one or several measures) at any possible scale, from large basins and aquifers to localized interventions in urban areas. This specific suitability stems from the application of the NAIAD framework across nine demo cases that spanned different geographical scales (neighborhood, urban, medium, and large-scale catchments), which accounts for the assurance and insurance values as risk reduction or avoided damages and costs as the primary services and main value provided by this type of NBS, whose accountability is critically important to provide evidence of their effectiveness, not only in biophysical terms but also in economic and social terms.
However, examples such as the Lez Basin case also highlight the critical importance that the value of co-benefits can play to make the case for investment and implementation, especially if compared with purely grey infrastructure alternatives [32]. A second differentiating feature is the inclusion of funding-related information that enables the economic case to connect with the financial case, providing an indication for investors and beneficiaries of the possibilities for blended finance, which may reduce the individual investment burden on a single actor and the high-risk perception holding back some venture capital and long-term investors. A third critical feature is the inclusion of impact indicators showcasing performance indicators in environmental, social, and economic terms, which aims to overcome one of the more recurring barriers, that of “a lack of measurable evidence” put forward by public procurers when considering NBS as an alternative or complement to well-known grey solutions [33,34]. Furthermore, the quantification of values, costs, and impacts within the NAS canvas is a valuable feature because it provides a clearer, simpler, and summative way to document complex information, which makes it a valuable communication tool.
The application of the NAS canvas to three cases in different contexts and project stages—from the identification and design of strategies in Medina del Campo and Lez through the market readiness and actual implementation in the case of Rotterdam— showed the flexibility and replicability of the tool, which can be applied to any NAS and NBS strategies in different contexts. Furthermore, the tool could potentially be also applied to NBS strategies that are not primarily aimed at risk reduction but have a primary objective, such as water security, by adapting the main problem to be addressed and its main value. The tool is easy to use and geared to project developers and promoters, scientists, technicians, NGOs or private non-profit organizations, and public bodies and decision-makers who are interested in exploring possible business model alternatives for an NBS strategy or a specific NBS in a particular project (including hybrid options that mix green and grey). The project stage will probably determine the level of detail of the information to be included in the canvas, that is, whether quantification is possible. In the earlier stage of the project, a qualitative description may be sufficient, while a fully quantified characterization should be pursued for projects in the last stages of the project cycle preparation. Thus, the context, the resources available, and the goal pursued should determine the level of detail and complexity characterized for the various components. For instance, in the case of developing countries where the biophysical data or records on disaster damages may be scarce or non-existent [35], the level of detail or accuracy of the value proposition and impact estimates may be lower. In these cases, the usefulness of the canvas as a tool is to provide a comprehensive and structured set of elements to guide promoters in designing an operational business model by eliciting the value and impact of the NAS. At this stage, it can help in diagnosing the information gaps and missing elements required to build the business model and guide on the next steps. For improving the quality of the information included in the NAS canvas, it is still important to improve the methods to quantify the impacts and to value the ecosystem services (co-benefits) generated by the NBS proposed. The NAS canvas also has the advantage of being able to include non-monetary values (see the example of Step 2B from the Medina del Campo case, in Figure 3), which can be especially important for valuing cultural services.
An important difference from the comparison of the three cases was observed when considering the institutional arrangements needed to implement the different NBS in each specific situation. The case of Rotterdam presents a small case, with a limited number of key partners and a well-defined decision structure. In the case of Medina del Campo, the implementation of the proposed NBS will imply the participation of a high number of actors, from hundreds of farmers (organized in several associations with different interests), to different scale administrative units (from the municipal to the regional and national levels), and to administrative units with some competing interests (e.g., the agrarian vs. the water bodies). These examples show how the needed governance arrangements can make big differences in the implementation of NBS.
Finally, an additional and differential element providing an added value to the NAS canvas results in any context is the co-creation and validation process with the stakeholders. In the application examples shown in this paper, the canvas was directly or indirectly (through inputs from interviews) developed and validated in conjunction with many of the affected stakeholders. This allowed the inclusion of important, rich, qualitative context data and information grounded in reality, and the identification of the different roles and interests from the different agents in a collective dialogue (e.g., as responsible for the problem or for the implementation of the solution, as beneficiaries with an active interest in the solution and with or without a willingness to pay, as well as the identification of possible barriers or enabling conditions that would help make the resulting business model be viable). Furthermore, it raised awareness and buy-in of the results, as well as fostering creative thinking and consideration of some existing or potential alternatives to the traditional options; for example, in the Medina case, selling high added value legumes as a small, local initiatives helped to identify innovative business models and new revenue streams.

5. Conclusions

The NAS canvas methodological framework and tool have been presented as comprehensive, user-friendly, and flexible tools specifically tailored for the identification and description of viable business models for NBS projects and NAS strategies aimed at disaster risk reduction (DRR). The application of the tool to three NAS strategies targeting different contexts (northern and southern European countries), scales (large regional, catchment, and urban), risks (floods and droughts) and development stages (from identification and formulation to full implementation, monitoring, and evaluation) proves it to be a flexible and usable tool, as well as efficient in helping to identify, in a logical, sequential flow, the elements, agents, and roles required to build a viable business model. Meanwhile, the co-creation and validation of the results with relevant stakeholders reinforces the communication and buy-in for the NAS strategy, helping to generate consensus and ownership around the co-created results. Finally, adding a layer with the quantified estimations of values (primary risk reduction value and co-benefits), costs (lifecycle and opportunity costs), and impacts (through key performance indicators) helps to document the evidence required to make the case to attract the interest of different types of investors, depending on the balance of the benefit–impact matrix and the beneficiary portfolio.
Overall, the tool aims to provide support to decision-makers (e.g., cities, catchment managers, and regions), project developers, funders, and NGOs and NBS developers to support the exploration, promotion, and implementation of NAS projects by providing guidance on the identification, visual organization, and communication of the elements, actors, roles, and impacts, as well as possible funding and revenue streams, to build a business model that is viable and can self-sustain in the long-term to attract the initial investment required.

Author Contributions

Conceptualization: B.M., P.Z.-M., N.G., R.M., F.N., A.S. and E.L.G.; data curation: J.C. and M.M.; formal analysis: B.M., P.L.C., T.B., K.D., K.P. and J.C.; methodology: P.L.C.; supervision: E.L.G.; writing—original draft: B.M.; writing—review & editing: P.Z.-M. and E.L.G. All authors have read and agreed to the published version of the manuscript.

Funding

This research received funding from the H2020 project Nature Insurance value: Assessment and Demonstration—NAIAD, grant agreement N°730497 from the European Commission.

Institutional Review Board Statement

Not applicable.

Informed Consent Statement

Not applicable.

Data Availability Statement

Not applicable.

Acknowledgments

The authors would like to acknowledge the collaboration of the stakeholders of Medina del Campo, Lez and Rotterdam case studies who devoted their precious time to provide feedback and validate the canvases.

Conflicts of Interest

The authors declare no conflict of interest.

References

  1. WEF. World Economic Forum: Global Risks Report, 2019; World Economic Forum: Geneva, Switzerland, 2019. [Google Scholar]
  2. EEA. Floodplain Management: Reducing Flood Risks and Restoring Healthy Ecosystems; European Economic Area: Brussels, Belgium, 2016; Available online: http://www.eea.europa.eu/highlights/floodplain-management-reducing-flood-risks (accessed on 15 January 2019).
  3. WEF. Water Crises Are a Top Global Risk; World Economic Forum: Geneva, Switzerland, 2019; Available online: https://www.weforum.org/agenda/2015/01/why-world-water-crises-are-a-top-global-risk/ (accessed on 15 January 2019).
  4. Topoxeus, H.S.; Polzin, F. DELIVERABLE 1.3 Part V: Characterizing Nature-Based Solutions from a Business Model and Financing Perspective. EU Horizon 2020 Naturvation Project Grant agreement No. 730243. 2017. Available online: https://naturvation.eu/sites/default/files/news/files/naturvation_characterizing_nature-based_solutions_from_a_business_model_and_financing_perspective.pdf (accessed on 30 January 2019).
  5. Somarakis, G.; Stagakis, S.; Chrysoulakis, N. (Eds.) Thinknature Nature-Based Solutions Handbook. ThinkNature Project Funded by the EU Horizon 2020 Research and Innovation Programme. 2019. Available online: https://platform.think-nature.eu/system/files/thinknature_handbook_final_print_0.pdf (accessed on 30 September 2019).
  6. Beltramello, A.; Haie-Fayle, L.; Pilat, D. Why New Business Models Matter for Green Growth. In OECD Green Growth Papers, No. 2013/01; OECD Publishing: Paris, France, 2013. [Google Scholar] [CrossRef]
  7. Coles, N.A.; Tyllianakis, E. Deliverable D7.3NBS Market Potential through Synergies at International Level: Business Plan Case Studies and Scope for International Mainstreaming; EU Horizon 2020 Think Nature Project, Grant Agreement No. 730338. 2019. Available online: https://www.researchgate.net/publication/338951938_NBS_Market_Potential_through_Synergies_at_International_Level_An_assessment_of_case_studies_and_the_scope_for_international_mainstreaming (accessed on 12 March 2020).
  8. McQuaid, S. Nature-Based Solutions Business Model Canvas Guidebook; EU Horizon 2020 Connecting Nature Project, Grant Agreement No. 730222. 2019. Available online: https://connectingnature.eu/sites/default/files/downloads/NBC-BMC-Booklet-Final-%28for-circulation%29.pdf (accessed on 12 March 2020).
  9. Le Coent, P.; Hérivaux, C.; Farina, G.; Forey, I.; Zi-Xiang, W.; Graveline, N.; Calatrava, J.; Martinez-Granados, D.; Marchal, R.; Moncoulon, D.; et al. Deliverable D6.3: DEMO Insurance Value Assessment Report. H2020 NAIAD Project Grant Agreement No. 730497. 2019. Available online: http://naiad2020.eu/wp-content/uploads/2020/10/D6.3.pdf (accessed on 12 March 2020).
  10. Denjean, B.; Altamirano, M.A.; Graveline, N.; Giordano, R.; van der Keur, P.; Moncoulon, D.; Weinberg, J.; Máñez Costa, M.; Kozinc, Z.; Mulligan, M.; et al. Natural Assurance Scheme: A level playing field framework for Green-Grey infrastructure development. Environ. Res. 2017, 159, 24–38. [Google Scholar] [CrossRef] [PubMed] [Green Version]
  11. Baumgärtner, S. The insurance value of biodiversity in the provision of ecosystem services. Nat. Resour. Model. 2007, 20, 87–127. [Google Scholar] [CrossRef]
  12. Osterwalder, A.; Pigneur, Y. Business Model Generation; Wiley & Sons: Toronto, ON, Canada, 2010. [Google Scholar]
  13. Graveline, N.; Joyce, J.; Calatrava, J.; Douai, A.; Arfaoui, N.; Moncoulon, D.; Manez, M.; De Ryke, H.; Zdravko, K. DELIVERABLE 4.1: General Framework for the Economic Assessment of Nature Based Solutions and Their Insurance value. EU Horizon 2020 NAIAD Project, Grant Agreement N°730497. 2017. Available online: http://naiad2020.eu/wp-content/uploads/2018/11/4.1-2.pdf (accessed on 30 January 2019).
  14. IBAN. PPPCanvas: A Simple Tool to Tackle Complex Business Models of Public-Private Partnerships. 2016. Available online: https://www.inclusivebusiness.net/ib-voices/pppcanvas-simple-tool-tackle-complex-business-models-public-private-partnerships (accessed on 20 January 2018).
  15. Altamirano, M.A.; de Rijke, H.; Basco Carrera, L.; Benitez-Avila, C.; Arellano Jaimerena, B.; Angulo, M.; Nanu, F.; Dartée, K.; Peña, K.; Lopez-Gunn, E.; et al. DELIVERABLE 7.3: Handbook for the Implementation of Nature-Based Solutions for Water Security: Guidelines for Designing an Implementation and Financing Arrangement; EU Horizon 2020 NAIAD Project, Grant Agreement N°730497 Dissemination; EU: Brussels, Belgium, 2020. [Google Scholar]
  16. Egusquiza, A. Nature4Cities Deliverable 1.2—NBS Implementation Models Typology. EU Horizon 2020 Nature 4 Cities Project Grant Agreement No. 730468. 2018. Available online: https://www.nature4cities.eu/n4c-publications-and-results (accessed on 16 March 2020).
  17. Vewin. Dutch Drinking Water Statistics 2017: From Source to Tap. 2017. Available online: https://www.vewin.nl/SiteCollectionDocuments/Publicaties/Cijfers/Drinkwaterstatistieken-2017-EN.pdf (accessed on 15 August 2019).
  18. Rotterdam City Council, Rotterdam, The Netherlands. Personal communication, 2019.
  19. Arcadis. MKBA Klimaatbestendige Inrichting Pilotwijken: Pilot Spangen (Rotterdam) en Mariahoeve (Den Haag); Arcadis: Amsterdam, The Netherlands, 2019. [Google Scholar]
  20. Moro, A.; Lonza, L. Electricity carbon intensity in European Member States: Impacts on GHG emissions of electric vehicles. Transp. Res. Part D Transp. Environ. 2018, 64, 5–14. [Google Scholar] [CrossRef] [PubMed]
  21. High-Level Commission on Carbon Prices. Report of the High-Level Commission on Carbon Prices; Carbon Pricing Leadership: Washington, DC, USA, 2017. [Google Scholar]
  22. Bervaes, J. De Invloed van Groen en Water op de Transactieprijzen van Woningen; Altera-Rapport 959; Altera: Wageningen, The Netherlands, 2004. [Google Scholar]
  23. The Nature Conservancy. Strategies for Operationalizing Nature-Based Solutions in the Private Sector; The Nature Conservancy Business Council: Arlington, VA, USA, 2019. [Google Scholar]
  24. Credit Suisse and McKinsey & Company. Conservation Finance from Niche to Mainstream: The Building of an Institutional Asset Class; Credit Suisse and McKinsey & Company: Zurich, Switzerland, 2016. [Google Scholar]
  25. EDF & Business and Meister Consultants Group. Unlocking Private Capital to Finance Sustainable Infrastructure; EDF & Business and Meister Consultants Group: Paris, France, 2016. [Google Scholar]
  26. European Commission (EC). Investing in Nature: Financing Conservation and Nature-Based Solutions; Joint Report by the European Commission and the European Investment Bank; EU: Brussels, Belgium, 2019. [Google Scholar]
  27. Joyce, A.; Paquin, R.L. The triple layered business model canvas: A tool to design more sustainable business models. J. Clean. Prod. 2016, 135, 1474–1486. [Google Scholar] [CrossRef]
  28. Mačiulytė, E.; Cioffi, M.; Zappia, F.; Duce, E.; Ferrari, A.; Kelson Batinga de Mendoca, M.F.; Loriga, G.; Suška, P.; Vaccari Paz, B.L.; Zangani, D.; et al. Deliverable 6.3: Business Models & Financing Strategies. UNALAB Project, Grant Agreement No. 730052. 2019. Available online: https://unalab.eu/index.php/system/files/2020-05/d63-business-models-and-financing-strategies2020-05-18.pdf (accessed on 15 March 2020).
  29. Naturvation. Business Model Puzzle: A Dialogue Tool for Realizing Urban Nature-Based Solutions. EU Horizon 2020 Naturvation Project Grant Agreement No. 730243. 2019. Available online: https://www.naturvation.eu/sites/default/files/results/content/files/nbs_business_model_puzzle_download.pdf (accessed on 15 Augest 2020).
  30. Mayor, B.; Benítez, C.; Angulo, M.; Nanu, F.; Groza, I.; Schrieu, A.; Marchal, M.; Le Coent, P.; Graveline, N.; Marouner, A.; et al. Deliverable 7.4: International Good Practices in Financing and Funding Nature Restoration. H2020 NAIAD Project. Grant Agreement No. 730497. 2019. Available online: http://naiad2020.eu/wp-content/uploads/2020/07/D7.4-NAIAD_International-Good-practices_FINAL.pdf (accessed on 15 March 2020).
  31. Toxopeus, H.S. Taking Action for Urban Nature: Business Model Catalogue for Urban Nature Based Solutions, NATURVATION Guide. EU Horizon 2020 Naturvation Project Grant Agreement No. 730243. 2019. Available online: https://www.naturvation.eu/sites/default/files/results/content/files/business_model_catalogue.pdf (accessed on 15 Augest 2020).
  32. Le Coent, P.; Hérivaux, C.; Calatrava, J.; Marchal, R.; Moncoulon, D.; Benitez-Avila, C.; Altamirano, M.A.; Graveline, N.; Piton, G.; Dartee, K. Is-It Worth Investing in NBS Aiming at Mitigating Water Risks? Insights from the Economic Assessment of NAIAD Case Studies. Presented in the 22nd EGU General Assembly, Held Online 4–8 May 2020, Id. 22537. Available online: https://meetingorganizer.copernicus.org/EGU2020/EGU2020-22537.html (accessed on 20 September 2020).
  33. The Nature Conservancy & MITECO. Soluciones Basadas en la Naturaleza para la gestión del agua en España; The Nature Conservancy & MITECO: Madrid, Spain, 2019. [Google Scholar]
  34. Mačiulytė, E.; Durieux, E. Public Procurement of Nature-Based Solutions Addressing barriers to the procurement of urban NBS: Case Studies and Recommendations. Report by the European Commission—Directorate-General for Research and Innovation. 2020. Available online: https://op.europa.eu/en/publication-detail/-/publication/d75b2354-11bc-11eb-9a54-01aa75ed71a1/language-en/format-PDF/source-166334197 (accessed on 15 September 2020).
  35. UNISDR. Progress and Challenges in Disaster Risk Reduction: A Contribution towards the Development of Policy Indicators for the Post-2015 Framework on Disaster Risk Reduction; The United Nations Office for Disaster Risk Reduction (UNISDR): Geneva, Switzerland, 2014. [Google Scholar]
Figure 1. Natural Assurance Schemes (NAS) Canvas Framework: flow diagram.
Sustainability 13 01291 g001
Figure 2. NAS Canvas. Color legend: Red: Traditional business canvas; Purple: PPP business canvas; Green: NAIAD project framework.
Sustainability 13 01291 g002
Figure 3. NAS canvas applied to the Medina del Campo aquifer NAS strategy.
Sustainability 13 01291 g003
Figure 4. NAS canvas for Lez NAS strategy.
Sustainability 13 01291 g004
Figure 5. NAS canvas for Rotterdam NAS strategy. 1. Estimates from site data; 2. Value over 50 years, energy use of avoided water production = 0.35 kWh/m3 [17], electricity = €0.17/kWh; 3. Value of retention = €500/m3 [18]; 4. Value over 50 years, avoided pumping costs = €0.05/m3 [19]; 5. Value over 50 years, electricity = 569 g CO2/kWh [20], carbon price of €54/ton [21]; 6. 4% increase on 100 households nearest to the urban water buffer [22], average property WOZ value in Spangen = €140,233 [18]; 7. Value over 50 years, water tariff = €0.91/m3.
Sustainability 13 01291 g005
Table 1. Study cases and main features.
Case NameNAS Strategy NameScaleMain RiskCountryCo-Benefit Valuation Method
Medina del Campo AquiferChange in agricultural practices and groundwater managementLarge scaleDroughts, aquifer depletionSpainQualitative valuation SH 1
Lez basinDevelopment of Green Infrastructure in the Lez BasinMedium—sub-catchment scaleFloodsFranceStated preference estimation (choice experiment) 2
RotterdamUrban Water Buffer, Spangen, Rotterdam Small—urban scalePluvial FloodingNetherlandsEmpirical assessments and value transfer using literature data 3
1 The method applied to value the co-benefits was a qualitative valuation based on stakeholders’ (SH) perceptions. The perceptions were gathered through two participatory workshops where representatives of all stakeholder groups (farmers and farmer associations, river basin authority local government, NGOs, and academia). The co-benefits were identified and ranked by the impact expected by the stakeholders and completed by the Medina demo team in the first workshop. Then, during a second workshop, the highest-ranked co-benefits were valued by the stakeholders by giving a consensual value on a scale from 1 to 10, 10 being the highest possible impact achieved and 1 the lowest possible impact achieved. 2 Co-benefits were estimated with different methods, which are described in Le Coent et al. (2019) [9]. Only the results of the choice experiment are reported. 3 Co-benefits were estimated using a combination of data taken from the implemented NBS and value transfer from literature. See Le Coent et al. (2019) [9] for a full explanation of the methodology applied and the application of the results from a broader assessment of neighborhood-scale NBS.
Table 2. Overview of some of the emerging tools to identify business models for NBS.
Business Model ToolFocusScaleSource
Naturvation business model catalogue and puzzleUrban NBS: air quality, water quality, heatwavesUrban[29,31]
Connecting Nature Business model canvasGeneric for all NBSMultiscale[8]
Think Nature NBS-business Canvas Urban NBSUrban[7]
PPP canvas by Inclusive business hubEcosystem servicesMultiscale[14]
Triple-layered business model canvas approachActions towards business sustainabilityMultiscale[27]
UNALAB approach: traditional business model canvasUrban green measures (roofs, gardens, permeable surfaces); and urban river restorationUrban[28]
NAS CanvasDRR- and CCA-related NBS strategies (NAS: natural assurance schemes) MultiscaleThis paper
Note: The blue cell highlights the NAS canvas presented in this paper and its differential features.
Publisher’s Note: MDPI stays neutral with regard to jurisdictional claims in published maps and institutional affiliations.

