How Different Are the Nordics? Unravelling the Willingness to Make Economic Sacrifices for the Environment


The International Institute for Industrial Environmental Economics (IIIEE), Lund University, Tegnérsplatsen 4, 223-50 Lund, Sweden
Sustainability 2021, 13(3), 1294; https://doi.org/10.3390/su13031294
Submission received: 22 December 2020
/
Revised: 18 January 2021
/
Accepted: 20 January 2021
/
Published: 26 January 2021
Abstract
:The Nordic countries are often considered as remarkably exceptional in terms of the proenvironmental behavior of their citizens and also as forerunners in environmental policies. However, very few empirical studies have been done at the aggregated level about how the Nordics compare to other countries. The article addresses this knowledge gap and analyzes the Nordic region in terms of willingness to make economic sacrifices, proenvironmental attitudes and behaviors. Data (N = 5877) from the environment module of the International Social Survey Program (ISSP) are utilized, with nonparametric statistical tests and multinomial logistic regression employed—wherein, emphasis is placed on the regression models for willingness as dependent variables as analysis of the first order, with attitudes, behaviors and sociodemographic variables as part of second order analysis. The findings reveal that the region’s higher levels of willingness, attitudes, and behaviors become more salient when compared to third countries. People in the Nordic region who are ‘neither willing nor unwilling’ to protect the environment can be considered as distinct, and should not be arbitrarily lumped within the categories of the ‘unwilling’ or ‘willing’ respondents. These insights allow for a deeper understanding of peoples’ willingness and the relationships to respective attitudes and behaviors beneficial towards engaging the acceptability of extant environmental policies.
1. Introduction
The Nordic countries are often considered as exemplars potentially leading the way in terms of environmental and climate change policies for the region [1,2,3]. Situated within the socio-economic and geographic context of their fellow Western European countries, European Union (EU) states, and third countries (In EU documents, all countries that are not European Union and European Free Trade Area (EFTA) states are called ‘third countries’. In this context, EU and EFTA states are categorized for the analysis at the time when the International Social Survey Program Environment III survey was fielded in the respective country) [4,5,6,7], the peoples of the Nordic countries (Denmark, Finland, Iceland, Norway, Sweden) are often lauded as having high levels of proenvironmental attitudes and behaviors, willingness and interconnectedness with each other [8,9,10]. The Nordic countries also consistently place among the highest in international sustainability indices and rankings [11,12,13,14] such as the Environmental Protection Index, Sustainable Governance Indicators, and the Sustainable Society Index [15,16,17]. Even among the derived studies based on reviews of such indices [11,14], it is noteworthy that the Nordic countries have been consistently in the top spots.
In addition to “Nordic countries having comparable environmental policies”, their citizens possess a high degree of global environmental awareness [18]—and are characterized by high levels of environmental concern in their peoples’ cultures, along with their governments having a political culture that is “rule-deferential” [19] emphasizing cooperation and consensus’ [20]. As such, there is the impetus for understanding environmental actions and the congruency to their values that could allow for early adoption and lifestyle changes [12]. The Nordic countries along with the Netherlands—having the lowest levels of air and water pollution—have also been purported as having the highest levels of support for protecting the environment, which has been attributed to the fact that they have “relatively high proportions of post-materialists in their population” [21].
Interestingly, however, there is a dearth of empirical studies that take the Nordic region as a whole in terms of investigating environmental attitudes, behaviors, and willingness to make economic sacrifices for the environment (i.e., paying higher prices/taxes or reducing living standards to protect the environment). We currently note only a few studies [8,22], which show the significant relationships and patterns within Environment survey variables, such as those from the ISSP, through an aggregated level of analysis. The Nordic countries have a unique influencing effect on the EU and its environmental policy [4,6]. They are highly regarded for their progressive national policies, technological initiatives (i.e., bioenergy, green technology, forest utilization), support for multilateral international agreements [3,7], well-rounded performance in fulfilling sustainable development goals [23] and potential in demonstrating the potential of low-carbon energy policies [2].
At present, concerning the Nordic countries’ high levels of willingness, environmental concern, and interconnectedness with each other [8,9,10,23,24] there have been studies covering individual Nordic countries on willingness to pay [25,26,27,28], although there is still a gap of knowledge in the research that focuses on the Nordic region with its countries are taken together as a whole for the subject of analysis. Moreover, prior analyses seldom considered the various the forms of willingness beyond a dichotomous understanding [29,30,31,32,33,34], and correspondingly lacked a deeper understanding of the relationships to substantive variables and sociodemographic indicators. Furthermore, with the growing number of studies on willingness to pay for environmental protection [33,35,36,37], there is a tendency to deal with the variables and analysis as aggregated into one combined dependent variable [8,20,34,38,39,40,41,42], or when treated as separate variables, the studies do not provide deeper discussions on the significant distinctions between them [31,32,33,43,44]. These current gaps in knowledge will be addressed by this study by focusing on the Nordic region. The paper addresses various forms of willingness to make economic sacrifices beyond a dichotomous understanding with regard to its relationships to substantive variables and sociodemographic indicators. By doing this, we aim to increase the level of resolution and complement existing studies.
In pursuing its objectives, the article seeks to answer the following questions:
- What is the distribution of the different respondent positions in the Nordic region for the three forms of willingness to make economic sacrifices, and what are the factors that predict these positions?
- Is the midpoint (neither–nor category) of the unwilling–willing scale a distinct ambivalent position towards willingness to make economic sacrifices? Are there differences between the significant factors influencing the two groups (“Fairly willing and Very willing”, “Neither willing nor unwilling”) that are not opposed to making sacrifices for the environment?
As it will be shown, results of this study demonstrate that willingness to make economic sacrifices for the environment among the Nordics is high, particularly in answering questions such as how willing they are towards “paying much higher taxes” and “accepting cuts in standards of living”—along with other proenvironmental attitudes and behaviors with their patterns and relationships as factors that predict willingness. There are valuable insights from the ISSP survey, such as that willingness to make economic sacrifices is crucial given that environmental problems concern citizens in developed and developing countries alike [41,45,46]—which can be valuable when considering potential/volitional/future behaviors and acceptance of different types of environmental policy instruments [45,46,47,48].
This research makes three novel and significant contributions to the current body of knowledge. First, by adding to the literature in terms of the Nordic unit of analysis, providing a higher resolution about attitudes and behaviors in the five countries sampled. Second, this paper fills a gap in the understanding of the three forms of willingness to make economic sacrifices for the environment (paying higher prices, paying higher taxes, reducing living standards to protect the environment)—as most studies merge the three forms into a combined single-item scale or adapt a dichotomous treatment of willingness, rather than treating respondents’ positions distinctly. This study then also correspondingly addresses the gap in existing studies that utilize a multinomial logistic approach. Third, from a policy perspective the paper discusses the implications of its findings that are relevant to corresponding political acceptability on the ambitions of extant environmental policies [45,47] and addressing behavioral change towards a more environmentally friendly direction [41].
2. Materials and Methods
2.1. Sample
This paper utilizes data from the ISSP Environment III module ZA5500 Data file Version 3.0.0. The ISSP is a continuing “annual program of cross-national collaboration on surveys” with 50 current member countries (see www.issp.org) and develops annual surveys focused on a single topic for each module [49]. The ISSP environment modules measure attitudes to environmental protection and preferred governmental approaches [9,18,50,51]. The ISSP employs a questionnaire with a systematic multistage random sampling procedure (Multistage sampling is a complex form of cluster sampling that involves dividing the population of a country into groups or clusters considering various levels or stages. For the ISSP 2010 sampling procedure, it is mostly a stratified multistage random sample—based for instance on geographical regions, households, and persons within the household. In such random sampling, no two persons from the same household would be in the same sample for a particular ISSP wave. Further details on the characteristics of national population can be obtained from http://dbk.gesis.org/dbksearch/download.asp?id=46246) that considers region, household and persons within the household. The target population are adults, with varying age limits for each country (The latest dataset version of ISSP Environment III (13.06.2019) can be accessed from the Leibniz-Institut für Sozialwissenschaften website at https://zacat.gesis.org/webview/index.jsp?object=http://zacat.gesis.org/obj/fStudy/ZA5500). ISSP 2010 has 50,437 respondents from 36 countries with a sample size of about 1000 people in most countries, with an equal number of respondents of each gender [9,52]. For the purposes of the current study, the analysis is restricted to the subsamples of the five Nordic countries: Denmark (1305), Finland (1211), Iceland (798), Norway (1382), and Sweden (1181) collected between 2010 and 2012 containing 5877 total observations [8].
For the analysis, the ISSP Environment III module [49] is used for a variety of reasons. First, it is the only currently available instrument that provides survey items on proenvironmental attitudes, consumer and public behaviors—as well as including all five Nordic countries. Although the dataset is relatively outdated, the Environment III module is the latest available version released by ISSP dealing extensively with environmental issues, even when “compared to other international datasets such as the European Values Studies, Pew’s Global Attitudes Project, and the World Values Survey” [32]. Second, the ISSP is still among the foremost reliable sources utilized by recent studies covering a wide array of topics on environmental protection, ideology, social trust, policy and public support in various institutional and national contexts [30,43,44,53,54,55]—with its design and variables even emulated by other locally conducted surveys [39].
2.2. Variables
Different variables are used to develop and frame the analysis (see Table 1). In order of importance for the purpose of this study, they are elaborated as follows.
The three main variables analyzed are: willingness to sacrifice for the environment is understood as a respondents’ willingness to make trade-offs or personal sacrifices corresponding to particular aspects such as “paying much higher prices”, “paying much higher taxes”, and “accepting cuts in their standard of living” in order to protect the environment [52,58,59]. The argument for utilizing them in the present study is that these ISSP survey items (see tables and appendices for additional variable details and descriptives. More specific descriptions and discussion of ISSP Survey methodology and variables, along with the Environment III dataset, codebook and country-specific questionnaires with corresponding translations can be obtained from https://www.gesis.org/en/issp/home) had been used in previous studies on the willingness of citizens towards contributing and make “economic sacrifices for environmental protection”—with the three corresponding broadly to environmental policy instruments relevant to economic incentives (i.e., charges and taxes), as well as regulatory approaches with changes or cuts to standards of living in order to adhere to performance standards and mandatory obligations [33,38,41,43]. As also observed by Pielke, “opinion polls demonstrate that the public is willing to pay some amount for attaining environmental goals” [65]. This paper aims to avoiding a purely dichotomous or binary perspective (pro- or anti-) of willingness to make sacrifices, by instead considering those who support, oppose, and those who are neither—in determining the effect and significance of various factors (further details on variables used in the analysis and other relevant tables/figures from the analyses can be found in Appendix A, Appendix B and Appendix C) [66].
2.3. Model Specification and Tests
The extant research on willingness to make sacrifices for environmental protection operationalize the three types of willingness (to pay much higher prices, pay much higher taxes, accept cuts to current standard of living) in their analyses as separate variables [31,32,33,43,44], taken together by themselves or with other variables in the forms of indexes or scales [20,34,38,40,41,42], or as comprising factors/dimensions [8,39].
For studies tackling the forms of willingness as separate, the 5-point Likert type variables are considered to assume ordinal or ranked values, with the most common analyses being performed being those such as Ordinal Logistic Regression, Ordered Probit, Hierarchical Linear Modelling and similar methods [29,30,31,32,33], while other studies recode the values as binary or dichotomous being used for logistic regression or bivariate probit models [34]. As for combining the three forms of willingness, values are recoded into increasing scales or indexes [38,41,42]. Such is also the case in papers that analyze only one or two forms of willingness. Moreover, in line with the results of the Test of Parallel lines (proportional odds assumption) (the polychotomous universal model (PLUM) procedure of SPSS makes use of a general class of models to allow analysis of the relationship between a polychotomous ordinal dependent variable and a set of predictors, and includes a test for parallel lines in order to evaluate whether the parameters are the same for all categories [67]. Since the results indicate that the null hypothesis based on the significance of the Chi-Square statistic should be rejected, the ordered logit coefficients are not equal across the levels of the outcome, and recommend fitting a less restrictive model such multinomial logit model (See IBM Knowledge Centre https://www.ibm.com/support/knowledgecenter/SSLVMB_24.0.0/ spss/advanced/syn_plum_overview.html).) for the model that also suggest that it should not be pursued using an ordered logistic regression approach but rather more appropriately through multinomial (polychotomous) regression.
At the time of writing, there is a gap in existing studies for research that utilizes a multinomial (polychotomous) logistic approach. This is a polychotomous type of logistic regression that predicts membership or preference [67,68] that will be utilized for the present study to find the significant factors that explain belonging to the three groups related to willingness.
With the three dependent willingness variables recoded into three distinct category responses, thusly “an econometric model developed for categorical dependent variables should be preferred to linear models such as the ordinary least squares estimator” [34]. Therefore, the binomial logistic regression formula is generalized to the multinomial case in order to model nominal outcomes—the analysis breaks the outcome variable into a series of comparisons against the reference category [68], with the logit for the jth comparison as:
where πij is the probability of observing outcome j, x′i is a vector of predictors, and βj is a vector of unknown regression coefficients that are typically estimated by maximum likelihood. By using J as a baseline category, J − 1 comparisons are constructed in relation to the reference (neither willing nor unwilling) category [69,70].
Adopting methods utilized by established research on willingness to make sacrifices for environmental protection and environmental concern [30,35,41,43,71,72,73], this paper operationalizes each of the three forms of willingness with their three (polychotomous) categories (unwilling, neither–nor, willing) then explores their relationship to other variables such as general values, preferences, and sociodemographics in multinomial logistic regression analyses [50,59,61,69]. In the interest of consistency and in order to stay true to specifications for replicability, variables of interest are recoded or transformed into scales as indicated in previous research, with the reliability of the measures tested to determine if they meet an acceptable level of reliability such as Cronbach’s alpha of 0.6 or higher [74].
A further novelty of this current paper rests on the premise that although the three items seemingly measure similar attitudes, its approach does not assume that these three forms of willingness or membership of response within groups can be explained by the same common variables. Moreover, while a “combined multivariate approach may improve efficiency, individual regressions could lead to consistent estimates” [75]—and provides for a more nuanced understanding of the contributing factors for each.
Ambivalence can then also be evaluated based on mixed attitudes, traits, and preferences found within the response categories [66], as a corollary goal of the current study is dealing with the importance of a distinct ambivalent position (neither–nor) in regard to willingness to sacrifice for the sake of the environment. In line with previous research that investigates citizen attitudes through polychotomous or multinomial logistic regression analysis—by providing a middle category in between, “it is assumed that categories are equal and that respondents can take a middle position which is characterized by mixed attitudes and preferences that can be positive or negative” [66] towards its effects on willingness.
The analysis also involves the application of descriptive statistics, nonparametric tests for independent samples and post hoc tests to establish differences in the characteristics of those among the three categories of willingness, as well as between the Nordic region and other country groupings [5,20,57,61]. To compare independent groups of Nordic country respondents and non-Nordic country respondents (Western European, EU, third countries, all other remaining. Further details on country groupings can be found in Appendix A, Table A1), a rank-based nonparametric approach is conducted with the Mann–Whitney U or Kruskal–Wallis H test using SPSS version 25 program for the analyses [76,77,78,79].
3. Results
As set out in the introduction of this article, the results are presented in order of addressing the main research questions, with findings from the multinomial regression analyses being pursued having willingness as first order results, whereas attitudes and behaviors are considered second order results. Additional information and analyses conducted can be found in Appendix C, which contains descriptives together with a discussion on the differences and similarities of the Nordic countries to others.
3.1. Distribution of Different Respondent Positions
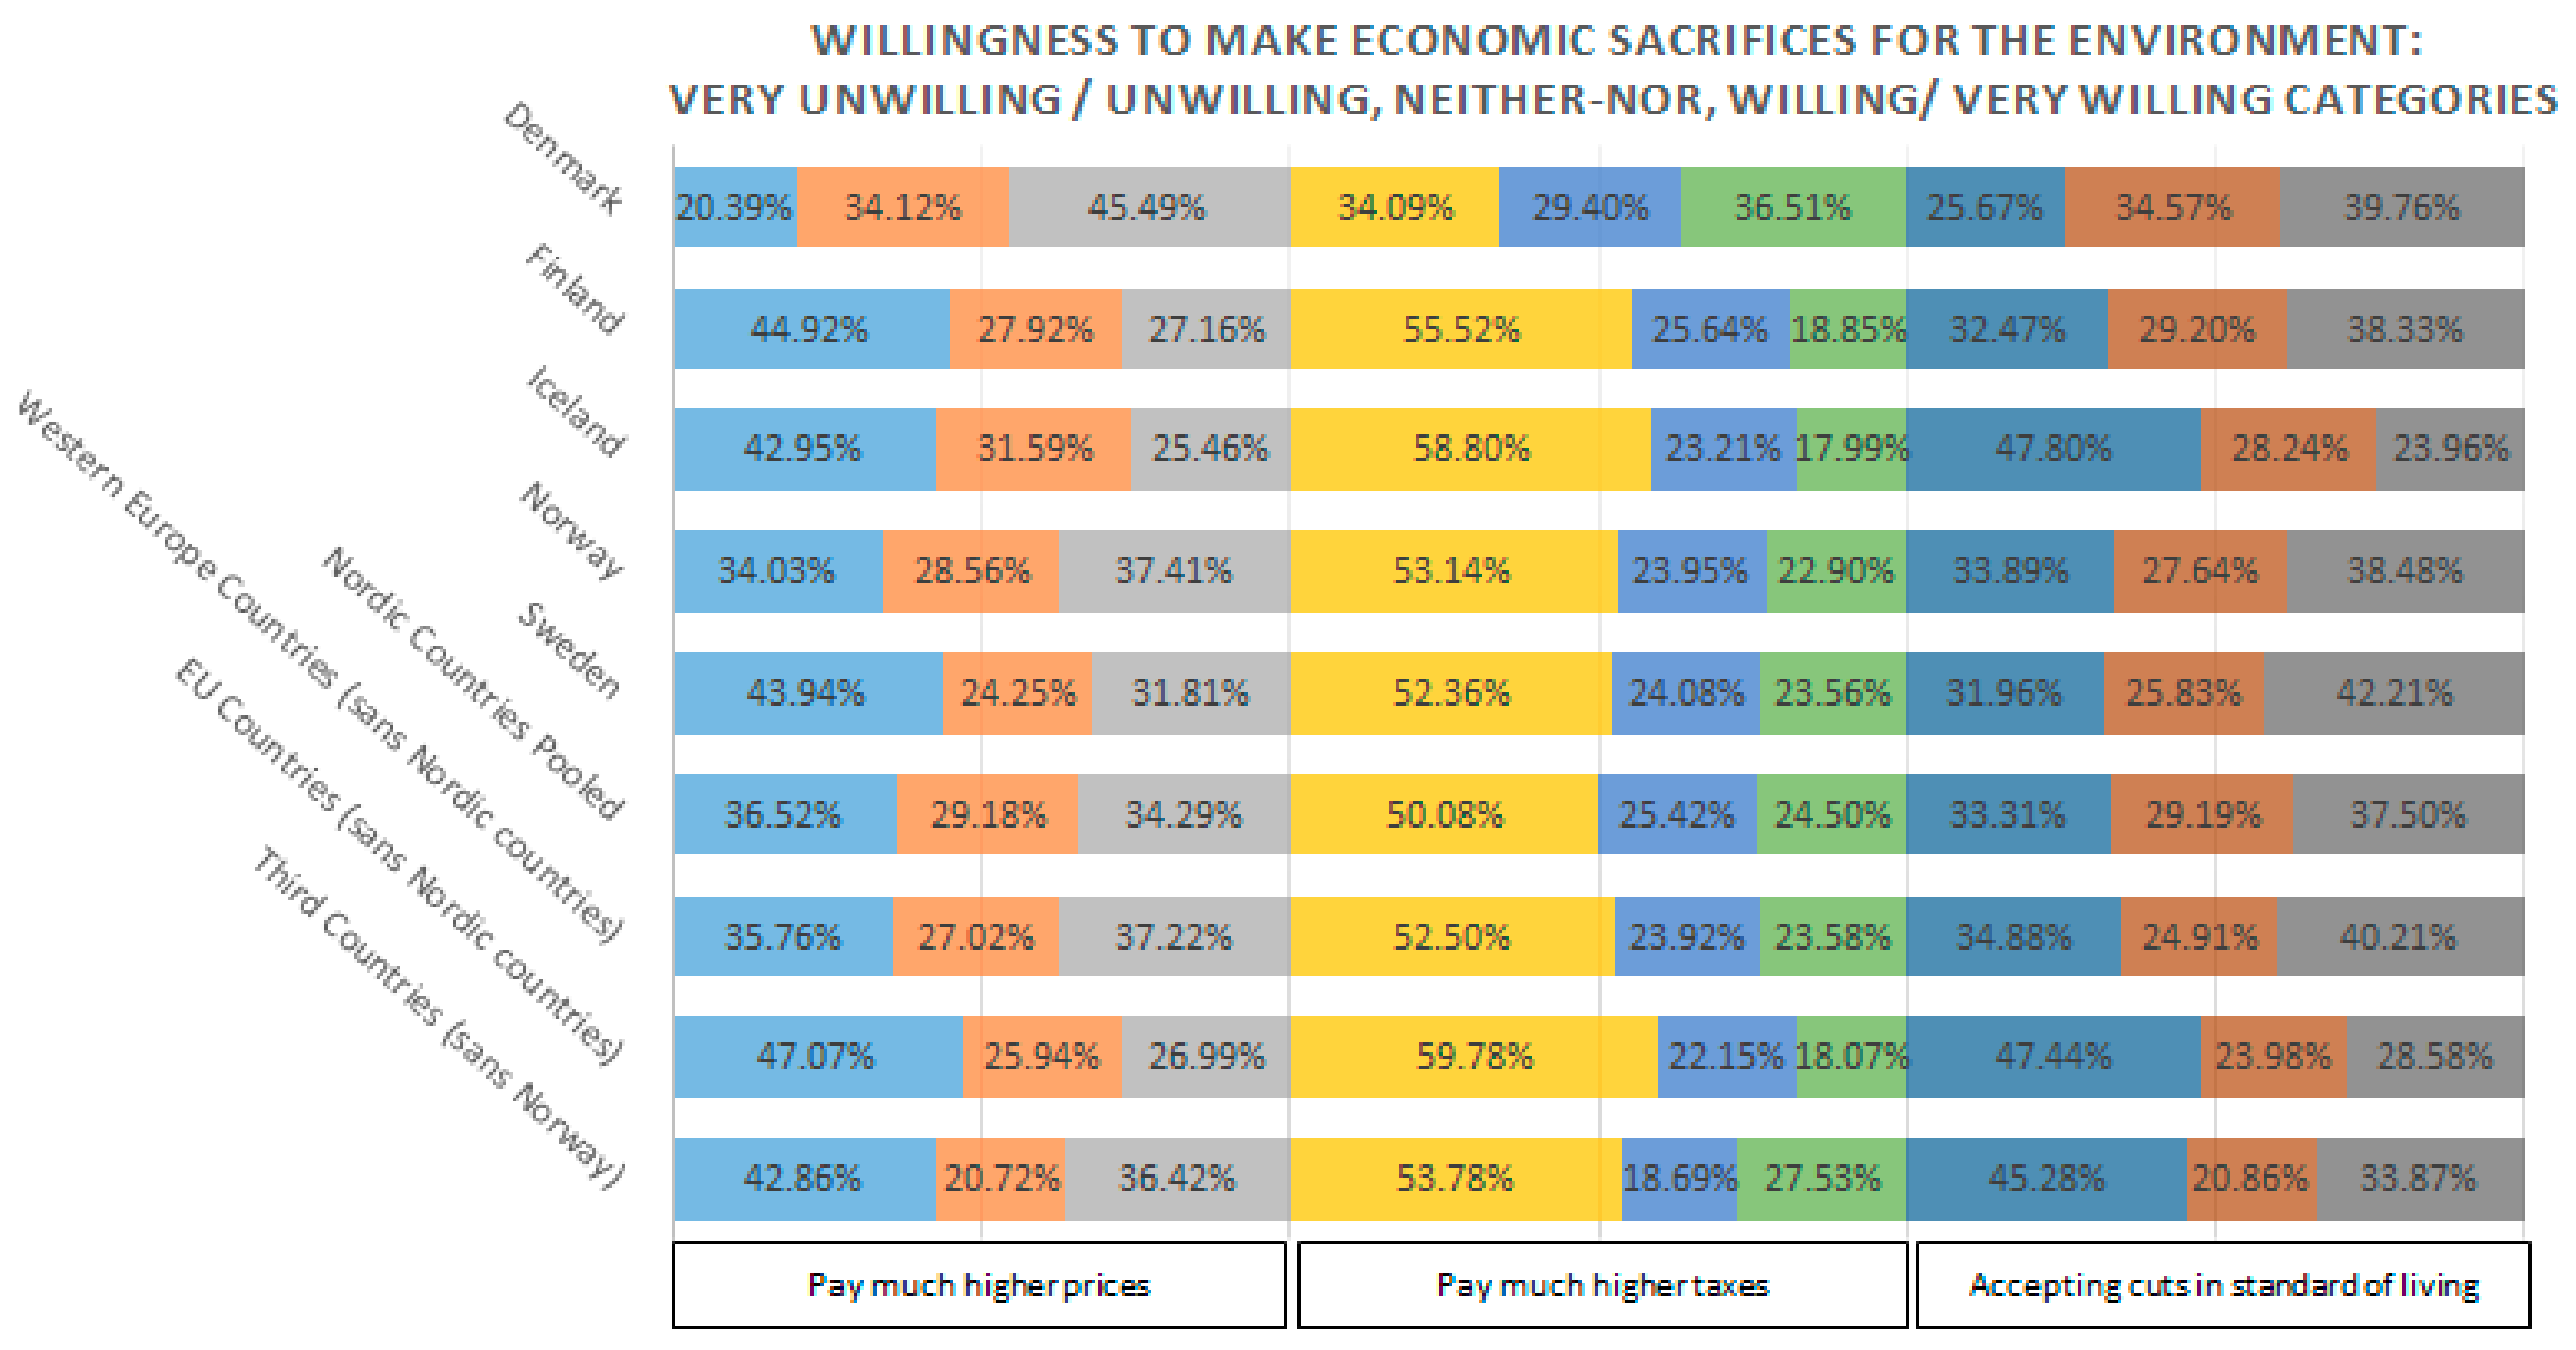
The three forms of willingness to make economic sacrifices were recoded into three categories for the analyses. Figure 1 describes willingness in each of the five Nordic countries and the Nordic regional average, as well as the pooled averages of other Western European countries, EU member states, and third countries for comparison. Overall, Denmark consistently has the highest number of respondents as compared to its Nordic neighbors, and higher than the averages of country groupings.
Among the three forms of willingness, paying much higher taxes was found to have the least amount of willingness from respondents. A Friedman test was carried out to compare the total willingness scores of the three forms of willingness and a significant difference between them, χ2(2) = 5084.427, p < 0.001 Dunn–Bonferroni post hoc tests were carried out and there were significant differences between taxes and prices (p < 0.001), between taxes and cuts in standard of living (p < 0.001) and between taxes and cuts in standard of living (p < 0.001) after Bonferroni adjustments. Denmark had significantly fewer unwilling respondents (34.09%) as compared to the other the Nordic countries’ averages, as well as the Western European countries’, EU states’, and third countries’ averages.
The findings also reveal that there is substantial variation between countries and across groups when comparing among the Nordic countries (prices: χ2(4) = 214.755, p = 0.014; taxes: χ2(4) = 198.345, p = 0.014; standard of living: χ2(4) = 114.840, p < 0.000), Western European countries, EU states, and third countries for the three forms of willingness. As also indicated by the results of the Kruskal–Wallis nonparametric tests and Dunn post hoc tests for responses on the three forms of willingness: prices, taxes and cuts yielded significant results for the Nordic pooled sample versus other country groupings (EU/EFTA, third countries).
The substantial proportion of respondents belonging to the neither–nor group are comparable to the willing group. Considering the findings above stated, together these give support towards a nondichotomous approach that is distinctive to each form to willingness to make economic sacrifices for the environment.
3.2. Which Factors Predict Willingness to Make Economic Sacrifices for the Environment?
For willingness to pay much higher prices, it was revealed that it consists of 36.52 percent unwilling, 29.18 percent of neither–nor, and 34.29 percent willing. As for willingness to pay much higher taxes, half (50.08%) of the respondents were found to be unwilling, 25.42% were neither–nor, and only 24.50% willing. Finally for willingness to accept cuts in their standard of living, 33.31% were unwilling, 29.19% was neither–nor, and most (37.50%) were in the willing category. The answers about willingness were subsequently recoded as three categories (unwilling, neither–nor, willing).
The results show significant relationships with the sociodemographic variables: gender (prices: X22 = 17.349, taxes: X22 = 38.504, cuts: X22 = 58.564, all with p = 0.000), political affiliation (prices: X210 = 159.621, taxes: X210 = 338.253, cuts: X210 = 200.484, all with p = 0.000), and education (prices: X28 = 141.096, taxes: X28 = 140.421, cuts: X28 = 83.858, all with p = 0.000).
As presented in Table 2 for the pooled Nordic sample, the results show consistent patterns for willingness to pay much higher prices, higher taxes, and accepting cuts to the standard of living, wherein women who have a completed a university degree and possess a left or center-left political affiliation are willing significantly more often. On the other hand, people with a right or conservative political affiliation are more often unwilling or fall into the neither–nor category. For willingness to pay much higher taxes and accepting cuts to standard of living, the findings show that those who are unwilling were more often men, and those with a right-wing or conservative political orientation.
In relation to proenvironmental attitudes, for all three forms of willingness, Kruskal–Wallis tests reveal that there are significant differences among the three groups of respondents—on the whole as expected those who are willing have higher proenvironmental attitudes than the neither–nor, who in turn have higher proenvironmental attitudes than those who are unwilling. However, upon considering the specific items, the neither–nor respondents sometimes lie in the middle (i.e., general concern for environmental issues), sometimes closer to willingness (i.e., institutional trust, having more important things to do in life than protect the environment), and sometimes closer to unwillingness (social trust, perceived activity arena).
As for behaviors, overall, as expected, those who are willing to make economic sacrifices had higher engagement in public behaviors, followed by those who were neither–nor, and finally by those who were unwilling. Surprisingly, when comparing the groups of the three forms of willingness, those who were willing to pay much higher taxes were also the most engaged in public behaviors.
Similarly, for private consumer behaviors of respondents in the Nordic pooled sample, those who were willing to make economic sacrifices in its three forms had consistent significantly higher engagement (p = 0.000; p = 0.000; p = 0.000), followed by those who were neither–nor (p = 0.000; p = 0.000; p = 0.000), and lastly by those who were unwilling (p = 0.000; p = 0.000; p = 0.000). Again, among the groups of the three forms of willingness, those who were willing to pay much higher taxes were also most engaged in public behaviors. This could potentially indicate that exhibiting such willingness towards a less popular or harder sacrifice is related to engagement of proenvironmental behaviors. However, contrary to other proenvironmental items wherein the neither–nors have closer responses to the willing, the level of engagement of the neither–nors for public behaviors is consistently found to be closer to that of the unwilling, which is another indicator of ambivalence. Taken together, the significant difference of attitudes, preferences, and behaviors among the three categories of all three forms of willingness found with Kruskal–Wallis with Dunn post hoc, along with the results distribution in the Nordic region provide further evidence towards a distinctive position for the neither–nor category [66].
3.3. Differences Between Neither–Nor and the Two Asserted Positions of Unwilling and Willing to Make Economic Sacrifices
We performed a multinomial (polychotomous) logistic regression with the pooled Nordic sample for willingness to pay higher prices, higher taxes, and accepting cuts in standard of living—which compares the willing group to the unwilling group, and the neither–nor to the unwilling group. Analyses were carried out using 20 potential factors: environmental attitudes (too difficult for someone like me to do much about the environment; do what is right even if it costs money and takes time; having more important things to do in life than protect the environment; science will solve environmental problems), environmental concern, social trust, institutional trust, perceived danger of environmental problems, multilateralism through international agreements, preference towards energy security, public behavior, consumer behavior, postmaterialism, country, political orientation, and sociodemographic factors (gender, age, self-placed socioeconomic status, income, education). Table 3 presents the results of the likelihood ratio for the final models derived by using iterative forward inclusion of independent variables (forward entry method) to avoid multicolinearity among predictors.
All three of the full models for ‘prices’, ‘taxes’, and ‘cuts to standard of living’ statistically significantly predict the dependent variable better than the intercept-only model alone as indicated by model fitting information [68]. Based on the likelihood ratio chi-square test the model fit for all three models are significant (prices: X250 = 1105.046, p = 0.000; taxes: X242 = 1018.465, p = 0.000; cuts: X242 = 1116.542, p = 0.000), which indicates that the models predictions are significantly better or more accurate than the null model. Pearson and deviance statistics (prices: df = 5730, Pearson 5838.830, p = 0.155, deviance 5195.452, p = 1.000; taxes: df = 5754, Pearson 5822.196, p = 0.261, deviance 5050.666, p = 1.000; cuts: df = 5734, Pearson 6116.382, p = 0.000, deviance 5153.184, p = 1.000) also serve as alternative tests of the goodness-of-fit for the models. As with most chi-square based tests, it must be considered that the aforementioned measures are prone to inflation as sample size increases, and though models are not expected to be perfect representations of reality these can still be helpful in guiding the development for future improvement of models [80].
The respective approximations of proportions of variance that can be explained by the model is represented by Pseudo R2 (Prices: Cox and Snell = 0.318, Nagelkerke = 0.358, McFadden = 0.175, Taxes: Cox and Snell = 0.296, Nagelkerke = 0.338, McFadden = 0.168, Cuts to standard of living: Cox and Snell = 0.321, Nagelkerke = 0.362, McFadden = 0.178). Table 3 and Table 4 show the likelihood ratio tests and parameter estimates for each form of willingness, corresponding to three categories of the dependent variable, with two sets of logistic regression coefficients.
3.4. What Distinguishes the Willing and Unwilling in the Nordic Region?
For paying much higher prices, all other factors being constant, the respondent’s higher social trust, institutional trust, general concern for environmental issues, environmental attitude to “do what is right even if it costs money and takes time”, agreement to multilateralism, postmaterialism, perceived dangers of environmental problems, engagement in proenvironmental public behaviors, engagement in private consumer behaviors, and higher self-placed socioeconomic status increase the chances, as expressed by the odds ratios, of being willing rather than unwilling; whereas having a right, conservative, or far-right political orientation, as well as the environmental attitude of believing that “there are more important things to do in life than protect the environment” decrease the chances of being willing rather than being unwilling.
In regard to paying much higher taxes, all other factors being constant, higher institutional trust in government, general concern for environmental issues, environmental attitude to ‘do what is right even if it costs money and takes time’, agreement to multilateralism, post-materialism, perceived dangers, preference of solar, wind, water energy towards their country’s energy security, engagement in proenvironmental public behaviors, engagement in private consumer behaviors, having a far-left (communist etc.), left, center-left political orientation and higher self-placed socioeconomic status increase the chances of being willing rather than unwilling; whereas having a right, conservative, or far-right political orientation, decrease the chances of being willing rather than being unwilling.
Lastly, for accepting cuts in standard of living, all other factors being constant, the respondent’s higher social trust, institutional trust, general concern for environmental issues, environmental attitude to “do what is right even if it costs money and takes time”, postmaterialism, perceived danger of environmental problems, preference of solar, wind, water energy towards their country’s energy security, engagement in proenvironmental public behaviors, engagement in private consumer behaviors, and higher self-placed socioeconomic status increase the chances of being willing rather than unwilling; whereas having a right-wing political orientation, as well as the environmental attitudes of believing that “there are more important things than protect the environment”, “that to do much about environment is too difficult” and “modern science will solve our environmental problems with little change to our way of life”, decrease the chances of being willing rather than being unwilling.
3.5. What Distinguishes the Neither–Nors and the Unwilling?
For paying much higher prices, all other factors being constant, a respondent’s higher institutional trust, general concern for environmental issues, the environmental attitude to “do what is right even if it costs money and takes time”, higher engagement in private consumer behaviors, and age increase the chances of being neither–nor rather than unwilling; whereas the environmental attitude of believing that “there are more important things to do in life than protect the environment” decrease the chances of being neither–nor rather than being unwilling.
In terms of paying much higher taxes, all other factors being constant, a respondent’s higher institutional trust, general concern for environmental issues, the environmental attitude to “do what is right even if it costs money and takes time”, higher engagement in private consumer behaviors, age, higher self-placed socioeconomic status and having a far left (communist etc.), left, or center-left political orientation increase the chances of being neither–nor rather than unwilling; whereas being male, and the environmental attitude of believing that “there are more important things to do in life than protect the environment” decrease the chances of being neither–nor rather than being unwilling.
Finally, for accepting cuts in standard of living in order to protect the environment, all other factors being constant, a respondent’s higher institutional trust, general concern for environmental issues, the environmental attitude to “do what is right even if it costs money and takes time”, preference of solar, wind and water energy towards their country’s energy security, higher engagement in private consumer behaviors, and age increase the chances of being neither–nor rather than unwilling; whereas the environmental attitudes of believing that “there are more important things to do in life than protect the environment” and “Modern science will solve our environmental problems with little change to our way of life” decrease the chances of being neither–nor rather than being unwilling.
Findings for the Nordic region reveal that some estimated coefficients (i.e., social trust, attitudes to international environmental agreements, political affiliation, post-materialism) have different significances in the two group comparisons, thus further confirming the decision not to pool the substantial number of neither–nor respondents as part of unwilling or willing respondents in a dichotomous binary logistic regression model.
4. Discussion
Given the variety of results and myriad possible directions for discussions, in order to provide structure and a clear narrative, this section of the article is organized as follows: first, a comparison with previous and similar studies, including international sustainability rankings; second, policy implications; third, methodological issues and limitations; and finally, further research that can be pursued based on the findings of this paper are discussed.
Overall, the findings revealed that individual Nordic countries’ mean responses and the Nordic countries’ pooled mean had significantly higher levels in most substantive survey items dealing with willingness to make economic sacrifices for the environment, proenvironmental attitudes, behaviors and preferences—as compared to other Western European countries, other EU member states, and third countries. Findings for most survey items from the ISSP are in line with observations of close similarities for higher environmentalism among the Nordic countries [5,31], with exceptions in certain variables with Denmark performing even slightly better as compared to the other Nordic countries and EU states.
When viewing the Nordic countries with their relatively high international rank and scores in sustainability indices, knowledge about their peoples’ willingness to make economic sacrifices would be beneficial in order to understand their countries’ respective positions [81]. The environmental quality and proximity of these countries to their established environmental policy goals impact their demand for such environmental policies [30]. When analyzing the relationship of the values of three forms of willingness to make economic sacrifices for all 36 countries with that of the 2018 EPI country scores, SGI 2019 Policy Performance, and SSI 2016 Environmental Wellbeing—significant correlations were observed (Appendix, Table A1), particularly for willingness to pay much higher prices and accepting cuts to standard of living, where correlations were comparable to those that were found using the mean environmental concern derived from 9 ISSP items as reported in Franzen and Vogl [9]. The results for EPI and SGI also turn out to be robust, even when only the subsample of the 18 EU member states is taken into consideration. While acknowledging that these indices have their limitations with varying objectives and measures [11,14], the findings still offer insights as to the current state of the environment and progress made by countries in relation to their peoples’ attitudes and behaviors. These can also further assist in gauging the progress of prosperous nations in fulfilling sustainable development goals in terms of policies and environmental performance. Although foreign models for different countries/cultures cannot in most cases be uncritically imported into a given nation, the experience in the Nordic countries seems to provide important examples for pursuing sustainable development goals [23].
Another fascinating result pertains to the overall higher levels of willingness to pay for much higher taxes for the environment in the Nordic region. This is particularly interesting as other studies found that “the public strongly disfavours taxation as a means of addressing environmental problems—even if green taxes tend to be less unpopular than other taxes” [32]; taxes are still often an unpopular form of environmental policy instrument in Europe [82]. Thus, Nordic respondents would be the exception in the sense of possessing higher willingness to pay for much higher taxes for environmental protection as compared to paying higher prices or accepting cuts to their standard of living.
5. Conclusions
On the whole, the findings of this study remain consistent with the results of various pieces of research on environmental attitudes and behaviors that showed that citizens’ willingness to make economic sacrifices had significant relationships to consumer behaviors and public behaviors [8,22,33,54,79]. Most notably, for all three multinomial regression models of this study covering pooled sample of the Nordic countries, findings for the public behaviors variable were consistent with the results (specifically in Sweden)of the comparable scale of “civic participation” yielding positive associations with willingness to contribute for the provision of environmental goods [43].
In terms of its methodological contribution, the three forms of willingness “describe different ways how individuals may wish to contribute, and an individual can have different responses for each which are driven by associated factors such as status concerns or openness to government interventions” [34]. However, these are often merged into a single scale, or are not all studied together. There are also difficulties noted towards “interpreting the environmental values of those within the obscure category neither willing nor unwilling’=” [83], resulting in these respondents being added either to the unwilling or willing group. Thusly, this study contributes by presenting all three distinct measures that elicit the respondents’ willingness to make economic sacrifices, as well as their respective positions.
5.1. Policy Implications
From a wider perspective it is crucial to understand the limits of “felt cost” and “willingness to pay by citizens” as a political economy constraint towards attaining the legitimate authority for successful interventions to transboundary problems with long time scales such as climate change [84]. Another relevant issue is that answers reflect the stated preferences of the respondents, and that potential gaps can be identified when analyzing revealed preferences (e.g., value–action gap). In order to be more conducive to developing sustainability innovations that are durable and attractive at a global level, policies should respect peoples’ economic sensitivities towards paying for environmental protection. Taking carbon tax as an example, profound implications for how national and international policies are constructed, diffused, and accepted are affected by such sensitivities [60,81,82]. It is in these aspects that the progress made by the Nordic countries can be meaningfully appreciated when described as being exemplars of sustainability to Europe and the rest of the world.
Successful policy interventions for “increased environmental collective action are more likely to occur with citizenry support” [30]. Thus, it is important to assess the population’s general willingness for endeavors for the environment [40,83,84] such as “transitioning to low carbon lifestyle, monitoring, policy-making, and policy implementation in the context of climate change and energy consumption” [85]. As these pertain to public acceptability, these could also be framed as part of a policy evaluation criterion.
Due to varying public “preferences pertaining global cooperation, burden sharing, willingness to pay, and to change individual behavior for environmental protection”, environmental policy approaches through economic instruments such as taxes and charges must be also carefully considered [59] as the implications of environmental problems press unevenly among groups of people [86,87]. From an individual perspective and in the context of environmental policy, an important element worth considering is the (potential) conflict between personal hedonic and gain goals on the one hand, and normative and social goals on the other (as described by Lindenberg and Steg [88], and Steg et al. [89]: hedonic goals focus on ways to improve feelings in a particular situation such as seeking direct pleasure or excitement, and avoiding effort. Gain goals for individuals prompt them to be sensitive to changes in their personal resources such as money and status. Normative goals focus on the appropriateness of actions and make people sensitive to what they think they ought to do, such as their contribution to a clean environment, or demonstrating exemplary behaviors.) [89].
For instance, in regard to preference for renewable sources (future energy) in order to achieve energy security, a notable finding among the three forms of willingness to make economic sacrifices shows that it is only in the form of accepting cuts to standard of living wherein this is a significant factor. As solar, wind, and water energy are considered as alternatives to fossil-based power technologies, sustainable backstop technologies that holds promise as a future or current solution and appearing with certainty once becoming economical [90]—this could imply that among the Nordic countries, wherein such technologies have already been considered as viable and affordable for consumers, it is not so much about the cost anymore, but rather more relevant to a discussion now of people accepting changes to their present lifestyles tempered by lesser consumption of energy commensurate to the capacity and environmental impact of these technologies.
Willingness to make sacrifices is crucial for engaging in proenvironmental behavior [52]. In terms of the political implications in addressing behavioral change, the nuanced positions of the willingness of citizens should be carefully considered for their political acceptability—as those who are fairly willing and very willing to make economic sacrifices consistently engage in both public behaviors and consumer behaviors for environmental reasons, while at the same time, among citizens who were in the neither–nor category, these behaviors were also significantly associated with a willingness to pay much higher prices and much higher taxes. Thus, acceptability for market-based instruments that involve price and tax instruments would be more strongly supported by the significance of the findings in terms of their respective forms of willingness, as compared to willingness to accept cuts in standard of living. This could entail the feasibility of default settings and other nonpecuniary forms of policy choice architectures among potential approaches to drive behavior change.
5.2. Limitations
Utilizing data from an international survey such as the ISSP for its analysis provides certain advantages, such as open access to the dataset for the public, coverage of many participating countries, and “within each country a diverse and representative sample of their population” [64]. However, it must still be acknowledged that survey data entails limitations. First, although the ISSP covered all five Nordic countries, the comparisons in the analysis were made with the other 31 countries included in the Environment III module dataset, and not all 193 countries of the world at the time. At present, understandably there is no international survey on the environment that has been fielded in all countries. In terms of country groupings, only 19 of the 26 EU member states were available at the time and that majority of the other countries included in the dataset are members of the OECD, with only a few developing countries covered [55]. Therefore, comparisons between the latter and the Nordic countries must be taken with due caution. Additionally, as the ISSP survey was conducted in 2010, it cannot capture possible changes in people’s attitudes in the past 10 years, where there have been rising concerns regarding climate change issues globally and fast technological progress made in renewable energy.
Second, as the analysis is based on cross-sectional data, it therefore includes the potential for endogeneity wherein the dependent variables (willingness to make economic sacrifices) and independent variables (proenvironmental attitudes, behaviors, sociodemographics) “simultaneously cause each other and have possible reciprocal causal effects” [8,34]. Thus, causal relationships among the study variables must be ”treated with caution for further generalizability beyond the findings of the current study” [38,57]. There is also the potential level of uncertainty that nonresponses to survey items may affect the representativeness of the sample data, as well as response rate of participation that may be affected by self-selection bias. Additional longitudinal and experimental studies are therefore necessary when data becomes available in order to better understand the causal mechanisms between the variables and constructs [8].
Third, survey data collected that contains self-reported items can be subject to social desirability bias or pure stated preferences, wherein individuals may underreport negative behavior or exaggerate socially desirable behaviors [38,55]. However, it has been noted that the effect of social desirability on self-reported proenvironmental behavior is weak [8,91]. Other potential items to consider are common method variance [57] and acquiescence bias; which is the tendency for people to agree with the statements in a survey and how it is written in the questionnaire regardless of their actual intended content [8,24].
Finally, although this study employed established measures and operationalization of ISSP and sustainability indices data based on the extant relevant literature, there is still room for improvement. For example, considerations when utilizing pre-existing datasets pertain to “limitations of covering a wide range of topics with a small number of variables” [64] or even single-item measurement scales [57]. At the same time, “there are limitations inherent in most aggregate measures, such as a lack of specificity and potential ambiguities in interpretation with aggregation and weighting over diverse dimensions” [55], along with particular attention that should be given towards improving reliability [8]. This is especially the case for the dependent variables pertaining to the willingness to make economic sacrifices for environmental protection, responses on how willing were respondents to pay “much higher prices” or “much higher taxes” may have potential variations in responses depending on their interpretation of a somewhat imprecise definition of “much higher”. [8,38]. The items measuring proenvironmental attitudes and behaviors in the next iterations ISSP could be better refined along with more specific economic valuation for various forms of willingness—and the findings of this current article can be used for the development of better measures and operationalization in future studies.
5.3. Further Research
This study demonstrated the distinctiveness of the three forms of willingness to make economic sacrifices and distributions within the Nordic countries, as well as the perspicuous nature of the three positions (unwilling, neither–nor, willing) for each form of willingness to make economic sacrifices and factors that predict these positions. The analysis indicated that in many respects the fairly willing and very willing respondents in the Nordic region were the most interesting group in terms of proenvironmental attitudes and behaviors. As a group they had the highest levels of environmental concern, efficacy, prioritization for the protecting the environment, and both consumer and public environmental behaviors. Further, even when compared with studies that did not use the ISSP, the results were found to be consistent with other country-specific research addressing willingness to pay and previous cross-national studies that utilized other datasets. For instance, the findings of this paper were highly consistent with a study in Sweden indicating willingness to pay for air ticket tax if respondents were women and had a left political view [92]. Similarly, a cross-national study on social trust that employed the World Values Survey 1990 and 1996 waves found that among 60 nations, the Nordic countries consistently had the highest levels of trust [93]—in line with the findings of this paper. Additionally, the variable measuring each respondent’s agreement with multilateral approaches (international agreements) towards environmental problems being a significant predictor of membership in the groups willing to pay much higher prices and pay much higher taxes, reveals a promising avenue to pursue in future studies on public acceptance of international environmental tax regimes.
It should be further taken into account that the findings of the present study indicate that the proportional number of those who are ‘neither nor’ in the Nordic countries are substantial—with results showing that these respondents possess proenvironmental attitudes similar to willing group, but engage in certain behaviors closer to the levels of the unwilling group. This therefore presents an impetus and opportunity for future studies to further investigate whether these are due to contextual factors such as the availability of environmental services, required infrastructures, policies, and institutions (i.e., recycling, organic food, ENGOs, etc.), and/or as resultant of individuals adhering to prevalent social norms in their respective countries.
Funding
This research received no external funding.
Institutional Review Board Statement
Not applicable.
Informed Consent Statement
Informed consent was obtained from all subjects involved in the study. Further information on the International Social Survey Program methodology can be found at http://www.issp.org/about-issp/methodology/.
Data Availability Statement
The data presented in this study are openly available in the GESIS Data Catalogue DBK at doi:10.4232/1.13271, with latest ISSP dataset version (13.06.2019): ZA5500 (v3.0.0).
Acknowledgments
The author is extremely grateful to Per Mickwitz and Luis Mundaca of the International Institute for Industrial Environmental Economics, Lund University for their invaluable insights and continuous support throughout the development of this article. The author would also like to thank Axel Franzen of the Institute of Sociology, University of Bern; George Marbuah of the Stockholm Environment Institute; Sverker Carlsson Jagers, Niklas Harring, and Dragana Davidovic of University of Gothenburg’s Centre for Collective Action Research and Centre of Environmental Political Studies—for sharing helpful advice on datasets and methodologies used in their studies which served as invaluable references for this article. I would also like to express gratitude to the managing editors and anonymous reviewers for their feedback.
Conflicts of Interest
The author declares no conflict of interest.
Appendix A

Table A1.
Country group coding.
| N | Country Grouping | |||
|---|---|---|---|---|
| Nordic Countries | EU, EFTA Countries (Sans Nordic) | Third Countries | ||
| Argentina | 1130 | X | X | ✓ |
| Australia | 1946 | X | X | ✓ |
| Austria | 1019 | X | ✓ | X |
| Belgium | 1142 | X | ✓ | X |
| Bulgaria | 1003 | X | ✓ | X |
| Canada | 985 | X | X | ✓ |
| Chile | 1436 | X | X | ✓ |
| Taiwan | 2209 | X | X | ✓ |
| Croatia | 1210 | X | X | ✓ |
| Czech Republic | 1428 | X | ✓ | X |
| Denmark | 1305 | ✓ | X | X |
| Finland | 1211 | ✓ | X | X |
| France | 2253 | X | ✓ | X |
| Germany | 1407 | X | ✓ | X |
| Iceland | 798 | ✓ | X | X |
| Israel | 1216 | X | X | ✓ |
| Japan | 1307 | X | X | ✓ |
| Korea (South) | 1576 | X | X | ✓ |
| Latvia | 1000 | X | ✓ | X |
| Lithuania | 1023 | X | ✓ | X |
| Mexico | 1637 | X | X | ✓ |
| Netherlands | 1472 | X | ✓ | X |
| New Zealand | 1172 | X | X | ✓ |
| Norway | 1382 | ✓ | X | X |
| Philippines | 1200 | X | X | ✓ |
| Portugal | 1022 | X | ✓ | X |
| Russia | 1619 | X | X | ✓ |
| Slovakia | 1159 | X | ✓ | X |
| Slovenia | 1082 | X | ✓ | X |
| South Africa | 3112 | X | X | ✓ |
| Spain | 2560 | X | ✓ | X |
| Sweden | 1181 | ✓ | X | X |
| Switzerland | 1212 | X | X | ✓ |
| Turkey | 1665 | X | X | ✓ |
| United Kingdom | 928 | X | ✓ | X |
| United States | 1430 | X | X | ✓ |
| Total | 50,437 | 5877 | 18,498 | 26,062 |
Table A2.
Correlations between the ISSP substantive variables, Environmental Concern, and international sustainability indices.
Table A2.
Correlations between the ISSP substantive variables, Environmental Concern, and international sustainability indices.
| Pay Much Higher Prices | Pay Much Higher Taxes | Accept Cuts in Standard of Living | Environmental Concern | Public Behaviours | Consumer Behaviours | International Agreements | Future Energy | Environmental Concern as Operationalized by Franzen & Vogl 2013 | 2018 EPI | SGI 2019 Policy Performance | SSI 2016 Environmental Wellbeing | ||
|---|---|---|---|---|---|---|---|---|---|---|---|---|---|
| Pay much higher prices | Correlation Coefficient | 1.000 | 0.905 ** | 0.736 ** | −0.389 * | −0.574 ** | −0.576 ** | 0.040 | −0.512 ** | −0.833 ** | −0.457 ** | −0.354 | 0.446 ** |
| N | 36 | 36 | 36 | 36 | 36 | 36 | 36 | 36 | 33 | 36 | 31 | 36 | |
| Pay much higher taxes | Correlation Coefficient | 0.905 ** | 1.000 | 0.701 ** | −0.255 | −0.448 ** | −0.404 * | −0.046 | −0.339 * | −0.720 ** | −0.243 | −0.187 | 0.386 * |
| N | 36 | 36 | 36 | 36 | 36 | 36 | 36 | 36 | 33 | 36 | 31 | 36 | |
| Accept cuts in standard of living | Correlation Coefficient | 0.736 ** | 0.701 ** | 1.000 | −0.250 | −0.605 ** | -0.625 ** | 0.257 | −0.537 ** | −0.783 ** | −0.483 ** | −0.475 ** | 0.187 |
| N | 36 | 36 | 36 | 36 | 36 | 36 | 36 | 36 | 33 | 36 | 31 | 36 | |
| Environmental concern | Correlation Coefficient | −0.389 * | −0.255 | −0.250 | 1.000 | 0.135 | 0.443 ** | −0.043 | 0.291 | 0.374 * | 0.045 | −0.026 | −0.177 |
| N | 36 | 36 | 36 | 36 | 36 | 36 | 36 | 36 | 33 | 36 | 31 | 36 | |
| Public Behaviours | Correlation Coefficient | −0.574 ** | −0.448 ** | −0.605 ** | 0.135 | 1.000 | 0.639 ** | 0.038 | 0.373 * | 0.644 ** | 0.724 ** | 0.619 ** | −0.214 |
| N | 36 | 36 | 36 | 36 | 36 | 36 | 36 | 36 | 33 | 36 | 31 | 36 | |
| Consumer behaviours | Correlation Coefficient | −0.576 ** | −0.404 * | −0.625 ** | 0.443 ** | 0.639 ** | 1.000 | −0.343 * | 0.517 ** | 0.723 ** | 0.582 ** | 0.458 ** | −0.171 |
| N | 36 | 36 | 36 | 36 | 36 | 36 | 36 | 36 | 33 | 36 | 31 | 36 | |
| International agreements | Correlation Coefficient | 0.040 | −0.046 | 0.257 | −0.043 | 0.038 | −0.343 * | 1.000 | −0.196 | −0.289 | −0.246 | −0.169 | −0.082 |
| N | 36 | 36 | 36 | 36 | 36 | 36 | 36 | 36 | 33 | 36 | 31 | 36 | |
| Future energy | Correlation Coefficient | −0.512 ** | −0.339 * | −0.537 ** | 0.291 | 0.373 * | 0.517 ** | −0.196 | 1.000 | 0.696 ** | 0.531 ** | 0.395 * | 0.033 |
| N | 36 | 36 | 36 | 36 | 36 | 36 | 36 | 36 | 33 | 36 | 31 | 36 | |
| Environmental concern as operationalized by Franzen & Vogl 2013 | Correlation Coefficient | −0.833 ** | −0.720 ** | −0.783 ** | 0.374 * | 0.644 ** | 0.723 ** | −0.289 | 0.696 ** | 1.000 | 0.657 ** | 0.589 ** | −0.326 |
| N | 33 | 33 | 33 | 33 | 33 | 33 | 33 | 33 | 33 | 33 | 28 | 33 | |
| 2018 EPI | Correlation Coefficient | −0.457 ** | −0.243 | −0.483 ** | 0.045 | 0.724 ** | 0.582 ** | −0.246 | 0.531 ** | 0.657 ** | 1.000 | 0.748** | −0.081 |
| N | 36 | 36 | 36 | 36 | 36 | 36 | 36 | 36 | 33 | 36 | 31 | 36 | |
| SGI 2019 Policy Performance | Correlation Coefficient | −0.354 | −0.187 | −0.475 ** | −0.026 | 0.619 ** | 0.458 ** | −0.169 | 0.395 * | 0.589 ** | 0.748 ** | 1.000 | −0.112 |
| N | 31 | 31 | 31 | 31 | 31 | 31 | 31 | 31 | 28 | 31 | 31 | 31 | |
| SSI 2016 Environmental Wellbeing | Correlation Coefficient | 0.446 ** | 0.386 * | 0.187 | −0.177 | −0.214 | −0.171 | −0.082 | 0.033 | −0.326 | −0.081 | −0.112 | 1.000 |
| N | 36 | 36 | 36 | 36 | 36 | 36 | 36 | 36 | 33 | 36 | 31 | 36 | |
** Correlation is significant at the 0.01 level (2-tailed), * Correlation is significant at the 0.05 level (2-tailed). Sources: ISSP, EPI, SGI, SSI. Adapted from Franzen and Vogl (2013), Vainio and Paloniemi (2014), Peuckert (2011).
Appendix B. Further Information on Variables
Environmental concern in the literature is usually defined as a ‘general value orientation toward the environment suggested to be an important driver of individual proenvironmental behavior’ [8] which translates into higher willingness to contribute for the environment [43]. In this study, this survey item for environmental concern is found in International Social Survey Program (ISSP) 2010 Environment III module [49] measured by the question “Generally speaking, how concerned are you about environmental issues?”, with a respondent’s answer within a 5-point Likert scale ranging from “not at all concerned” to “very concerned” (Details in Methodology section). Other studies had operationalized this item as a dependent variable [40,64] for environmental concern, as well as a predictor for willingness to contribute for environmental protection [43] and proenvironmental Behaviors and Activism [56]. Davidovic et al. [30] defined this as a “proenvironmental value orientation that affect people’s general environmental concerns and acceptance of environmental policies” [30] and also moreover notes that this measure is distinct from a variables such as willingness to pay taxes, as “concern does not automatically translate into willingness to take action or pay for environmental protection” [30]. Interestingly as well, a study using a similar variable found that “concern about the environment together with behaviors to preserve the environment was relevant for Subjective Well-being” [94].
Among substantive variables of the ISSP that were categorized as ‘Environmental Policy and Locus of Control and Positive Trade-Off of Environmentalism’ in the 2000 and 2010 modules, previous research utilized a survey item (International agreements) that considers public opinion about international efforts in order to explain differences in national climate change policies [29,61]. This particular item is found in ISSP 2010 measured by the question “For environmental problems, there should be international agreements that [COUNTRY] and other countries should be made to follow”, with a respondent’s answer within a 5-point Likert scale ranging from “agree strongly” to “disagree strongly”. The variable is operationalized in previous studies [29,58,59] pertain to multilateralism, and treated as a measure of the ‘global aspect of climate change, affinity for the global community, and expected to be positively related to an individual’s degree of concern about climate change [61]. Further, responses to this variable is of relevance to the “Green Governmentalism” climate change discourse indicating the individuals’ disposition toward committing their countries to international environmental agreements, compatible with notions of global governance and preference toward multilateral international approach and commitment in dealing with common global problems such as climate change [29,59]. Governments have a central role in the green governmental paradigm, “adopting science and technology push-policies to fund formal R&D and pull-policies to generate demands for climate technologies by traditional regulatory measures” [95]. Inclusion of this measure thus allows for explanation on “public opinion towards making international agreements such as the Kyoto Protocol in order to regulate environmental problems, and persuading their citizens that bind their countries in environmental measures that are costly to them” [29].
When it comes to low-carbon energy technologies, a categorical variable in the ISSP 2010 survey is utilized to indicate preference (Future energy) towards technologies in the form of Solar, Wind, and Hydro alternative forms of energy. Operationalization is done similarly to that of Tranter [73] in order to contrast against other energy options for the item “To which of the following should [COUNTRY] give priority in order to meet its future energy needs?” (Solar, wind or water power = 1; other issues = 0)”. Furthermore, “acceptance of energy technologies has often been measured in terms of public attitudes towards them and questioned in terms of willingness to pay for a higher share of renewables” [96].
Substantive survey variables recurring in the ISSP 1993, 2000, and 2010 environment modules that pertain to environmental attitudes, behaviors, and sociodemographic indicators are included in the analyses of this present study [8,30,49,50,56,57,67]. Coding and operationalization were adapted from established research that focuses on willingness to make sacrifices, environmental concern, and behaviors. For example:
- Trust in people (Social trust) and Trust in government (Institutional trust) is measured by two variables with a 5-point Likert type option for respondent’s sentiments pertaining to the statements “Generally speaking, would you say that most people can be trusted, or that you can’t be too careful in dealing with people” and “Most of the time we can trust people in government to do what is right” [38,41,49].
- Substantive ISSP variables that relates to environmental efficacy and skepticism had been incorporated for the analyses are measured with the agreement of respondents’ via a 5-point Likert type scale to statements such as: “It is just too difficult for someone like me to do much about the environment” (Perceived activity arena). Another statement is “I do what is right for the environment, even when it costs more money or takes more time” (Environmental efficacy)—which could be considered as an altruistic perspective (Reyes 2016, p.1597) and was also described as a “behavioral disposition to act in a value-rational manner” [33]. A variable (Importance of environmental protection) that could also be potentially linked with the concept of the pool of finite worries within the survey questions asks respondents whether there are “more important things to do than protect the environment” (Butkevičienė, 2017; Tam and Chan, 2018).
- For the item on Perceived dangers from environmental issues, A mean score is derived to measure dangers perceived by respondents from specific environmental problems such as “air pollution caused by cars”, “air pollution caused by industry”, “pesticides and chemicals used in farming“, “pollution of COUNTRY’S rivers, lakes and streams” and “the rise in the world temperature caused by climate change [64].
In this present study, Public behaviors were defined as being under public categorization [56,63] as per previous research, and operationalized with a scale which is the sum score (ranging 0 to 4) from four yes or no items in the ISSP the asks whether the respondent: is a ‘member of any group whose main aim is to preserve or protect the environment’; has ‘signed a petition about an environmental issue’; ‘given money to an environmental group’, or ‘taken part in a protest or demonstration about an environmental issue’ [49,64].
The Consumer behaviors Index (ranging 0 to 18) is comprised of six questions on how often respondents made special effort to: ‘Sort glass or tins or plastic or newspapers and so on for recycling’; Buy fruit and vegetables grown without pesticides or chemicals; ‘Cut back on driving a car for environmental reasons’; ‘Reduce the energy or fuel they use at home’; ‘Choose to save or reuse water’; And, ‘avoid buying certain products for environmental reasons’ [29,49].
As environmental quality and ‘how close countries are to their established environmental policy goals’ may impact people’s demand for such policies [30](Davidovic et al. 2020 p. 684)—in order to supplement the analysis and offer further context in the discussion, this study includes data from sustainability and environmental performance indices similar to previous research that utilized ISSP data [40,55,57,77]. Although such indices have varying objectives and measures, along with their limitations that several studies have addressed [11,14], these indices still offer some insights as to the current state of the environment and progress made by countries. This paper refers to the scores from the ‘Environmental Performance Index’ (EPI) produced by the Yale Center for Environmental Law and Policy which ranks 180 countries on environmental health and ecosystem vitality aspects [16].
Also utilized are the “Policy Performance” scores from the Sustainable Governance Indicators for EU and OECD countries [15] as well as the “Environmental Wellbeing” score from the Sustainable Society Index [17]. For comparison, the country scores are also correlated to the mean environmental concern from the ISSP as it is reported in Franzen and Vogl [9].
Appendix C. Additional Descriptives, Analyses of Differences and Similarities of Nordic Countries to Others
This section contains supplemental analyses that was performed addressing how different the Nordics are to other countries (such as Western European countries, European Union member countries, third countries) in terms of the willingness to make economic sacrifices and related environmental attitudes and behaviors for the sake of environmental protection. It also presents information on how similar the Nordic countries are to each other, as well as if there is a country, or some countries that stand out from the group.
Overall, as described in Table A2, individual Nordic Country Mean responses and Nordic Country Pooled Mean exhibit higher levels in most substantive survey items dealing with willingness to make economic sacrifices, proenvironmental attitudes, behaviors and preferences—as compared to other Western European countries (7 of 16 items), other EU member states (12 of 16 items), and third Countries (all 16 items).
Among the Nordic countries, Denmark often had the highest levels of proenvironmental responses, consistently with markedly higher willingness, as well as public and consumer behaviors. Whereas, Iceland tended to have more divergent response means with lower proenvironmental levels as compared to other Nordic countries.
When considering the raw scores (5 point scale of 1 = Very willing to 5 = Very unwilling) for the three dependent variables pertaining willingness to make economic sacrifices for the environment: For paying much higher prices and accepting cuts in the standard of living—the Nordic pooled sample had little difference as that of other Western European countries based on Mann–Whitney U Test with distribution of responses the same across categories (p = 0.098, p = 0.812). The Nordic scores where however better, having significantly different distributions than those of the other EU member states combined (p < 0.000) and of third Countries (p < 0.000). Nordic countries as a whole were consistently much better in their willingness to pay much higher taxes for environmental protection as compared to other Western European countries, EU member states, and third countries with Mann–Whitney U Tests indicating statistically significant difference (p < 0.000).
Interestingly however, only the respondents from Denmark were more willing in terms of paying much higher taxes, whereas Finland, Iceland, Norway, and Sweden had lower willingness as compared to the other 31 countries. Results indicated that for all three types of willingness, there was statistically significant difference (Mann–Whitney 2-tailed, p < 0.001) between the underlying distributions of responses of the Nordic countries group and the responses of the group comprised of the other 31 countries in the ISSP 2010 survey.
Looking at notable proenvironmental attitudes among the results, for the variable pertaining to general ‘concern about environmental issues’, surprisingly the Nordic average with people in Denmark, Iceland, Norway and Sweden expressed less concern as compared to other Western European countries, EU states, and third countries. The exception is Finland actually showing higher concern as compared to other Nordic countries even compared to other country groupings. Similarly for the item on ‘doing what is right for the environment even when it costs the respondent more money or takes more time’, the Nordic countries average is not as significantly good as those of other country groupings, with Denmark only slightly doing better as compared to third countries.
In terms of proenvironmental public behaviors such as signing petitions, donating money, and joining public protest for environmental reasons and joining environmental groups—Nordic countries average was not as high as those of Western European countries, but still more than the average of the EU states and third countries. Notably, Switzerland, New Zealand, the Netherlands, Australia, and Canada had the highest levels of environmental citizenship among 36 countries.
For proenvironmental private consumer/household behaviors, the Nordic countries average was lower than the pooled average of other Western Countries and EU states, but still higher than third countries. Individually Denmark and Finland had high levels of proenvironmental consumption behaviors, but not as high as those of France, Switzerland, Germany, and Austria. As mentioned prior, wordings of the questions in respect of their translations should be still be considered, i.e., for consumer behaviors—terms such as ‘special effort’ (i.e., Iceland), ‘try’ (i.e., Sweden) or “take time to” (i.e., Denmark, Norway) may bring different connotations to the respondents’ understanding of how often they engaged in such private behaviors.
Additionally, for the item pertaining to ‘Perceived activity arena’ [33] measured by the statement ‘it is just too difficult for someone like me to do much about the environment’, the Nordic countries average and each individual country have demonstrably higher locus of control as compared to other Western European countries, the EU, and third countries. For the survey item measuring agreement towards the statement that ‘modern science will solve our environmental problems with little change to our way of life’, although the Nordic average is found to be not as optimistic towards the role of modern science as that of EU and third countries averages, results from Nonparametric tests indicate that distribution of responses are the same across categories when compared to other Western European countries.
Overall, the Nordic countries had more social trust in general for people, and institutional trust in government (except for Iceland) as compared to other Western countries, EU, and third countries. Further, as also observed in other studies, findings revealed that Nordic countries had higher levels of postmaterialism as compared to other Western countries, EU, and third countries—with Denmark having the highest level of postmaterialism and with the marked exception of Iceland notably being more materialist as compared to all other country groupings.
As for people’s attitude towards multilateralism, global governance or international cooperation represented by agreement to the statement “For environmental problems, there should be international agreements that [COUNTRY] and other countries should be made to follow’, the Nordic countries’ average agreement is lower than Western European countries and the EU states, but higher as compared to Third countries. For the preference of respondents to give priority to Solar, Wind, Water as priority in order for their country ‘to meet its future energy needs’” the Nordic countries’ average was almost same as Western Europe, but more than that of EU states and third Countries.
Table A3.
Mean values of the substantive ISSP survey items by country.
| Dependent Variables | Independent Variables | ||||||||||||||||
|---|---|---|---|---|---|---|---|---|---|---|---|---|---|---|---|---|---|
| Pay Much Higher Prices | Pay Much Higher Taxes | Accept Cuts in Standard of Living | Environmental Concern | Social Trust | Institutional Trust | Perceived Activity Arena | Environmental Efficacy | Importance of Environmental Protection | Modern Science | International Agreements | Future Energy (Solar, Wind, Water) | Postmaterialism | Public Behaviours | Perceived Dangers | Consumer Behaviours | ||
| % No | % Yes | ||||||||||||||||
| Denmark | 2.76 | 3.05 | 2.88 | 3.37 | 3.65 | 2.96 | 3.44 | 2.66 | 3.57 | 3.02 | 1.61 | 16.1 | 83.9 | 1.04 | 0.49 | 3.62 | 8.71 |
| Finland | 3.31 | 3.58 | 3.00 | 3.72 | 3.15 | 3.27 | 3.63 | 2.74 | 3.12 | 3.76 | 1.80 | 33.8 | 66.2 | 1.01 | 0.47 | 3.51 | 8.40 |
| Iceland | 3.29 | 3.67 | 3.39 | 3.41 | 3.54 | 3.51 | 3.69 | 2.71 | 3.08 | 3.33 | 2.25 | 14.6 | 85.4 | 0.62 | 0.45 | 3.44 | 6.58 |
| Norway | 3.04 | 3.51 | 3.01 | 3.43 | 3.75 | 2.88 | 3.55 | 2.81 | 3.43 | 3.14 | 1.88 | 15.5 | 84.5 | 0.86 | 0.46 | 3.32 | 7.07 |
| Sweden | 3.21 | 3.46 | 2.93 | 3.37 | 3.54 | 2.88 | 3.48 | 2.78 | 3.58 | 3.85 | 1.77 | 29.6 | 70.4 | 0.96 | 0.50 | 3.64 | 7.66 |
| Nordic countries | 3.10 | 3.44 | 3.01 | 3.46 | 3.53 | 3.06 | 3.55 | 2.74 | 3.38 | 3.41 | 1.83 | 22.0 | 78.0 | 0.92 | 0.48 | 3.51 | 7.76 |
| Western European countries (sans Nordic countries) | 3.08 | 3.53 | 3.04 | 3.69 | 2.90 | 3.28 | 3.32 | 2.59 | 3.41 | 3.40 | 1.71 | 21.8 | 78.2 | 0.88 | 0.56 | 3.65 | 9.45 |
| EU Countries (sans Nordic countries) | 3.39 | 3.71 | 3.38 | 3.61 | 2.61 | 3.55 | 3.12 | 2.70 | 3.09 | 3.29 | 1.72 | 28.7 | 71.3 | 0.80 | 0.37 | 3.80 | 7.90 |
| Third Countries | 3.24 | 3.51 | 3.31 | 3.67 | 2.55 | 3.29 | 3.08 | 2.67 | 2.98 | 3.05 | 1.92 | 35.4 | 64.6 | 0.75 | 0.30 | 3.95 | 6.87 |
| All (36) Country Samples | 3.26 | 3.57 | 3.28 | 3.63 | 2.70 | 3.34 | 3.16 | 2.68 | 3.08 | 3.20 | 1.83 | 30.7 | 69.3 | 0.79 | 0.36 | 3.84 | 7.42 |
References
- Sovacool, B.K. Contestation, contingency, and justice in the Nordic low-carbon energy transition. Energy Policy 2017, 102, 569–582. [Google Scholar] [CrossRef]
- European Commission. Nordic countries demonstrate the potential of low-carbon energy policies. Sci. Environ. Policy 2017, 2. [Google Scholar]
- Bird, T. Nordic Action on Climate Change; Nordic Council of Ministers: Copenhagen, Denmark, 2017; ISBN 9789289351829.
- Tunkrova, L. The Nordic Countries’ “Exceptionalism” in EU Environmental Policy. Contemp. Eur. Stud. 2008, 2, 21–46. [Google Scholar]
- Welsch, H.; Kühling, J. Pan-European patterns of environmental concern: The role of proximity and international integration. J. Environ. Stud. Sci. 2017, 7, 473–489. [Google Scholar] [CrossRef]
- Sääksjärvi, S.C. Positioning the Nordic Countries in European Union Environmental Policy. J. Environ. Dev. 2020, 29, 393–419. [Google Scholar] [CrossRef]
- Greaker, M.; Golombek, R.; Hoel, M. Global impact of national climate policy in the Nordic countries. Clim. Policies 2019, 157. [Google Scholar] [CrossRef]
- Vainio, A.; Paloniemi, R. The complex role of attitudes toward science in pro-environmental consumption in the Nordic countries. Ecol. Econ. 2014, 108, 18–27. [Google Scholar] [CrossRef]
- Franzen, A.; Vogl, D. Two decades of measuring environmental attitudes: A comparative analysis of 33 countries. Glob. Environ. Chang. 2013, 23, 1001–1008. [Google Scholar] [CrossRef]
- Andersson, D.; Nässén, J.; Larsson, J.; Holmberg, J. Greenhouse gas emissions and subjective well-being: An analysis of Swedish households. Ecol. Econ. 2014, 102, 75–82. [Google Scholar] [CrossRef] [Green Version]
- Marti, L.; Puertas, R. Assessment of sustainability using a synthetic index. Environ. Impact Assess. Rev. 2020, 84, 106375. [Google Scholar] [CrossRef]
- Naylor, M. How the Nordics are Standing up to Climate Change. Available online: https://stptrans.com/how-nordics-are-standing-up-to-climate-change/ (accessed on 17 November 2020).
- Bertelsmann Foundation Sustainable Governance Indicators. 2016 Global Environmental Protection Report Global Environmental Policy. Global Environmental Policy; Bertelsmann Stiftung: Gütersloh, Germany, 2016. [Google Scholar]
- Mayerl, J. Environmental Concern in Cross-National Comparison—Methodological Threats and Measurement Equivalence. In Green European: Environmental Behaviour and Attitudes in Europe in a Historical and Cross-Cultural Comparative Perspective; Telesiene, A., Gross, M., Eds.; Routledge: New York, NY, USA; Taylor & Francis: New York, NY, USA, 2017; ISBN 978-1138123953. [Google Scholar]
- Bertelsmann Foundation. Policy Performance and Governance Capacities in the OECD and EU. Sustainable Governance Indicators 2016; Bertelsmann Stiftung: Gütersloh, Germany, 2016. [Google Scholar]
- Hsu, A.; Esty, D.; Levy, M.; de Sherbinin, A.; Al, E. The 2016 Environmental Performance Index Report; Yale Center for Environmental Law and Policy: New Haven, CT, USA, 2016. [Google Scholar]
- Sustainable Society Foundation Sustainable Society Index; Sustainable Society Foundation: The Hague, The Netherlands, 2016.
- de las Heras-Rosas, C.J.; Herrera, J. Towards Sustainable Mobility through a Change in Values. Evidence in 12 European Countries. Sustainability 2019, 11, 4274. [Google Scholar] [CrossRef] [Green Version]
- Christiansen, P.M.; Lundqvist, L.J. Conclusions: A Nordic environmental policy model? In Governing the Environment: Politics, Policy and Organization in the Nordic Countries; Nord: Copenhagen, Denmark, 1996; Volume 5, pp. 339–363. ISBN 9291208191. [Google Scholar]
- Olofsson, A.; Öhman, S. General beliefs and environmental concern: Transatlantic comparisons. Environ. Behav. 2006, 38, 768–790. [Google Scholar] [CrossRef] [Green Version]
- Inglehart, R. Public Support for Environmental Protection: Objective Problems and Subjective Values in 43 Societies. PS Polit. Sci. Polit. 1995, 28, 57. [Google Scholar] [CrossRef]
- Telešiene, A.; Balžekiene, A. The influence of biographical situational factors upon environmental activist behaviour: Empirical evidence from CEE countries. Soc. Stud. Stud. 2015, 12, 159–178. [Google Scholar] [CrossRef] [Green Version]
- Willy, C.J. Among Wealthy Nations, Nordic Countries are Leading the Pack on Sustainable Development. Available online: https://blogs.worldbank.org/governance/among-wealthy-nations-nordic-countries-are-leading-pack-sustainable-development (accessed on 14 October 2020).
- Franzen, A.; Vogl, D. Acquiescence and the willingness to pay for environmental protection: A comparison of the ISSP, WVS, and EVS. Soc. Sci. Q. 2013, 94, 637–659. [Google Scholar] [CrossRef]
- Sonnenschein, J.; Mundaca, L. Is one carbon price enough? Assessing the effects of payment vehicle choice on willingness to pay in Sweden. Energy Res. Soc. Sci. 2019, 52, 30–40. [Google Scholar] [CrossRef]
- Lienhoop, N.; MacMillan, D. Valuing wilderness in Iceland: Estimation of WTA and WTP using the market stall approach to contingent valuation. Land Use Policy 2007, 24, 289–295. [Google Scholar] [CrossRef]
- Grimsrud, K.M.; Lindhjem, H.; Sem, I.V.; Rosendahl, K.E. Public acceptance and willingness to pay cost-effective taxes on red meat and city traffic in Norway. J. Environ. Econ. Policy 2020, 9, 251–268. [Google Scholar] [CrossRef]
- Christensen, T.; Pedersen, A.B.; Nielsen, H.O.; Mørkbak, M.R.; Hasler, B.; Denver, S. Determinants of farmers’ willingness to participate in subsidy schemes for pesticide-free buffer zones—A choice experiment study. Ecol. Econ. 2011, 70, 1558–1564. [Google Scholar] [CrossRef] [Green Version]
- Çarkoğlu, A.; Kentmen-Çin, Ç. Economic development, environmental justice, and pro-environmental behavior. Environ. Polit. 2015, 24, 575–597. [Google Scholar] [CrossRef]
- Davidovic, D.; Harring, N.; Jagers, S.C. The contingent effects of environmental concern and ideology: Institutional context and people’s willingness to pay environmental taxes. Environ. Polit. 2020, 29, 674–696. [Google Scholar] [CrossRef] [Green Version]
- Ivanova, G.; Tranter, B. Paying for Environmental Protection in a Cross-national Perspective. Aust. J. Polit. Sci. 2008, 43, 169–188. [Google Scholar] [CrossRef]
- Fairbrother, M. Trust and Public Support for Environmental Protection in Diverse National Contexts. Sociol. Sci. 2016, 3, 359–382. [Google Scholar] [CrossRef] [Green Version]
- Engel, U.; Pötschke, M. Willingness to pay for the environment: Social structure, value orientations and environmental behaviour in a multilevel perspective. Innov. Eur. J. Soc. Sci. Res. 1998, 11, 315–332. [Google Scholar] [CrossRef]
- Schumacher, I. How Beliefs Influence the Willingness to Contribute to Prevention Expenditure. Am. J. Agric. Econ. 2015, 97, 1417–1432. [Google Scholar] [CrossRef]
- Johnson, E.; Nemet, G.F. Willingness to Pay for Climate Policy: A Review of Estimates; La Follette School of Public Affairs, University of Wisconsin: Madison, WI, USA, 2010. [Google Scholar]
- Diederich, J.; Goeschl, T. Willingness to Pay for Voluntary Climate Action and Its Determinants: Field-Experimental Evidence. Environ. Resour. Econ. 2014, 57, 405–429. [Google Scholar] [CrossRef]
- Ryan, A.M.; Spash, C.L. Is WTP an attitudinal measure? Empirical analysis of the psychological explanation for contingent values. J. Econ. Psychol. 2011, 32, 674–687. [Google Scholar] [CrossRef] [Green Version]
- Jin, M.H.; Shriar, A.J. Linking Environmental Citizenship and Civic Engagement to Public Trust and Environmental Sacrifice in the Asian Context. Environ. Policy Gov. 2013, 23, 259–273. [Google Scholar] [CrossRef]
- Hao, F.; Song, L. Environmental Concern in China: A Multilevel Analysis. Chin. Sociol. Rev. 2020, 52, 1–26. [Google Scholar] [CrossRef]
- Domazet, M.; Marinović Jerolimov, D. Sustainability Perspectives from the European Semi-Periphery; Domazet, M., Marinović Jerolimov, D., Eds.; Institute for Social Research: Zagreb, Croatia, 2014; ISBN 9536218585. [Google Scholar]
- Harring, N. Understanding the Effects of Corruption and Political Trust on Willingness to Make Economic Sacrifices for Environmental Protection in a Cross-National Perspective. Soc. Sci. Q. 2013, 94, 660–671. [Google Scholar] [CrossRef] [Green Version]
- Kemmelmeier, M.; Król, G.; Kim, Y.H. Values, Economics, and Proenvironmental Attitudes in 22 Societies. Cross-Cult. Res. 2002, 36, 256–285. [Google Scholar] [CrossRef]
- Marbuah, G. Is willingness to contribute for environmental protection in Sweden affected by social capital? Environ. Econ. Policy Stud. 2019, 21, 451–475. [Google Scholar] [CrossRef] [Green Version]
- Pädam, S.; Bali Swain, R. Attitudes Towards Paying for Environmental Protection in the Baltic Sea Region. In Environmental Challenges in the Baltic Region; Springer International Publishing: Cham, Germany, 2017; pp. 201–220. [Google Scholar]
- Cho, B.; Moon, M.J. The determinants of citizens’ preference of policy instruments for environmental policy: Do social trust, government capacity, and state-society relations matter? Int. Rev. Public Adm. 2019, 24, 205–224. [Google Scholar] [CrossRef]
- Harring, N.; Jagers, S. Should We Trust in Values? Explaining Public Support for Pro-Environmental Taxes. Sustainability 2013, 5, 210–227. [Google Scholar] [CrossRef] [Green Version]
- Davidovic, D. Trust, Values and Quality of Government. Exploring Interactions Between Individual and Contextual Level Determinants of Environmental Tax Support; QOG Working Paper Series; The Quality of Government Institute: Gothenburg, Sweden, 2018.
- Harring, N. Reward or Punish? Understanding Preferences toward Economic or Regulatory Instruments in a Cross-National Perspective. Polit. Stud. 2016, 64, 573–592. [Google Scholar] [CrossRef]
- ISSP Research Group. International Social Survey Programme: Environment III—ISSP 2010. GESIS Data Archive, Cologne. ZA5500 Data File Version 3.0.0. 2019. Available online: https://dbk.gesis.org/dbksearch/sdesc2.asp?no=5500&db=e&doi=10.4232/1.13271 (accessed on 17 November 2020).
- Franzen, A.; Meyer, R. Environmental Attitudes in Cross-National Perspective: A Multilevel Analysis of the ISSP 1993 and 2000. Eur. Sociol. Rev. 2010, 26, 219–234. [Google Scholar] [CrossRef]
- Reyes, J.A.L. Cross-section analyses of attitudes towards science and nature from the International Social Survey Programme 1993, 2000, and 2010 surveys. Public Underst. Sci. 2015, 24, 338–357. [Google Scholar] [CrossRef]
- Hadler, M.; Haller, M. Global activism and nationally driven recycling: The influence of world society and national contexts on public and private environmental behavior. Int. Sociol. 2011, 26, 315–345. [Google Scholar] [CrossRef]
- Doyle, J. Institutionalized collective action and the relationship between beliefs about environmental problems and environmental actions: A cross-national analysis. Soc. Sci. Res. 2018, 75, 32–43. [Google Scholar] [CrossRef]
- Valarino, I.; Duvander, A.-Z.; Haas, L.; Neyer, G. Exploring Leave Policy Preferences: A Comparison of Austria, Sweden, Switzerland, and the United States. Soc. Polit. Int. Stud. Gender State Soc. 2018, 25, 118–147. [Google Scholar] [CrossRef] [Green Version]
- Chapman, J.; Parvazian, S.; Skinner, N. How do Australians rate as environmental citizens? An international comparative analysis of environmental concern and action. Australas. J. Environ. Manag. 2017, 24, 117–132. [Google Scholar] [CrossRef]
- Butkevičienė, E. Pro-environmental Behaviours and Activism in a Comparative European Perspective. Filos. Sociol. 2017, 119–127. [Google Scholar]
- Jin, M.H.; Shriar, A.J. Exploring the Relationship Between Social Capital and Individuals’ Policy Preferences for Environmental Protection: A Multinomial Logistic Regression Analysis. J. Environ. Policy Plan. 2013, 15, 427–446. [Google Scholar] [CrossRef]
- Motherway, B.; Kelly, M.; Faughnan, P.; Tovey, H. Trends in Irish Environmental Attitudes Between 1993 and 2002; University College Dublin: Dublin, Ireland, 2003. [Google Scholar]
- Reyes, J.A.L. Exploring relationships of environmental attitudes, behaviors, and sociodemographic indicators to aspects of discourses: Analyses of International Social Survey Programme data in the Philippines. Environ. Dev. Sustain. 2016, 18, 1575–1599. [Google Scholar] [CrossRef]
- Struwig, J. South Africans’ attitudes towards the environment. In South African Social Attitudes: 2nd Report: Reflections on the Age of Hope; Roberts, B., wa Kivilu, M., Davids, Y.D., Eds.; South African Social Attitudes Survey (SASAS); HSRC Press: Cape Town, South Africa, 2010; pp. 198–219. [Google Scholar]
- Tjernström, E.; Tietenberg, T. Do differences in attitudes explain differences in national climate change policies? Ecol. Econ. 2008, 65, 315–324. [Google Scholar] [CrossRef]
- Ivanova, G.; Tranter, B. Willingness to pay for ‘the Environment’ in cross-national perspective. In Proceedings of the Australasian Political Studies Association Conference, Adelaide, Australia, 29 September–1 October 2004; pp. 1–27. [Google Scholar]
- Pisano, I.; Lubell, M. Environmental Behavior in Cross-National Perspective. Environ. Behav. 2017, 49, 31–58. [Google Scholar] [CrossRef]
- Tam, K.-P.; Chan, H.-W. Generalized trust narrows the gap between environmental concern and pro-environmental behavior: Multilevel evidence. Glob. Environ. Chang. 2018, 48, 182–194. [Google Scholar] [CrossRef]
- Pielke, R., Jr. The Climate Fix: What Scientists and Politicians Won’t Tell You about Global Warming; Basic Books: New York, NY, USA, 2010; ISBN 0465022685. [Google Scholar]
- von Crettaz Roten, F.; Clémence, A.; Thevenet, A. Understanding Attitudes Toward Nuclear Energy After the Fukushima Accident: Differences Between Asserted and Ambivalent Positions*. Soc. Sci. Q. 2017, 98, 659–671. [Google Scholar] [CrossRef]
- Tabachnick, B.G.; Fidell, L.S. Using Multivariate Statistics; Allyn & Bacon: Boston, MA, USA, 2006. [Google Scholar]
- Field, A. Discovering Statistics Using SPSS; Sage Publications: London, UK, 2009. [Google Scholar]
- Anderson, C.J.; Rutkowski, L. Multinomial Logistic Regression. In Best Practices in Quantitative Methods; SAGE Publications, Inc.: Thousand Oaks, CA, USA, 2008; pp. 390–409. ISBN 9781412940658. [Google Scholar]
- Ambo, T.B.; Ma, J.; Fu, C. Investigating influence factors of traffic violation using multinomial logit method. Int. J. Inj. Contr. Saf. Promot. 2020, 1–8. [Google Scholar] [CrossRef]
- Dorsch, M. The Willingness to Pay for Environmental Protection: Are Developing Economies Different? In Proceedings of the German Development Economics Conference; BW—Deutsche Zentralbibliothek fürWirtschaftswissenschaften, Leibniz-Informationszentrum Wirtschaft, Kiel und Hamburg: Hamburg, Alemanha, 2011. [Google Scholar]
- Kollmann, A.; Reichl, J. How Trust in Governments Influences the Acceptance of Environmental Taxes. In Political Economy and Instruments of Environmental Politics; Schneider, F., Kollmann, A., Reichl, J., Eds.; The MIT Press: Cambridge, MA, USA, 2015; pp. 53–70. [Google Scholar]
- Tranter, B. The Great Divide: Political Candidate and Voter Polarisation over Global Warming in Australia. Aust. J. Polit. Hist. 2013, 59, 397–413. [Google Scholar] [CrossRef]
- Robinson, J.P.; Shaver, P.R.; Wrightsman, L.S. Criteria for scale selection and evaluation. Meas. Personal. Soc. Psychol. Attitudes 1991, 1, 1–16. [Google Scholar]
- Zellner, A. An Efficient Method of Estimating Seemingly Unrelated Regressions and Tests for Aggregation Bias. J. Am. Stat. Assoc. 1962, 57, 348–368. [Google Scholar] [CrossRef]
- Dirzyte, A.; Rakauskiene, O.G. Green consumption: The gap between attitudes and behaviours. Transform. Bus. Econ. 2016, 15, 523–538. [Google Scholar]
- Sussman, A.B.; Olivola, C.Y. Axe the Tax: Taxes are Disliked More than Equivalent Costs. J. Mark. Res. 2011, 48, S91–S101. [Google Scholar] [CrossRef]
- Liu, M.; Huang, Y.; Hiscock, R.; Li, Q.; Bi, J.; Kinney, P.; Sabel, C. Do Climate Change Policies Promote or Conflict with Subjective Wellbeing: A Case Study of Suzhou, China. Int. J. Environ. Res. Public Health 2016, 13, 344. [Google Scholar] [CrossRef] [PubMed]
- Kallbekken, S.; Kroll, S.; Cherry, T.L. Do you not like Pigou, or do you not understand him? Tax aversion and revenue recycling in the lab. J. Environ. Econ. Manag. 2011, 62, 53–64. [Google Scholar] [CrossRef] [Green Version]
- Smyth, G.K. Pearson’s goodness of fit statistic as a score test statistic. In Statistics and Science: A Festschrift for Terry Speed; Goldstein, D.R., Ed.; Institute of Mathematical Statistics: Beachwood, NJ, USA, 2003; pp. 115–126. [Google Scholar]
- Peuckert, J. Assessment of the social capabilities for catching-up through sustainability innovations. Int. J. Technol. Glob. 2011, 5, 190–211. [Google Scholar] [CrossRef]
- Cottrell, J. Reclaiming the ‘T’ word: Ways of improving communication and public acceptance of environmental fiscal reform in Europe. In Environmental Pricing; Kreiser, L., Andersen, M.S., Olsen, B.E., Speck, S., Milne, J.E., Ashiabor, H., Eds.; Edward Elgar Publishing: Cheltenham, UK, 2015; pp. 195–212. [Google Scholar]
- Böhringer, C.; Vogt, C. The dismantling of a breakthrough: The Kyoto Protocol as symbolic policy. Eur. J. Polit. Econ. 2004, 20, 597–617. [Google Scholar] [CrossRef]
- Prins, G.; Caine, M.E.; Akimoto, K.; Calmon, P.; Constable, J.; Deiaco, E.; Flack, M.; Galiana, I.; Grundmann, R.; Laird, F.; et al. The Vital Spark:Innovating Clean and Affordable Energy for All; LSE Academic Publishing: London, UK, 2013; ISBN 978-1-909890-01-5. [Google Scholar]
- O’Brien, L.V.; Meis, J.; Anderson, R.C.; Rizio, S.M.; Ambrose, M.; Bruce, G.; Critchley, C.R.; Dudgeon, P.; Newton, P.; Robins, G.; et al. Low Carbon Readiness Index: A short measure to predict private low carbon behaviour. J. Environ. Psychol. 2018, 57, 34–44. [Google Scholar] [CrossRef]
- Gough, I.; Meadowcroft, J. Decarbonizing the Welfare State; Oxford University Press: Oxford, UK, 2011; ISBN 9780191735271. [Google Scholar]
- O’Mahony, T.; Luukkanen, J. Exploring the Missing Dimensions of Transition through ‘Sustainable Wellbeing’. In Proceedings of the Futures of a Complex World; Futures Research Centre, Turku, Finland, 12–13 June 2017. [Google Scholar]
- Lindenberg, S.; Steg, L. Normative, gain and hedonic goal frames guiding environmental behavior. J. Soc. Issues 2007, 63, 117–137. [Google Scholar] [CrossRef] [Green Version]
- Steg, L.; Bolderdijk, J.W.; Keizer, K.; Perlaviciute, G. An Integrated Framework for Encouraging Pro-environmental Behaviour: The role of values, situational factors and goals. J. Environ. Psychol. 2014, 38, 104–115. [Google Scholar] [CrossRef] [Green Version]
- Mercure, J.-F.; Knobloch, F.; Pollitt, H.; Paroussos, L.; Scrieciu, S.S.; Lewney, R. Modelling innovation and the macroeconomics of low-carbon transitions: Theory, perspectives and practical use. Clim. Policy 2019, 19, 1019–1037. [Google Scholar] [CrossRef] [Green Version]
- Milfont, T.L. The effects of social desirability on self-reported environmental attitudes and ecological behaviour. Environmentalist 2009, 29, 263–269. [Google Scholar] [CrossRef]
- Sonnenschein, J.; Smedby, N. Designing air ticket taxes for climate change mitigation: Insights from a Swedish valuation study. Clim. Policy 2019, 19, 651–663. [Google Scholar] [CrossRef]
- Delhey, J.; Newton, K. Predicting cross-national levels of social trust: Global pattern or Nordic exceptionalism? Eur. Sociol. Rev. 2005, 21, 311–327. [Google Scholar] [CrossRef]
- Suárez-Varela, M.; Guardiola, J.; González-Gómez, F. Do Pro-environmental Behaviors and Awareness Contribute to Improve Subjective Well-being? Appl. Res. Qual. Life 2016, 11, 429–444. [Google Scholar] [CrossRef]
- Oh, C. Discursive Contestation on Technological Innovation and the Institutional Design of the UNFCCC in the New Climate Change Regime. New Polit. Econ. 2020, 25, 660–674. [Google Scholar] [CrossRef]
- Sauter, R.; Watson, J. Strategies for the deployment of micro-generation: Implications for social acceptance. Energy Policy 2007, 35, 2770–2779. [Google Scholar] [CrossRef]
Figure 1.
Willingness to make economic sacrifices for the environment. Pay much higher prices, much higher taxes, and accept cuts in standard of living in the Nordic Countries. Source: ISSP 2010. Missing values not included (layout and groupings adapted from Harring (2016); Welsch and Kühling (2017)).

Table 1.
Summary table of main variables.
| Main Variables | Measured by the Item | Coding | Reference to Studies |
|---|---|---|---|
| Dependent Variables | |||
| Pay much higher prices | How willing would you be to pay much higher prices in order to protect the environment? | 5 pt. scale: 1 (Very willing) to 5 (Very unwilling) | Fairbrother, 2016 [32]; Ivanova and Tranter, 2008 [31]; Marbuah, 2019 [43]; |
| Pay much higher taxes | And how willing would you be to pay much higher taxes in order to protect the environment? | 5 pt. scale: 1 (Very willing) to 5 (Very unwilling) | Davidovic, Harring, and Jagers, 2020 [30]; Fairbrother, 2016 [32]; Ivanova and Tranter, 2008 [31]; Marbuah, 2019 [43]; |
| Accept cuts in standard of living | And how willing would you be to accept cuts in your standard of living in order to protect the environment? | 5 pt. scale: 1 (Very willing) to 5 (Very unwilling) | Ivanova and Tranter, 2008 [31]; Marbuah, 2019 [43]; Pädam and Swain, 2017 [44]; |
| Independent Variables | |||
| Environmental concern | Generally speaking, how concerned are you about environmental issues? | 5 pt. scale: 1 (Not at all concerned) to 5 (Very concerned) | Butkevičienė, 2017 [56]; Cho and Moon, 2019 [45]; Domazet et al., 2014 [40]; Marbuah, 2019 [43]; Vainio and Paloniemi, 2014 [8] |
| Social trust | Generally speaking, would you say that most people can be trusted, or that you can’t be too careful in dealing with people? | 5 pt. scale: 1 (You can’t be too careful) to 5 Most people can be trusted) | Butkevičienė, 2017 [56]; Fairbrother, 2016 [32]; Marbuah, 2019 [43]; |
| Institutional trust | To what extent do you agree or disagree with the following statement: Most of the time we can trust people in government to do what is right | 5 pt. scale: 1 (Agree strongly) to 5 (Disagree strongly) | Butkevičienė, 2017 [56]; Jin and Shriar 2013 [38,57]; Marbuah, 2019 [43]; |
| Environmental efficacy | I do what is right for the environment, even when it costs more money or takes more time | 5 pt. scale: 1 (Agree strongly) to 5 (Disagree strongly) | Engel and Pötschke, 1998 [33]; Motherway et al. 2003 [58]; Reyes, 2016 [59] |
| Importance of environmental protection | There are more important things to do in life than protect the environment | 5 pt. scale: 1 (Agree strongly) to 5 (Disagree strongly) | Butkevičienė, 2017 [56]; Motherway et al. 2003 [58]; Struwig, 2010 [60] |
| International agreements | For environmental problems, there should be international agreements that [COUNTRY] and other countries should be made to follow | 5 pt. scale: 1 (Agree strongly) to 5 (Disagree strongly) | Çarkoğlu and Kentmen-Çin, 2015 [29]; Motherway et al., 2003 [58]; Reyes, 2016 [59]; Tjernström and Tietenberg 2008 [61] |
| Future energy | “Solar, Wind, Water” as the Respondent’s priority toward energy security in relation to the item “To which of the following should [COUNTRY] give priority in order to meet its future energy needs?” | 0 (No), 1 (Yes) | Tranter, 2013 [62] |
| Post-materialism | Number of postmaterialistic goals a country should have from a list of four: Maintain order in the nation (1) Give people more say in government decisions (2) Fight rising prices (3) Protect freedom of speech (4) | 0 (none), 1 (one), or 2 (two) | Franzen and Vogl, 2013 [9,24] |
| Public behaviors | Sum score from four (yes = 1 or no = 0) items: Member of any group whose main aim is to preserve or protect the environment (1) In the last five years,... signed a petition about an environmental issue (2) ... given money to an environmental group (3) ... taken part in a protest or demonstration (4) | 0 to 4 | Pisano and Lubell, 2017 [63]; Tam and Chan, 2018 [64]; Vainio and Paloniemi, 2014 [8] |
| Consumer Behaviors | Additive index from 6 items on how often (Never = 0 to Always = 3) respondents for environmental reasons: sort glass or tins or plastic or newspapers and so on for recycling (1) buy fruit and vegetables grown without pesticides or chemicals (2) cut back on driving a car (3) reduce the energy or fuel you use at home (4) choose to save or re-use water (5) avoid buying certain products (6) | 0 to 18 | Çarkoğlu and Kentmen-Çin, 2015 [29]; Pisano and Lubell, 2017 [63]; Tam and Chan, 2018 [64]; Vainio and Paloniemi, 2014 [8] |
Table 2.
Distributions for variables included in the analysis of the pooled Nordic countries sample, among each group of the three forms of willingness to make economic sacrifices for the environment: mean (standard deviation) for scales; valid percentages for categorical variables.
Table 2.
Distributions for variables included in the analysis of the pooled Nordic countries sample, among each group of the three forms of willingness to make economic sacrifices for the environment: mean (standard deviation) for scales; valid percentages for categorical variables.
| Pay Much Higher Prices | Pay Much Higher Taxes | Accept Cuts in Standard of Living | ||||||||
|---|---|---|---|---|---|---|---|---|---|---|
| Main Variables | Fairly Unwilling and Very Unwilling | Neither Willing Nor Unwilling | Fairly Willing and Very Willing | Fairly Unwilling and Very Unwilling | Neither Willing Nor Unwilling | Fairly Willing and Very Willing | Fairly Unwilling and Very Unwilling | Neither Willing Nor Unwilling | Fairly Willing and Very Willing | |
| Environmental Concern | 3.09 | 3.47 | 3.87 | 3.20 | 3.57 | 3.89 | 3.01 | 3.46 | 3.87 | |
| (1.05) | (0.92) | (0.91) | (1.04) | (0.89) | (0.92) | (1.04) | (0.89) | (0.91) | ||
| Social trust | 3.36 | 3.47 | 3.79 | 3.40 | 3.53 | 3.83 | 3.37 | 3.52 | 3.71 | |
| (1.23) | (1.21) | (1.20) | (1.24) | (1.21) | (1.19) | (1.25) | (1.19) | (1.22) | ||
| Institutional trust | 3.26 | 2.98 | 2.92 | 3.22 | 2.94 | 2.88 | 3.20 | 3.00 | 2.99 | |
| (1.03) | (0.94) | (1.01) | (1.02) | (0.92) | (1.01) | (1.03) | (0.97) | (1.01) | ||
| Perceived activity arena | 3.39 | 3.48 | 3.80 | 3.43 | 3.56 | 3.80 | 3.30 | 3.53 | 3.82 | |
| (1.07) | (1.03) | (1.03) | (1.07) | (1.00) | (1.07) | (1.09) | (0.97) | (1.03) | ||
| Environmental efficacy | 3.10 | 2.70 | 2.42 | 2.98 | 2.63 | 2.40 | 3.08 | 2.73 | 2.46 | |
| (0.88) | (0.75) | (0.82) | (0.89) | (0.75) | (0.82) | (0.90) | (0.76) | (0.83) | ||
| Importance of environmental protection | 3.09 | 3.40 | 3.66 | 3.17 | 3.51 | 3.67 | 3.01 | 3.42 | 3.67 | |
| (1.02) | (0.94) | (1.02) | (1.03) | (0.91) | (1.04) | (1.02) | (0.92) | (1.01) | ||
| Modern science | 3.37 | 3.35 | 3.52 | 3.35 | 3.43 | 3.54 | 3.23 | 3.36 | 3.63 | |
| (1.06) | (0.98) | (1.08) | (1.04) | (0.99) | (1.11) | (1.04) | (0.98) | (1.06) | ||
| International agreements | 2.02 | 1.85 | 1.60 | 1.98 | 1.81 | 1.54 | 2.03 | 1.85 | 1.63 | |
| (0.84) | (0.74) | (0.69) | (0.83) | (0.71) | (0.67) | (0.84) | (0.73) | (0.72) | ||
| Future energy (Solar, Wind, Water) | No | 27.86% | 20.89% | 17.81% | 26.92% | 18.31% | 16.73% | 28.71% | 20.11% | 18.02% |
| Yes | 72.14% | 79.11% | 82.19% | 73.08% | 81.69% | 83.27% | 71.29% | 79.89% | 81.98% | |
| Postmaterialism | 0.82 | 0.89 | 1.05 | 0.83 | 0.93 | 1.08 | 0.80 | 0.90 | 1.03 | |
| (0.58) | (0.57) | (0.57) | (0.58) | (0.57) | (0.57) | (0.58) | (0.56) | (0.58) | ||
| Public Behaviours | 0.29 | 0.39 | 0.77 | 0.31 | 0.47 | 0.85 | 0.27 | 0.38 | 0.76 | |
| (0.60) | (0.72) | (1.00) | (0.63) | (0.76) | (1.06) | (0.59) | (0.69) | (0.99) | ||
| Perceived dangers | 3.33 | 3.46 | 3.73 | 3.35 | 3.51 | 3.79 | 3.26 | 3.47 | 3.74 | |
| (0.67) | (0.62) | (0.61) | (0.65) | (0.62) | (0.60) | (0.67) | (0.61) | (0.60) | ||
| Consumer behaviours | 6.50 | 7.83 | 9.09 | 6.82 | 8.20 | 9.26 | 6.29 | 7.65 | 9.18 | |
| (3.26) | (3.00) | (3.11) | (3.27) | (2.93) | (3.15) | (3.25) | (2.91) | (3.07) | ||
| Sociodemographic Variables | ||||||||||
| Age | 45.19 | 49.55 | 47.91 | 46.26 | 49.87 | 47.12 | 46.00 | 48.29 | 48.03 | |
| (16.48) | (16.32) | (16.22) | (16.66) | (16.16) | (15.94) | (17.11) | (15.85) | (16.09) | ||
| Top-Bottom self-placement | 5.77 | 5.91 | 6.30 | 5.87 | 6.01 | 6.23 | 5.86 | 6.01 | 6.11 | |
| (1.70) | (1.53) | (1.54) | (1.68) | (1.47) | (1.58) | (1.71) | (1.53) | (1.57) | ||
| Place of living: urban-rural | 2.81 | 2.82 | 2.64 | 2.81 | 2.82 | 2.58 | 2.75 | 2.79 | 2.73 | |
| (1.28) | (1.27) | (1.34) | (1.30) | (1.27) | (1.31) | (1.28) | (1.29) | (1.32) | ||
| Gender | Male | 50.61% | 46.24% | 44.14% | 51.03% | 41.72% | 44.27% | 54.25% | 45.19% | 42.48% |
| Female | 49.39% | 53.76% | 55.86% | 48.97% | 58.28% | 55.73% | 45.75% | 54.81% | 57.52% | |
| Education | Intermediate secondary completed (qualifications above the lowest qualification) | 19.2% | 15.6% | 12.5% | 18.2% | 15.9% | 11.0% | 18.4% | 15.7% | 13.5% |
| Higher secondary completed (usual entry requirements for universities) | 26.6% | 27.1% | 20.0% | 26.7% | 25.0% | 19.5% | 25.2% | 26.3% | 22.3% | |
| University degree incomplete (qualifications above higher secondary level) | 19.0% | 22.4% | 23.6% | 19.1% | 23.0% | 25.0% | 18.5% | 22.3% | 23.5% | |
| University degree completed, BG: lower tertiary level, upper tertiary level | 22.5% | 22.4% | 34.5% | 23.4% | 23.8% | 36.0% | 23.8% | 23.7% | 31.6% | |
| No formal qualification, Lowest formal qualification | 12.6% | 12.5% | 9.4% | 12.5% | 12.4% | 8.5% | 14.1% | 11.9% | 9.1% | |
| Party Affiliation | Far left (communist etc.) | 2.8% | 5.4% | 9.6% | 2.4% | 5.8% | 12.9% | 2.7% | 5.0% | 9.4% |
| Left, center left | 24.1% | 27.5% | 33.0% | 23.0% | 30.5% | 36.5% | 21.6% | 30.1% | 32.5% | |
| Center, liberal | 11.8% | 13.1% | 14.3% | 12.0% | 14.3% | 13.6% | 11.0% | 13.2% | 14.8% | |
| Right, conservative | 31.2% | 29.2% | 22.1% | 33.4% | 26.4% | 16.6% | 34.7% | 27.7% | 21.0% | |
| Far right (fascist etc.) | 3.5% | 3.1% | 2.5% | 3.3% | 2.6% | 3.0% | 3.8% | 2.7% | 2.6% | |
| No party affiliation and other | 26.7% | 21.7% | 18.5% | 25.9% | 20.4% | 17.3% | 26.1% | 21.4% | 19.7% | |
Table 3.
Multinomial logistic regression explaining willingness to make economic sacrifices for the environment in the forms of paying much higher prices, much higher taxes, and accepting cuts to the standard of living in the Nordic countries.
Table 3.
Multinomial logistic regression explaining willingness to make economic sacrifices for the environment in the forms of paying much higher prices, much higher taxes, and accepting cuts to the standard of living in the Nordic countries.
| Pay Much Higher Prices | Pay Much Higher Taxes | Accept Cuts in Standard of Living | |||||||
|---|---|---|---|---|---|---|---|---|---|
| Chi-Square | df | p | Chi-Square | df | p | Chi-Square | df | p | |
| Environmental concern | 73.307 | 2 | 0.000 | 58.972 | 2 | 0.000 | 76.605 | 2 | 0.000 |
| Social trust | 8.069 | 2 | 0.018 | n.s. | 7.800 | 2 | 0.020 | ||
| Institutional trust | 32.657 | 2 | 0.000 | 80.706 | 2 | 0.000 | 15.738 | 2 | 0.000 |
| Perceived activity arena | n.s. | n.s. | 28.573 | 2 | 0.000 | ||||
| Environmental efficacy | 66.135 | 2 | 0.000 | 37.444 | 2 | 0.000 | 38.427 | 2 | 0.000 |
| Importance of environmental protection | 14.599 | 2 | 0.001 | 6.137 | 2 | 0.046 | 31.830 | 2 | 0.000 |
| International agreements | 15.145 | 2 | 0.001 | 21.899 | 2 | 0.000 | − | − | n.s. |
| Modern science | − | − | n.s. | − | − | n.s. | 14.684 | 2 | 0.001 |
| Postmaterialism | 20.288 | 2 | 0.000 | 25.827 | 2 | 0.000 | 23.116 | 2 | 0.000 |
| Public behaviours | 22.926 | 2 | 0.000 | 14.269 | 2 | 0.001 | 22.092 | 2 | 0.000 |
| Perceived dangers | 13.018 | 2 | 0.001 | 17.851 | 2 | 0.000 | 27.960 | 2 | 0.000 |
| Age | 10.176 | 2 | 0.006 | 20.135 | 2 | 0.000 | − | − | n.s. |
| Education | 20.919 | 8 | 0.007 | − | − | n.s. | − | − | n.s. |
| Top-Bottom self-placement | 40.641 | 2 | 0.000 | 9.523 | 2 | 0.009 | − | − | n.s. |
| Political affiliation | 18.361 | 10 | 0.049 | 112.479 | 10 | 0.000 | 28.142 | 10 | 0.002 |
| Consumer behaviours | 34.001 | 2 | 0.000 | 27.202 | 2 | 0.000 | 48.055 | 2 | 0.000 |
| Future energy | − | − | n.s. | − | − | n.s. | 6.228 | 2 | 0.044 |
| Gender | − | − | n.s. | 8.490 | 2 | 0.014 | − | − | n.s. |
| Country | 105.310 | 8 | 0.000 | 62.234 | 8 | 0.000 | 34.779 | 8 | 0.000 |
For the three models, the forward inclusion iterative method is used with criteria set at p < 0.05. n.s. nonsignificant p > 0.05. Likelihood ratio tests results indicated above. The chi-square statistic is the difference in −2 log-likelihoods between the final model and a reduced model.
Table 4.
Multinomial logistic regression (continued).
| Willingness to Pay Higher Prices | Willingness to Pay Higher Taxes | Willingness to Accept Cuts to Standard of Living | ||||||||||||||||
|---|---|---|---|---|---|---|---|---|---|---|---|---|---|---|---|---|---|---|
| Neither willing nor unwilling vs. Fairly unwilling and Very unwilling | Fairly Willing and Very Willing vs. Fairly unwilling and Very unwilling | Neither willing nor unwilling vs. Fairly unwilling and Very unwilling | Fairly Willing and Very Willing vs. Fairly unwilling and Very unwilling | Neither willing nor unwilling vs. Fairly unwilling and Very unwilling | Fairly Willing and Very Willing vs. Fairly unwilling and Very unwilling | |||||||||||||
| B | Std. Error | Exp(B) | B | Std. Error | Exp(B) | B | Std. Error | Exp(B) | B | Std. Error | Exp(B) | B | Std. Error | Exp(B) | B | Std. Error | Exp(B) | |
| Environmental concern | 0.235 *** | (0.061) | 1.265 | 0.559 *** | (0.067) | 1.748 | 0.281 *** | (0.062) | 1.325 | 0.497 *** | (0.068) | 1.643 | 0.295 *** | (0.063) | 1.342 | 0.581 *** | (0.068) | 1.787 |
| Social trust | −0.031 | (0.045) | 0.970 | 0.096 * | (0.048) | 1.101 | 0.024 | (0.046) | 1.025 | 0.123 * | (0.048) | 1.131 | ||||||
| Institutional trust | 0.277 *** | (0.055) | 0.758 | −0.279 *** | (0.057) | 0.757 | −0.348 *** | (0.054) | 0.706 | −0.462 *** | (0.057) | 0.630 | −0.203 *** | (0.056) | 0.816 | −0.195 *** | (0.058) | 0.822 |
| Perceived activity arena | 0.098 | (0.054) | 1.104 | 0.296 *** | (0.057) | 1.345 | ||||||||||||
| Environmental efficacy | −0.357 *** | (0.068) | 0.700 | −0.574 *** | (0.073) | 0.563 | −0.279 *** | (0.068) | 0.757 | −0.418 *** | (0.073) | 0.659 | −0.290 *** | (0.068) | 0.749 | −0.438 *** | (0.072) | 0.645 |
| Importance of environmental protection | 0.156 ** | (0.057) | 1.169 | 0.219 *** | (0.059) | 1.245 | 0.129 * | (0.056) | 1.138 | 0.102 | (0.058) | 1.108 | 0.281 *** | (0.058) | 1.324 | 0.308 *** | (0.060) | 1.361 |
| International agreements | 0.000 | (0.072) | 1.000 | −0.267 *** | (0.080) | 0.766 | −0.065 | (0.072) | 0.937 | −0.370 *** | (0.082) | 0.691 | ||||||
| Modern science | 0.119 * | (0.055) | 1.127 | 0.220 *** | (0.057) | 1.246 | ||||||||||||
| Postmaterialism | 0.141 | (0.096) | 1.151 | 0.439 *** | (0.100) | 1.551 | 0.147 | (0.094) | 1.158 | 0.501 *** | (0.100) | 1.650 | 0.131 | (0.099) | 1.139 | 0.465 *** | (0.103) | 1.592 |
| Public behaviours | 0.110 | (0.078) | 1.117 | 0.326 *** | (0.075) | 1.386 | 0.097 | (0.069) | 1.102 | 0.245 *** | (0.066) | 1.278 | 0.158 | (0.083) | 1.171 | 0.346 *** | (0.080) | 1.413 |
| Perceived dangers | 0.079 | (0.094) | 1.082 | 0.340 *** | (0.099) | 1.406 | −0.026 | (0.093) | 0.975 | 0.372 *** | (0.100) | 1.450 | 0.112 | (0.094) | 1.118 | 0.482 *** | (0.098) | 1.619 |
| Future energy a | −0.273 * | (0.126) | 0.761 | −0.289 * | (0.132) | 0.749 | ||||||||||||
| Gender b | −0.224 * | (0.103) | 0.799 | 0.091 | (0.109) | 1.096 | ||||||||||||
| Consumer behaviours | 0.067 *** | (0.019) | 1.070 | 0.116 *** | (0.020) | 1.123 | 0.043 * | (0.019) | 1.044 | 0.105 *** | (0.020) | 1.110 | 0.038 | (0.020) | 1.038 | 0.134 *** | (0.020) | 1.143 |
| Age | 0.010 ** | (0.004) | 1.010 | 0.001 | (0.004) | 1.001 | 0.011 ** | (0.004) | 1.011 | −0.006 | (0.004) | 0.995 | ||||||
| Education c Intermediate secondary completed | 0.133 | (0.221) | 1.142 | −0.321 | (0.236) | 0.725 | ||||||||||||
| Higher secondary completed | 0.193 | (0.213) | 1.213 | −0.451 * | (0.226) | 0.637 | − | − | − | − | − | − | − | − | − | − | − | |
| University degree incomplete | −0.081 | (0.223) | 0.922 | −0.536 * | (0.232) | 0.585 | − | − | − | − | − | − | − | − | − | − | − | |
| University degree completed | 0.125 | (0.220) | 1.133 | −0.058 | (0.224) | 0.943 | − | − | − | − | − | − | − | − | − | − | − | |
| Top-Bottom self-placement | 0.039 | (0.036) | 1.039 | 0.228 *** | (0.039) | 1.256 | 0.011 | (0.034) | 1.011 | 0.106 ** | (0.036) | 1.112 | − | − | − | − | − | |
| Political affiliation d Far left (communist etc.) | 0.259 | (0.327) | 1.295 | 0.037 | (0.326) | 1.038 | 1.259 *** | (0.317) | 3.523 | 1.049 ** | (0.321) | 2.856 | 0.389 | (0.351) | 1.475 | 0.523 | (0.349) | 1.687 |
| Left, center left | 0.023 | (0.187) | 1.023 | −0.209 | (0.198) | 0.811 | 0.523 ** | (0.186) | 1.687 | 0.422 * | (0.199) | 1.525 | 0.186 | (0.193) | 1.204 | −0.083 | (0.200) | 0.921 |
| Center, liberal | 0.264 | (0.203) | 1.302 | 0.013 | (0.219) | 1.013 | 0.608 ** | (0.199) | 1.836 | 0.365 | (0.219) | 1.441 | 0.169 | (0.211) | 1.184 | 0.213 | (0.217) | 1.237 |
| Right, conservative | −0.015 | (0.181) | 0.986 | −0.489 * | (0.198) | 0.613 | −0.145 | (0.186) | 0.865 | −0.752 *** | (0.209) | 0.472 | −0.194 | (0.186) | 0.823 | −0.419 * | (0.196) | 0.658 |
| Far right (fascist etc.) | −0.195 | (0.328) | 0.823 | −0.827 * | (0.356) | 0.438 | −0.111 | (0.331) | 0.895 | −0.437 | (0.339) | 0.646 | −0.445 | (0.336) | 0.641 | −0.377 | (0.349) | 0.686 |
| Country e Finland | −0.957 *** | (0.194) | 0.384 | −1.587 *** | (0.207) | 0.204 | −0.420 * | (0.184) | 0.657 | −1.225 *** | (0.202) | 0.294 | −0.447 * | (0.202) | 0.640 | −0.410 | (0.214) | 0.664 |
| Iceland | −0.332 | (0.241) | 0.717 | −0.954 *** | (0.263) | 0.385 | −0.160 | (0.229) | 0.852 | −0.548 * | (0.251) | 0.578 | −0.752 ** | (0.232) | 0.471 | −0.714 ** | (0.250) | 0.490 |
| Norway | −0.474 ** | (0.177) | 0.623 | −0.438 * | (0.183) | 0.645 | −0.657 *** | (0.163) | 0.519 | −0.734 *** | (0.169) | 0.480 | −0.490 ** | (0.166) | 0.613 | −0.018 | (0.177) | 0.982 |
| Sweden | −1.076 *** | (0.181) | 0.341 | −1.205 *** | (0.186) | 0.300 | −0.577 *** | (0.160) | 0.562 | −0.915 *** | (0.167) | 0.400 | −0.598 *** | (0.177) | 0.550 | 0.009 | (0.183) | 1.009 |
| Intercept | −0.753 | (0.661) | −2.985 *** | (0.706) | −0.941 | (0.618) | −2.204 ** | (0.670) | −1.658 ** | (0.564) | −6.261 *** | (0.613) | ||||||
| Cox & Snell R2 | 0.318 | 0.296 | 0.321 | |||||||||||||||
| Nagelkerke R2 | 0.358 | 0.338 | 0.362 | |||||||||||||||
| N | 2891 | 2899 | 2889 | |||||||||||||||
An Exp(B) coefficient greater than 1.00 indicates that people are more likely to be ‘Neither willing nor unwilling’ than to be ‘Fairly Unwilling and Very Unwilling’ (left column), or are more likely to respond ‘Fairly Willing and Very Willing’ than to be ‘Fairly Unwilling and Very Unwilling’ (right column). Whereas, an Exp(B) coefficient less than 1.00 means that people are more likely to be ‘Fairly Unwilling and Very Unwilling’ than to be ‘Neither willing nor unwilling’ (left column), or people are more likely to be ‘Fairly Unwilling and Very Unwilling’ than to be ‘Fairly Willing and Very Willing’ (right column). (a) The reference category is those who believe in giving priority to solar, wind or water power in order to meet its future energy needs. (b) Reference category is ‘Female’. (c) Reference category is ‘No formal qualification, Lowest formal qualification’. (d) Reference category is ‘No party affiliation and other’. (e) Reference category is Denmark; Nordic countries sorted alphabetically. *** p < 0.01, ** p < 0.05, * p < 0.1.
Publisher’s Note: MDPI stays neutral with regard to jurisdictional claims in published maps and institutional affiliations. |
© 2021 by the author. Licensee MDPI, Basel, Switzerland. This article is an open access article distributed under the terms and conditions of the Creative Commons Attribution (CC BY) license (http://creativecommons.org/licenses/by/4.0/).
Share and Cite
MDPI and ACS Style
Reyes, J.A.L. How Different Are the Nordics? Unravelling the Willingness to Make Economic Sacrifices for the Environment. Sustainability 2021, 13, 1294. https://doi.org/10.3390/su13031294
AMA Style
Reyes JAL. How Different Are the Nordics? Unravelling the Willingness to Make Economic Sacrifices for the Environment. Sustainability. 2021; 13(3):1294. https://doi.org/10.3390/su13031294
Chicago/Turabian StyleReyes, Joseph Anthony L. 2021. "How Different Are the Nordics? Unravelling the Willingness to Make Economic Sacrifices for the Environment" Sustainability 13, no. 3: 1294. https://doi.org/10.3390/su13031294
Note that from the first issue of 2016, this journal uses article numbers instead of page numbers. See further details here.