Article

Assessing Suitability of Human Settlements in High-Altitude Area Using a Comprehensive Index Method: A Case Study of Tibet, China

1
State Key Laboratory of Urban and Regional Ecology and Key Laboratory of Environmental Nanotechnology and Health Effects, Research Center for Eco-Environmental Sciences, Chinese Academy of Sciences, Beijing 100085, China
2
College of Resources and Environment, University of Chinese Academy of Sciences, Beijing 100049, China
*
Authors to whom correspondence should be addressed.
Sustainability 2021, 13(3), 1485; https://doi.org/10.3390/su13031485
Submission received: 17 December 2020 / Revised: 18 January 2021 / Accepted: 19 January 2021 / Published: 1 February 2021

Abstract

:
With the steady advancement of the United Nations Sustainable Development Goals (SDGs), how to build a sustainable environment for human settlements has become a hot topic of research for scholars from various countries. Rational space utilization and resource allocation are the keys to enhancing human well-being and achieving sustainable human settlements. A comprehensive human settlement environment evaluation system, which includes 14 indicators from the natural environment, infrastructure, and public services, was established in this study. The results showed that the habitat suitability area only accounted for 1.61% (2.05% after removing the nature reserve) and all centered on cities and radiated to the surrounding areas. A belt-like suitability distribution pattern of “Yi Jiang Liang He” (i.e., Brahmaputra, Lhasa, and Nianchu Rivers) is formed, and a point-like suitability distribution pattern of the Chamdo Karub District, Nagqu Seni District, and Ngari Shiquanhe Town are formed. The results of the driving factor analysis indicate that the level of public health development in infrastructure and various indicators in public services are the main factors influencing human settlement. There is not much difference in the natural environment in the populated regions, so the suitability of the natural environment is not a significant driving factor. In addition, the reliability of the assessment results was verified by a questionnaire survey of residents in the three regions, and the subjective satisfaction of the residents agreed with the ranking results of the objective evaluation. The evaluation results of this study provide theoretical and directional guidance for the improvement of human settlements on the Qinghai–Tibet Plateau. It will be a useful tool for evaluating human settlements in the region and has a reference significance for the formulation of macro-policy in high-altitude regions.

Graphical Abstract

1. Introduction

The human settlement environment is the basis for human survival and development, which is not only related to the health of the individual but also the harmonious development of many aspects of society [1]. With the development of human society, the human settlement system has evolved from scattered settlements, villages, and towns to cities and urban agglomerations [2]. The science of human settlements has been established since the 1960s with the gradual complication of human settlements. The concept of the science of human settlements was first proposed by the Greek scholar Doxiadis [3]. In 1961, the World Health Organization (WHO) proposed four basic concepts for the living environment: safety, health, convenience, and comfort. A series of international conferences has been conducted to discuss the issue of human settlements and the environment [4,5,6,7]. The need for the human settlement environment (HSE) has been updated to a new stage at the formal establishment of UN-Habitat in 2002, of which the functions have since broadened. The third United Nations Conference on human settlements reinvigorated the global commitment to sustainable urbanization and focused attention on the implementation of a new urban agenda [8].
As the concept of sustainable development has been put forward, an increasing number of people are paying attention to the health of the human settlement environment [9]. In the context of global warming, a study was conducted on 288 cities in China from 2006 to 2016. From the perspective of the impact of climate change on urban livability, it was found that China’s urban livability index increased by approximately 12% in the last decade [10]. Some scholars explored the distribution pattern of urban desirability in the Xerias stream of Greece from the perspective of natural hazards, such as landslides, floods, and earthquakes, and found that 40% of the city boundaries and 60% of the road network were located in low desirability and very low desirability areas [11].
In recent years, these studies have been conducted at both the macro and micro scales [12]. At the macro scale, the human settlement assessment is mostly based on objective statistical data, geographic information data, and meteorological data. Changes in the natural environment were considered to be the major influencing factor on the health status of human settlements [13]. A risk index model that integrated the vulnerability, functionality, stress, and suitability was constructed to assess the spatial and temporal patterns of human settlement risk at the national scale in China. There is an obvious block aggregation of spatial-distribution characteristics among regions of different types of natural environments [14]. Besides, scholars have evaluated living conditions in 35 major Chinese cities, and the results confirm growing disparities between cities and the challenges posed by rapid economic growth, but this does not include the cities of Tibet [15].
At the micro-scale, the human settlement assessment is mostly based on subjective questionnaire data, infrastructure development data, and public services data. Mahmoudi et al. selected 14 indicators related to infrastructure and public services to assess the effect of streetscapes on livability in Kuala Lumpur [16]. Improperly paved sidewalks, inadequate public services and maintenance, and insufficient parking spaces are deteriorating the livability along these streets. With the development of urbanization, an increasing number of low-income laborers have settled in the cities, placing higher demands on the economy and facilities within the communities [17,18]. In addition, active participation and good communication among residents promote the development of infrastructure and public services and will further improve human settlements [19]. During long-term survival, humans gradually develop sustainable ecological wisdom and know how to create a good living environment between humans and nature [20].
The multi-criteria evaluation (MCE) method can identify the optimal solution from multiple indicators and perspectives and help the decision makers to describe, evaluate, rank, and select alternatives according to several criteria, and is widely used in various fields of suitability evaluation [21,22]. The weight of indicators directly determines the reliability of the evaluation results. The methods such as expert scoring, analytic hierarchy process, and comprehensive evaluation approach were used to calculate the weight [9,23]. However, the methods of the above are subjective, which may lead to a lack of objectivity in evaluation results. Based on the above problems, this study fully considers the natural selection process of population and uses the correlation between index factors and population density as the weight coefficient of the index [24,25,26,27].
There were many studies on the assessment of human settlements [28,29,30,31]. However, few scholars have focused their attention on the human settlement environment in high altitude and low population density areas. In the context of sustainable development, achieving sustainable development in Tibet is as important as other areas. Approximately 140 million people live at altitudes above 2,500 m permanently, and approximately 35 million people travel to these areas every year [32]. The Tibetan Plateau, which is known as the “roof of the world,” is the highest in the world [33,34] and is the home of more than 10 million people [35]. The Tibetan Plateau has the characteristics of a harsh natural environment, poor infrastructure construction, and limited medical services [36,37,38]. The high incidence of plateau endemic diseases and infectious diseases seriously threaten the health of residents. According to previous studies, high altitudes can alter the normal cardiovascular physiology of the human body and cause sleep-disordered breathing (SDB), which indirectly increases the cardiovascular burden [39,40]. There is also evidence that blood pressure regulation is altitude-dependent and that high altitudes may increase blood pressure [41]. There is a higher incidence of retinal pathology in persons living in high-altitude areas than those living in low-altitude areas [42]. Furthermore, the average life expectancy in Tibet is much lower than the national average of China (i.e., 70.60 y vs. 74.83 y). It is a challenging objective that the average life expectancy reaches 79 years for the Tibetan Plateau inhabitants by 2030 [43]. Therefore, assessing the suitability of the human settlement environment and identifying the driving factors have great significance for the improvement of the Tibetan human settlement environment.
In previous studies, many scholars have described the human settlement environment from a single perspective [17,18]. However, few scholars have carried out studies from both objective evaluation and subjective satisfaction. In this study, 14 indicators in three aspects (i.e., natural environment, infrastructure, and public services) were selected to evaluate the environment of human settlements by GIS multi-criteria analysis in Tibet. The spatial distributions were discussed based on population density. The questionnaire survey was carried out in three typical regions to analyze residents’ satisfaction with the health of the human settlement environment. The combination of objective and subjective evaluations was used to ensure the objectivity and impartiality of the evaluation process. The evaluation results of this study will provide theoretical guidance for the selection of human living areas on the Tibetan Plateau and the formulation of national macro policies.

2. Materials and Methods

2.1. Study Area

The Tibet Autonomous Region, which is the core area of the Tibetan Plateau, lies between 26°50′ N and 36°53′ N and 78°25′ E and 99°06′ E (Figure 1). The area of Tibet is approximately 1,228,400 km2, and the average elevation is over 4000 m. Tibet is a vast region, with pastureland accounting for 56.7% and unused land accounting for 31.8% of the region’s total land area. More than 1500 lakes accounted for approximately 30% of the entire study area. Tibet is a huge reservoir of renewable energy resources, such as hydroelectric, solar, geothermal, and wind energy. It has jurisdiction over six prefecture-level cities and one region, in which approximately 3.5 million people (>90% of the total population) are Tibetans. The GDP per capita in 2018 was approximately 6400 USD, well below the national average of 9770.85 USD.
Infrastructure construction in Tibet has developed rapidly in recent years. By the end of 2019, the total mileage of roads in the region was 103,579.2 km, of which 74,043.9 km were rural roads. The modern education system and medical system in Tibet are gradually improving. By the end of 2019, there were 56,513 faculty members and 841,500 students. There were 1642 medical and health institutions with 17,073 beds and 26,150 health technicians, with 4.87 beds and 5.89 health technicians per 1000 people.

2.2. The HSE Framework and Evaluation Index System

The establishment of a relatively complete system of indicators for evaluating the quality of the human settlement environment should be based on the principles of objectivity, comprehensiveness, and feasibility, taking into account many factors such as the social, economic, cultural, political, and ecological environment [44]. This study identified factors based on a review of the research literature and constructed a new system of indicators for the environmental evaluation of human settlements in the highlands based on three dimensions: natural environment, infrastructure development, and public services. A total of 14 individual indicators were selected, as shown in Table 1. An increase in the indicator is beneficial to the environmental quality of human settlements and is called a positive indicator. The symbol is + and vice versa. The selected indicators include the natural environment, economic development, infrastructure development, culture and recreation, education, and medical care, which are capable of assessing the environmental impact of human settlements in Tibet.

2.2.1. Data Collection and Processing of Natural Environment, Infrastructure, and Public Service

The natural environment is the basic vehicle of human existence, which directly affects human health and population distribution and makes an outstanding contribution to the economic development and well-being of citizens [45]. The concentration of large populations in urban areas, high-density infrastructure, and modern buildings make the natural environment within the city homogeneous, causing scholars to pay less attention to the urban natural environment [12]. In Tibet, the process of urbanization is relatively slow, and its natural environment has the characteristics of low temperatures, low oxygen, strong ultraviolet rays, and significant local climate changes [46]. Therefore, the state of the natural environment is included in the human settlement environment evaluation system. The factors of topography relief, temperature and humidity index, normalized difference vegetation index, barometric pressure, and river network density were selected as the natural environmental factors in this study (see Table 2). The detailed calculation procedure for these factors is as follows.
(1)
Degree of relief of land surface (RDLS)
RDLS represents the change in vertical elevation over a given area, reflecting the macroscopic undulations of the topography. Rugged topography constrains agricultural development and population distribution and is also highly disruptive to urban construction and economic development, while flat alluvial plains have a wider range of cultivated soil [47]. Therefore, RDLS is one of the crucial factors in the comprehensive evaluation of human settlement environment quality. The calculation formula of RDLS is as follows [48]:
RDLS   =   ALT 1000 + Max H Min H × 1 P A A / 500
where ALT is the average elevation (m) within the cell grid; Max (H) and Min (H) are the highest and lowest elevations of the region, respectively; P(A) is the area of the region (km2); A is the total area of the region (km2), and the window size of 1 km × 1 km is used for spatial calculation in this study.
(2)
Temperature and Humidity Index
The THI represents the human body’s perception of the comfort level of the climate combined with the temperature and humidity. Humidity and temperature conditions not only affect human comfort but also have a significant impact on the type and distribution of vegetation and the effective temperature of crops, so the thermo-humidity index is also an essential factor in determining the quality of the human settlement environment. The calculation formula for THI is as follows:
THI = T 0.55 × 1 f × 1.8 t 26 ,   and   T = 1.8 t + 32
where THI is the temperature and humidity index, t is the monthly average temperature (°C), and f is the monthly average relative humidity (%).
(3)
Normalized Difference Vegetation Index
Vegetation is an essential component of terrestrial ecosystems, linking soil, land, water, and the atmosphere to form the nexus within which energy exchange, water cycling, and biochemical processes take place. Vegetation is the only primary producer in urban ecosystems and is considered a vital component of the urban landscape [49]. Green spaces in urban centers are essential for improving human habitats. If a more comprehensive view of the human environment in a given area is to be obtained, inner-city green spaces should be taken into account [50]. Some scholars conducted a small-scale epidemiological analysis of the overall health of the city of Sheffield, UK. The impact of the green space composition and configuration on human health was explored. Relatively high tree planting diversity was found to be associated with lower levels of ill health [51]. Some scholars explored the link between green spaces and mental health in Denmark. This national study covering 900,000 people shows that being in a low-level green space during childhood leads to a 55% risk of developing mental illness among various diseases. Green spaces in childhood may reduce the risk of mental illness, and it is necessary to integrate the natural environment into future urban planning [52]. Urban green spaces have positive effects on human health, primarily in the following areas: reducing stress and improving mental health, providing places for sports and recreation, improving air quality, buffering noise pollution and heat island effects, and enhancing immune system function [53]. The proportion of urban green spaces is a critical indicator supporting urban planning and management.
With increasing attention on urban ecological construction, the proportion of urban green areas in new urban land increased from 27.99% to 31.97% from 1990 to 2015, and the increase in urban green areas is vital for improving the livability of cities [54]. Therefore, vegetation cover is a critical indicator of the quality of the human settlement environment. The NDVI was calculated to reflect the vegetation cover:
NDVI = ( NIR R ) / ( NIR + R )
where NIR is the near-infrared reflectance value of MODIS, and R is the reflectance value of the infrared waveband.
(4)
Barometric pressure
Under low-pressure hypoxic conditions, people experience chest tightness, shortness of breath, nausea, and vomiting, and even severe neurological disturbances. As altitude increases, air pressure gradually decreases [55]. The human body can generally withstand a high pressure of 15 atmospheres and a low pressure of 0.303 atmospheres. The effect of low pressure on human health is even more intense, primarily in the form of the consequent decrease in the partial pressure of oxygen in the air, resulting in hypoxia due to the inability of human hemoglobin to obtain sufficient oxygen. It is believed that at 240 mmHg (roughly equivalent to an altitude of 8500 m above sea level), the normal atmospheric pressure is only 45% oxygenated. When the body’s oxygen content decreases to 45% of normal levels, it is life-threatening; therefore, atmospheric pressure (or altitude) is referred to as the physiological limit of life.
(5)
River network density
Historically, although humans originated in watershed plains, migration has followed river networks [56], which play a key role in the spatial distribution of human settlements [57]. In recent times, the construction of settlements near rivers has been beneficial for the provision of water, trade, and shipping [58]. Over time, these established settlements have grown into towns and cities, and with accelerated urbanization, mega-cities with unprecedented population sizes. Thus, the density of the river network affects the development of human settlements to some extent. The river network density was calculated using river vector data for line density analysis.
Line   density = L 1 × V 1 + L 2 × V 2 / S
where lines L 1 and L 2 are the length of the portion of each line that falls into the circle, and the corresponding population field values are   V 1 and V 2 , respectively. S is the area of a circle centered on the center of each raster pixel using the search radius.
Infrastructure development has a clear function in driving and supporting socioeconomic development [59]. Better infrastructure provision will improve people’s well-being and access to services and opportunities. For the livability and sustainability of cities, urban planning and its associated transport layout have profound implications for the future of cities as well as being critical to the quality of life of their residents [60,61,62]. The development of systems that match building and transport and balance comfort and safety with accessibility is key to achieving sustainable urban development [63]. Sanitation is a social public welfare undertaking, and the number of urban public toilets reflects the level of management and civilization of the city to a certain extent. Therefore, the indicators of road density, parking lots, life facilities, and construction of public toilets were selected to assess the level of infrastructure development. The processing of road density data was calculated by linear density (Equation (4)). The data on the distribution of parking lots, living facilities, and public toilets were processed with nuclear density (Equations (5) and (6)) [64].
K 0 t = π 3 [ 1 t 2 ] 2
Density = 1 n × radius 2 i = 1 n pop i K 0 ( dist i radius )
where the radius is the search bandwidth, pop i is the given population field, and n is the number of two-dimensional points.
Public service facilities facilitate the provision of basic services for the survival and development of the people, such as education, health, culture, sports, social welfare, and security. The population density of a region depends largely on the type and scale of public services. A well-developed public service system can attract more population concentrations, which will lead to more employment opportunities and better development prospects. The spatially distributed accessibility of public services affects the quantity and quality of public services that individuals can share as well as the realization of the goal of equalizing basic public services. Hospitals play a key role in ensuring people’s health and life safety. They are the most essential public service facilities whose spatial allocation ensures equal access to necessary medical services [65]. Due to the close connection between the quality of life standards and regional development levels, the contradiction in the spatial accessibility of healthcare services in China is even more prominent in areas with a complex topography and lagging socio-economic development, such as Tibet [66]. Educational resources are also critical public services [67]. With the rapid development of urbanization, recreational and commercial venues have become an integral part of people’s lives. Mountain environments can provide esthetically appealing landscapes for residents and tourists [68]. The Tibetan people make up more than 90% of the total population of Tibet and have a devout belief in Buddhism. To some extent, the distribution of monasteries, sacred mountains, and sacred lakes has an impact on the human environment of the Tibetan people. Religious beliefs are also an integral part of spiritual life, so the scenic area containing most of the temples was selected as an indicator of the environmental evaluation of human settlements. The data on the distribution of public services were processed using nuclear density (Equations (5) and (6)).
It is necessary to convert all layers to 1 km × 1 km raster layer data and normalize them before performing the evaluation calculations. The single-factor metrics are standardized positively and negatively to remove the effects of units and magnitudes. The corresponding standardization formulae are as follows:
Score i = ( X i X min ) / ( X max X min )
Score i = ( X max X i ) / ( X max X min )
where Score i is the standardized value of the i-th indicator, Xi is the original value of the i-th indicator, X max and X min are the maximum and minimum values of all indicators, respectively. The positive indicators are standardized using Equation (7), and the negative indicators are standardized using Equation (8).

2.2.2. HSE Assessment

The entire evaluation process is shown in Figure 2. Based on the aforementioned data collection and data processing of impact indicators, the weight of each indicator was calculated based on the correlation coefficient between the individual indicators and population density (Table S1 in the Supplementary) [24,25,26,27]. For each criterion layer, the total weight coefficients of all the indicators are equal to 1 (Table 1). All the indicator layer data were converted into raster data with a resolution of 1 km × 1 km. The grid calculator embedded in GIS was used to calculate the values of each evaluation layer for each grid and reclassify the results into different suitability levels.
The HSE assessment model was established as shown in Equation (9):
HSEI = i = 1 n W i × X i
where HSEI represents the human settlement environment index, and its value ranges from 0 to 1. W i represents the weight of the i-th indicator, X i and represents the i-th raster layer after standardization.
Besides, residents’ subjective satisfaction is a key component of the environmental evaluation of human settlements. In order to improve the scientific integrity of the evaluation system, questionnaires were used to obtain the subjective feelings of residents about the human settlement environment. The questionnaire contains three aspects, natural environment, infrastructure, and public services, with a total of 21 questions. Each question contains five different levels of satisfaction, highly satisfied, satisfied, average, dissatisfied, and highly dissatisfied. Each satisfaction level is assigned a value of 1, 0.8, 0.6, 0.4, 0.2, with higher values meaning higher levels of satisfaction. The age and occupation of the surveyed residents were not required to ensure a diverse sample source. The weights of the three dimensions of the natural environment, infrastructure, and public services refer to the weights of the objective GIS-based evaluation above. Equal weights were used for individual indicators within each dimension.

3. Results and Discussions

3.1. Spatial Distribution Pattern of Each Evaluation Indicators Based on HSE Model

The spatial distribution of each evaluation indicator can be calculated using the HSE model. The evaluation results can be separated into three criteria layers: natural environment suitability, infrastructure development suitability, and public service level.
For the natural environment suitability, the results have a high correlation with elevation and water resources. The high suitability area was primarily located in southeastern Tibet, which includes the entire region of Nyingchi and Qamdo, most regions of Shannan, and part of the region of Lhasa (Figure 3a). These areas have good hydrothermal conditions and forest cover areas [69]. The average annual temperature was approximately 17 °C, and the relative humidity was maintained at approximately 10–30% throughout the year. The temperature and humidity index was between 50 and 65, which is suitable for human habitation [70]. In 2018, Qamdo had a forest area of 3.82 million hectares, with a forest coverage rate of 34.78%, Shannan had a forest area of 3.61 million hectares, with a forest coverage rate of 45.61%, and Nyingchi had a forest area of 2.64 million hectares, with a forest coverage rate of 46.09%. The average vegetation cover was over 40%, a relatively favorable natural environmental condition that is superior for human survival and development. The unsuitable areas were predominantly located in the western and northern regions of Tibet, which primarily includes the Chang Tang Plateau and the Himalayan Mountains. These areas are above 4500 m above sea level, with an average pressure of approximately 57.3 kPa and oxygen content of approximately half that near sea level. The average temperature of this area is approximately −7 °C, and vegetation is difficult to grow and fragile in this environment, causing the area to be unsuitable for human occupation. There are low air pressure and oxygen content, which is difficult for long-term human survival and development. In addition, the RDLS in the Himalayan Mountains is up to 1000 [71,72], which has serious implications for human health and amenities.
The average natural environment suitability values of 74 districts and counties were calculated and ranked according to their administrative divisions. The top five counties were (33)Medog, (28)Zayu, (32)Mainling, (46)Cona, and (13)Jomda, and the bottom five counties were (4)Gegyai, (64)Kangmar, (40)Nyima, (34)Amdo, and (43)Shuanghu. In terms of spatial distribution, from northwest to southeast, the suitability of the natural environment of each district and county gradually decreased, as shown in Figure 4a.
The infrastructure development results demonstrate that infrastructure development is predominantly concentrated in the low elevation areas of central Tibet (Figure 3b). By 2018, Tibet had 97,784 km of highways, 38 km of expressways, and 786 km of railways [73]. However, most of the transportation networks are in southern Tibet. In the northern Tibetan Plateau, the average annual temperature is below zero and a large area contains perennial permafrost. Its infrastructure is relatively weak. The complex meteorological and geological conditions plague the development of roads and railways. In addition, there is a weak infrastructure in parts of Shannan, Qamdo, and Nyingchi due to steep mountains and altitude differences of up to 2500 m. This area was the confluence of the Nujiang, Lancang, and Jinsha Rivers, making it difficult to build the infrastructure. The average infrastructure development values of the 74 districts and counties were calculated and ranked according to their administrative divisions. The top five counties were (20)Chengguan, (22)Doilungdeqen, (19)Dagze, (26)Quxu, and (47)Konggar, and the bottom five counties were (46)Cona, (3)Gerze, (34)Amdo, (43)Shuanghu, and (33)Medog. In terms of spatial distribution, the main city is the center and the infrastructure decreases rapidly toward the periphery, as shown in Figure 4b.
The public service evaluation results indicate that the coverage of public services is significantly limited. Although the Tibet Autonomous Region has made great progress in public services, such as education and medical care, in recent years, the spatial distribution is relatively concentrated. In 2018, there were seven higher education institutions with a total of 67,443 full-time teachers and 1,548 medical institutions with a total of 24,018 health technicians in the Tibet Autonomous Region [73]. However, these are predominantly concentrated in the center of the cities (Figure 3c). The level of public services, such as education and health care, is high in the city center and rapidly declines outward. The level of public services between districts and counties varies significantly. The level in the districts and counties in Lhasa is relatively high, among which the top five are (20)Chenguan, (22)Doilungdeqen, (19)Dagze, (26)Quxu, and (71)Samzhubze. On the contrary, the districts and counties far from Lhasa are low, among which, the last five are (34)Amdo, (40)Nyima, (74)Zhongba, (4)Gegyai, and (3)Gerze, as shown in Figure 4c.
The results of the comprehensive evaluation of the human settlement environment demonstrate that the high-suitability region is primarily concentrated in the region of “Yi Jiang Liang He” (i.e., Brahmaputra, Lhasa, and Nianchu Rivers). With the Lhasa–Zedang township circle as the core, the middle and lower reaches of the Niyang River, and the middle and upper reaches of the Brahmaputra as the eastern and western wings, form a highly suitable area. The remaining high-suitability districts are mostly distributed in Shiquanhe Town in the Ali District, Seni District in Nagqu, and Karubu District in Qamdo (Figure 3d). The average environmental suitability for human settlements values of the 74 districts and counties were calculated and ranked according to the administrative divisions. The top five counties were (20)Chengguan, (22)Doilungdeqen, (19)Dagze, (26)Quxu, and (47)Konggar, and the bottom five counties were (6)Rutog, (3)Gerze, (40)Nyima, (34)Amdo, and (43)Shuanghu, as shown in Figure 4d.
The suitability levels of the 74 districts and counties in the three different dimensions of the natural environment, infrastructure development, and public services are not the same, as shown in Figure 5. For example, Chengguan District has a high level of suitability for both infrastructure development and public services, but the natural environment does not stand out. This also proves that it is a combination of factors, rather than a single factor, that affects the environmental suitability of human settlements from another perspective.

3.2. Driving Factors of Human Settlements Environment Suitability

The 14 individual indicators are correlated with the results of the environmental assessment of human settlements, and the correlation coefficients are shown in Table 3. The level of public services had the highest correlation coefficient with the human settlement environment, followed by infrastructure development, and the natural environment had the lowest correlation coefficient. The correlation coefficients of the five individual indicators to describe public services and the human settlement environment were all greater than 0.7 and did not differ significantly. Of the four indicators used to describe infrastructure development, public toilets had the largest correlation coefficient at 0.82, while the five indicators used to describe the natural environment all had correlation coefficients less than 0.6. The main factors affecting the human settlement environment may be the level of public services and infrastructure development, with the natural environment having a reduced impact. The reason for this may be that with socio-economic development, the level of public services rises, infrastructure construction is gradually improved, the level of human transformation and use of nature rises, and the natural environment is no longer the primary factor restricting human development. Every single indicator in public services has a strong correlation with the human habitat environment, indicating that the factors affecting the level of public services are diversified and the improvements should be based on multiple perspectives. The possible reason is that the acceleration of urbanization gradually makes people’s lives more colorful, and people are not only satisfied with material affluence but their spiritual lives are also improved. The infrastructure construction of public toilets and the human settlement environment has a strong correlation, which also confirms that public toilets are emblematic of infrastructure that reflects the level of urban management and civilization. The improvement of the human settlement environment cannot be separated from the development of public sanitation. The smallest correlation coefficient between the topographic changes in the natural environment and the human settlement environment may be due to the large altitude differences throughout Tibet, but the local terrain is relatively flat, and the topography of the entire study area does not change much, so the correlation with the human settlement environment is small. In summary, the factors that are strongly associated with the human environment include the construction of public toilets in infrastructure development and all the factors in public services.

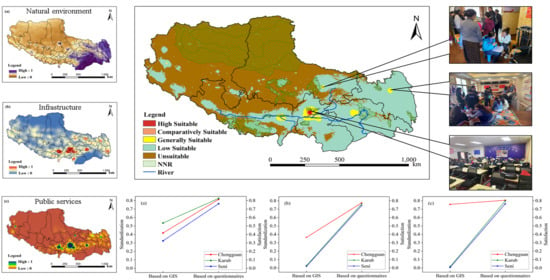
3.3. Spatial Distribution of Different Levels of Human Settlements Environment

The results of the environmental assessment of human settlements were reclassified into five levels of suitability (i.e., high suitable, comparatively suitable, generally suitable, low suitable, and unsuitable) using the natural break classification (NBC) which attempts to minimize the variance within a class and to maximize the variance between classes [74]. The proportion of different suitability levels is shown in Table 4. According to the classification results, only 1.61% of the total area was suitable for human habitation, which is approximately 18,597 km2. The regions are predominantly located in urban built-up areas. The proportion of the low desirable and unsuitable areas in the total area was 98.39%. The level of infrastructure and public services in this area is insufficient and cannot meet the basic living requirements of the residents.
The ecology of the Tibetan Plateau is fragile because it is highly sensitive to climate change and human activity. The expansion of human settlements poses a serious challenge to future nature reserves. From the perspective of national strategy, a series of nature reserves was established in 2000 to resolve the potential conflicts between human settlements and nature reserves [75]. Tibet has the largest area of nature reserves, with a total area of 360,000 km2 at the national level, accounting for 25% of the total area of the national nature reserves. The nature reserves in Tibet include Chang Tang, Qomolangma Mountain, Nam Lake, Cocoa Sicily, and Brahmaputra Grand Canyon, among others [76]. Because large-scale human activities are prohibited in nature reserves, it is necessary to eliminate the nature reserves when conducting adaptive zoning of human settlements. As shown in Figure 6, the environmental suitability of human settlements after the removal of nature reserves was classified into five levels. As shown in Table 4, 87.94% of the nature reserves are in areas that are not suitable for human settlement, and 11.46% are in areas with low suitability. A vast majority of the protected areas are in areas with low suitability for human settlement, which is more conducive to the protection of the nature reserves. According to the classification results, the proportion of land suitable for human habitation increased to 2.05%, while there was a slight decrease in the area to 16,406 km2. The proportion of the low adaptation and unsuitable area of the total area was reduced to 97.95%, with an area decrease of approximately 358,972 km2.

3.4. Reliability and Uncertainty Analysis of Evaluation Results

To verify the accuracy of the assessment results, questionnaires were conducted in three different suitability level regions (i.e., Lhasa, Qamdo, and Nagqu). A total of 21 individual indicators covering the natural environment, infrastructure, and public services (Table S2) were selected to evaluate the residents’ satisfaction with the human settlement environment in 12 communities (Table S3). A total of 300 questionnaires were issued and 293 valid questionnaires were recovered, with an effective recovery rate of 97.67%. The respondents were from all walks of life, with more than 90% being Tibetans with an annual income of less than $10,000 who had lived in Tibet for more than 10 years (Table S4).
The average satisfaction of residents in three different cities with the natural environment, infrastructure, public services, and human settlements was calculated and the results are shown in Figure 7. The results of the objective evaluation demonstrate that the natural environment is not substantially heterogeneous in the three districts, with standardized scores ranging from 0.325 to 0.535. The natural environment in the Kajo District is better than that in the Chengguan and Thani Districts. This is consistent with the subjective satisfaction evaluation shown in Figure 7a. The standardized scores for infrastructure development differ significantly among the three districts, with the Chengguan District having significantly better infrastructure development than the other two districts, as shown in Figure 7b. This may be because the administrative areas of Chengguan, Karub, and Seni are 523 km2, 10,800 km2, and 16,195 km2, respectively. The infrastructure is concentrated only in the inner part of the city, and when averaged over the entire administrative area, the sizes of the districts of Karub and Seni are significantly lower than Chengguan. The results for public services and infrastructure development are similar, as shown in Figure 7c. Although the natural environment of the Lhasa Chengguan District is inferior to the Karub District, its administrative area is small, infrastructure construction and public services are concentrated, and the human settlement environment is significantly better than that of the other districts. Although the difference in the residents’ satisfaction is small, it still shows a trend consistent with the objective evaluation. As shown in Figure 7d, the subjective satisfaction of the residents agrees with the ranking results of the objective evaluation, which verifies the scientific validity of the constructed objective evaluation index system.
The uncertainty evaluation of the human settlement environment primarily includes three aspects. (1) Data source uncertainty. The acquisition and analysis of data are the basis of research; however, the lack of some index data is inevitable during the process of comprehensive evaluation research. In this study, some of the data could not be displayed at a high resolution. In this case, the data must be converted by interpolation or rasterization. In addition, for the data from the questionnaires, the descriptions of the same character data will generate uncertainty due to the difference in subjective cognition. (2) Evolution index uncertainty. The human settlement environment assessment system is a complex comprehensive system involving the natural, economic, and social environments, among other factors. According to the different data sources, there are generally two categories: the assessment system based on the natural environment data and social-economic statistics and the evaluation system based on the questionnaire data. Although the construction of the evaluation system tends to be comprehensive and rational, the subjective differences of the researchers in the selection of indicators lead to the uncertainty of the actual evaluation results. Therefore, there may be inconsistencies in the evaluation results of human settlements in the same region and at the same time. Therefore, in this study, the questionnaire data was used as a supplement to optimize the evaluation system to reduce the uncertainty of the selection of the index system. (3) Weight uncertainty. The diversity of the weighting methods directly leads to the uncertainty of the evaluation results. Weight determination methods usually include expert scoring, the analytic hierarchy process, the entropy weight method, principal component analysis, and neural networks. There is uncertainty in determining weights based on expert experience or on changes in the data itself. Therefore, it is necessary to select the appropriate weight determination method. In this research area, the population is only distributed within a small range. Therefore, the attractiveness of each indicator to the population is used to represent the degree of contribution of the indicator. The weight was determined by the proportion of the correlation coefficient between the population density and index density. Furthermore, the change in the natural environment in the study area is not obvious, which leads to a poor correlation between the natural environment index and population density. Therefore, the weight of the natural environment index is small in the weight assignment.

3.5. Suggestions and Implications

As early as 30,000 years ago, primitive Tibetan inhabitants began to adapt to the low-oxygen environment on the Tibetan plateau [77]. Most of the early settlers of the Qinghai–Tibet Plateau lived along rivers, which is similar to elsewhere in the world [57]. With the gradual change of human life and transportation mode, the distribution of settlements has gradually changed from the distribution along the river to the distribution along the main road [78]. These changes are closely related to the construction of infrastructure and the development of public services. Although Tibet has a vast land area and theoretically more living space, the development of infrastructure and public services has limited the further expansion of living space. Low population density leads to disproportionate input and output of infrastructure construction. Furthermore, the complex geological conditions and the existence of permafrost and nature reserves further limit the advancement of infrastructure.
The optimization of the existing internal structure is a feasible path to improving the human living environment. The Plateau is one of the important windows for human understanding of nature. The preservation of the pristine environment is more valuable than the expansion of human settlements. Rational allocation of urban resources is the key to achieving sustainable urban development. The human settlement environment should be built on existing urban nodes to optimize internal infrastructure, improve public services, and avoid blind expansion.
The Chinese government’s support for investment and counterpart projects in Tibet has effectively alleviated the challenges of addressing sustainability in Tibet compared to cities in other parts of China. The human settlement environment is a complex structure governed by multiple factors. The factors influencing the environmental suitability of human settlements involve many aspects such as natural environment, economic development, resource allocation, and population distribution. The types of influencing factors can be divided into factors that are easy to change, such as infrastructure and public services, and factors that are not easy to change, such as the natural environment [79]. The easy-to-change factors are not consistent from region to region. This leads to an assessment of the current situation of the selected areas before beginning the optimization of the human settlement environment in different regions. Based on the results of the assessment, priority areas for improvement are identified, and then the limited space is fully utilized and the limited resources are rationally allocated to enhance the sustainability of human settlements. This approach not only avoids the accumulation of superior resources in space but also effectively alleviates the imbalance between regions [29].

4. Conclusions

This study introduced a comprehensive assessment framework combining natural environment suitability, infrastructure development, and public services level to assess the human settlements in the plateau area. The environmental distribution pattern of human settlements was revealed from three aspects used the GIS-based multi-criteria analysis method. Furthermore, questionnaires in three different suitability level regions (i.e., Lhasa, Qamdo, and Nagqu) were conducted to verify the reliability of the results. The results reveal the following: (1) According to the correlation analysis between the indicators of the three criteria layers and the distribution of population density, the level of human settlements in Tibet is primarily influenced by the level of public services and the development of infrastructure, with the evaluation weights of 0.49 and 0.45, respectively. The variability of the natural environment between different regions is not significant, and the weight of natural environment suitability is low, only accounting for 0.06. (2) The high suitability region is predominantly concentrated in the region of “Yi Jiang Liang He” (i.e., Brahmaputra, Lhasa, and Nianchu Rivers). These areas are primarily concentrated in urban centers, which is highly consistent with the spatial distribution pattern of urbanization. (3) From the perspective of different suitability levels, the habitable area of the entire study area is considerably small, accounting for only 1.61% of the total area. After removing the national nature reserves that are off-limits to human habitation, the proportion of the habitable area is raised to 2.05%. (4) The subjective satisfaction of the residents in three different suitability level regions basically agrees with the ranking results of the objective evaluation, which verifies the scientific validity of the constructed objective evaluation index system. The evaluation results of this study have some implications for the evaluation of the adaptability of the human living environment in other regions, especially for the formulation of national macro policies in high-altitude regions.
The whole of Tibet shows the spatial structure of poly-center. The special natural conditions and weak infrastructure development in Tibet lead to the fact that some areas are still dependent on rivers for water for production and living. The flat terrain and abundant water supply of “Yi Jiang Liang He”(i.e., Brahmaputra, Lhasa, and Nianchu Rivers) provide a guarantee for human survival. Xigaze Samzhubze district Urban Circle in the middle and upper reaches of the Brahmaputra, Lhasa–Nedong district Urban Circle in the middle reaches of the Brahmaputra, and Nyingchi Bayip district Urban Circle in the middle and lower reaches of the Brahmaputra show a belt-like distribution along the Brahmaputra. This area has a concentrated population and rapid economic development. Ngari Shiquanhe town, Nagqu Seni district, and Chamdo Karub district are responsible for the functions of the urban circle of western Tibet, northern Tibet, and eastern Tibet, respectively.
As stated in the 2030 Agenda for Sustainable Development, “no one will be left behind” [80], Tibet is also actively moving towards the UN Sustainable Development Goals. Gradually strengthening the optimization of the internal structure of key cities and adjusting resource allocation patterns are important measures to improving the environmental quality of human settlements and achieving sustainable development, which is of great significance to the well-being of residents. In recent years, Tibet’s infrastructure has been gradually improved, enhancing its links with other regions. Inter-regional communication has become more convenient and has given new power to sustainable development. The framework of this study provides a more comprehensive assessment method for human settlements environment, but further work is needed to make this work more systematic:
(1)
Although the spatial changes of the human settlement environment have been identified in this study, the understanding of time-series changes is not deep enough. Future studies will focus on the time scale changes of the human settlement environment to provide more precise guidance for sustainable development goals.
(2)
In addition to studying the spatial differentiation of the existing human settlement environment, we should also understand the subjective needs of local people, as the ultimate beneficiaries of sustainable human settlements are local inhabitants.

Supplementary Materials

The following are available online at https://www.mdpi.com/2071-1050/13/3/1485/s1, Table S1 Correlation coefficients of the indicators with population density, Table S2 Questionnaire setting and assignment, Table S3 The distribution of questionnaires, Table S4 Statistical information of questionnaires.

Author Contributions

B.S. conceived the idea. Y.D. designed the study and analyzed the data. G.S., Q.L. and J.M. contributed to the interpretation and manuscript writing. Y.J., Y.Q., and L.D. contributed to the visualization and investigation. S.S. revised the paper. All authors reviewed the manuscript. All authors have read and agreed to the published version of the manuscript.

Funding

This research was funded by the Second Tibetan Plateau Scientific Expedition and Research (STEP) program, grant number No.2019QZKK0682.

Institutional Review Board Statement

Not applicable. This study did not involve humans or animals research.

Informed Consent Statement

Not applicable. This study did not involve humans research.

Data Availability Statement

Publicly available datasets were analyzed in this study. This data can be found on the website in Table 2.

Acknowledgments

We would also like to acknowledge support from the office of the Second Comprehensive Scientific Expedition to the Qinghai–Tibet Plateau of the Tibet Autonomous Region.

Conflicts of Interest

The authors declare no conflict of interest. The founding sponsors had no role in the design of the study; in the collection, analyses, or interpretation of data; in the writing of the manuscript; or in the decision to publish the results.

References

  1. Xiong, Y. Uncertainty evaluation of the coordinated development of urban human settlement environment and economy in Changsha city. J. Geogr. Sci. 2011, 21, 1123–1137. [Google Scholar] [CrossRef]
  2. Zheng, D.F.; Zhang, Y.; Zang, Z.; Sun, C.Z. Empirical research on carrying capacity of human settlement system in Dalian City, Liaoning Province, China. Chin. Geogr. Sci. 2014, 25, 237–249. [Google Scholar] [CrossRef]
  3. Doxiadis, C.A. Ekistics, the Science of Human Settlements. Science 1970, 170, 393–404. [Google Scholar] [CrossRef] [PubMed] [Green Version]
  4. United Nations (UN). The United Nations Conference on the Human Environment (The Stockholm Conference). Stockholm, Sweden, 5–16 June 1972. Available online: https://www.un.org/en/conferences/environment/stockholm1972 (accessed on 15 October 2020).
  5. United Nations (UN). The United Nations Conference on Human Settlements (Habitat I). Vancouver, BC, Canada, 31 May–11 June 1976. Available online: http://habitat1.org/ (accessed on 15 October 2020).
  6. United Nations (UN). The Second United Nations Conference on Human Settlements (Habitat II). Istanbul, Turkey, 3–14 June 1996. Available online: http://habitat2.org/ (accessed on 15 October 2020).
  7. United Nations (UN). The United Nations Conference on Housing and Sustainable Urban Development (Habitat III). Quito, Ecuador, 17–20 October 2016. Available online: https://habitat3.org/ (accessed on 15 October 2020).
  8. United Nations (UN). Available online: https://www.un.org/zh/documents/treaty/files/A-RES-71-256.shtml (accessed on 7 January 2021).
  9. Wang, Y.; Jin, C.; Lu, M.Q.; Lu, Y.Q. Assessing the suitability of regional human settlements environment from a different preferences perspective: A case study of Zhejiang Province. China Habitat Int. 2017, 70, 1–12. [Google Scholar] [CrossRef]
  10. Liang, L.; Deng, X.Z.; Wang, P.; Wang, Z.H.; Wang, L.S. Assessment of the impact of climate change on cities livability in China. Sci. Total Environ. 2020, 726, 138339. [Google Scholar] [CrossRef]
  11. Bathrellos, G.D.; Skilodimou, H.D.; Chousianitis, K.; Youssef, A.M.; Pradhan, B. Suitability estimation for urban development using multi-hazard assessment map. Sci. Total Environ. 2017, 575, 119–134. [Google Scholar] [CrossRef]
  12. Ma, R.F.; Wang, T.F.; Zhang, W.Z.; Yu, J.H.; Wang, D.; Chen, L.; Jiang, Y.P.; Feng, G.Q. Overview and progress of Chinese geographical human settlement research. J. Geogr. Sci. 2016, 26, 1159–1175. [Google Scholar] [CrossRef]
  13. Song, F.; Yang, X.H.; Wu, F.F. Suitable Pattern of the Natural Environment of Human Settlements in the Lower Reaches of the Yangtze River. Atmosphere 2019, 10, 200. [Google Scholar] [CrossRef] [Green Version]
  14. Tian, S.Z.; Li, X.M.; Li, H.; Zhang, Y.J.; Bao, T.L.G. Initial Evaluation of Provincial-Level Environmental Risks from the Perspective of Human Settlements. Sustainability 2016, 8, 1259. [Google Scholar] [CrossRef] [Green Version]
  15. Tang, L.S.; Ruth, M.; He, Q.Y.; Mirzaee, S. Comprehensive evaluation of trends in human settlements quality changes and spatial differentiation characteristics of 35 Chinese major cities. Habitat Int. 2017, 70, 81–90. [Google Scholar] [CrossRef]
  16. Mahmoudi, M.; Ahmad, F.; Abbasi, B. Livable streets: The effects of physical problems on the quality and livability of Kuala Lumpur streets. Cities 2015, 43, 104–114. [Google Scholar] [CrossRef]
  17. Chen, Y.; Lü, B.; Chen, R.S. Evaluating the life satisfaction of peasants in concentrated residential areas of Nanjing, China: A fuzzy approach. Habitat Int. 2016, 53, 556–568. [Google Scholar] [CrossRef]
  18. Zhao, X.; Sun, H.B.; Chen, B.; Xia, X.H.; Li, P.F. China’s rural human settlements: Qualitative evaluation, quantitative analysis and policy implications. Ecol. Indic. 2019, 105, 398–405. [Google Scholar] [CrossRef]
  19. Bonaiuto, M.; Fornara, F.; Ariccio, S.; Ganucci, C.U.; Rahimi, L. Perceived Residential Environment Quality Indicators (PREQIs) relevance for UN-HABITAT City Prosperity Index (CPI). Habitat Int. 2015, 45, 53–63. [Google Scholar] [CrossRef]
  20. Wang, H.F.; Chiou, S.C. Study on the Sustainable Development of Human Settlement Space Environment in Traditional Villages. Sustainability 2019, 11, 4186. [Google Scholar] [CrossRef] [Green Version]
  21. Zolekar, R.B.; Bhagat, V.S. Multi-criteria land suitability analysis for agriculture in hilly zone: Remote sensing and GIS approach. Comput. Electron. Agric. 2015, 118, 300–321. [Google Scholar] [CrossRef]
  22. Bober, A.; Calka, B.; Bielecka, E. Application of state survey and mapping resources for selecting sites suitable for solar farms. In Proceedings of the 16th International Multidisciplinary Scientific GeoConferences: SGEM, Albena, Bulgaria, 28 June–6 July 2016; Volume 1, pp. 593–600, ISBN 978-619-7105-58-2. [Google Scholar] [CrossRef]
  23. Zhu, J.S.; Tian, S.F.; Tan, K.; Du, P.J. Human settlement analysis based on multi-temporal remote sensing data: A case study of Xuzhou City, China. Chin. Geogr. Sci. 2016, 26, 389–400. [Google Scholar] [CrossRef] [Green Version]
  24. Feng, Z.M.; Yang, Y.Z.; Zhang, D.; Tang, Y. Natural environment suitability for human settlements in China based on GIS. J. Geogr. Sci. 2009, 19, 437–446. [Google Scholar] [CrossRef]
  25. Li, Y.C.; Liu, C.X.; Zhang, H.; Gao, X. Evaluation on the human settlements environment suitability in the Three Gorges Reservoir Area of Chongqing based on RS and GIS. J. Geogr. Sci. 2011, 21, 346–358. [Google Scholar] [CrossRef]
  26. Wei, W.; Shi, P.J.; Zhou, J.J.; Feng, H.C.; Wang, X.F.; Wang, X.P. Environmental suitability evaluation for human settlements in an arid inland river basin: A case study of the Shiyang River Basin. J. Geogr. Sci. 2013, 23, 331–343. [Google Scholar] [CrossRef]
  27. Maimaiti, A.; Wang, L.M.; Zhang, J.; Song, Z.L. Environmental suitability evaluation for human settlements in Bosten Lake Basin. IOP Conf. Ser. Earth Environ. Sci. 2017, 57, 012008. [Google Scholar] [CrossRef]
  28. Zhang, Y.L.; Fan, Q. The Application of the Fuzzy Analytic Hierarchy Process in the Assessment and Improvement of the Human Settlement Environment. Sustainability 2020, 12, 1563. [Google Scholar] [CrossRef] [Green Version]
  29. Yang, W.P.; Zhao, J.K.; Zhao, K. Analysis of Regional Difference and Spatial Influencing Factors of Human Settlement Ecological Environment in China. Sustainability 2018, 10, 1520. [Google Scholar] [CrossRef] [Green Version]
  30. Tian, S.Z.; Li, X.M.; Yang, J.; Zhang, C.H.; Zhang, Y. Initial Study on Triaxiality of Human Settlements—In the Case of 10 Districts (Counties) of Dalian. Sustainability 2014, 6, 7276–7291. [Google Scholar] [CrossRef] [Green Version]
  31. Halik, W.; Mamat, A.; Dang, J.H.; Deng, B.S.H.; Tiyip, T. Suitability analysis of human settlement environment within the Tarim Basin in Northwestern China. Quat. Int. 2013, 311, 175–180. [Google Scholar] [CrossRef]
  32. Grimminger, J.; Richter, M.; Tello, K.; Sommer, N.; Gall, H.; Ghofrani, H.A. Thin Air Resulting in High Pressure: Mountain Sickness and Hypoxia-Induced Pulmonary Hypertension. Can. Respir. J. 2017, 2017, 8381653. [Google Scholar] [CrossRef]
  33. Li, P.; Peng, C.H.; Wang, M.; Luo, Y.P.; Li, M.X.; Zhang, K.R.; Zhang, D.L.; Zhu, Q.A. Dynamics of vegetation autumn phenology and its response to multiple environmental factors from 1982 to 2012 on Qinghai-Tibetan Plateau in China. Sci. Total Environ. 2018, 637–638, 855–864. [Google Scholar] [CrossRef]
  34. Zu, J.X.; Zhang, Y.J.; Huang, K.; Liu, Y.J.; Chen, N.; Cong, N. Biological and climate factors co-regulated spatial-temporal dynamics of vegetation autumn phenology on the Tibetan Plateau. Int. J. Appl. Earth. Obs. Geoinf. 2018, 69, 198–205. [Google Scholar] [CrossRef]
  35. Zhao, J.; Xu, M.; Lu, S.L.; Cao, C.X. Human settlement evaluation in mountain areas based on remote sensing, GIS and ecological niche modeling. J. Mt. Sci. 2013, 10, 378–387. [Google Scholar] [CrossRef]
  36. Tang, W.; Zhou, T.C.; Sun, J.; Li, Y.R.; Li, W.P. Accelerated Urban Expansion in Lhasa City and the Implications for Sustainable Development in a Plateau City. Sustainability 2017, 9, 1499. [Google Scholar] [CrossRef] [Green Version]
  37. Sun, J.; Wang, X.D.; Cheng, G.W.; Wu, J.B.; Hong, J.T.; Niu, S.L. Effects of grazing regimes on plant traits and soil nutrients in an alpine steppe, Northern Tibetan Plateau. PLoS ONE 2014, 9, e108821. [Google Scholar] [CrossRef] [PubMed] [Green Version]
  38. Nie, M.J.; Fan, C.Q.; Sun, R.Z.; Wang, J.J.; Feng, Q.; Zhang, Y.F.; Yao, Z.; Wang, M. Accelerometer-Measured Physical Activity in Children and Adolescents at Altitudes over 3500 Meters: A Cross-Sectional Study in Tibet. Int. J. Environ. Res. Public Health 2019, 16, 686. [Google Scholar] [CrossRef] [Green Version]
  39. Riley, C.J.; Gavin, M. Physiological Changes to the Cardiovascular System at High Altitude and Its Effects on Cardiovascular Disease. High Alt. Med. Biol. 2017, 18, 102–113. [Google Scholar] [CrossRef]
  40. Pham, L.V.; Meinzen, C.; Arias, R.S.; Schwartz, N.G.; Rattner, A.; Miele, C.H.; Smith, P.L.; Schneider, H.; Miranda, J.J.; Gilman, R.H.; et al. Cross-Sectional Comparison of Sleep-Disordered Breathing in Native Peruvian Highlanders and Lowlanders. High Alt. Med. Biol. 2017, 18, 11–19. [Google Scholar] [CrossRef] [PubMed]
  41. Parati, G.; Ochoa, J.E.; Torlasco, C.; Salvi, P.; Lombardi, C.; Bilo, G. Aging, High Altitude, and Blood Pressure: A Complex Relationship. High Alt. Med. Biol. 2015, 16, 97–109. [Google Scholar] [CrossRef] [PubMed]
  42. Grimm, C.; Willmann, G. Hypoxia in the Eye: A Two-Sided Coin. High Alt. Med. Biol. 2012, 13, 169–175. [Google Scholar] [CrossRef] [PubMed] [Green Version]
  43. Central People’s Government of the People’s Republic of China. Healthy China 2030 Planning Outline. 2016. Available online: http://www.gov.cn/zhengce/2016-10/25/content_5124174.htm (accessed on 12 October 2020).
  44. Xin, S.; Sun, C.Y.; Li, M. Comparative study on the optimization strategies of the human settlement environment of the rural settlements in Asia. IOP Conf. Ser. Earth Env. Sci. 2017, 61, 012045. [Google Scholar] [CrossRef] [Green Version]
  45. McKenna, T.; Blaney, R.; Brooker, R.W.; Ewing, D.A.; Pakeman, R.J.; Watkinson, P.; O’Brien, D. Scotland’s natural capital asset index: Tracking nature’s contribution to national wellbeing. Ecol. Indic. 2019, 107, 105645. [Google Scholar] [CrossRef]
  46. Wang, G.Q.; Bai, Z.X.; Shi, J.; Luo, S.; Chang, H.F.; Sai, X.Y. Prevalence and risk factors for eye diseases, blindness, and low vision in Lhasa, Tibet. Int. J. Ophthalmol. 2013, 6, 237–241. [Google Scholar] [CrossRef]
  47. Zhang, J.J.; Zhu, W.B.; Zhu, L.Q.; Cui, Y.P.; He, S.S.; Ren, H. Topographical relief characteristics and its impact on population and economy: A case study of the mountainous area in western Henan, China. J. Geogr. Sci. 2019, 29, 598–612. [Google Scholar] [CrossRef] [Green Version]
  48. Feng, Z.M.; Tang, Y.; Yang, Y.Z.; Zhang, D. Relief degree of land surface and its influence on population distribution in China. J. Geogr. Sci. 2008, 18, 237–246. [Google Scholar] [CrossRef]
  49. Lee, A.C.K.; Jordan, H.C.; Horsley, J. Value of urban green spaces in promoting healthy living and wellbeing: Prospects for planning. Risk Manag. Healthc. Policy. 2015, 8, 131–137. [Google Scholar] [CrossRef] [PubMed] [Green Version]
  50. Chi, W.F.; Jia, J.; Pan, T.; Jin, L.; Bai, X.L. Multi-Scale Analysis of Green Space for Human Settlement Sustainability in Urban Areas of the Inner Mongolia Plateau, China. Sustainability 2020, 12, 6783. [Google Scholar] [CrossRef]
  51. Mears, M.; Brindley, P.; Jorgensen, A.; Ersoy, E.; Maheswaran, R. Greenspace spatial characteristics and human health in an urban environment: An epidemiological study using landscape metrics in Sheffield, UK. Ecol. Indic. 2019, 106, 105464. [Google Scholar] [CrossRef]
  52. Engemann, K.; Pedersen, C.B.; Arge, L.; Tsirogiannis, C.; Mortensen, P.B.; Svenning, J.C. Residential green space in childhood is associated with lower risk of psychiatric disorders from adolescence into adulthood. Proc. Natl. Acad. Sci. USA 2019, 116, 5188–5193. [Google Scholar] [CrossRef] [Green Version]
  53. World Health Organization. Urban Green Spaces and Health—A Review of the Evidence. WHO Regional Office for Europe, Copenhagen. 2016. Available online: https://www.euro.who.int/__data/assets/pdf_file/0005/321971/Urban-green-spaces-and-health-review-evidence.pdf?ua=1 (accessed on 6 November 2020).
  54. Dou, Y.; Kuang, W.H. A comparative analysis of urban impervious surface and green space and their dynamics among 318 different size cities in China in the past 25 years. Sci. Total Environ. 2020, 706, 135828. [Google Scholar] [CrossRef]
  55. Jain, K.; Suryakumar, G.; Prasad, R.; Ganju, L. Upregulation of Cytoprotective Defense Mechanisms and Hypoxia-Responsive Proteins Imparts Tolerance to Acute Hypobaric Hypoxia. High Alt. Med. Biol. 2013, 14, 65–77. [Google Scholar] [CrossRef]
  56. Bertuzzo, E.; Maritan, A.; Gatto, M.; Rodriguez-Iturbe, I.; Rinaldo, A. River networks and ecological corridors: Reactive transport on fractals, migration fronts, hydrochory. Water Resour. Res. 2007, 43, W04419. [Google Scholar] [CrossRef]
  57. Fang, Y.; Ceola, S.; Paik, K.; McGrath, G.; Rao, P.S.C.; Montanari, A.; Jawitz, J.W. Globally Universal Fractal Pattern of Human Settlements in River Networks. Earth’s Future 2018, 6, 1134–1145. [Google Scholar] [CrossRef] [Green Version]
  58. Ceola, S.; Laio, F.; Montanari, A. Human-impacted waters: New perspectives from global high-resolution monitoring. Water Resour. Res. 2015, 51, 7064–7079. [Google Scholar] [CrossRef]
  59. Hasan, S.; Wang, X.; Khoo, Y.B.; Foliente, G. Accessibility and socio-economic development of human settlements. PLoS ONE 2017, 12, e0179620. [Google Scholar] [CrossRef] [PubMed] [Green Version]
  60. Wey, W.M.; Zhang, H.; Chang, Y.J. Alternative transit-oriented development evaluation in sustainable built environment planning. Habitat Int. 2016, 55, 109–123. [Google Scholar] [CrossRef]
  61. Wey, W.M.; Huang, J.Y. Urban sustainable transportation planning strategies for livable City’s quality of life. Habitat Int. 2018, 82, 9–27. [Google Scholar] [CrossRef]
  62. Wey, W.M. Smart growth and transit-oriented development planning in site selection for a new metro transit station in Taipei, Taiwan. Habitat Int. 2015, 47, 158–168. [Google Scholar] [CrossRef]
  63. Wang, Y.; Peng, Z.Y.; Chen, Q. The choice of residential layout in urban China: A comparison of transportation and land use in Changsha (China) and Leeds (UK). Habitat Int. 2018, 75, 50–58. [Google Scholar] [CrossRef]
  64. Li, F.; Yan, Q.W.; Bian, Z.F.; Liu, B.L.; Wu, Z.H. A POI and LST Adjusted NTL Urban Index for Urban Built-Up Area Extraction. Sensors 2020, 20, 2918. [Google Scholar] [CrossRef]
  65. Cheng, G.; Zeng, X.K.; Duan, L.; Lu, X.P.; Sun, H.C.; Jiang, T.; Li, Y.L. Spatial difference analysis for accessibility to high level hospitals based on travel time in Shenzhen, China. Habitat Int. 2016, 53, 485–494. [Google Scholar] [CrossRef] [Green Version]
  66. Yin, C.H.; He, Q.S.; Liu, Y.F.; Chen, W.Q.; Gao, Y. Inequality of public health and its role in spatial accessibility to medical facilities in China. Appl. Geogr. 2018, 92, 50–62. [Google Scholar] [CrossRef]
  67. Wen, H.Z.; Xiao, Y.; Hui, E.C.M.; Zhang, L. Education quality, accessibility, and housing price: Does spatial heterogeneity exist in education capitalization? Habitat Int. 2018, 78, 68–82. [Google Scholar] [CrossRef]
  68. Schirpke, U.; Timmermann, F.; Tappeiner, U.; Tasser, E. Cultural ecosystem services of mountain regions: Modelling the aesthetic value. Ecol. Indic. 2016, 69, 78–90. [Google Scholar] [CrossRef] [PubMed] [Green Version]
  69. You, Z.; Feng, Z.M.; Yang, Y.Z.; Shi, H.; Li, P. Evaluation of human settlement environmental suitability in Tibet based on gridded data. Resour. Sci. 2020, 42, 394–406. (In Chinese) [Google Scholar] [CrossRef]
  70. Tang, Y.; Feng, Z.M.; Yang, Y.Z. Evaluation of Climate Suitability for Human Settlement in China. Resour. Sci. 2008, 5, 648–653. (In Chinese) [Google Scholar]
  71. Feng, Z.M.; Tang, Y.; Yang, Y.Z.; Zhang, D. The Relief Degree of Land Surface in China and Its Correlation with Population Distribution. Acta Geogr. Sini. 2007, 10, 1073–1082. (In Chinese) [Google Scholar]
  72. Zhang, W.; Li, A.N. Study on the optimal scale for calculating the relief amplitude in China based on DEM. Geogr. Geo-Inf. Sci. 2012, 4, 8–12. (In Chinese) [Google Scholar]
  73. Tibet Autonomous Region Statistics Bureau, Tibet Statistical Yearbook; China Statistics Press: Beijing, China, 2019.
  74. Mamat, A.; Halik, U.; Rouzi, A. Spatial Evaluation of Environmental Suitability for Human Settlements Based on GIS: A Case Study in Kaidu River Basin, Northwest China. Fresenius Environ. Bull. 2018, 27, 132–140. [Google Scholar]
  75. Yang, J.Y.; Yang, J.; Luo, X.Y.; Huang, C.H. Impacts by expansion of human settlements on nature reserves in China. J. Environ. Manag. 2019, 248, 109233. [Google Scholar] [CrossRef]
  76. Li, S.C.; Wu, J.S.; Gong, J.; Li, S.W. Human footprint in Tibet: Assessing the spatial layout and effectiveness of nature reserves. Sci. Total Environ. 2018, 621, 18–29. [Google Scholar] [CrossRef]
  77. Qi, X.; Cui, C.; Ouzhuluobu; Wu, T.; Su, B. Prehistoric Colonization and Demographic History of Modern Humans on the Tibetan Plateau; John Wiley & Sons, Ltd.: Hoboken, NJ, USA, 2014; ISBN 9780470015902. [Google Scholar]
  78. Qiao, F.W.; Bai, Y.P.; Zhou, L.; Che, L.; Wang, F. Spatial differentiation characteristics and influencing factors of urban and rural settlements in Tibet, China. J. Appl. Ecol. 2019, 30, 3544–3552. [Google Scholar] [CrossRef]
  79. Zhang, T.; Ding, B.Y.; Hu, Q.N.; Liu, Y.Y.; Zhou, D.; Gao, W.J.; Fukuda, H. Research on Regional System Planning Method of Rural Habitat in Gully Regions of the Loess Plateau, under the Background of Rural Vitalization Strategy in China. Sustainability 2020, 12, 3317. [Google Scholar] [CrossRef] [Green Version]
  80. United Nations (UN). Sustainable Development Goals. Available online: https://www.un.org/sustainabledevelopment/zh/development-agenda/ (accessed on 15 October 2020).
Figure 1. Location of the study area.
Sustainability 13 01485 g001
Figure 2. The evaluation process of human settlements environment.
Sustainability 13 01485 g002
Figure 3. Spatial distribution of the suitability of (a) natural environment, (b) infrastructure, (c) public services, and (d) overall human settlements environment.
Sustainability 13 01485 g003
Figure 4. Spatial distribution of the suitability of (a) natural environment, (b) infrastructure, (c) public services, and (d) overall human settlements environment at the county level.
Sustainability 13 01485 g004
Figure 5. Ranking of the natural environment, infrastructure, public services, and the overall human settlements environment by district and county.
Sustainability 13 01485 g005
Figure 6. Suitability classification of human settlements environment after removal of national nature reserves, (a) Xigaze Samzhubze District Urban Circle, (b) Lhasa–Nedong District Urban Circle, (c) Nyingchi Bayip District Urban Circle, (d) Ngari Shiquanhe Town Urban Circle, (e) Nagqu Seni District Urban Circle, and (f) Chamdo Karub District Urban Circle.
Sustainability 13 01485 g006
Figure 7. Comparison of evaluation results from different perspectives, including (a) natural environment, (b) infrastructure, (c) public services, and (d) overall human settlements environment.
Sustainability 13 01485 g007
Table 1. Evaluation dimensions and index of human settlements environment.
TargetIndexWeightClassificationWeightIndicator Attribute
Evaluation of human
settlements environment
Natural environment system0.06RDLS0.05
THI0.16+
NDVI0.19+
Barometric pressure0.37+
River density0.23+
Infrastructure system0.45Road density0.12+
Public restrooms0.25+
Parking lot0.33+
Life facility0.3+
Public services system0.49Education services0.24+
Medical services0.19+
Business services0.21+
Sports and leisure services0.22+
Scenic area0.14+
Note: “+” represents the indicators that are beneficial to the environmental quality of human settlements, “−” represents the indicators that are harmful to the environmental quality of human settlements.
Table 2. Description of the data used in this study.
DataData DescriptionFormulaSource
NDVIRaster dataNDVI = (NIR − R)/(NIR + R)Resource and Environment Science and Data Center, (http://www.resdc.cn/)
DEMRaster data
POIPoints-of-interestKernel Density
RiversVector dataLine Density
Barometric pressureRaster data National Meteorological Science Data Center, (http://data.cma.cn/)
TemperatureRaster dataTHI = T − 0.55(1 − f)(1.8t − 26), T = 1.8t + 32
RoadsVector dataLine DensityOpen Street Map Data, (https://download.geofabrik.de/)
GDPRaster data National Earth System Science Data Center, (http://www.geodata.cn/)
PopulationRaster data
HumidityRaster data
RDLSRaster dataRDLS = ALT/1000 + {[Max(H) − Min(H)] × [1 − P(A)/A]}/500Global Change Research Data Publishing & Repository, (http://www.geodoi.ac.cn/)
Socio-economic development dataNumerical data China Statistical Yearbook; Tibet Statistical Yearbook; Tibet Health Statistics Yearbook, (https://kns.cnki.net/)
Table 3. Correlation coefficients of the indicators with HSE.
LayerCCLayerCCLayerCC
Natural environment0.518Infrastructure0.853Public services0.885
RDLS0.011Road density0.694Education0.770
THI0.417Public restroom0.818Medical0.818
NDVI0.479Parking lot0.400Business0.775
Barometric pressure0.320Life facility0.328Sports and leisure0.773
River density0.409 Scenic area0.789
Table 4. Area and proportion of different suitability levels.
Suitability LevelSuitability Index RangeTheoretical Area (km2)Percent (%) 1NNR (km2)Percent (%) 2Practical Area (km2)Percent (%) 3
High suitable area0.449–1.0006440.06260.016180.08
Comparatively suitable area0.199–0.44912320.112790.089530.12
Generally suitable area0.066–0.19916,7211.4418860.5214,8351.85
Low suitable area0.023–0.066428,91936.9641,38111.46387,53848.48
Unsuitable area0.000–0.023713,04161.44317,59187.94395,45049.47
Notes: 1. Proportion of the theoretical area at different suitability levels; 2. Proportion of the National Nature Reserve area at different suitability levels; 3. Proportion of the practical area at different suitability levels.
Publisher’s Note: MDPI stays neutral with regard to jurisdictional claims in published maps and institutional affiliations.

