
Integrated Impact Assessment for Sustainable Hydropower Planning in the Vjosa Catchment (Greece, Albania)

 , ,
, ,
Abstract
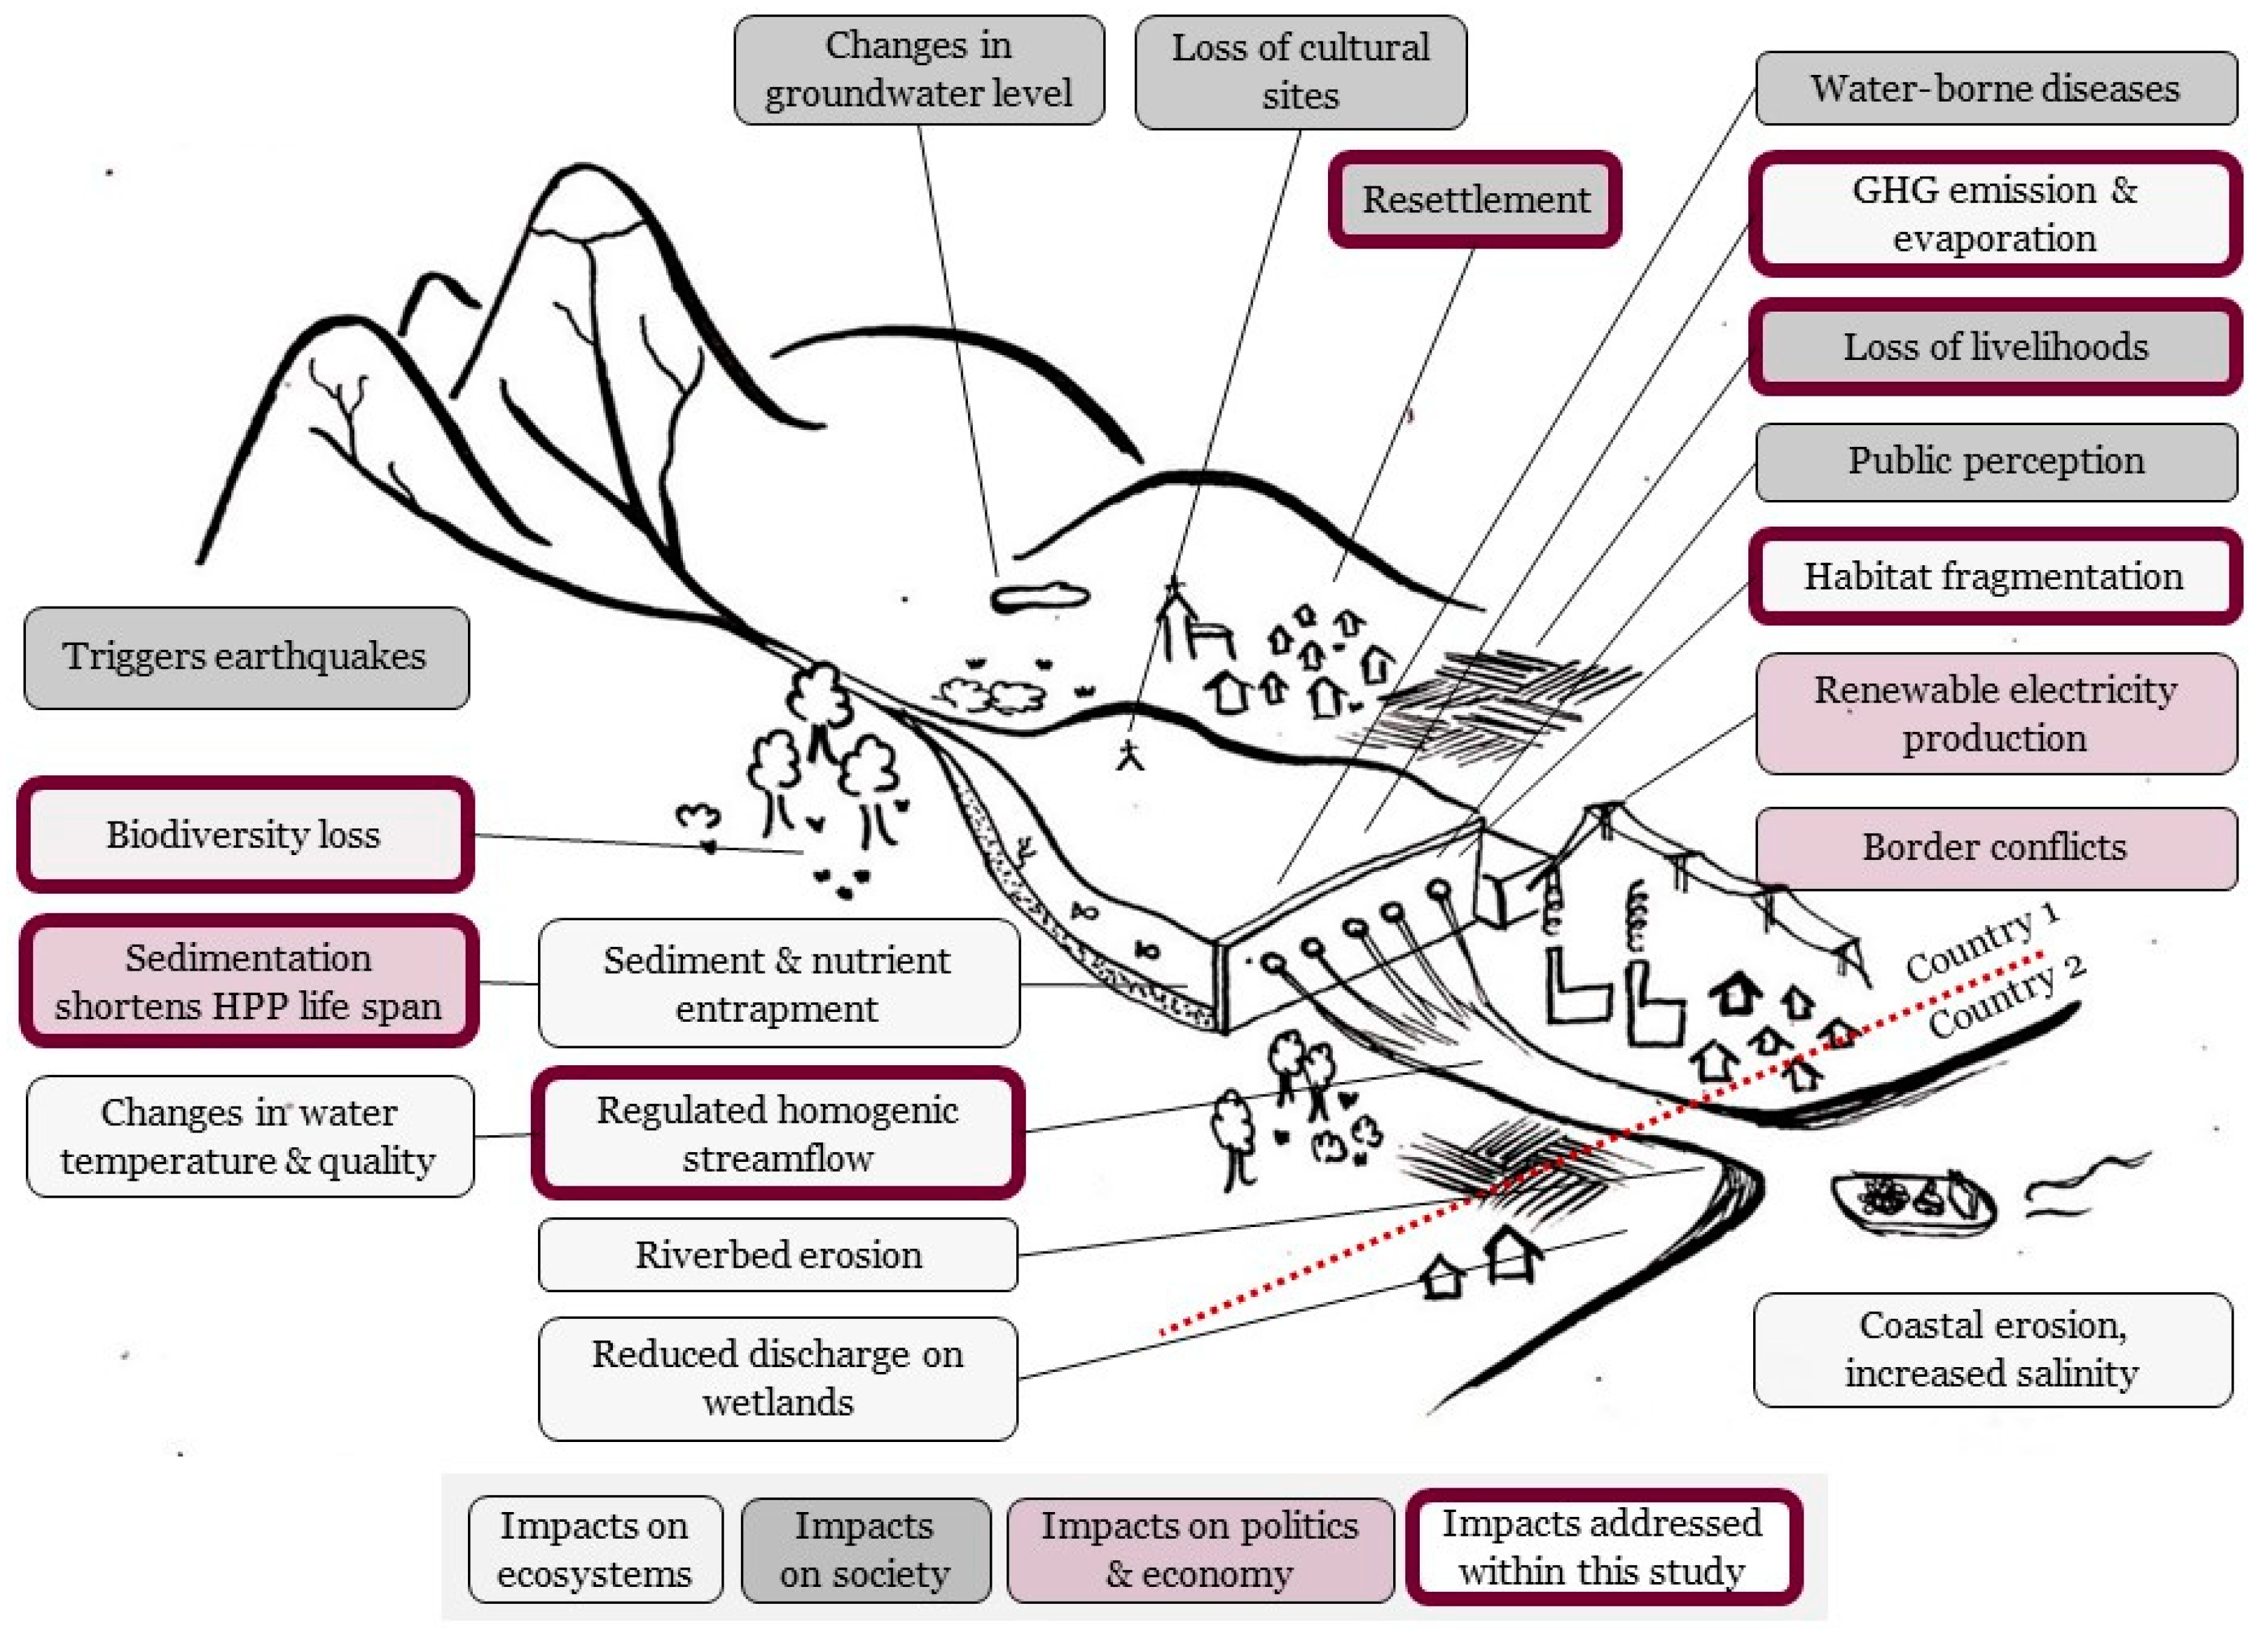
1. Introduction
2. Materials and Methods
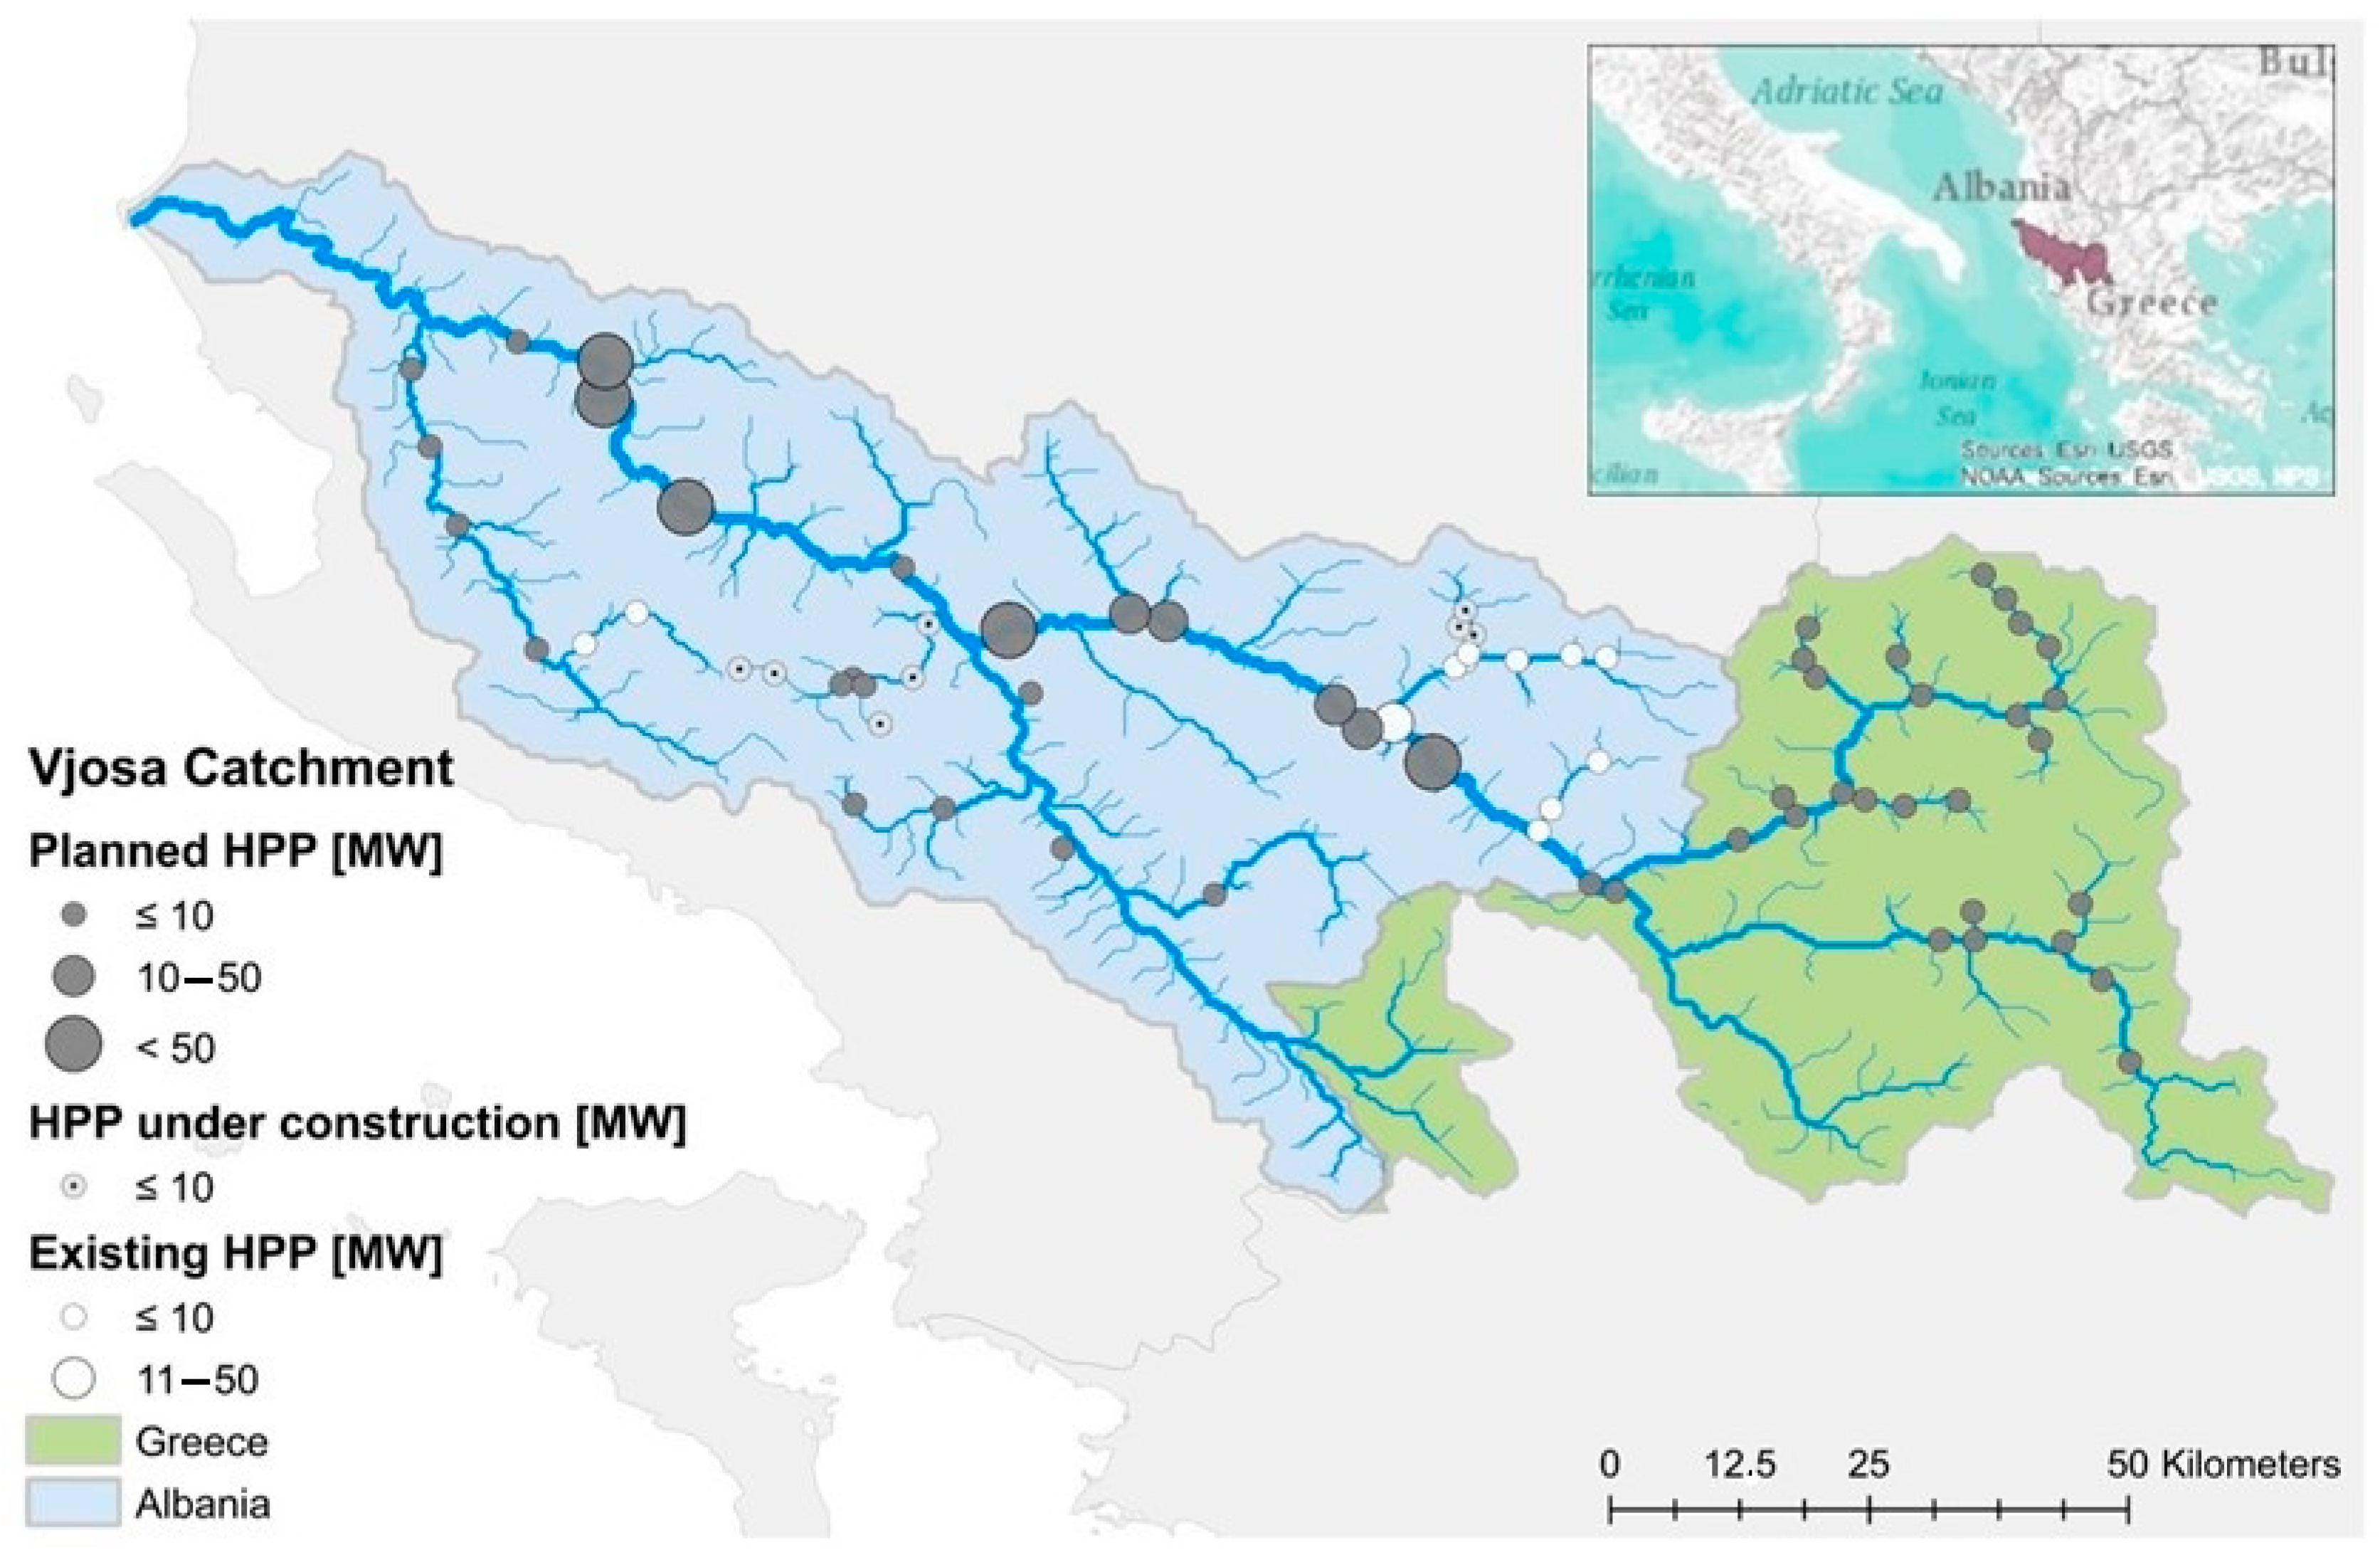
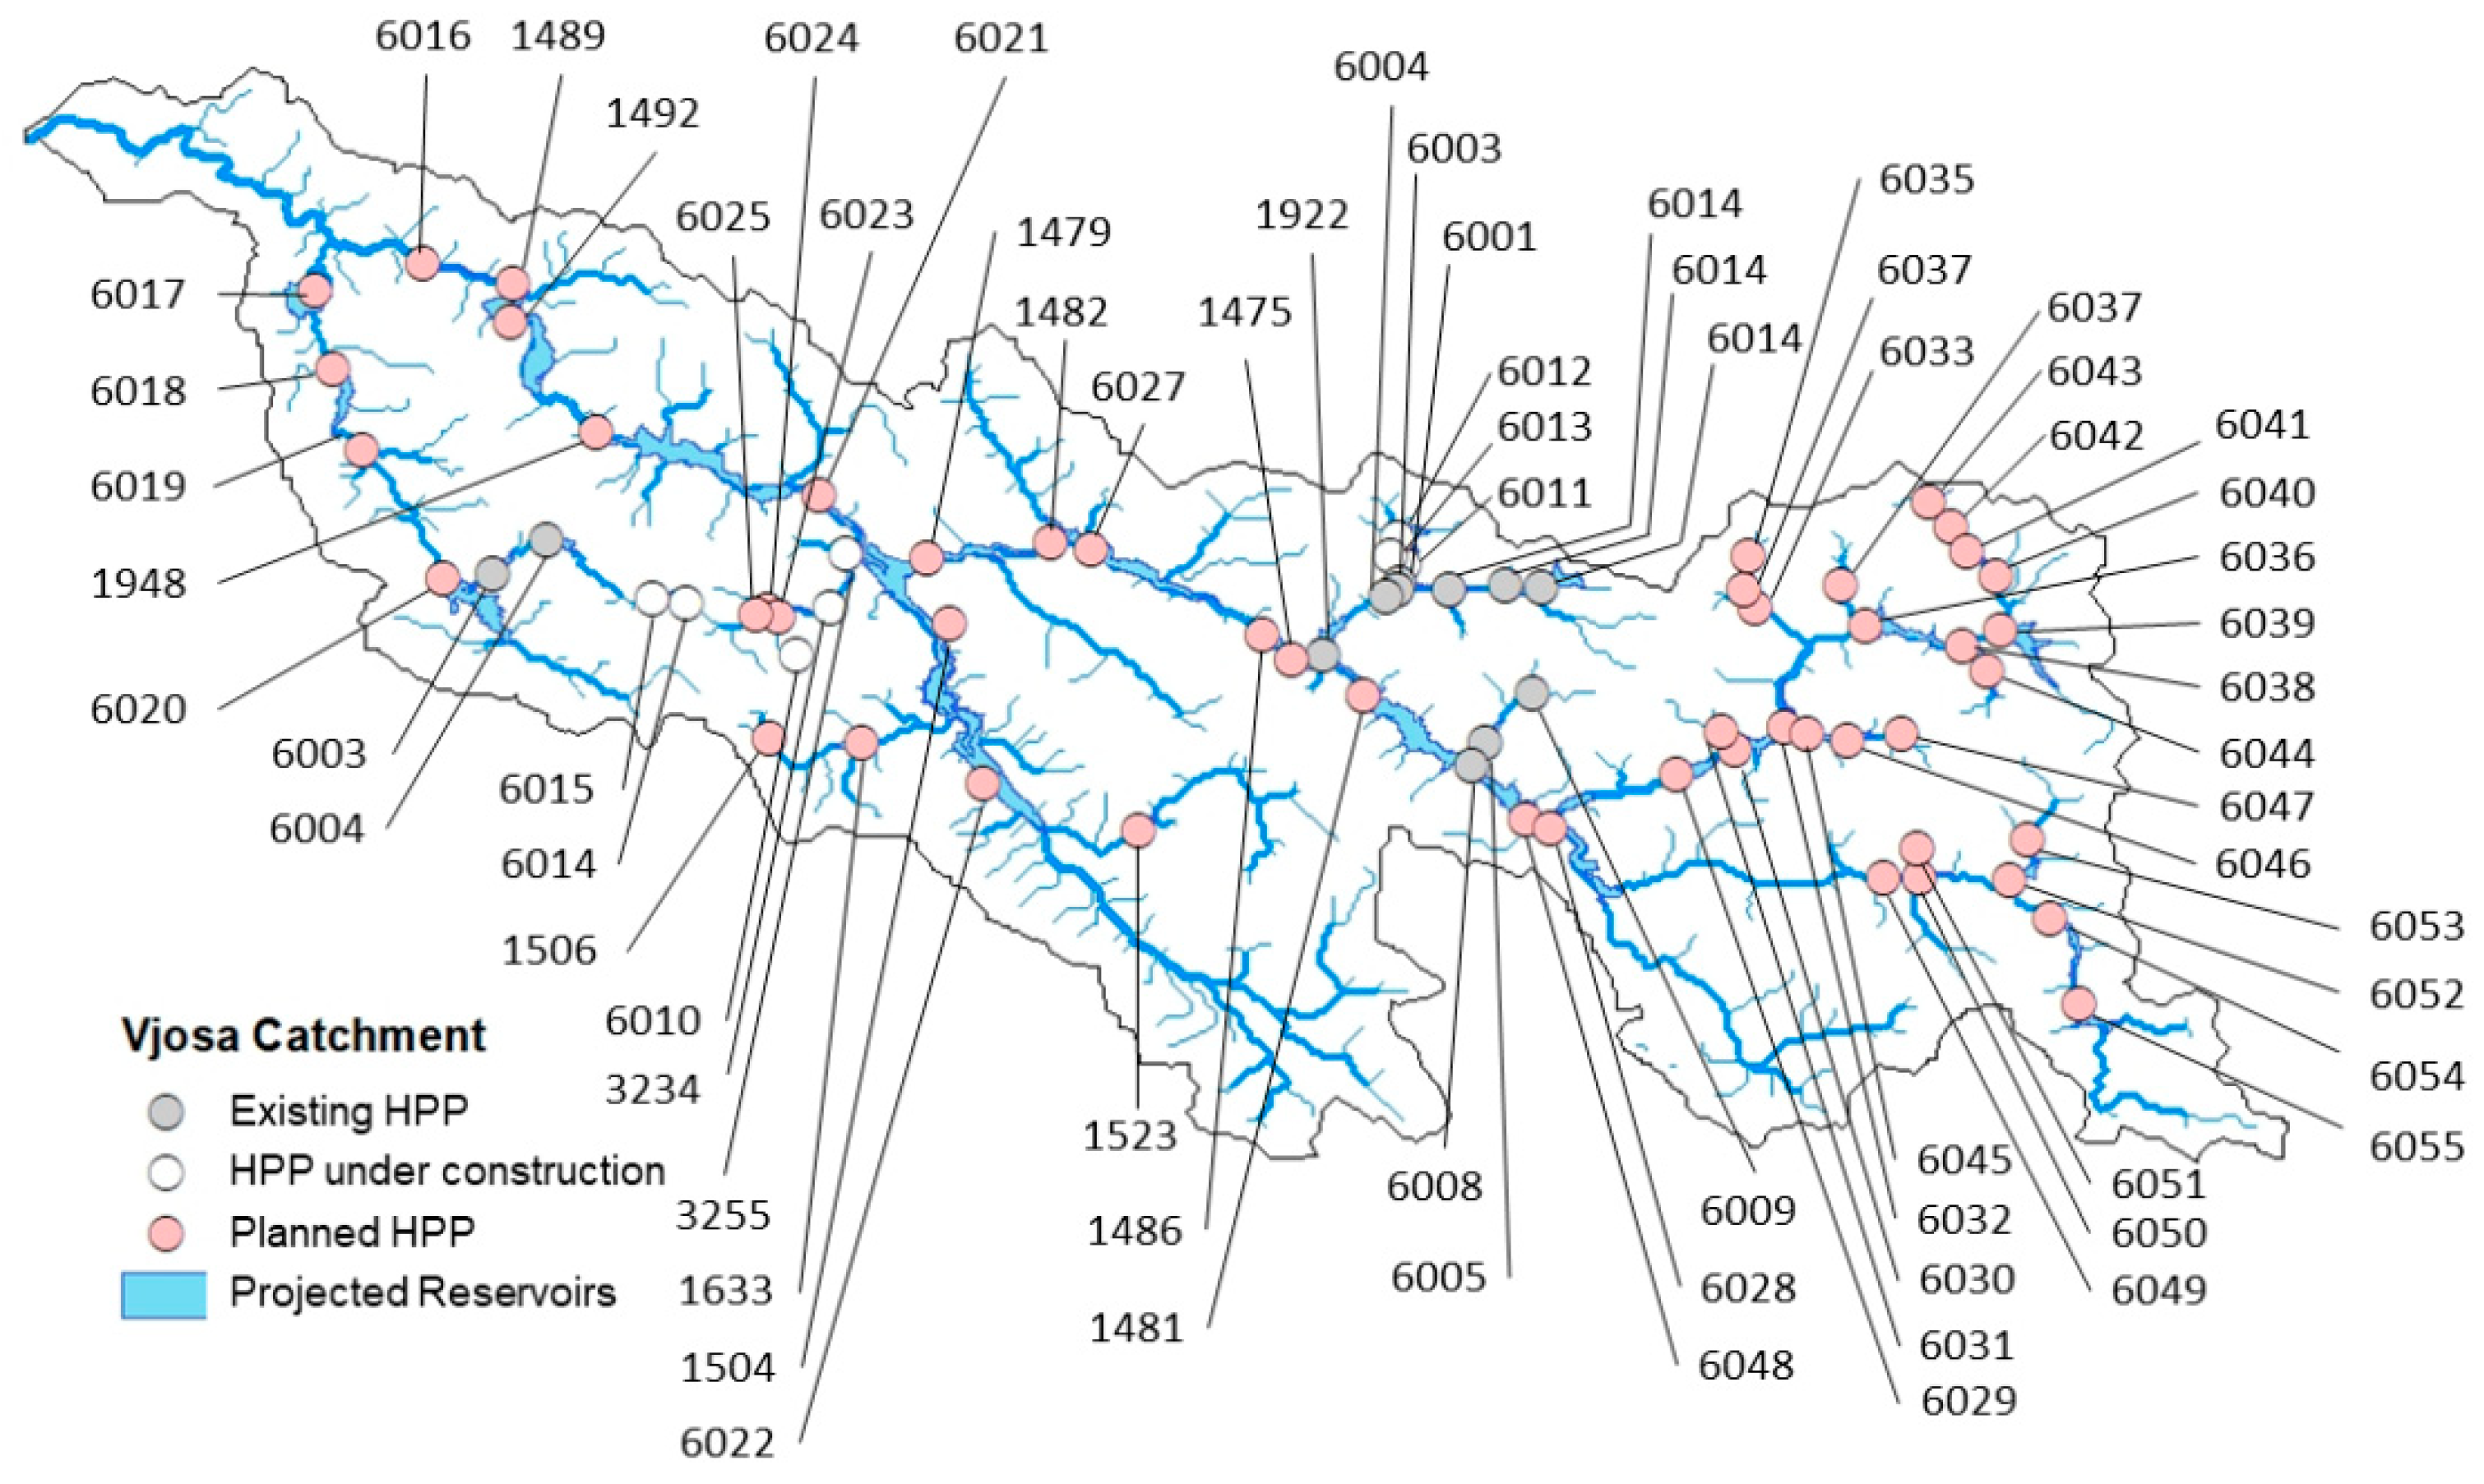
2.1. Study Site: Vjosa Catchment
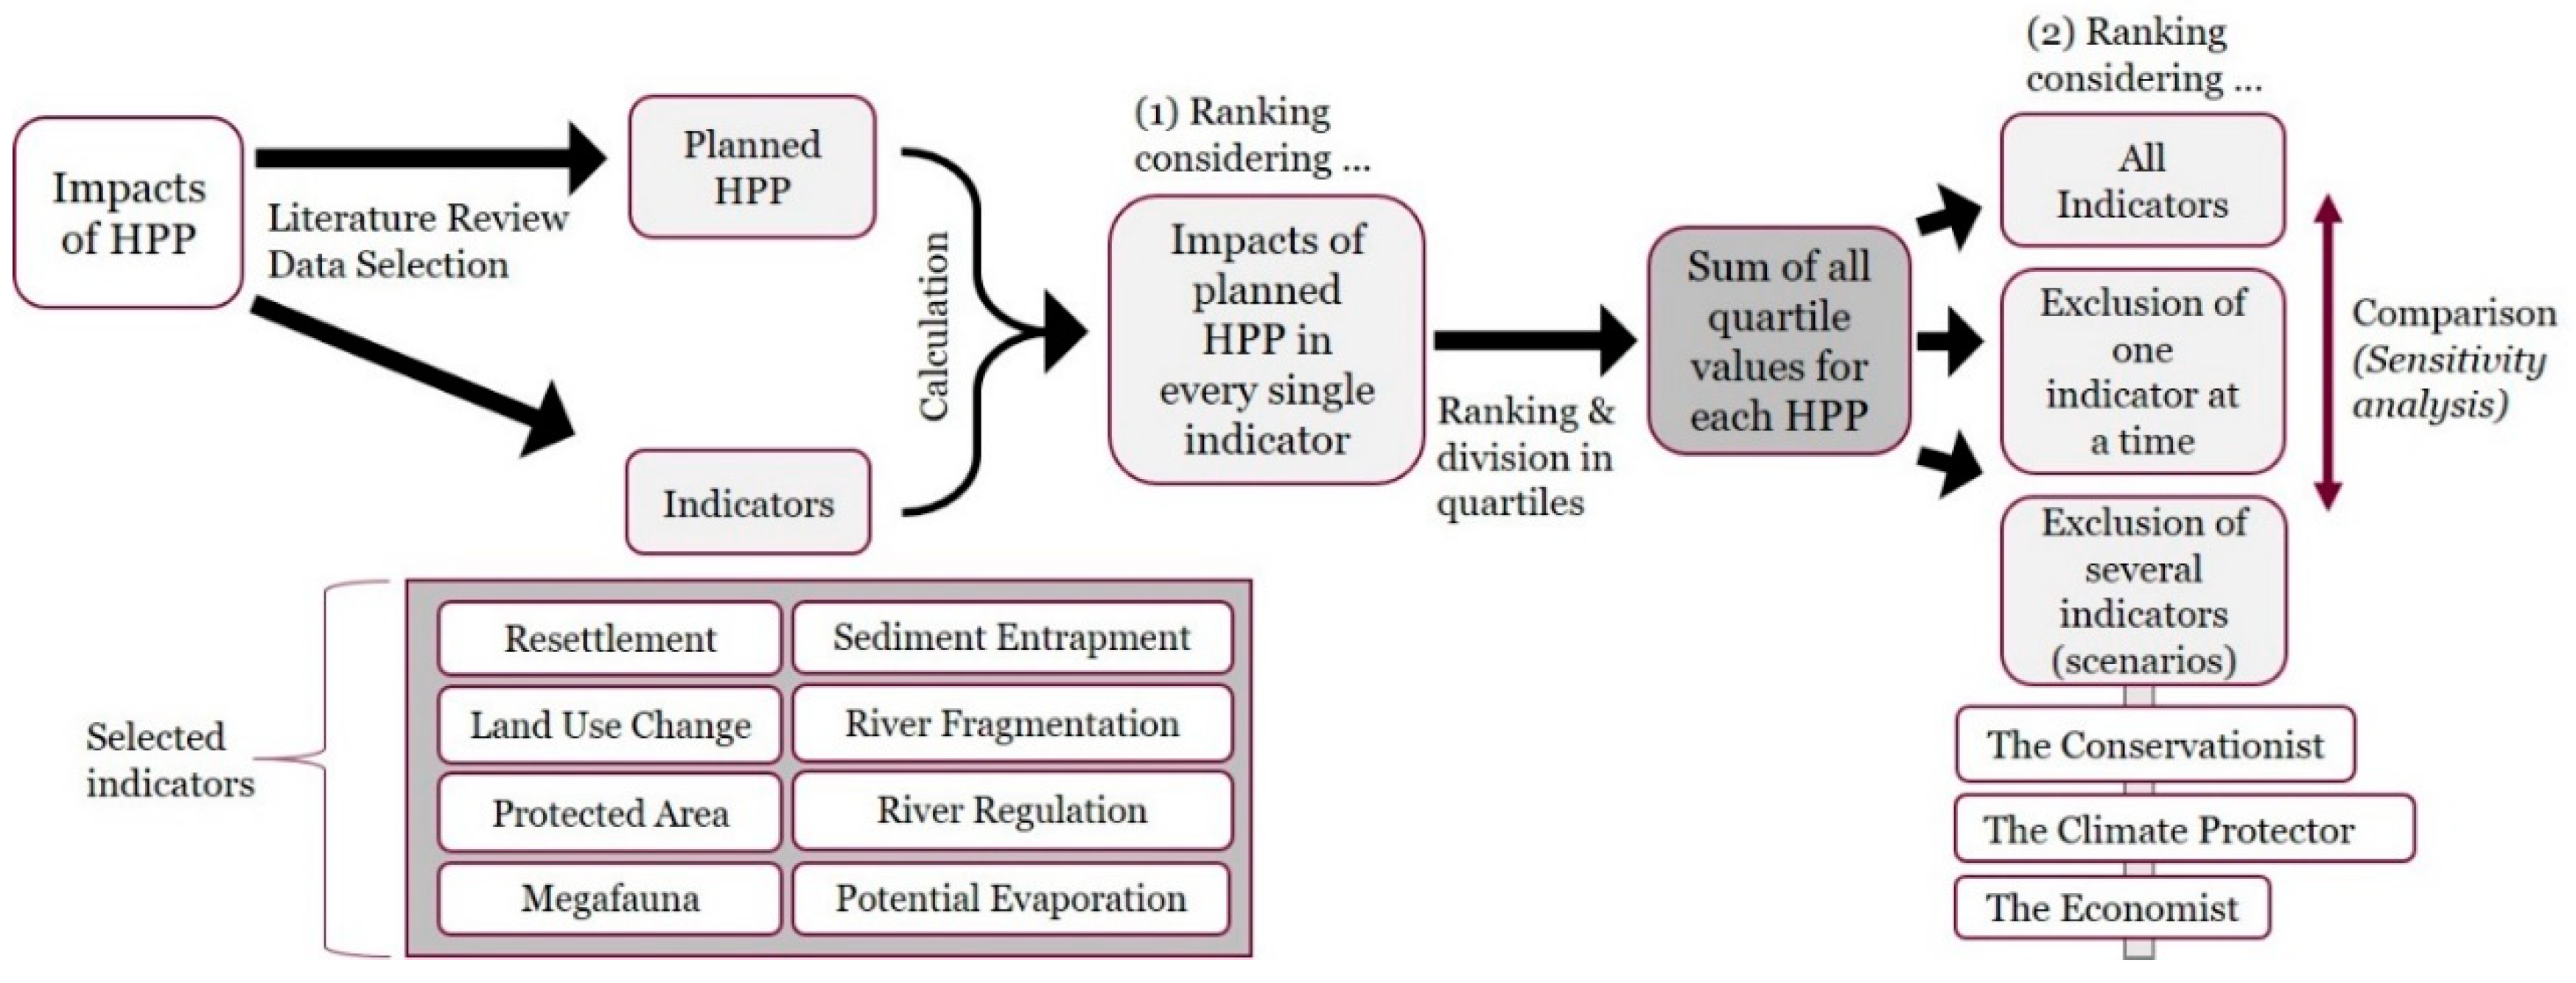
2.2. Methodological Approach
2.2.1. Indicator Selection
2.2.2. Datasets and Calculation of Impacts (Impact Assessment) for Every Selected Indicator
2.2.3. Ranking of Planned HPP Considering All Indicators and Indicator Compositions
2.2.4. Comparison of Small and Large Hydropower Plants
3. Results
3.1. Site Selection—Impact Assessment and Ranking of Planned Hydropower Plants
3.1.1. Impact Assessment and Ranking of Planned HPP for Selected Indicators
3.1.2. Impact Assessment and Ranking of Planned HPP Considering all Indicators
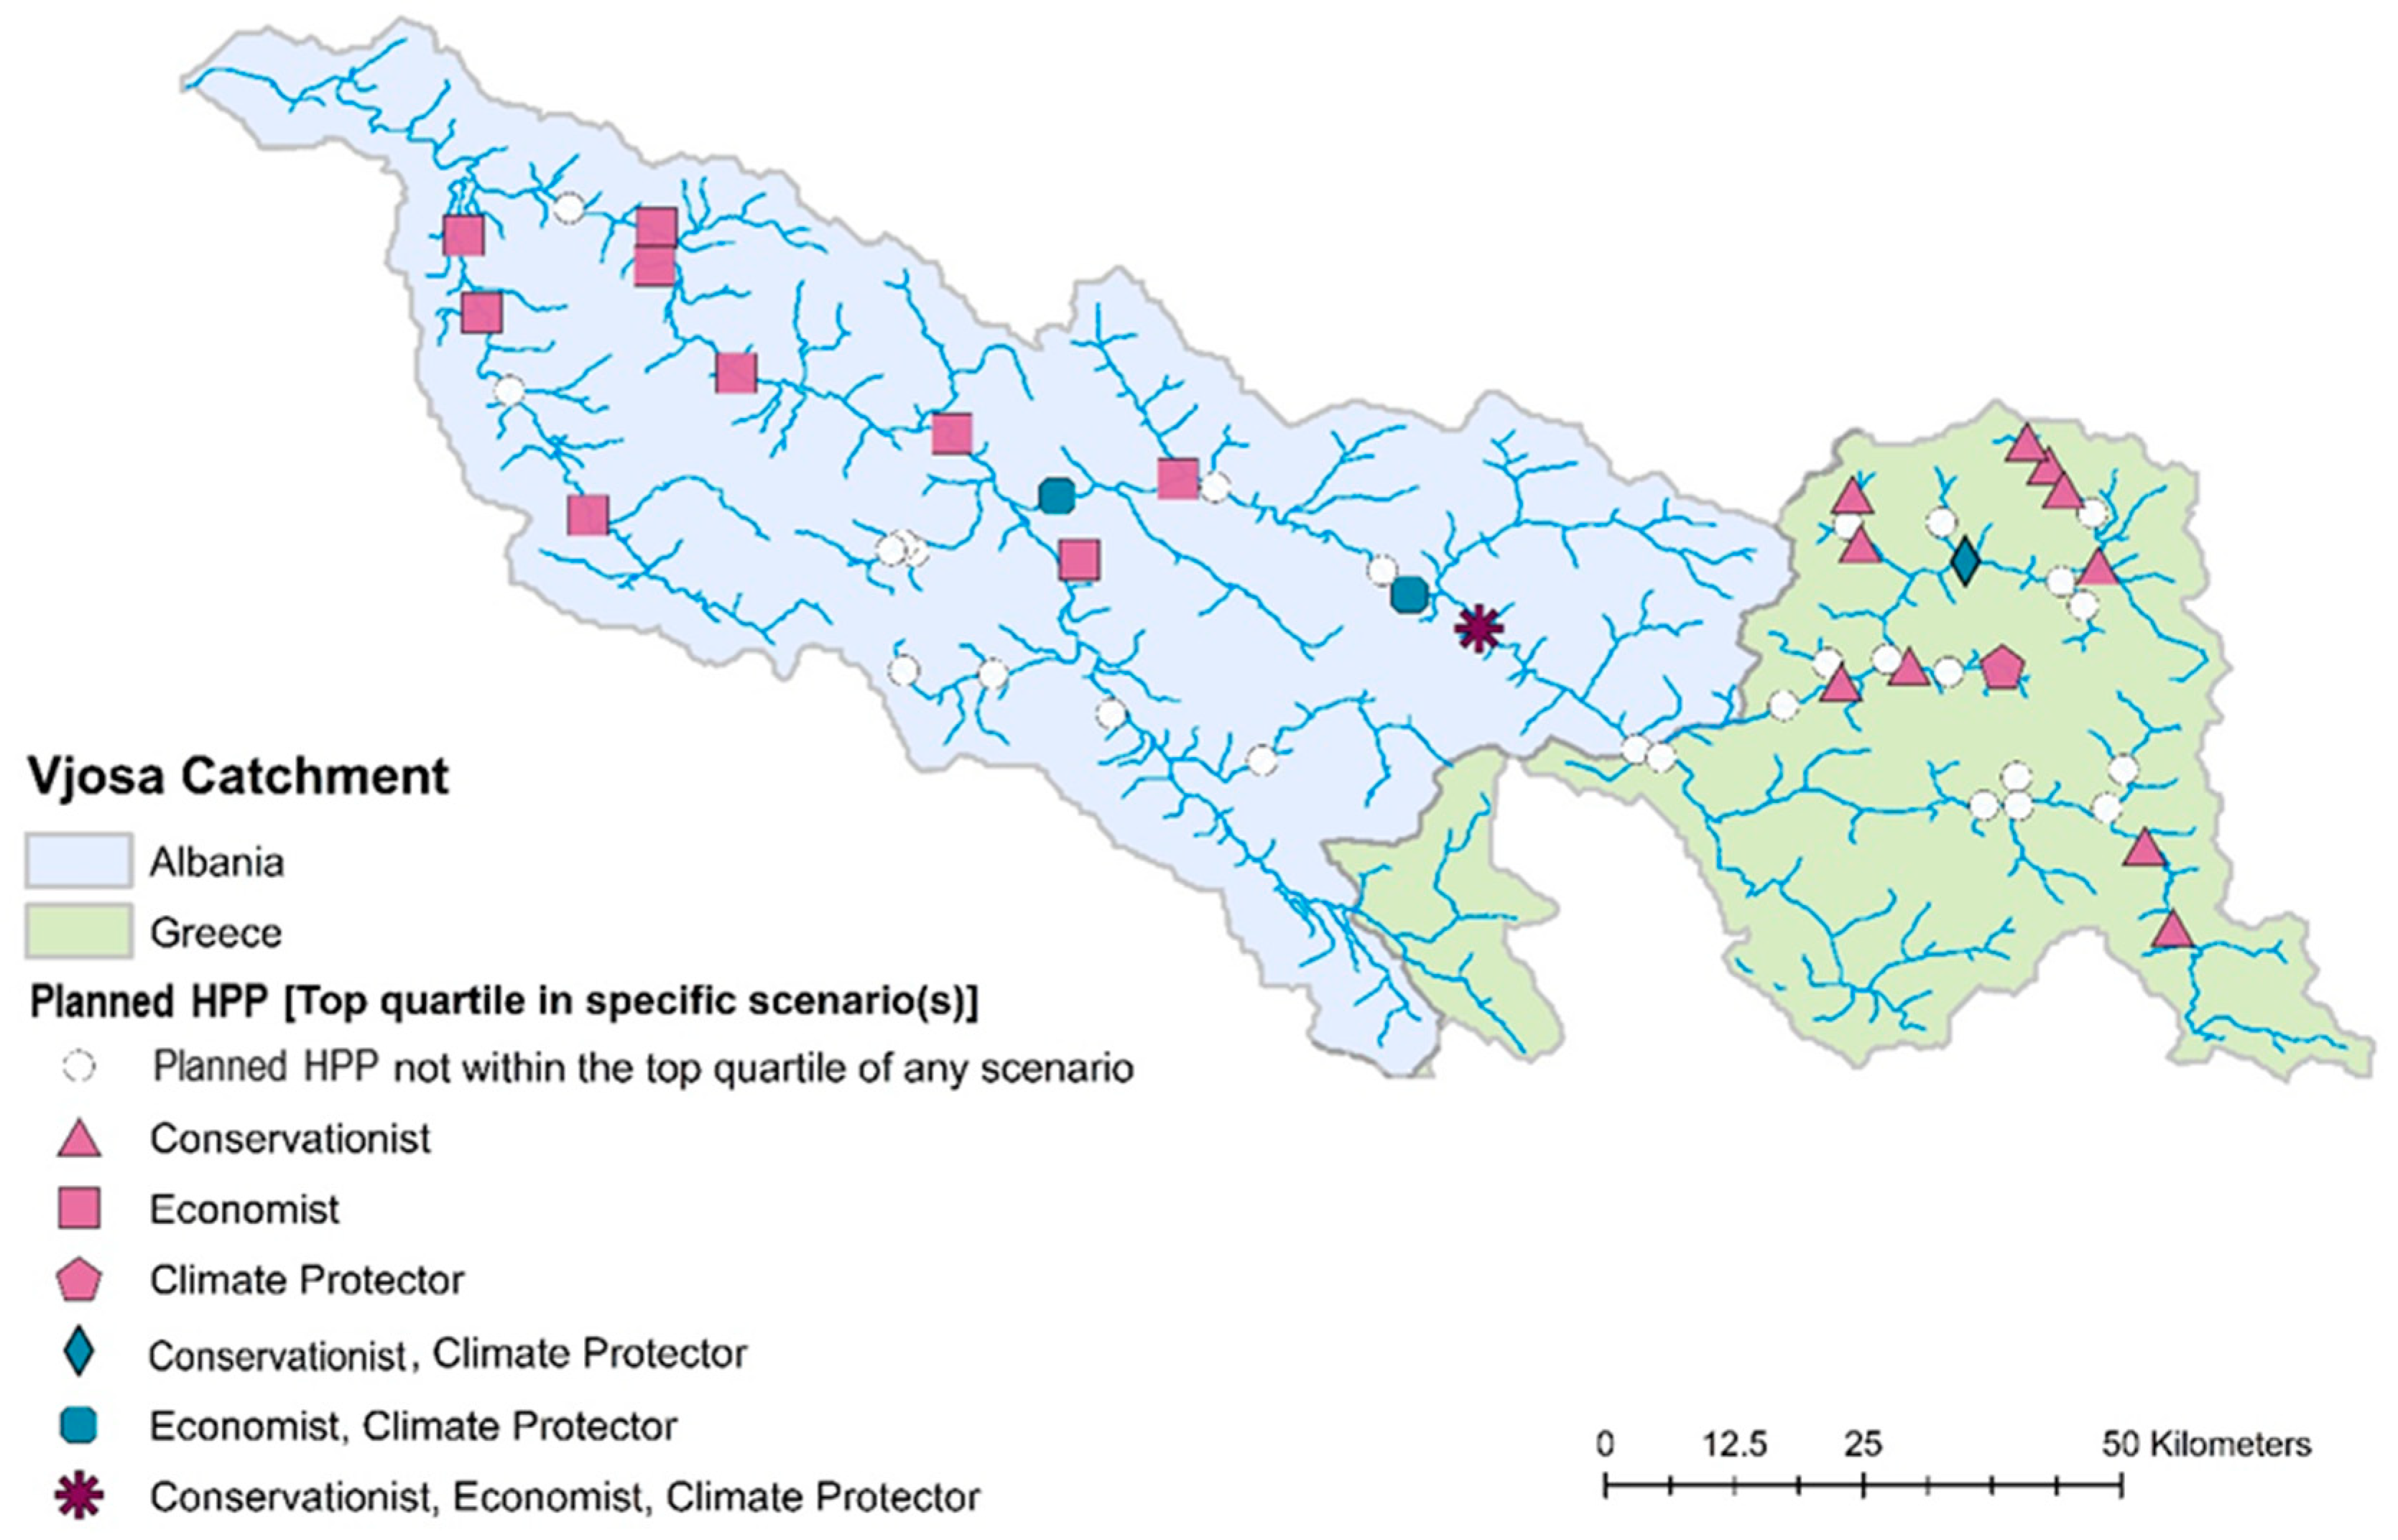
3.1.3. Impact Assessment and Ranking Considering Different Indicator Compositions
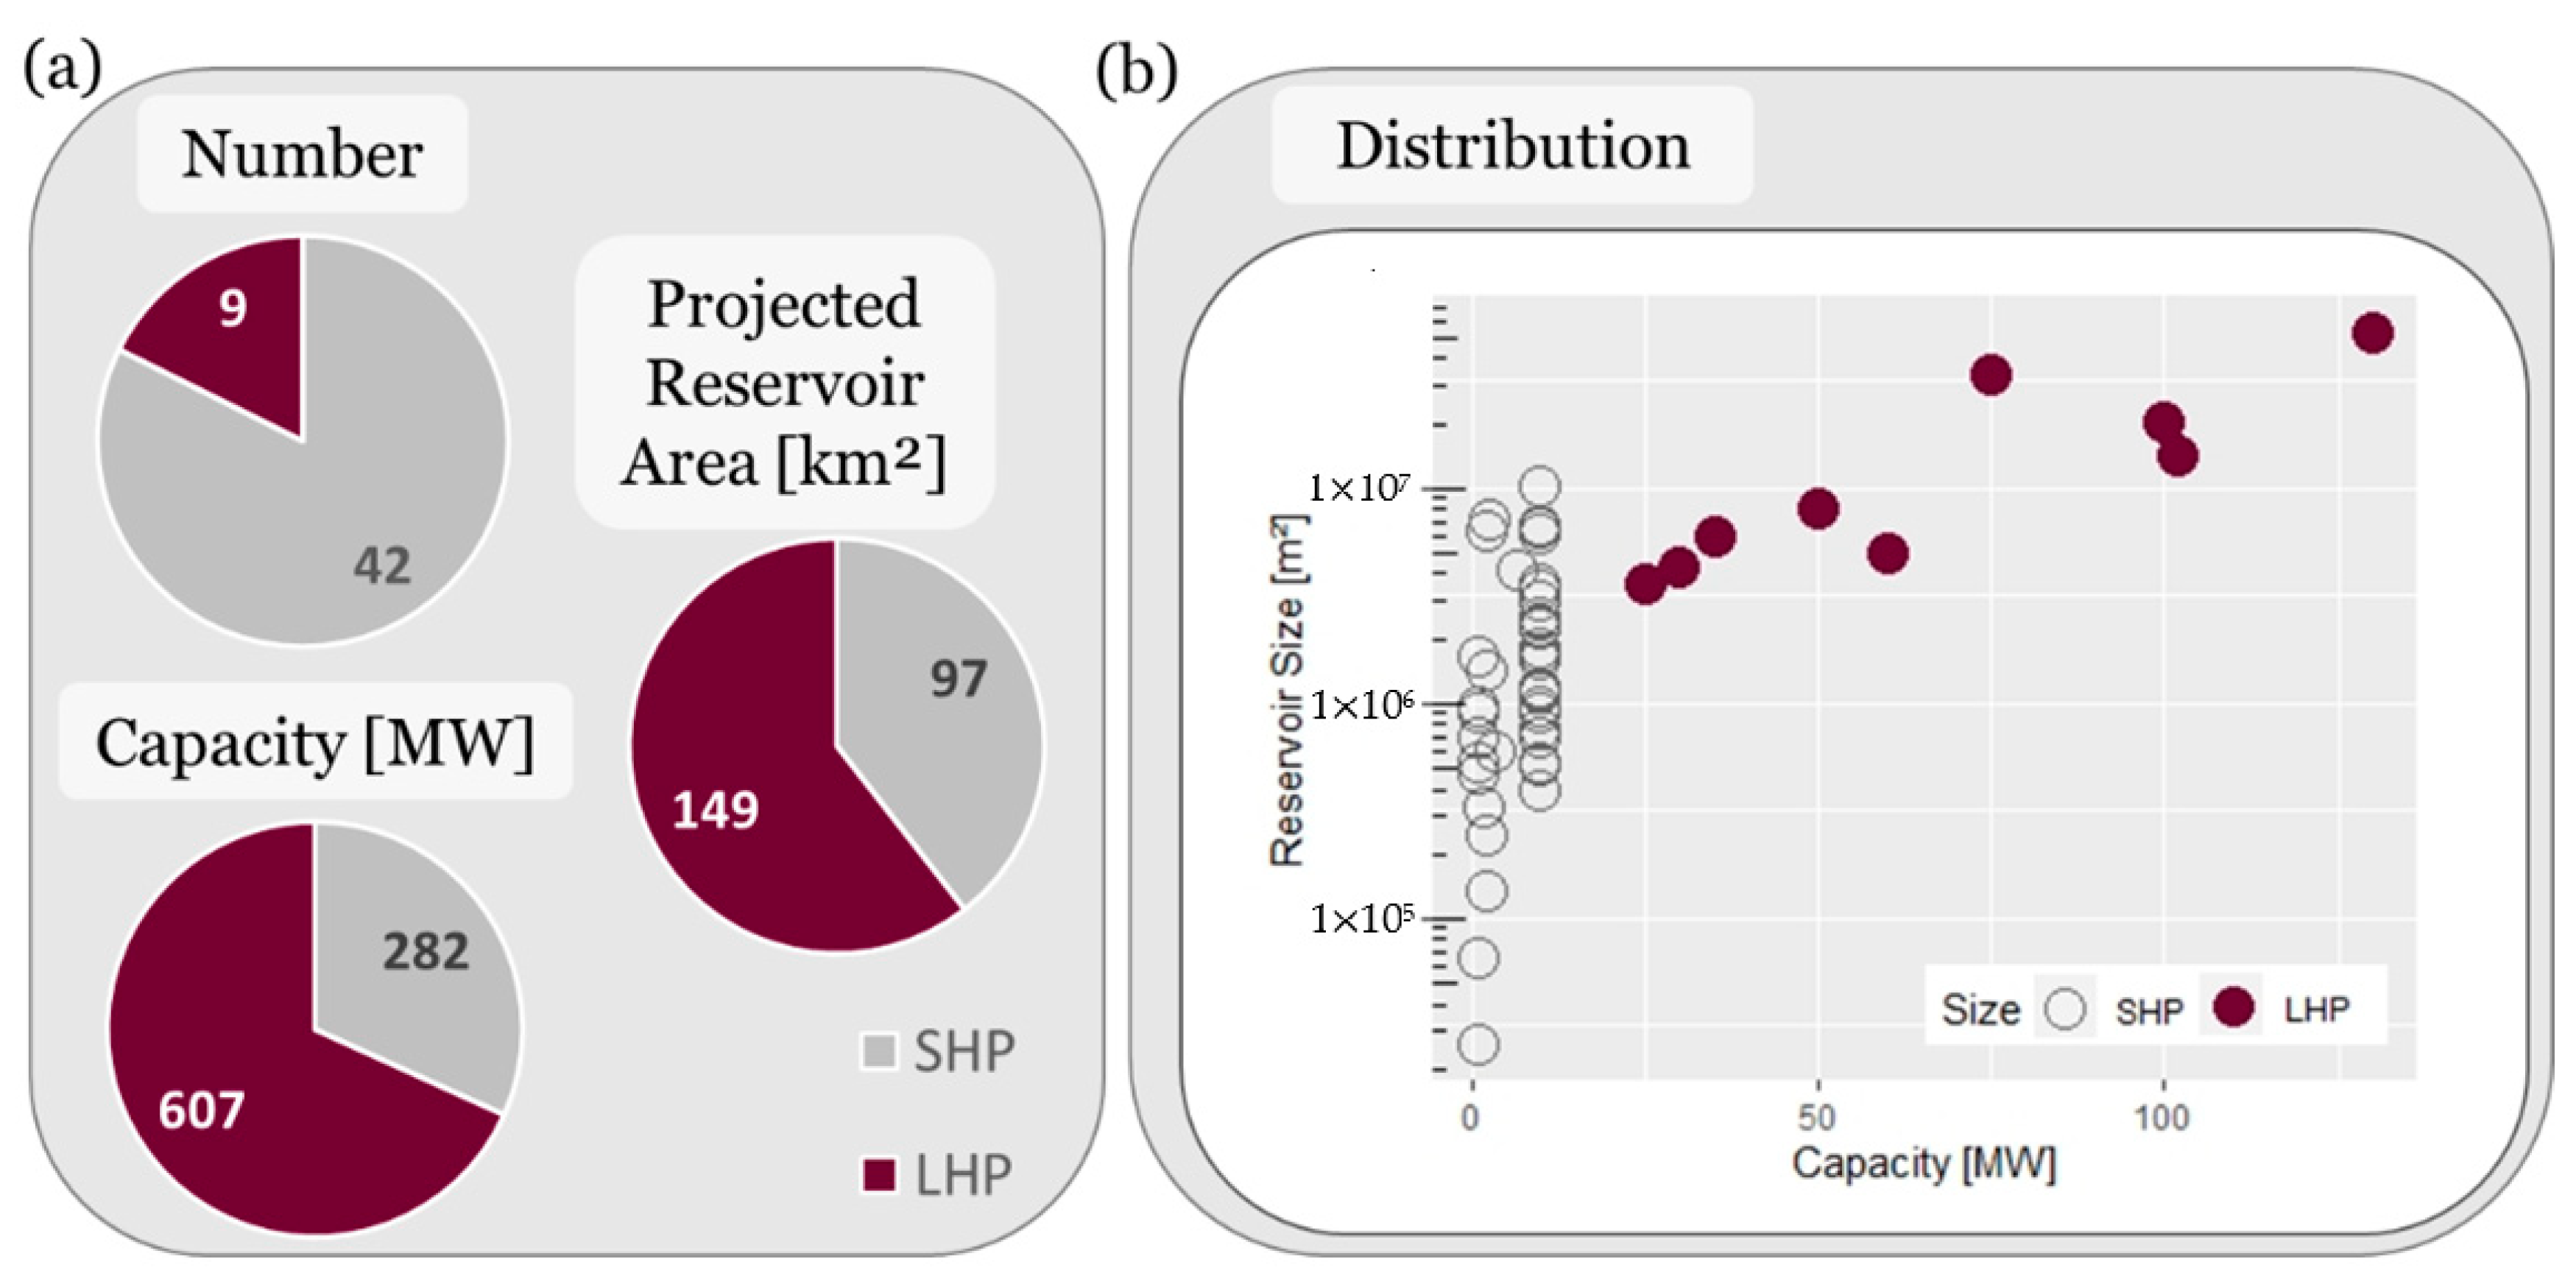
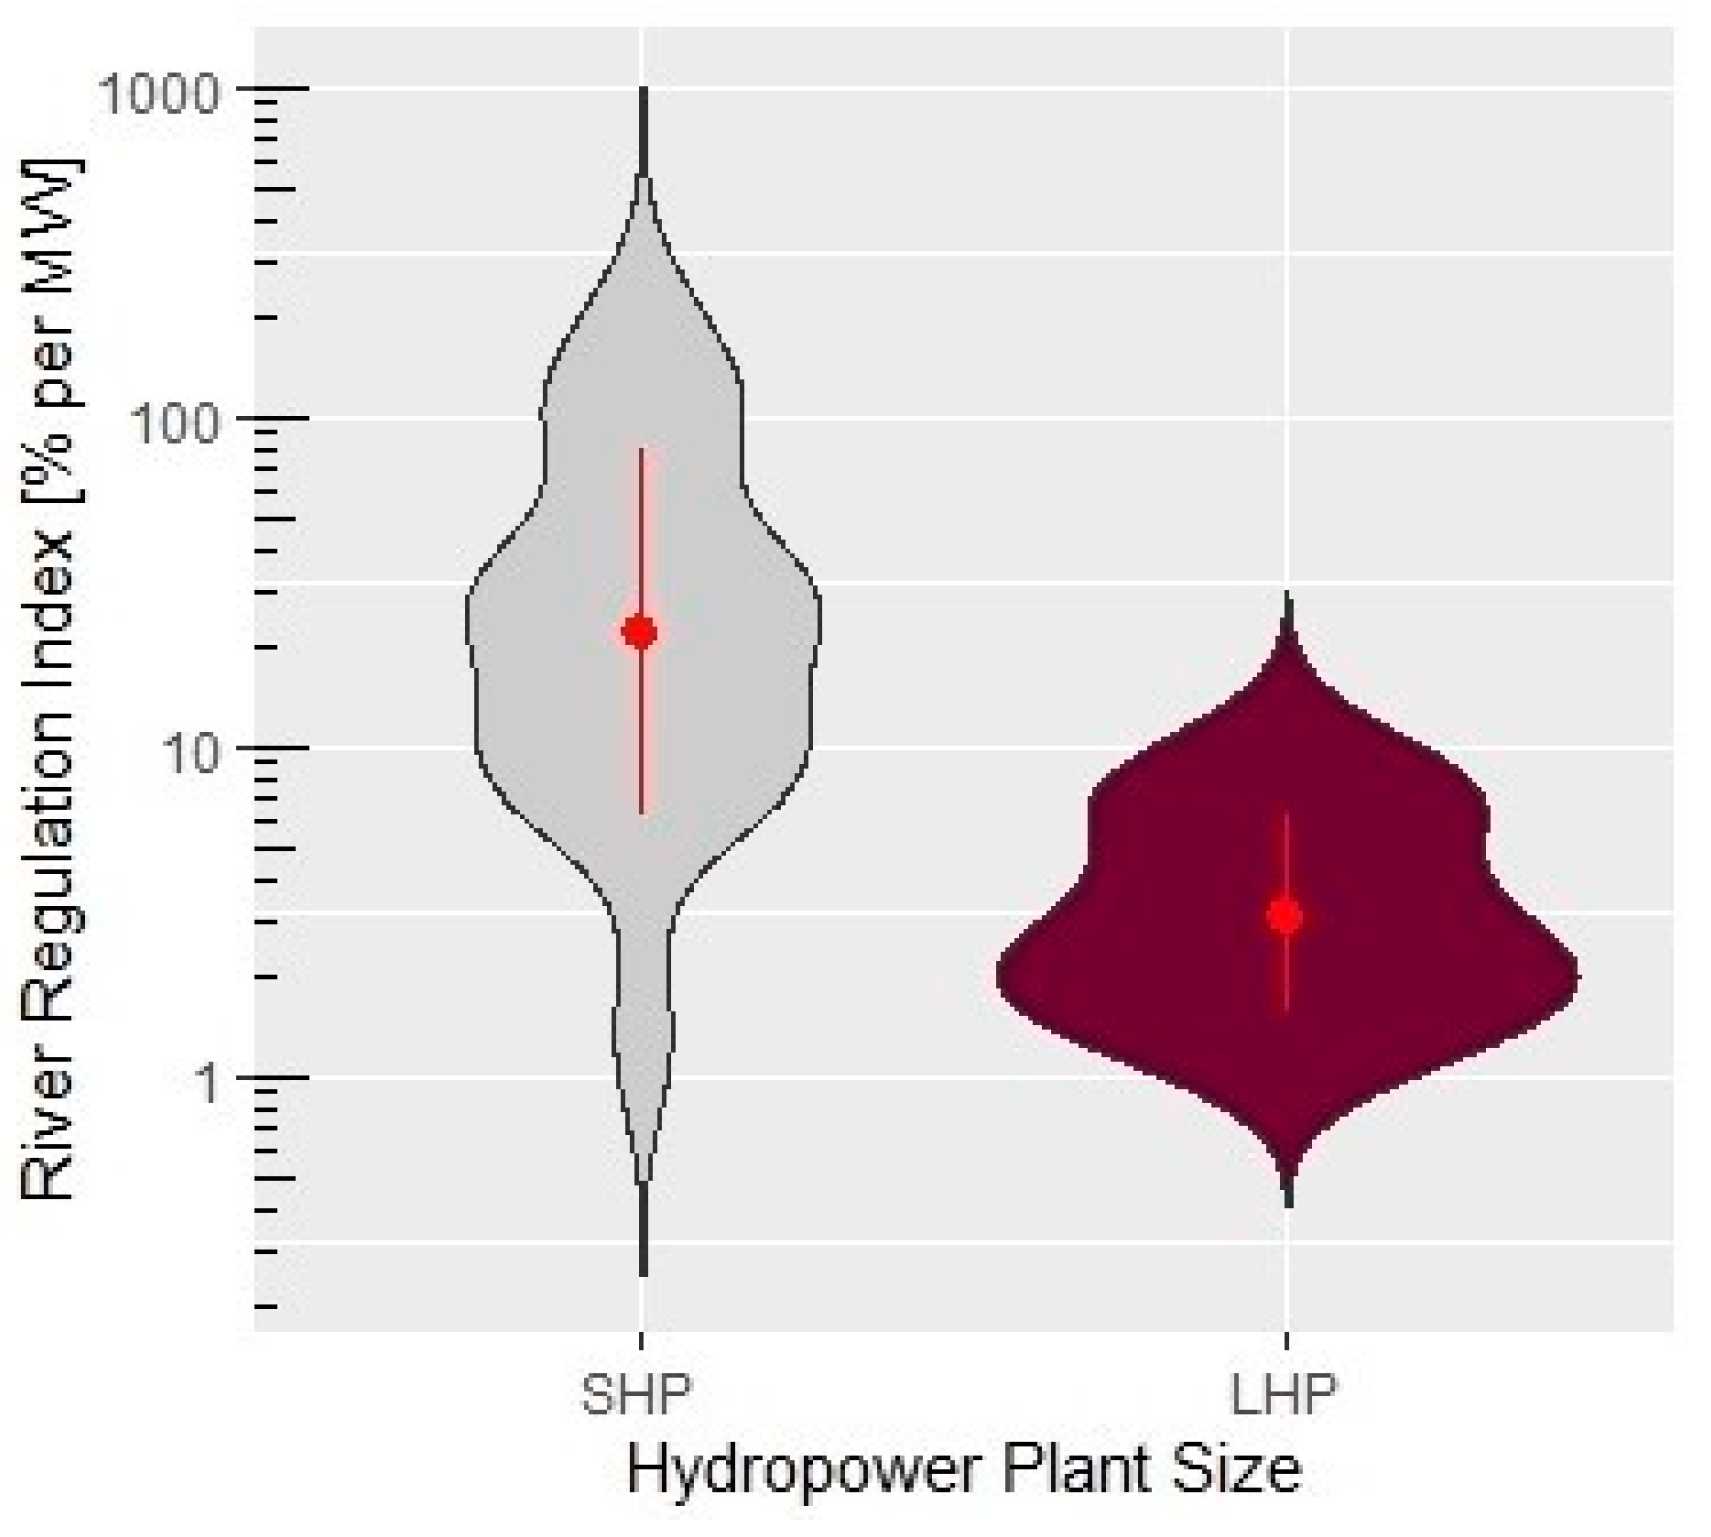
3.2. Capacity Size Selection—Comparison of Small and Large Hyropower Plants
4. Discussion
5. Conclusions
- Impact assessments, applying a comparable set of criteria, should be carried out for both SHP and LHP. It is crucial to consider the additive/synergistic impacts of HPP, especially of SHP within (sub-)catchments;
- Impact assessments should include a sensitivity analysis because ranking of planned HPP might change with impact indicators included. Policymakers should be aware of the role indicator selection has on impact ranking;
- When deciding for SHP or LHP, future capacity potential should be considered. SHP are likely to generate higher impacts per installed MW. In addition, SHP have less capabilities to withstand climatic fluctuations (e.g., increased drought frequency induced by climate change).
Supplementary Materials
Author Contributions
Funding
Institutional Review Board Statement
Informed Consent Statement
Data Availability Statement
Acknowledgments
Conflicts of Interest
Appendix A. Hydropower Plants (HPP), their Location and their Characteristics


| ID | Name | Country | Capacity [MW] | Stage | Reservoir Area [m2] | Reservoir Volume [Mio m3] |
|---|---|---|---|---|---|---|
| 1911 | Barmash | Albania | 3 | Existing | 3412127 | 116.15 |
| 1922 | Langarica 3 | Albania | 28.4 | Existing | 3173810 | 133.34 |
| 6000 | Rajan 1 | Albania | 3.7 | Existing | 1609847 | 52.42 |
| 6001 | Rajan 2 | Albania | 3.26 | Existing | 1503251 | 46.17 |
| 6002 | Lengarica (Ura e Darshit) | Albania | 1.2 | Existing | 120474 | 1.54 |
| 6003 | Langarice 1 | Albania | 3.7 | Existing | 1223882 | 27.61 |
| 6004 | Langarice 2 | Albania | 2.5 | Existing | 918522 | 16.33 |
| 6005 | Radove | Albania | 2 | Existing | 940899 | 27.34 |
| 6006 | Smokthine 2 | Albania | 4.6 | Existing | 1276104 | 79.60 |
| 6007 | Smokthine 1 | Albania | 4.6 | Existing | 1460451 | 24.28 |
| 6008 | Carshove | Albania | 1.5 | Existing | 18181372 | 429.91 |
| 6009 | Leskovik 2 | Albania | 1.1 | Existing | 401211 | 9.90 |
| 3234 | Bence | Albania | 2.07 | Under Construction | 636003 | 11.62 |
| 3255 | Tepelene | Albania | 5.42 | Under Construction | 794078 | 20.43 |
| 6010 | Progonat-Lekdush | Albania | 4 | Under Construction | 107488 | 1.53 |
| 6011 | Gostivisht (Lengarica3) | Albania | 6.2 | Under Construction | 4620668 | 245.00 |
| 6012 | Gostivisht | Albania | 1.3 | Under Construction | 221377 | 4.12 |
| 6013 | Ura e Darshit | Albania | 1.44 | Under Construction | 587199 | 10.85 |
| 6014 | Kendrevica 1 | Albania | 2.7 | Under Construction | 2647030 | 155.27 |
| 6015 | Kendrevica 2 | Albania | 10 | Under Construction | 2223853 | 102.83 |
| 1475 | Badëlonje | Albania | 30 | Planned | 4335638 | 66.47 |
| 1479 | Dragot | Albania | 130 | Planned | 53102166 | 1187.22 |
| 1481 | Kaludhi | Albania | 75 | Planned | 34245503 | 1198.28 |
| 1482 | Kosina | Albania | 35 | Planned | 5916653 | 69.99 |
| 1486 | Përmet | Albania | 25 | Planned | 3612754 | 40.84 |
| 1489 | Karbonara | Albania | 60 | Planned | 5058927 | 31.85 |
| 1492 | Poçem | Albania | 102 | Planned | 14007837 | 51.87 |
| 1504 | Ura e Subashit | Albania | 10 | Planned | 10350309 | 108.71 |
| 1506 | Kapariel | Albania | 2 | Planned | 133350 | 2.42 |
| 1523 | Suha 2 | Albania | 3.4 | Planned | 601358 | 12.33 |
| 1633 | Kolonje 2 | Albania | 2 | Planned | 1430607 | 32.40 |
| 1948 | Kalivaç | Albania | 100 | Planned | 20599265 | 437.44 |
| 6016 | Selenica | Albania | 10 | Planned | 1153386 | 5.92 |
| 6017 | Vernik 4 | Albania | 2.2 | Planned | 6293595 | 22.67 |
| 6018 | Vernik 3 | Albania | 6.4 | Planned | 4135991 | 42.24 |
| 6019 | Kote | Albania | 1.7 | Planned | 330199 | 0.94 |
| 6020 | Brataj | Albania | 10 | Planned | 10208028 | 164.13 |
| 6021 | Memeliaj | Albania | 10 | Planned | 3610583 | 19.87 |
| 6022 | Suha 1 | Albania | 2.4 | Planned | 7125316 | 38.22 |
| 6023 | Nivice | Albania | 1 | Planned | 65846 | 0.46 |
| 6024 | Driza 2 | Albania | 2.2 | Planned | 134556 | 3.17 |
| 6025 | Driza 1 | Albania | 2.1 | Planned | 244599 | 5.34 |
| 6027 | Grabova | Albania | 50 | Planned | 8135706 | 111.27 |
| 6028 | Mesare | Albania | 1 | Planned | 695501 | 2.56 |
| 6029 | NN1 | Greece | 10 | Planned | 2251480 | 40.33 |
| 6030 | NN3 | Greece | 10 | Planned | 3407385 | 71.51 |
| 6031 | NN4 | Greece | 10 | Planned | 695174 | 20.88 |
| 6032 | NN5 | Greece | 1 | Planned | 1646083 | 29.98 |
| 6033 | NN7 | Greece | 1 | Planned | 958112 | 25.58 |
| 6034 | NN8 | Greece | 1 | Planned | 529996 | 14.89 |
| 6035 | NN9 | Greece | 10 | Planned | 903289 | 36.75 |
| 6036 | NN10 | Greece | 10 | Planned | 6131323 | 244.73 |
| 6037 | NN11 | Greece | 10 | Planned | 389642 | 9.34 |
| 6038 | NN12 | Greece | 10 | Planned | 2270945 | 133.65 |
| 6039 | NN13 | Greece | 10 | Planned | 6554585 | 260.52 |
| 6040 | NN15 | Greece | 10 | Planned | 912627 | 18.99 |
| 6041 | NN16 | Greece | 10 | Planned | 1201605 | 37.44 |
| 6042 | NN17 | Greece | 10 | Planned | 1116450 | 31.83 |
| 6043 | NN18 | Greece | 10 | Planned | 1784935 | 83.77 |
| 6044 | NN19 | Greece | 10 | Planned | 520999 | 11.99 |
| 6045 | NN20 | Greece | 10 | Planned | 1590415 | 59.60 |
| 6046 | NN21 | Greece | 10 | Planned | 978742 | 36.22 |
| 6047 | NN22 | Greece | 1 | Planned | 910987 | 6.28 |
| 6048 | NN23 | Greece | 10 | Planned | 6771385 | 80.13 |
| 6049 | NN25 | Greece | 1 | Planned | 466383 | 4.70 |
| 6050 | NN26 | Greece | 10 | Planned | 754380 | 21.68 |
| 6051 | NN27 | Greece | 1 | Planned | 25884 | 0.56 |
| 6052 | NN28 | Greece | 10 | Planned | 1699349 | 78.64 |
| 6053 | NN30 | Greece | 10 | Planned | 534176 | 23.34 |
| 6054 | NN31 | Greece | 10 | Planned | 2513854 | 84.83 |
| 6055 | NN32 | Greece | 10 | Planned | 2997797 | 150.97 |
References
- International Energy Agency. World Energy Outlook: Executive Summary; OECD: Paris, France; IEA: Paris, France, 2018. [Google Scholar]
- Ballantyne, A.P.; Alden, C.B.; Miller, J.B.; Tans, P.P.; White, J.W.C. Increase in observed net carbon dioxide uptake by land and oceans during the past 50 years. Nature 2012, 488, 70–72. [Google Scholar] [CrossRef] [PubMed]
- Brandi, C.; Dzebo, A.; Janetschek, H.; Lambert, C.; Savvidou, G. NDC-SDG Connections. Available online: https://klimalog.die-gdi.de/ndc-sdg/ (accessed on 10 March 2020).
- Wagner, B.; Hauer, C.; Habersack, H. Current hydropower developments in Europe. Curr. Opin. Environ. Sustain. 2019, 37, 41–49. [Google Scholar] [CrossRef]
- Zarfl, C.; Lumsdon, A.E.; Berlekamp, J.; Tydecks, L.; Tockner, K. A global boom in hydropower dam construction. Aquat. Sci. 2014, 77, 161–170. [Google Scholar] [CrossRef]
- Grill, G.; Lehner, B.; Thieme, M.; Geenen, B.; Tickner, D.; Antonelli, F.; Babu, S.; Borrelli, P.; Cheng, L.; Crochetiere, H.; et al. Mapping the world’s free-flowing rivers. Nature 2019, 569, 215–221. [Google Scholar] [CrossRef] [PubMed]
- Zarfl, C.; Lucía, A. The connectivity between soil erosion and sediment entrapment in reservoirs. Curr. Opin. Environ. Sci. Health 2018, 5, 53–59. [Google Scholar] [CrossRef]
- Grant, G.E.; Schmidt, J.C.; Lewis, S.L. A geological framework for interpreting downstream effects of dams on rivers. Water Sci. Appl. 2003, 7, 209–225. [Google Scholar]
- Deemer, B.R.; Harrison, J.A.; Li, S.; Beaulieu, J.J.; Delsontro, T.; Barros, N.; Bezerra-Neto, J.F.; Powers, S.M.; Dos Santos, M.A.; Vonk, J.A. Greenhouse Gas Emissions from Reservoir Water Surfaces: A New Global Synthesis. Bioscience 2016, 66. [Google Scholar] [CrossRef]
- He, F.; Zarfl, C.; Bremerich, V.; Henshaw, A.; Darwall, W.; Tockner, K.; Jähnig, S.C. Disappearing giants: A review of threats to freshwater megafauna. Wiley Interdiscip. Rev. Water 2017, 4, e1208. [Google Scholar] [CrossRef]
- Carrizo, S.F.; Jähnig, S.C.; Bremerich, V.; Freyhof, J.; Harrison, I.; He, F.; Langhans, S.D.; Tockner, K.; Zarfl, C.; Darwall, W. Freshwater Megafauna: Flagships for Freshwater Biodiversity under Threat. Bioscience 2017, 67, 919–927. [Google Scholar] [CrossRef]
- Wu, H.; Chen, J.; Xu, J.; Zeng, G.; Sang, L.; Liu, Q.; Yin, Z.; Dai, J.; Yin, D.; Liang, J. Effects of dam construction on biodiversity: A review. J. Clean. Prod. 2019, 221, 480–489. [Google Scholar] [CrossRef]
- Tilt, B.; Braun, Y.; He, D. Social impacts of large dam projects: A comparison of international case studies and implications for best practice. J. Environ. Manag. 2009. [Google Scholar] [CrossRef] [PubMed]
- Bartolome, L.J.; Danklmaier, C.M.; Hemadri, R.; Bandh, B.; Samiti, S.; Jing, I.J. Displacement, Resettlement, Rehabilitation, Reparation, and Development; World Comission on Dams: Cape Town, South Africa, 2000. [Google Scholar]
- Bilson Obour, P.; Owusu, K.; Agyeman, E.A.; Ahenkan, A.; Madrid, N.À. The impacts of dams on local livelihoods: A study of the Bui Hydroelectric Project in Ghana. Int. J. Water Resour. Dev. 2016, 32, 286–300. [Google Scholar] [CrossRef]
- Opperman, J.J.; Hartmann, J.; Raepple, H.; Angarita, P.; Beames, E.; Chapin, R.; Geressu, G.; Grill, J.; Harou, A.; Hurford, D.; et al. The Power of Rivers: A Business Case; The Nature Consefvancy: Washington, DC, USA, 2017. [Google Scholar]
- Lerer, L.B.; Scudder, T. Health impacts of large dams. Envrion. Impact Assess. Rev. 1999, 19, 113–123. [Google Scholar] [CrossRef]
- Tuan, T.A.; Purnachandra Rao, N.; Gahalaut, K.; Trong, C.D.; Van Dung, L.; Chien, C.; Mallika, K. Evidence that earthquakes have been triggered by reservoir in the Song Tranh 2 region, Vietnam. J. Seismol. 2017, 21, 1131–1143. [Google Scholar] [CrossRef]
- von Lossow, T. Flüsse und Konflikte. Rundbr. Forum Umwelt Entwicklung. 2018. Available online: https://www.forumue.de/wp-content/uploads/2019/01/05_Fl%C3%BCsse-imd-Konflikte_Lossow.pdf (accessed on 29 January 2021).
- Ioannidis, R.; Koutsoyiannis, D. A review of land use, visibility and public perception of renewable energy in the context of landscape impact. Appl. Energy 2020, 276, 115367. [Google Scholar] [CrossRef]
- Zawahri, N.A.; McLaughlin Mitchell, S. Fragmented Governance of International Rivers: Negotiating Bilateral versus Multilateral Treaties. Int. Stud. Q. 2011, 55, 835–858. [Google Scholar] [CrossRef]
- Apadula, F.; Bassini, A.; Elli, A.; Scapin, S. Relationships between meteorological variables and monthly electricity demand. Appl. Energy 2012. [Google Scholar] [CrossRef]
- Chen, S.; Chen, B.; Su, M. The cumulative effects of dam project on river ecosystem based on multi-scale ecological network analysis. Procedia Environ. Sci. 2011. [Google Scholar] [CrossRef]
- Gergel, S.E. Assessing cumulative impacts of levees and dams on floodplain ponds: A neutral-terrain model approach. Ecol. Appl. 2002, 12, 1740–1754. [Google Scholar] [CrossRef]
- Kelly-Richards, S.; Silber-Coats, N.; Crootof, A.; Tecklin, D.; Bauer, C. Governing the transition to renewable energy: A review of impacts and policy issues in the small hydropower boom. Energy Policy 2017, 101, 251–264. [Google Scholar] [CrossRef]
- Gunawardena, U.A.D.P. Inequalities and externalities of power sector: A case of Broadlands hydropower project in Sri Lanka. Energy Policy 2010, 38, 726–734. [Google Scholar] [CrossRef]
- Stone, R. Hydropower. The legacy of the Three Gorges Dam. Science 2011, 333, 817. [Google Scholar] [CrossRef] [PubMed]
- Ziv, G.; Baran, E.; Nam, S.; Rodríguez-Iturbe, I.; Levin, S.A. Trading-off fish biodiversity, food security, and hydropower in the Mekong River Basin. Proc. Natl. Acad. Sci. USA 2012, 109, 5609–5614. [Google Scholar] [CrossRef] [PubMed]
- Sovacool, B.K.; Bulan, L.C. Behind an ambitious megaproject in Asia: The history and implications of the Bakun hydroelectric dam in Borneo. Energy Policy 2011, 39, 4842–4859. [Google Scholar] [CrossRef]
- Ansar, A.; Flyvbjerg, B.; Budzier, A.; Lunn, D. Should we build more large dams? The actual costs of hydropower megaproject development. Energy Policy 2014, 69, 43–56. [Google Scholar] [CrossRef]
- Zeleňáková, M.; Fijko, R.; Diaconu, D.; Remeňáková, I. Environmental Impact of Small Hydro Power Plant—A Case Study. Environments 2018, 5, 12. [Google Scholar] [CrossRef]
- Gleick, P.H. Environmental consequences of hydroelectric development: The role of facility size and type. Energy 1992, 17, 735–774. [Google Scholar] [CrossRef]
- Bakken, T.H.; Sundt, H.; Ruud, A.; Harby, A. Development of small versus large hydropower in Norway comparison of environmental impacts. Energy Procedia 2012. [Google Scholar] [CrossRef]
- Kibler, K.M.; Tullos, D.D. Cumulative biophysical impact of small and large hydropower development in Nu River, China. Water Resour. Res. 2013, 49, 3104–3118. [Google Scholar] [CrossRef]
- Mayor, B.; Rodríguez-Muñoz, I.; Villarroya, F.; Montero, E.; López-Gunn, E. The role of large and small scale hydropower for energy and water security in the Spanish Duero basin. Sustainability 2017, 9, 1807. [Google Scholar] [CrossRef]
- Gallop, P.; Vejnović, I.; Pehchevski, D. Western Balkans Hydropower. Who Pays, Who Profits? EuroNatur: European Nature Heritage Foundation, Riverwatch: Society for the Protection of Rivers. 2019. Available online: https://bankwatch.org/wp-content/uploads/2019/09/who-pays-who-profits.pdf (accessed on 25 November 2019).
- Susaj, E.; Kucaj, E.; Qaja, B. Assessment of possible effects on ecosystems of small hydropower plants under construction in Valbona Valley National Park, Albania. Paper presented at TAW 2018 International Scientific Conference: [CO] Habitation Tactics. Imagining Future Spaces in Architecture, City and Landscape, Polis University, Tirana, Albania, 20–23 September 2018. [Google Scholar]
- International Hydropower Association (IHA). Hydropower Sustainability Assessment Protocol. 2018. Available online: https://www.hydrosustainability.org/assessment-protocol (accessed on 15 October 2020).
- Internation Rivers. Greenwashing Dams: A Critique of the Hydropower Sustainability Assessment Protocol (HSAP). 2013. Available online: https://www.internationalrivers.org/wp-content/uploads/sites/86/2020/05/hsapfactsheet2013.pdf (accessed on 10 January 2020).
- Liden, R.; Lyon, K. The Hydropower Sustainability Assessment Protocol for Use by World Bank Clients: Lessons Learned and Recommendations; World Bank: Washington, DC, USA, 2014; Available online: https://openknowledge.worldbank.org/handle/10986/19990 (accessed on 11 January 2020).
- Schwarz, U.; Graf, W.; Weiss, S.; Lopes-Lima, M.; Chamberlain, L. Eco-Masterplan for Balkan Rivers; Riverwatch: Vienna, Austria; EuroNatur: Radolfzell, Germany, 2018. [Google Scholar]
- Schiemer, F.; Drescher, A.; Hauer, C.; Schwarz, U. The Vjosa River corridor: A riverine ecosystem of European significance. Acta Zoobot Austria 2018, 155, 1–40. [Google Scholar]
- Durmishi, Ç.; Daja, S.; Ago, B.; Dindi, E.; Sinojmeri, A.; Nazaj, S.; Qorri, A.; Muçi, R. Synthesis of geological, hydrogeological, and geo-touristic features of the Vjosa Watershed. Acta Zoobot Austria 2018, 155, 41–61. [Google Scholar]
- Shumka, S.; Bego, F.; Beqiraj, S.; Paparisto, A. The Vjosa catchment—A natural heritage. Acta Zoobot Austria 2018, 155, 349–376. [Google Scholar]
- Schiemer, F.; Beqiraj, S.; Drescher, A.; Graf, W.; Egger, G.; Essl, F.; Frank, T.; Hauer, C.; Hohensinner, S.; Miho, A.; et al. The Vjosa River corridor: A model of natural hydro-morphodynamics and a hotspot of highly threatened ecosystems of European significance. Landsc. Ecol. 2020, 35, 953–968. [Google Scholar] [CrossRef]
- EuroNatur; Riverwatch. Save the Blue Heart of Europe. Background. Available online: https://balkanrivers.net/en/campaign (accessed on 6 June 2019).
- EuroNatur; Riverwatch. Vision for Vjosa: Europe’s 1st Wild River National Park! Available online: https://balkanrivers.net/sites/default/files/TheVjosaWRNP_factsheet.pdf (accessed on 20 March 2020).
- Lehner, B.; Liermann, C.R.; Revenga, C.; Vörösmarty, C.; Fekete, B.; Crouzet, P.; Döll, M.; Endejan, K.; Frenken, J.; Magome, J.; et al. High-resolution mapping of the world’s reservoirs and dams for sustainable river-flow management. Front. Ecol. Environ. 2011, 9, 494–502. [Google Scholar] [CrossRef]
- Mulligan, M.; Saenz, L.; van Soesbergen, A.; Smith, V.T.; Zurita, L. Global Georeferenced Database of Dams. Glob. Dams Database Geowiki. Version 1. 2019. Available online: http://geodata.policysupport.org/dams (accessed on 1 October 2019).
- Stefani, V. Assessing Catchment-Scale Impacts of Hydropower on Sediment Transport in Vjosa river. Master’s Thesis, Università degli studi di Trento, Trento, Italy, 2019. [Google Scholar]
- ESRI. ArcGIS Desktop. ESRI, 2019. Available online: https://desktop.arcgis.com/en/ (accessed on 10 August 2019).
- Grill, G.; Ouellet Dallaire, C.; Fluet Chouinard, E.; Sindorf, N.; Lehner, B. Development of new indicators to evaluate river fragmentation and flow regulation at large scales: A case study for the Mekong River Basin. Ecol. Indic. 2014. [Google Scholar] [CrossRef]
- Lehner, B.; Verdin, K.; Jarvis, A. HydroSHEDS Technical Documentation, version 1.0; World Wildl. Fund US: Washington, DC, USA, 2006; pp. 1–27. Available online: https://www.hydrosheds.org/ (accessed on 10 October 2019).
- Lehner, B. HydroBASINS. 2014. Available online: https://www.hydrosheds.org/ (accessed on 10 October 2019).
- Döll, P.; Lehner, B. Validation of a new global 30-min drainage direction map. J. Hydrol. 2002, 258, 214–231. [Google Scholar] [CrossRef]
- Wischmeier, W.H.; Smith, D.D. Predicting Rainfall Erosion Losses: A Guide to Conservation Planning; Science and Education Administration United States Department of Agriculture incooperation with Purdue Agricultural Experiment Station: Washington, DC, USA, 1978. [Google Scholar]
- Renard, K.G.; Foster, G.R.; Yoder, D.C.; McCool, D.K. RUSLE revisited: Status, questions, answers, and the future. J. Soil Water Conserv. 1994, 49, 213–220. [Google Scholar]
- Cavalli, M.; Trevisani, S.; Comiti, F.; Marchi, L. Geomorphometric assessment of spatial sediment connectivity in small Alpine catchments. Geomorphology 2013, 188, 31–41. [Google Scholar] [CrossRef]
- Döll, P.; Kaspar, F.; Lehner, B. A global hydrological model for deriving water availability indicators: Model tuning and validation. J. Hydrol. 2003, 270, 105–134. [Google Scholar] [CrossRef]
- Lehner, B.; Verdin, K.; Jarvis, A. New global hydrography derived from spaceborne elevation data. EosTrans. Geophys. Union 2008, 89, 93–94. [Google Scholar] [CrossRef]
- Zarfl, C.; Berlekamp, J.; He, F.; Jähnig, S.C.; Darwall, W.; Tockner, K. Future large hydropower dams impact global freshwater megafauna. Sci. Rep. 2019, 9, 18531. [Google Scholar] [CrossRef] [PubMed]
- UNEP-WCMC; IUCN. Protected Planet: World Database on Protected Areas (WDPA). Available online: www.protectedplanet.net (accessed on 2 February 2020).
- ESA. Land Cover CCI Product User Guide Version 2. Tech. Rep.. 2017. Available online: Maps.elie.ucl.ac.be/CCI/viewer/download/ESACCI-LC-Ph2-PUGv2_2.0.pdf (accessed on 10 April 2020).
- WorldPop Data: Population Density (University of Southampton). Available online: www.worldpop.org (accessed on 8 December 2019).
- Jippe Hoogeveen (FAO). Global Map of Monthly Reference Evapotranspiration—10 arc Minutes. Available online: http://www.fao.org/geonetwork/srv/en/main.home#climate (accessed on 3 March 2020).
- Saltelli, A.; Tarantola, S.; Campolongo, F.; Ratto, M. Sensitivity Analysis in Practice: A Guide to Assessing Scientific Models; Wiley Online Library: Hoboken, NJ, USA, 2004; Volume 1. [Google Scholar]
- Middendorf, V. Impacts of Hydropower Dams—A Sensitivity Analysis for Integrating Indicators of Ecological and Societal Relevance. Master’s Thesis, Eberhard Karls Universität, Tübingen, Germany, 2018. [Google Scholar]
- R Core Team. R: A Language and Environment for Statistical Computing; R Foundation for Statistical Computing: Vienna, Austria, 2020; Available online: https://www.R-project.org/ (accessed on 5 January 2020).
- Llupo, S.; Spahiu, S.; Ismaili, E.; Dhima, S.; Mansaku, R. Profoundal Environmental Impact Assessment Report for the Construction of HPP Pocem; GR Albania Environmental: Tirana, Albania, 2015. [Google Scholar]
- Hauer, C.; Aigner, H.; Fuhrmann, M.; Holzapfel, P.; Rindler, R.; Pessenlehner, S.; Pucher, D.; Skrame, K.; Liedermann, M. Measuring of Sediment Transport and Morphodynamics at the Vjosa River/Albania. 2019. Available online: https://balkanrivers.net/sites/default/files/Sediment%20Study%20Boku%202019.pdf (accessed on 10 September 2020).
- ABKONS. Përmbledhja Joteknike e Vnm-së Thelluar Projekti: Hidrocentrali i Kalivaçit. 2019. Available online: http://kalivachpp.com/wp-content/uploads/2019/08/HP-Kalivac-Studimit-VNMS-Raporti.pdf (accessed on 9 September 2020).
- Miho, P.A.; Qorri, A.; Paparisto, P.A.; Anton, P.; Gerken, P.B.; Pepa, B.; Durmishi, P.Ç.; Komposch, P.C.; Hauer, C.; Haring, P.E.; et al. Vjosa River: Review of the Main Environmental and Social Impact Assessment (ESIA) for the HPP Kalivaç. 2020. Available online: https://balkanrivers.net/sites/default/files/Kalivac%20EIA%20criticism.pdf (accessed on 1 October 2020).
- Opperman, J. The unexpectedly large impacts of small hydropower. Forbes Magazine. 10 August 2018. Available online: https://www.forbes.com/sites/jeffopperman/2018/08/10/the-unexpectedly-large-impacts-of-small-hydropower/?sh=15515a6f7b9d (accessed on 1 August 2019).
- de Faria, F.A.M.; Davis, A.; Severnini, E.; Jaramillo, P. The local socio-economic impacts of large hydropower plant development in a developing country. Energy Econ. 2017, 67, 533–544. [Google Scholar] [CrossRef]
- Johansson, P.O.; Hakansson, C.; Kriström, B.; Leonardsson, K.; Lundqvist, H. Salmon and Hydropower: Dynamic Cost-Benefit Analysis. In Proceedings of the Fifth International Symposium on Ecohydraulics, Congress Proceedings, Madrid, Spain, 12–17 September 2004. [Google Scholar]
- Hurst, H.E. Long-term storage capacity of reservoirs. Trans. Am. Soc. Civ. Eng. 1951, 116, 770–799. [Google Scholar]
- Kantelhardt, J.W.; Rybski, D.; Zschiegner, S.A.; Braun, P.; Koscielny-Bunde, E.; Livina, V.; Havli, S.; Bunde, A. Multifractality of river runoff and precipitation: Comparison of fluctuation analysis and wavelet methods. Phys. A Stat. Mech. Its Appl. 2003, 330, 240–245. [Google Scholar] [CrossRef]
- Kantelhardt, J.W.; Koscielny-Bunde, E.; Rybski, D.; Braun, P.; Bunde, A.; Havlin, S. Long-term persistence and multifractality of precipitation and river runoff records. J. Geophys. Res. Atmos. 2006, 111. [Google Scholar] [CrossRef]
- Dimitriadis, P.; Koutsoyiannis, D. Stochastic synthesis approximating any process dependence and distribution. Stoch. Environ. Res. Risk Assess. 2018, 32, 1493–1515. [Google Scholar] [CrossRef]
- Sutcliffe, J.; Hurst, S.; Awadallah, A.G.; Brown, E.; Hamed, K. Harold Edwin Hurst: The Nile and Egypt, past and future. Hydrol. Sci. 2016, 61, 1557–1570. [Google Scholar] [CrossRef]
- Koutsoyiannis, D. Scale of water resources development and sustainability: Small is beautiful, large is great. Hydrol. Sci. J. 2011, 56, 553–575. [Google Scholar] [CrossRef]
- Pettoa, A.; Merkohasanajb, M.; Lushajc, A.; Bogdani-Ndinid, M.; Lushaje, A.; Lushajf, B.M.; Eneida Isufajb, S.I.; Kodrab, E.; Sopajb, E.; Demiraj-Bruçig, E.; et al. The Expected Impacts of Climate Changes to the Transboundary Water Resources in Vjosa River Catchment, Albania. Online Int. Interdiscip. Res. J. 2014, 2050, 96–103. [Google Scholar]


| Indicator Normalized to 1 MW | Mann–Whitney U | p-Value | Mean Value (Indicator/MW) | |
|---|---|---|---|---|
| SHP | LHP | |||
| Reservoir Size [km2/MW] | 166 | 0.584 | 481,801 | 212,613 |
| River Regulation [%/MW] | 33 | <0.001 ** | 45 | 4 |
| River Fragmentation [%/MW] | 27 | <0.001 ** | 16 | 1 |
| Resettlement [No/MW] | 160 | 0.584 | 59 | 28 |
| Land Use Change—Agriculture [km2/MW] | 265 | 0.057 | 276,670 | 178,946 |
| Land Use Change—Vegetation Cover [km2/MW] | 103.5 | 0.035 * | 186,339 | 20,752 |
| Sediment Entrapment [years/MW] | 30 | <0.001 ** | 8385 | 24 |
| Potential Evaporation [m3/MW] | 174 | 0.725 | 450,667 | 200,670 |
| Protected Areas [km2/MW] | 158.5 | 0.426 | 96,965 | 14,921 |
Publisher’s Note: MDPI stays neutral with regard to jurisdictional claims in published maps and institutional affiliations. |
© 2021 by the authors. Licensee MDPI, Basel, Switzerland. This article is an open access article distributed under the terms and conditions of the Creative Commons Attribution (CC BY) license (http://creativecommons.org/licenses/by/4.0/).
Share and Cite
Peters, R.; Berlekamp, J.; Lucía, A.; Stefani, V.; Tockner, K.; Zarfl, C. Integrated Impact Assessment for Sustainable Hydropower Planning in the Vjosa Catchment (Greece, Albania). Sustainability 2021, 13, 1514. https://doi.org/10.3390/su13031514
Peters R, Berlekamp J, Lucía A, Stefani V, Tockner K, Zarfl C. Integrated Impact Assessment for Sustainable Hydropower Planning in the Vjosa Catchment (Greece, Albania). Sustainability. 2021; 13(3):1514. https://doi.org/10.3390/su13031514
Chicago/Turabian StylePeters, Rebecca, Jürgen Berlekamp, Ana Lucía, Vittoria Stefani, Klement Tockner, and Christiane Zarfl. 2021. "Integrated Impact Assessment for Sustainable Hydropower Planning in the Vjosa Catchment (Greece, Albania)" Sustainability 13, no. 3: 1514. https://doi.org/10.3390/su13031514
APA StylePeters, R., Berlekamp, J., Lucía, A., Stefani, V., Tockner, K., & Zarfl, C. (2021). Integrated Impact Assessment for Sustainable Hydropower Planning in the Vjosa Catchment (Greece, Albania). Sustainability, 13(3), 1514. https://doi.org/10.3390/su13031514