
Sustainability Evaluation of Renewable Energy Incubators Using Interval Type-II Fuzzy AHP-TOPSIS with MEA-MLSSVM


1
School of Economics and Management, North China Electric Power University, Beijing 102206, China
2
School of Management, Hebei Geo University, Shijiazhuang 050031, China
3
Strategy and Management Base of Mineral Resources in Hebei Province, Hebei GEO University, Shijiazhuang 050031, China
*
Author to whom correspondence should be addressed.
Sustainability 2021, 13(4), 1796; https://doi.org/10.3390/su13041796
Submission received: 11 January 2021
/
Revised: 27 January 2021
/
Accepted: 2 February 2021
/
Published: 7 February 2021
(This article belongs to the Special Issue Renewable Energy and Environmental Pollution)
Abstract
:With the development of renewable energy, renewable energy incubators have emerged continuously. However, these incubators present a crude development model of low-level replication and large-scale expansion, which has triggered a series of urgent problems including unbalanced regional development, low incubation efficiency, low resource utilization, and vicious competition for resources. There are huge challenges for the sustainable development of incubators in the future. A scientific and accurate evaluation approach is of great significance for improving the sustainability of renewable energy incubators. Therefore, this paper proposes a novel method combining an interval type-II fuzzy analytic hierarchy process (AHP) with mind evolutionary algorithm-modified least-squares support vector machine (MEA-MLSSVM). The indicator system is established from two aspects: service capability and operational efficiency. TOPSIS integrated with an interval type-II fuzzy AHP is employed for index weighting and assessment. In the least-squares support vector machine (LSSVM), the traditional radial basis function is replaced with the wavelet transform function (WT), and the parameters are fine-tuned by the mind evolutionary algorithm (MEA). Accordingly, the establishment of a comprehensive sustainability evaluation model for renewable energy incubators is accomplished in this paper. The experimental study reveals that this novel technique has the advantages of scientificity and precision and provides a decision-making basis for renewable energy incubators to realize sustainable operation.
1. Introduction
The renewable energy incubator, as an efficacious tool of renewable energy achievement in industrialization, has aroused wide public concern. It is a kind of business incubator, the concept of which came from the Betevia industrial center under the leadership of Mancuso in 1956 [1]. The role of small start-ups in economic growth has been generally accepted since 1980, and numerous business incubators have emerged and achieved success in developed countries such as Europe and America [2]. With the burgeoning development of renewable energy, there is an incessant springing up of renewable energy incubators [3]. However, the sustainable development of incubators is faced with great challenges, due to their extensive growth, of low-level replication and large-scale expansion, which has caused a series of problems including unbalanced regional development, low incubation efficiency, low resource utilization rate, and vicious resource competition [4]. In order to describe the status, identify the bottleneck, and address the problems in sustainable growth, it is necessary to evaluate the sustainable development capacity of renewable energy incubators.
The existing literature has mainly focused on the operation performance and evaluation of incubators, while few studies have paid attention to renewable energy incubators and their sustainable development [5]. In light of the performance assessment of science and technology incubators, Reference [6] introduced a multi-level extension model for empirical analysis based on the index system of relevant enterprises in Jiangsu, China, from the perspectives of incubator construction, serviceability, incubation performance, and social contribution. Reference [7] comprehensively took the incubation infrastructure, service, benefit, and effect into account in terms of a performance assessment indicator system of cultural industry incubators. Four samples were estimated in Zibo City in accordance with the corresponding determined index weight and scoring standard. Data envelopment analysis (DEA) was employed to estimate the technical efficiency, pure technical efficiency, and scale efficiency of the Chinese provincial incubator industry in Reference [8]. Few scholars concentrate on the sustainable growth ability of incubators. Quantitative approaches are mostly applied to assess operational efficiency and performance, while qualitative methods are chiefly used for sustainability evaluation. Reference [9] designed an integrated mechanism to achieve the sustainable development of cultural business incubators including multi-level screening, comprehensive service, virtual and reality combination, and joint investment mechanisms. Reference [10] proposed that different revenue strategies and support modes had a great impact on incubator income, the number of incubated enterprises, and graduated companies. Nevertheless, research on the sustainable development ability of incubators mainly stays in the stage of qualitative description and, therefore, lacks systematic and in-depth multi-dimensional quantitative assessment. Hence, this paper intends to combine qualitative means with quantitative techniques in the sustainable development capability evaluation of renewable energy incubators. Thus, appropriate models and an index system are established to conduct this experiment from the perspectives of serviceability and operation efficiency.
The existing evaluation methods, which chiefly include traditional assessment approaches and modern intelligent algorithms, are of great significance for the sustainable development estimation of renewable energy incubators [11]. Traditional assessment models can be separated into subjective and objective modes. For example, expert evaluation, the fuzzy analytic hierarchy process, and the network analytic hierarchy process are exploited for subjective judgment, while entropy weight method, principal component analysis, gray correlation analysis, matter-element extension model, and ideal solution are utilized for objective estimation [12,13,14]. In recent years, some improved solutions for these traditional evaluation methods have also emerged with excellent results. For example, Reference [15] proposed a novel method to support decision-making in an uncertain environment based on normalized interval-valued triangular fuzzy numbers and the comet technique. Modern intelligent techniques principally consist of an artificial neural network (ANN), a support vector machine (SVM), the least-squares support vector machine (LSSVM), and so on [16]. Due to the mature theory and accurate calculation of traditional evaluation methods and the quick processing capability of intelligent algorithms [17,18,19], this study has established a combined assessment approach where interval type-II fuzzy integrated with the analytic hierarchy process (AHP) is employed for index weight determination, and technique for order preference by similarity to an ideal solution (TOPSIS) is applied for comprehensive estimation and ranking. With regard to intelligent evaluation techniques, an ANN is confronted with slow convergence speed and easily falls into a local optimum [20]. As a valid alternative, an SVM overcomes the defects of an ANN by converting the solving process into quadratic programming based on kernel function transformation [21]. Considering the low efficiency and not ideal convergence accuracy of an SVM, an LSSVM makes use of the least-squares linear system as the loss function, which avoids the process of quadratic programming [22]. Simultaneously, the improvement in evaluation precision and speed can be achieved via transforming inequality constraints into equality ones [23]. It is worth noting that the traditional Gaussian kernel function in the LSSVM model is correlated, even redundant, and presents poor nonlinear processing ability. Owing to the orthogonal property, the wavelet transform function (WT) is able to gradually describe data information and make multi-resolution analysis on wavelet signal. Additionally, the nonlinear processing capability is superior to the Gaussian kernel function [24]. Therefore, in our study, WT is employed to improve LSSVM for comprehensive evaluation. Nevertheless, two parameters, namely penalty coefficient and kernel parameter, are commonly decided by experience [25]. Thus, it is necessary to select an appropriate heuristic algorithm to determine the values. As a modified optimization approach based on a genetic algorithm (GA), the mind evolutionary algorithm (MEA) is founded on group search and mind imitation [26]. This method not only retains the merits of GA [27], but it also proposes novel core contents of convergence and alienation, which replaces the central ideal of crossover and mutation [28]. The improvement in MEA plays a satisfactory effect on global search and the possibility reduction of trapping into local optimum [29]. Hence, this paper exploits MEA to automatically determine the two parameters in the LSSVM model.
To sum up, this paper establishes the sustainable development evaluation index system of renewable energy incubators and puts forward a hybrid technique that combines interval Type-II fuzzy AHP-TOPSIS with MEA-MLSSVM for assessment. The rest of the paper is organized as follows: Section 2 designs the indicator system including service capability and operational efficiency. Section 3 shows a brief description of the methodology. In Section 4, a comprehensive evaluation technique is analyzed. Section 5 provides a case study to validate the proposed model, and Section 6 summarizes this study.
2. Index System
2.1. Index Selection
In light of the existing research on sustainable development of incubators, this paper carried out the study in two perspectives, that is, service capability and operation efficiency [30,31]. The former refers to the ability to provide various services and enhance the success rate of renewable energy start-ups. Operation efficiency represents the comparative relationship between the incubation benefits and total input, such as human resources and capital. It reflects the ability of self-reliance and independent operation, which offers a guarantee for the sustainable growth of incubators. As it can be seen, service capability ensures renewable energy incubators to realize their responsibilities including incubation and cultivation of enterprises and entrepreneurs and promotion of sustainable development. Operation efficiency reveals whether the incubator can achieve independent running without external support with respect to input–output.
In brief, service capability and operational efficiencies are the core requirement and necessary guarantees for the sustainable development of renewable energy incubators. Thus, the indicator system is established from these two perspectives on the principles of scientificity, comprehensiveness, importance, and operability.
2.1.1. Indexes of Service Capability
Service offered by renewable energy incubators not only comprises basic modes, such as hardware facilities, administrative service, network service, and management training, but also incorporates value-added types including technological innovation, entrepreneurship guidance, as well as a financial and legal consultation. As a result, this study evaluates the service capability of renewable energy incubators from four aspects: management team, basic service, value-added service, and performance indicators.
The management team acts as the functional support for serviceability. In this paper, five indexes are selected: management system, number of administrators in per incubated enterprise, the proportion of administrators with a bachelor degree or above, the proportion of administrators receiving professional training, and entrepreneurship cultivation.
Basic service is made up of hardware facilities, administrative service, and network service level provided by renewable energy incubators.
Value-added service means the higher requirements for incubators advanced by incubated renewable energy enterprises, which mainly includes professional business guidance and related policy consultation. Thus, seven indicators are picked in this study to judge the value-added serviceability, that is, the number of entrepreneurial mentors and the quantities of experts in accounting, finance, law, human resource, marketing, and renewable energy in per incubated enterprises.
Performance indicators are the result-oriented embodiment of the serviceability. The merits of incubators can be shown in light of economic benefits, innovation performance, and social effects. Limited by the availability of the index “the number of approved intellectual property”, this paper selects “proportion of high-tech renewable energy enterprises” as an alternative to measure the innovation benefits.
In this study, twenty indicators are displayed in Table 1 to judge the service capability of incubators.
2.1.2. Indexes of Operation Efficiency
Operation efficiency expresses the relationship between input and output. For example, human involvement such as administrators and guidance specialists, incubation fund, capital, and site investment in pubic technology service platform all belong to the input of incubators, while the output mostly consists of economic benefits derived from incubated enterprises and the incubator itself, incubation achievement, as well as employment opportunity. The specific indexes aiming at operation efficiency are presented in Table 2.
2.2. Index Description
Based on the existing research literature regarding the sustainability of business incubators and the sustainability of other micro-entities, the foregoing indicators are selected in this paper. For a better understanding of the established evaluation index system, the specific meaning of each indicator is explained as follows:
- (1)
- Management system identifies whether there are clear standards for enterprises to enter and graduate, meanwhile judging if a personnel training system is complete.
- (2)
- The number of administrators per incubated enterprise refers to the average number of executives in each incubating company.
- (3)
- The proportion of administrators with a bachelor’s degree or above stands for the educational background of managers.
- (4)
- The proportion of administrators receiving professional training reflects the expertise of executives to a certain degree.
- (5)
- Entrepreneurship cultivation is a momentous part of high-quality development for incubators.
- (6)
- Hard facilities incorporate working site, network, property management (water, electricity, heating, security, greening, and cleaning), and so on.
- (7)
- Administrative service judges the ability of incubators in the coordination of government and enterprises, the co-operation of industrial and commercial tax, as well as science and technology applications.
- (8)
- Network service level is employed to measure whether the incubator can form a valid network platform that can connect the incubating enterprises and social network resources as well as provide service more quickly and conveniently.
- (9)
- The number of entrepreneurial mentors per incubated enterprise refers to the average number of entrepreneurial mentors owned by each company, which represents the corresponding training resource used by each incubated enterprise.
- (10)
- The number of experts in the accounting of per incubated enterprise refers to the average number of accounting specialists owned by each company, which represents the corresponding accounting consultation resource used by each incubated enterprise.
- (11)
- The number of experts in finance per incubated enterprise refers to the average number of financial specialists owned by each company, which represents the corresponding resource used by each incubated enterprise.
- (12)
- The number of experts in the law of per incubated enterprise refers to the average number of legal specialists owned by each company, which represents the corresponding consultation resource used by each incubated enterprise.
- (13)
- The number of experts in human resources per incubated enterprise refers to the average number of human specialists owned by each company, which represents the corresponding consultation resource used by each incubated enterprise.
- (14)
- The number of experts in the marketing of per incubated enterprise refers to the average number of marketing specialists owned by each company, which represents the corresponding consultation resource used by each incubated enterprise.
- (15)
- The number of experts in renewable energy per incubated enterprise refers to the average number of specialists owned by each company, which represents the corresponding consultation resource used by each incubated enterprise.
- (16)
- The rate of enterprises graduated in the current year stands for the proportion of successfully hatched companies in an incubator.
- (17)
- The average income of incubated enterprises is taken as the representative of economic benefits in the incubation period.
- (18)
- The proportion of high-tech renewable energy enterprises can reflect both the technical level of incubating business and service quality offered by the incubator.
- (19)
- The impact of incubated enterprises on local renewable energy development illustrates the effectiveness of incubator support.
- (20)
- Incubated enterprise satisfaction is equivalent to the ratio of incubating companies that are satisfied with the service.
- (21)
- The number of administrators is perceived as the manpower input of incubators.
- (22)
- The number of guidance specialists in accounting, finance, law, human resource, marketing, and renewable energy can be regarded as manpower input of incubators.
- (23)
- Investment in public technology service platforms refers to the funds devoted to improving the service capability of the incubator itself.
- (24)
- The total amount of incubation fund provides capital investment for incubating enterprises.
- (25)
- Site area equals complete construction space of the incubator for work, service, and so on.
- (26)
- The total income of the incubator includes the operation revenue of the incubators itself together with the whole economic output derived from incubating enterprises.
- (27)
- The number of enterprises that acquire financing stands for the companies that obtain financing with the help of incubators.
- (28)
- The number of enterprises that successfully graduate can be treated as one of the primary incubation achievements in the current year.
- (29)
- The number of employees in the incubator and incubating enterprises represents the total quantity of jobs offered by the incubator, which acts as an indicator of social benefits.
3. Methodology
3.1. Interval Type-II Fuzzy AHP-TOPSIS
3.1.1. Interval Type-II Fuzzy Numbers
Considering the influence of complex factors, the sustainable development evaluation of renewable energy incubators is complicated and uncertain. Interval type-II fuzzy number plays a momentous role in coping with indefinite factors and deriving robust results [32]. This technique has been widely used in many fields, such as air quality evaluation, supplier assessment, etc. [33]. The detailed introduction is described as follows [34,35].
Definition 1.
Set type-II fuzzy number as , where X is the type-II membership function of , . can be also expressed as Equation (1):
Definition 2.
If , can be called as interval type-II fuzzy number as shown in Equation (2):
where .
Definition 3.
Type-II fuzzy numbers can give a description of the uncertainty with the help of a bounded region graph. The projection area of on x and μ, also named as footprint uncertainty, is represented by . and stand for the upper and lower bound membership functions, respectively.
Definition 4.
If the aforementioned upper and lower bound membership functions both belong to trapezoidal fuzzy numbers, it can be perceived as interval trapezoidal fuzzy numbers, as presented in Equation (4):
where and are type-I fuzzy sets. , , , , , , , are reference points of . and represent the membership degree of and in the upper and lower bound membership functions, respectively. .
Definition 5.
Randomly select two-interval fuzzy numbers, namely and . Equations (5)–(7) can calculate the probability , that is .
Convert p trapezoidal interval type-II fuzzy numbers in into the interval ones via integral calculation. The probability of pairwise comparison of these fuzzy numbers can be obtained on the basis of Equations (5)–(7). The ranking results are acquired in accordance with Equation (8).
Randomly select two-interval type-II fuzzy numbers and . The calculation system between them consists of four forms as shown in Equations (9)–(12) [36].
(1) Addition
(2) Multiplication
(3) Scalar multiplication
(4) Exponentiation
3.1.2. Interval Type-II Fuzzy AHP Model
AHP is a multi-criteria analysis method that can deal with qualitative problems quantitatively. The scientific hierarchy establishment and clear logical structure make this approach one of the most commonly used multi-criteria decision-making techniques [37]. AHP in combination with fuzzy set theory can resolve the uncertainty and achieve pairwise comparison so as to ensure the consistency of the ranking made by decision-makers. Therefore, the interval type-II fuzzy AHP model is employed in this paper to determine the index weight
The procedures are expressed here in detail:
- (1)
- Establish a pairwise comparison matrix for distinct levels and categories based on interval type-II fuzzy number theory. Decision-makers generally employ linguistic mode in evaluation; thus, it is difficult to define interval type-II fuzzy numbers directly. Five grades of the assessment set are put forward in this study: absolutely strong (AS), very strong (VS), fairly strong (ES), slightly strong (SS), and equal (E). The interval type-II fuzzy numbers corresponding to each comment set are listed in Table 3.
- (2)
- Determine whether the consistency of the comparison matrix is acceptable. If not, the relevant elements in the matrix need to be adjusted.
- (3)
- Integrate the interval type-II fuzzy number contrast matrix via geometrical average method according to Equation (13).
- (4)
- Calculate the fuzzy weights based on Equation (14).where is the geometric mean of the integrated comparison matrix in each row.
- (5)
- Obtain the defuzzification weight in line with DTraT.where , and , are the maximum membership degree of upper and lower membership functions, respectively. , and , equal the maximum and minimum, while , and , represent the second and third parameter of upper as well as lower membership functions, respectively.
3.1.3. TOPSIS
TOPSIS, proposed in the early 1980s, is a multi-objective decision-making method that approximates the ideal solution. The basic principle of this approach is exhibited as follows: firstly determine the distance between the evaluation object and the positive as well as negative ideal solutions. Then, the ranking results can be obtained in accordance with the above distance [38]. It is noteworthy that the positive and negative ideal solutions are not objective existence, but fictitious optimal and worst values, respectively. Sometimes even all of these may dissolve into nothingness. The foundation of this approach is the entropy weight method.
The evaluation results of TOPSIS are not affected by the number of assessment indexes and objects. Simultaneously, the vertical and horizontal comparison can be executed for each estimation target. This superiority is most obvious in the projects with a large number of indexes as well as a small evaluation scale. The prime advantage of TOPSIS is the valid utilization of the original data. In this way, this technique can acquire the evaluation results in line with the actual situation of the project. In light of few applications in practical projects, it is of great necessity to constantly improve the performance of TOPSIS for more scientific and reasonable assessment [39].
3.1.4. Comprehensive Evaluation Based on Interval Type-II Fuzzy AHP-TOPSIS
In accordance with the index weights derived from interval type-II fuzzy AHP, the research on sustainable development estimation of renewable energy incubators can be put into practice via TOPSIS.
- (1)
- Implement weighted operation on initial data
In Equation (16), a weighted normalized matrix is obtained, where and represent the level and number of assessment indicators, respectively.
- (2)
- Calculate positive and negative ideal solutions
The assumption is proposed here that the positive and negative ideal solutions equal the optimal and worst values correspondingly, as described in Equations (17) and (18).
where and are the cost indexes and profit indicators, respectively. and represent the positive and negative ideal solutions of and .
The Euclidean distance is calculated as Equations (19) and (20):
- (3)
- Determine the relative closeness degree
On the basis of Equation (21), the relative closeness degree is acquired:
In the aforementioned calculation, the distance between each index and the positive as well as the negative ideal solution is obtained, and the homologous Euclidean distance indicates the closeness degree. The nearer the distance is, the more closely the evaluation object approximates the ideal level, which also corresponds to a higher ranking.
3.2. MEA-MLSSVM
3.2.1. MEA
MEA is an evolutionary algorithm directed against the limitations of GA [40]. It retains a few ideas in GA, such as “population”, “individual”, “environment”, and “evolution”, but different from “crossover” and “mutation”, MEA puts forward new concepts, namely “convergence” and “alienation”. Compared with GA-LSSVM, LSSVM optimized by MEA has the advantages of global optimization and low possibility of falling into local optimum. In MEA, the selection of individuals in subgroups can be achieved through convergence. The mature subgroups compete globally via alienation. The structure of MEA is illustrated in Figure 1.
The basic idea and steps of MEA are presented as follows:
- (1)
- Randomly generate a series of individuals and calculate the reciprocal of the mean square error as the corresponding score. Several individuals with relatively high scores are deemed as the superior ones and temporary ones.
- (2)
- In the center of selected individuals, generate new ones and obtain superior and temporary subgroups, separately.
- (3)
- Implement convergence on each subgroup, that is, individuals compete for the winner. When the winner no longer changes, it demonstrates that the subgroup is mature. Thus, the score of the winner is perceived as the points of the subgroup and posted on the global bulletin board.
- (4)
- Implement alienation on all subgroups in the global space after convergence. The replacement, abandonment, and individual release of the superior subgroup and temporary subgroup are completed by comparing the scores. Accordingly, the optimal individual and its score in the global scope can be obtained.
- (5)
- The individuals released from the subgroup generate new temporary subgroups in the solution space. The total number of temporary subgroups should be unchanged. Judge whether the accuracy is satisfied. If not, repeat Step (3) and Step (4) until the end of an iteration or the optimal score does not change. Finally, output the optimal individual.
3.2.2. Modified LSSVM (MLSSVM)
As an extension of SVM, there exist two main differences in LSSVM: (i) LSSVM establishes the optimal decision platform through transferring the input into higher-dimensional space. (ii) LSSVM applies the principle of risk minimization to transform the inequality constraints into equality ones. These two parts are conducive to reducing the calculation complexity and promoting the operation speed [41].
In LSSVM, set the training sample as , where represents the total number. The regression model is described as Equation (22):
where maps the training data into a much higher dimensional space; and are the weight vector and bias, respectively.
The optimization problem can be transformed as follows:
where the regularization parameter is exploited to balance the complexity and precision in the model; equals the error.
To solve the aforementioned equation, the Lagrange function is listed as Equation (25):
where are Lagrange multipliers. According to Equation (26), the derivation result of each variable can be acquired.
The optimization problem is transformed into the following equation via the elimination of and .
where , , , .
Hereby, Equation (28) presents the final form of LSSVM:
where is the kernel function.
In this paper, the wavelet kernel function is selected to substitute the Gaussian kernel function in standard LSSVM, that is
Thus, the modified LSSVM is expressed as Equation (31):
The following points give the reason why the traditional radial basis function is replaced with WT: (a) WT is able to describe the data step by step, and LSSVM along with WT can simulate arbitrary function more accurately. (b) WT is orthogonal or nearly orthogonal, while the traditional Gaussian kernel function is correlated or even redundant. (c) The nonlinear processing performance of WT is superior to the Gaussian kernel function on account of multi-resolution ability, which contributes to the improvement of generalization capability and robustness in LSSVM.
4. Evaluation Approach Based on Interval Type-II Fuzzy AHP-TOPSIS and MEA-MLSSVM
A novel hybrid assessment technique incorporating AHP-TOPSIS and MEA-MLSSVM is constructed as presented in Figure 2. Interval type-II fuzzy AHP-TOPSIS is used to obtain traditional estimation results, and the final assessment is accomplished through MLSSVM optimized by MEA. The specific steps are listed as follows:
Step 1: Implement input initialization and data preprocessing. On the foundation of the index system, establish the initial input set and put quantification and standardization into practice.
Step 2: Acquire conventional evaluation results based on interval type-II fuzzy AHP-TOPSIS.
Step 3: Initialize the parameters in MEA and MLSSVM.
Step 4: Optimize the parameters in MLSSVM via MEA, which are related to evaluation precision of sustainable development for renewable energy incubators. Consequently, this hybrid technique searches for the key parameters by MEA. If the number of iterations reaches the maximum, it demonstrates that the optimal values have been obtained. Otherwise, it is of necessity to rerun this algorithm to acquire the corresponding optimum set. The evaluation approach can be determined through training on test samples.
Step 5: Output the assessment results and make an analysis.
5. Case Study
5.1. Evaluation Based on Interval Type-II Fuzzy AHP-TOPSIS
5.1.1. Determination of Index Weight
In line with the ideas derived from 40 experts, test the consistency of the judgment matrix and attain the linguistic scale values of two first-grade indicators. Table 4 illustrates a few results.
The linguistic values (namely AS, VS, FS, SS, E) are converted into corresponding interval type-II fuzzy numbers according to the comparison relationship in Table 3. The composite values of expert evaluation are computed. Table 5 exhibits the fuzzy weight, deblurred weight, and the standardized weight of the first-grade indexes. Similarly, the indicator weights of second-grade and third-grade are listed in Table 6.
5.1.2. Evaluation Based on TOPSIS
This paper takes 30 renewable energy incubators for the experiment. The standardized data are listed in Table 7. Table 8 manifests the calculation results of the weighted normalized matrix for the first ten samples. The positive and negative solutions, as well as the Euclidean distance, are shown in Table 9 and Table 10, respectively.
The relative closeness degree of each renewable energy incubator is calculated and sorted here. The greater closeness degree means better sustainability of renewable energy incubators. The ranking results of the 30 incubators are exhibited in Table 11 and Figure 3.
It can be seen that Sample 10 and Sample 5 present the best and worst sustainability based on interval type-II fuzzy AHP-TOPSIS, respectively.
5.2. MEA-MLSSVM Analysis
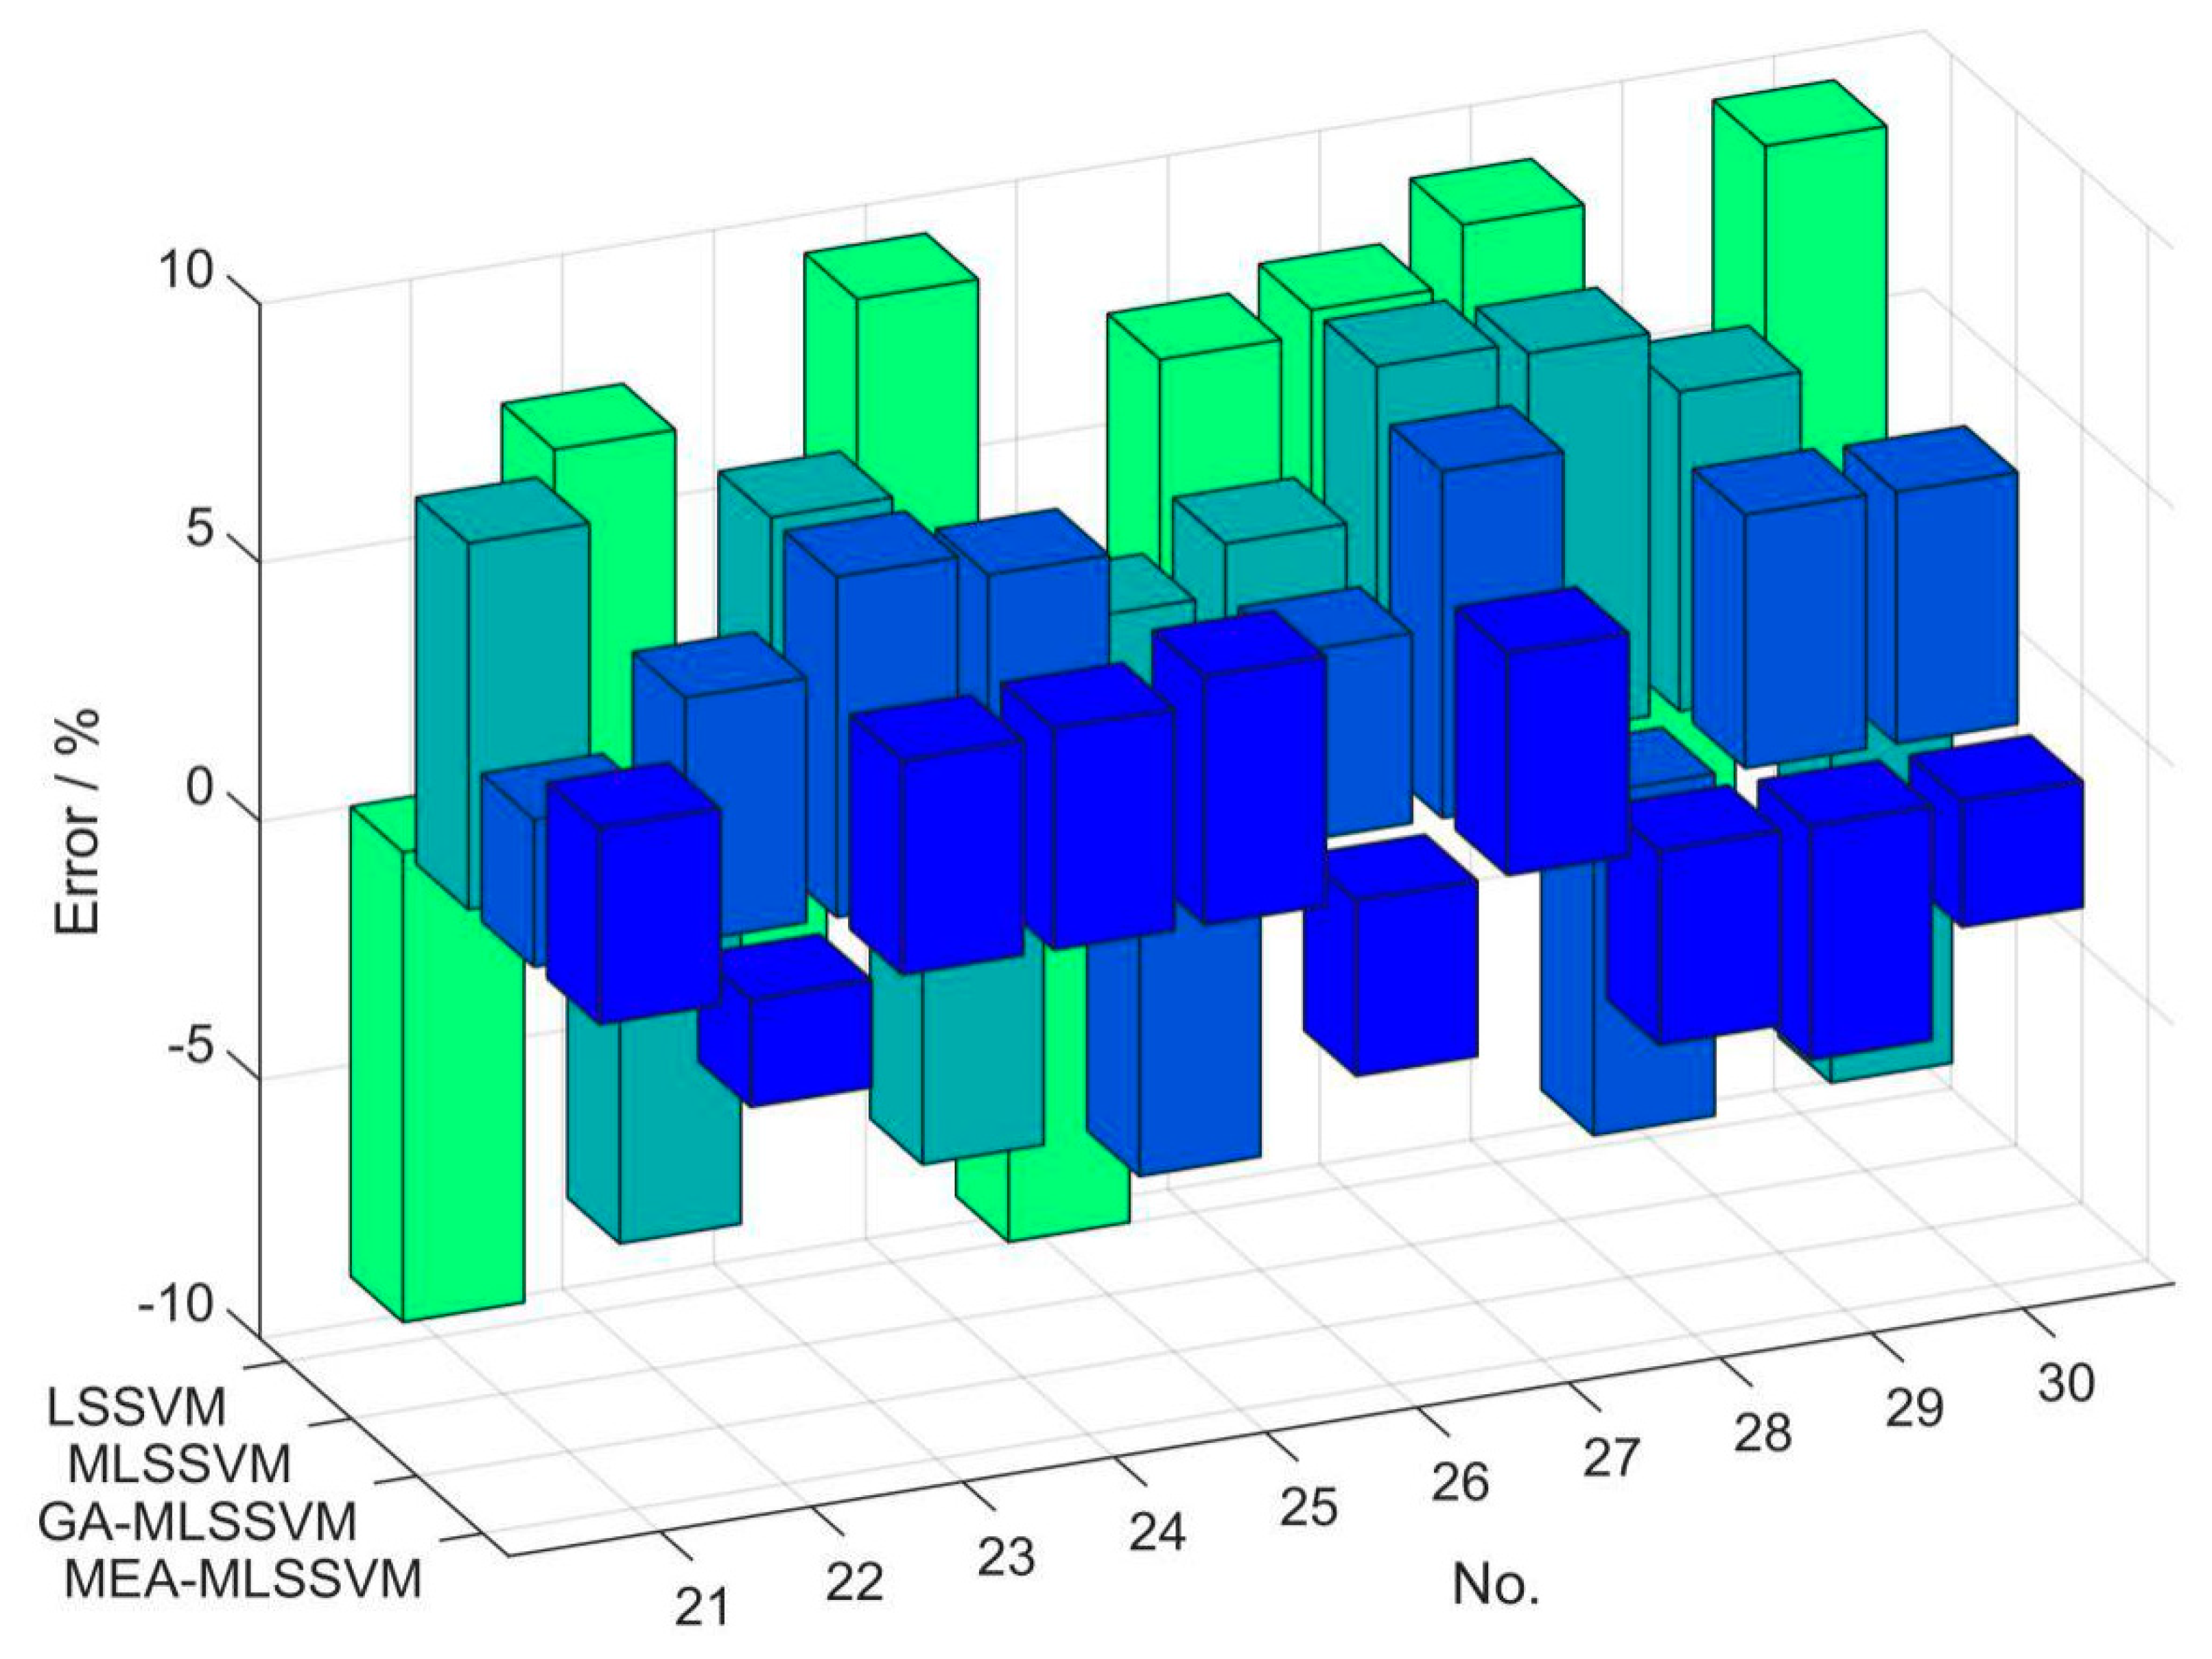
The first 20 renewable energy incubators are used as a training set, and the remaining incubators are exploited as a test set. To verify the proposed model, this paper makes the comparison with MEA-LSSVM, GA-MLSSVM, MLSSVM, and LSSVM. Table 12 and Figure 4 display the testing results. The performances of the assessment approaches are measured by relative errors as presented in Table 13 and Figure 5.
From the above figures and tables, we find that all the relative errors of MEA-MLSSVM are controlled in [−5%, 5%], while the corresponding number of errors within [−5%, 5%] of GA-LSSVM, MLSSVM, and LSSVM equals five (namely Sample 21, Sample 22, Sample 26, Sample 20, and Sample 30), two (namely Sample 25 and Sample 26), and none, respectively. In addition, the error range of MEA-MLSSVM is [2.08%, 4.82%], whereas the evaluation error ranges of GA-LSSVM, MLSSVM, and LSSVM are [2.86%, 6.71%], [3.69%, 7.67%], as well as [5.68%, 9.46%], respectively. Hence, the evaluation accuracy from superior to inferior is ranked as follows: MEA-MLSSVM, GA-LSSVM, MLSSVM, and LSSVM. It is obvious that MEA-MLSSVM has advantages in precision and stability, which proves MEA achieves satisfactory optimization performance with regards to LSSVM.
In this study, MEA-MLSSVM is introduced on the basis of interval type-II fuzzy AHP-TOPSIS for sustainable development of renewable energy incubators so as to simplify the process of expert scoring and realize fast calculation. The intelligent algorithm can flexibly and efficiently study the scoring methods and standards of qualitative indexes through machine training, as well as simulate the expert scoring process, which is conducive to subjectivity reduction and more objective evaluation.
6. Conclusions
This paper designs a comprehensive assessment index system of sustainable development for renewable energy incubators and establishes a hybrid evaluation model incorporating interval type-II fuzzy AHP-TOPSIS and MEA-MLSSVM. Several conclusions can be obtained as follows: (a) the index system is proposed from two perspectives, that is, service capability and operation efficiency, which act as the core requirements and necessary guarantee. Specifically, service capability includes four aspects: management team, basic service, value-added service, and performance indicators; operation efficiency includes two dimensions: input indexes and output indexes. (b) The traditional estimation results are obtained on the foundation of interval type-II fuzzy AHP combined with TOPSIS. It is clarified that the interval type-II fuzzy numbers introduced into the evaluation model can well handle numerous uncertainties and obtain robust results. (c) An intelligent evaluation model based on MEA-MLSSVM is constructed illustrating that the introduction of WT and MEA improves the performance of LSSVM. The case study verifies the scientificity and precision of the established technique. Wherein the traditional assessment approach can acquire scientific and exact results, the modern intelligent algorithm can not only reduce the subjectivity, but also conduce to more objective, accurate, and rapid evaluation. However, more sample data are needed for validation. Simultaneously, leveraging more types of intelligent models to evaluate the sustainability of renewable energy incubators is also a direction for our future research.
Author Contributions
Conceptualization, Y.L.; Data curation, G.L. and Y.L.; Funding acquisition, Y.L.; Investigation, G.L. and Y.L.; Methodology, Y.L.; Project administration, D.N. and Y.L.; Resources, Y.L.; Software, G.L.; Supervision, Y.L. and D.N.; Validation, G.L.; Writing—original draft, G.L. and Y.L.; Writing—review & editing, Y.L. All authors have read and agreed to the published version of the manuscript.
Funding
This work is supported by the Natural Science Foundation of Hebei Province, China (Project No. G2020403008).
Institutional Review Board Statement
Not applicable.
Informed Consent Statement
Not applicable.
Data Availability Statement
Not applicable.
Conflicts of Interest
The authors declare no conflict of interest.
References
- Eli, S.; Utomo, H.J.N.; Rauf, M.F. Technology based Business Incubator as an Effort to Increase Entrepreneurship in Higher Education. Int. J. Psychosoc. Rehabil. 2020, 24, 458–464. [Google Scholar] [CrossRef]
- Konyuhov, V.Y.; Gladkih, A.M.; Zott, R.S. Accelerator as an effective replacement of a business incubator in the Irkutsk region. J. Phys. Conf. Ser. 2020, 1582, 012045. [Google Scholar] [CrossRef]
- Al Ayyash, S.; McAdam, M.; O’Gorman, C. Towards a New Perspective on the Heterogeneity of Business Incubator-Incubation Definitions. IEEE Trans. Eng. Manag. 2020, 99, 1–15. [Google Scholar] [CrossRef]
- Son, Y.J.; Choi, J.I. University Entrepreneurial Ecosystem and Business Incubator’s Performance: The Case Study of National H University. Korean J. Resour. Dev. 2020, 23, 1–24. [Google Scholar] [CrossRef]
- Tristiarini, N.; Oktafiyani, M.; Sedayu, A. Optimalization Model of University Business Incubator Role in New Entrepreneur and MSMEs Development in Indonesia. J. Small Bus. Entrep. 2020, 8, 17–31. [Google Scholar]
- Tian, T.; Shen, M. Research on the development performance of science and technology business incubator -- An em-pirical analysis based on multilevel extension model. Enterp. Econ. 2020, 39, 47–53. [Google Scholar]
- Sui, H.L.; LV, M.Y.; Ma, D.S. Construction and Empirical Study of performance evaluation system of cultural industry incubator —Taking Zibo City as an example. J. Shandong Univ. Technol. 2020, 36, 21–26. [Google Scholar]
- Jin, L. China’s Incubator Industry Efficiency Evaluation—Based on DEA Analysis of Provincial Data. IOP Conf. Ser. Earth Environ. Sci. 2020, 526, 012057. [Google Scholar] [CrossRef]
- Ma, J. Sustainable Incubation Mechanism of Cultural Enterprises: Investigation and Analysis of Cultural Business Incubators in Chengdu. J. Arts Manag. 2019, 3, 72–79. [Google Scholar]
- Cui, X.M.; Jiang, N. The Research on the Sustainable Development of Enterprise Incubator Based on System Dynamics. East. China Econ. Manag. 2013, 27, 116–120. [Google Scholar]
- Chen, S.; Xudong, Z.; Baoqiang, X.; Yuanhao, X.; Junpeng, X. Evaluation Method of Important Nodes of Water Supply Network Under Terrorist Attack. IOP Conf. Ser. Earth Environ. Sci. 2020, 571, 012095. [Google Scholar]
- Bienvenido-Huertas, D.; Pérez-Ordóñez, J.L.; Moyano, J.; Seara-Paz, S. Towards an in-situ evaluation methodology of thermal resistance of basement walls in buildings. Energy Build. 2020, 208, 109643. [Google Scholar] [CrossRef]
- Saabun, W.; Jarosaw, W.; Shekhovtsov, A. Are MCDA Methods Benchmarkable? A Comparative Study of TOPSIS, VIKOR, COPRAS, and PROMETHEE II Methods. Symmetry 2020, 12, 1–55. [Google Scholar]
- Kizielewicz, B.; Saabun, W. A New Approach to Identifying a Multi-Criteria Decision Model Based on Stochastic Optimization Techniques. Symmetry 2020, 12, 1551. [Google Scholar] [CrossRef]
- Shahzad, F.; Wojciech, S.; Samee, U.; Tabasam, R.; Jakub, W. A New Method to Support Deci-sion-Making in an Uncertain Environment Based on Normalized Interval-Valued Triangular Fuzzy Numbers and COMET Technique. Symmetry 2020, 12, 516. [Google Scholar]
- Zhang, Y.; Hu, Z.; Ji, L.; Sun, N.; Lin, Y. Evaluation model of enterprise operation based on BP neural network optimization algorithm. J. Phys. Conf. Ser. 2020, 1570, 012084. [Google Scholar] [CrossRef]
- Huang, D.; Liu, H.; Zhu, L.; Li, M.; Xia, X.; Qi, J. Soil organic matter determination based on artificial olfactory system and PLSR-BPNN. Meas. Sci. Technol. 2021, 32, 035801. [Google Scholar] [CrossRef]
- Saabun, W.; Urbaniak, K. A New Coefficient of Rankings Similarity in Decision-Making Problems. In International Conference on Computational Science; Springer: Berlin/Heidelberg, Germany, 2020. [Google Scholar]
- Zheng, S.; Jiang, A.; Yang, X.R.; Luo, G.C. A New Reliability Rock Mass Classification Method Based on Least Squares Support Vector Machine Optimized by Bacterial Foraging Optimization Algorithm. Adv. Civ. Eng. 2020, 2020, 1–13. [Google Scholar] [CrossRef]
- Liu, C.; Hu, X.; Yao, R.; Han, Y.; Wang, Y.; He, W.; Fan, H.; Du, L. Assessment of Soil Thermal Conductivity Based on BPNN Optimized by Genetic Algorithm. Adv. Civ. Eng. 2020, 2020, 1–10. [Google Scholar] [CrossRef]
- Ru, Z.; Zhao, H.; Zhu, C. Probabilistic evaluation of drilling rate index based on a least square support vector machine and Monte Carlo simulation. Bull. Int. Assoc. Eng. Geol. 2018, 78, 3111–3118. [Google Scholar] [CrossRef]
- Song, X.; Zhao, J.; Song, J.; Dong, F.; Xu, L.; Zhao, J. Local Demagnetization Fault Recognition of Permanent Magnet Synchronous Linear Motor Based on S-Transform and PSO–LSSVM. IEEE Trans. Power Electron. 2020, 35, 7816–7825. [Google Scholar] [CrossRef]
- Ge, Q.; Guo, C.; Jiang, H.; Lu, Z.; Yao, G.; Zhang, J.; Hua, Q. Industrial Power Load Forecasting Method Based on Reinforcement Learning and PSO-LSSVM. IEEE Trans. Cybern. 2020, 99, 1–13. [Google Scholar] [CrossRef] [PubMed]
- Mahmoodi, N.M.; Abdi, J.; Taghizadeh, M.; Taghizadeh, A.; Hayati, B.; Shekarchi, A.A.; Vossoughi, M. Activated carbon/metal-organic framework nanocomposite: Preparation and photocatalytic dye degradation mathematical modeling from wastewater by least squares support vector machine. J. Environ. Manag. 2019, 233, 660–672. [Google Scholar] [CrossRef]
- Zhao, D.; Ding, J.; Chai, S. Systemic financial risk prediction using least squares support vector machines. Mod. Phys. Lett. B 2018, 32, 1850183. [Google Scholar] [CrossRef]
- Zhao, H.; Yu, L.; Cao, J.; Jia, H.; Jiang, Y. Improving the measuring length accuracy of articulated arm coordinate measuring machine using artificial neural network. Rev. Sci. Instrum. 2020, 91, 125106. [Google Scholar] [CrossRef] [PubMed]
- Lei, W.; Gastro, O.; Wang, Y.; Felicien, N.H.; Hui, L. Intelligent modelling to predict heat transfer coefficient of vacuum glass insulation based on thinking evolutionary neural network. Artif. Intell. Rev. 2020, 53, 5907–5928. [Google Scholar] [CrossRef]
- Wang, W.; Tang, R.; Li, C.; Liu, P.; Luo, L. A BP neural network model optimized by Mind Evolutionary Algorithm for predicting the ocean wave heights. Ocean. Eng. 2018, 162, 98–107. [Google Scholar] [CrossRef]
- Li, G.; Li, W.H. Facial feature tracking based on mind evolutionary algorithm. J. Jilin Univ. 2015, 45, 606–612. [Google Scholar]
- Song, F.; Su, F.; Zhu, D.; Li, L.; Li, H.; Sun, D. Evaluation and driving factors of sustainable development of the wetland ecosystem in Northeast China: An emergy approach. J. Clean. Prod. 2020, 248, 119236. [Google Scholar] [CrossRef]
- Maksyshko, N.; Vasylieva, O.; Polova, A. Method of investment projects evaluation for territorial communities taking into account the concept of sustainable development. E3s Web Conf. 2020, 166, 13020. [Google Scholar] [CrossRef] [Green Version]
- Singh, S.; Panda, A.K. An Interval Type-2 Fuzzy-Based DTC of IMD Using Hybrid Duty Ratio Control. IEEE Trans. Power Electron. 2020, 35, 8443–8451. [Google Scholar] [CrossRef]
- Khalifa, T.; El-Nagar, A.; El-Brawany, M.; El-Araby, E.; El-Bardini, M. A Novel Hammerstein Model for Nonlinear Networked Systems Based on an Interval Type-2 Fuzzy Takagi-Sugeno-Kang System. IEEE Trans. Fuzzy Syst. 2020, 29, 275–385. [Google Scholar] [CrossRef]
- Fateminia, S.H.; Sumati, V.; Fayek, A.R. An Interval Type-2 Fuzzy Risk Analysis Model (IT2FRAM) for Determining Con-struction Project Contingency Reserve. Algorithms 2020, 13, 163. [Google Scholar] [CrossRef]
- Lin, C.-J.; Jeng, S.-Y.; Lin, H.-Y.; Yu, C.-Y. Design and Verification of an Interval Type-2 Fuzzy Neural Network Based on Improved Particle Swarm Optimization. Appl. Sci. 2020, 10, 3041. [Google Scholar] [CrossRef]
- Abbasimehr, H.; Nourani, E.; Shabani, M. A hybrid framework for ranking reviewers based on interval type-2 fuzzy AHP and VIKOR. Int. J. Intell. Eng. Inform. 2020, 8, 95. [Google Scholar]
- Fendji, J.L.E.K.; Kongne, R.; Thron, C.; Yenke, B.; Ngakou, A.; Kamgang, J. Improving farmers’ net revenue in traditional context: Analytic Hierarchy Process, Expert System, and Linear Programming. Eai Endorsed Trans. Context. Syst. Appl. 2020, 7, 163975. [Google Scholar] [CrossRef] [Green Version]
- Gu, Q.; Wang, R. Evaluation Path Selection of Opening-Up Level of Chinese Coastal Cities Based on Entropy Weight-Topsis-Grey Correlation: From Researches on Ten Coastal Cities. J. Coast. Res. 2020, 115, 636–640. [Google Scholar] [CrossRef]
- Yang, T.; Zhang, Q.; Wan, X.; Li, X.; Wang, Y.; Wang, W. Comprehensive ecological risk assessment for semi-arid basin based on conceptual model of risk response and improved TOPSIS model-a case study of Wei River Basin, China. Sci. Total Environ. 2020, 719, 137502. [Google Scholar] [CrossRef] [PubMed]
- Wang, X.; An, S.; Xu, Y.; Hou, H.; Chen, F.; Yang, Y.; Zhang, S.; Liu, R. A Back Propagation Neural Network Model Optimized by Mind Evolutionary Algorithm for Estimating Cd, Cr, and Pb Concentrations in Soils Using Vis-NIR Diffuse Reflectance Spectroscopy. Appl. Sci. 2019, 10, 51. [Google Scholar] [CrossRef] [Green Version]
- Seyyedattar, M.; Ghiasi, M.M.; Zendehboudi, S.; Butt, S. Determination of bubble point pressure and oil formation volume factor: Extra trees compared with LSSVM-CSA hybrid and ANFIS models. Fuel 2020, 269, 116834. [Google Scholar] [CrossRef]
Figure 1.
The framework of MEA.
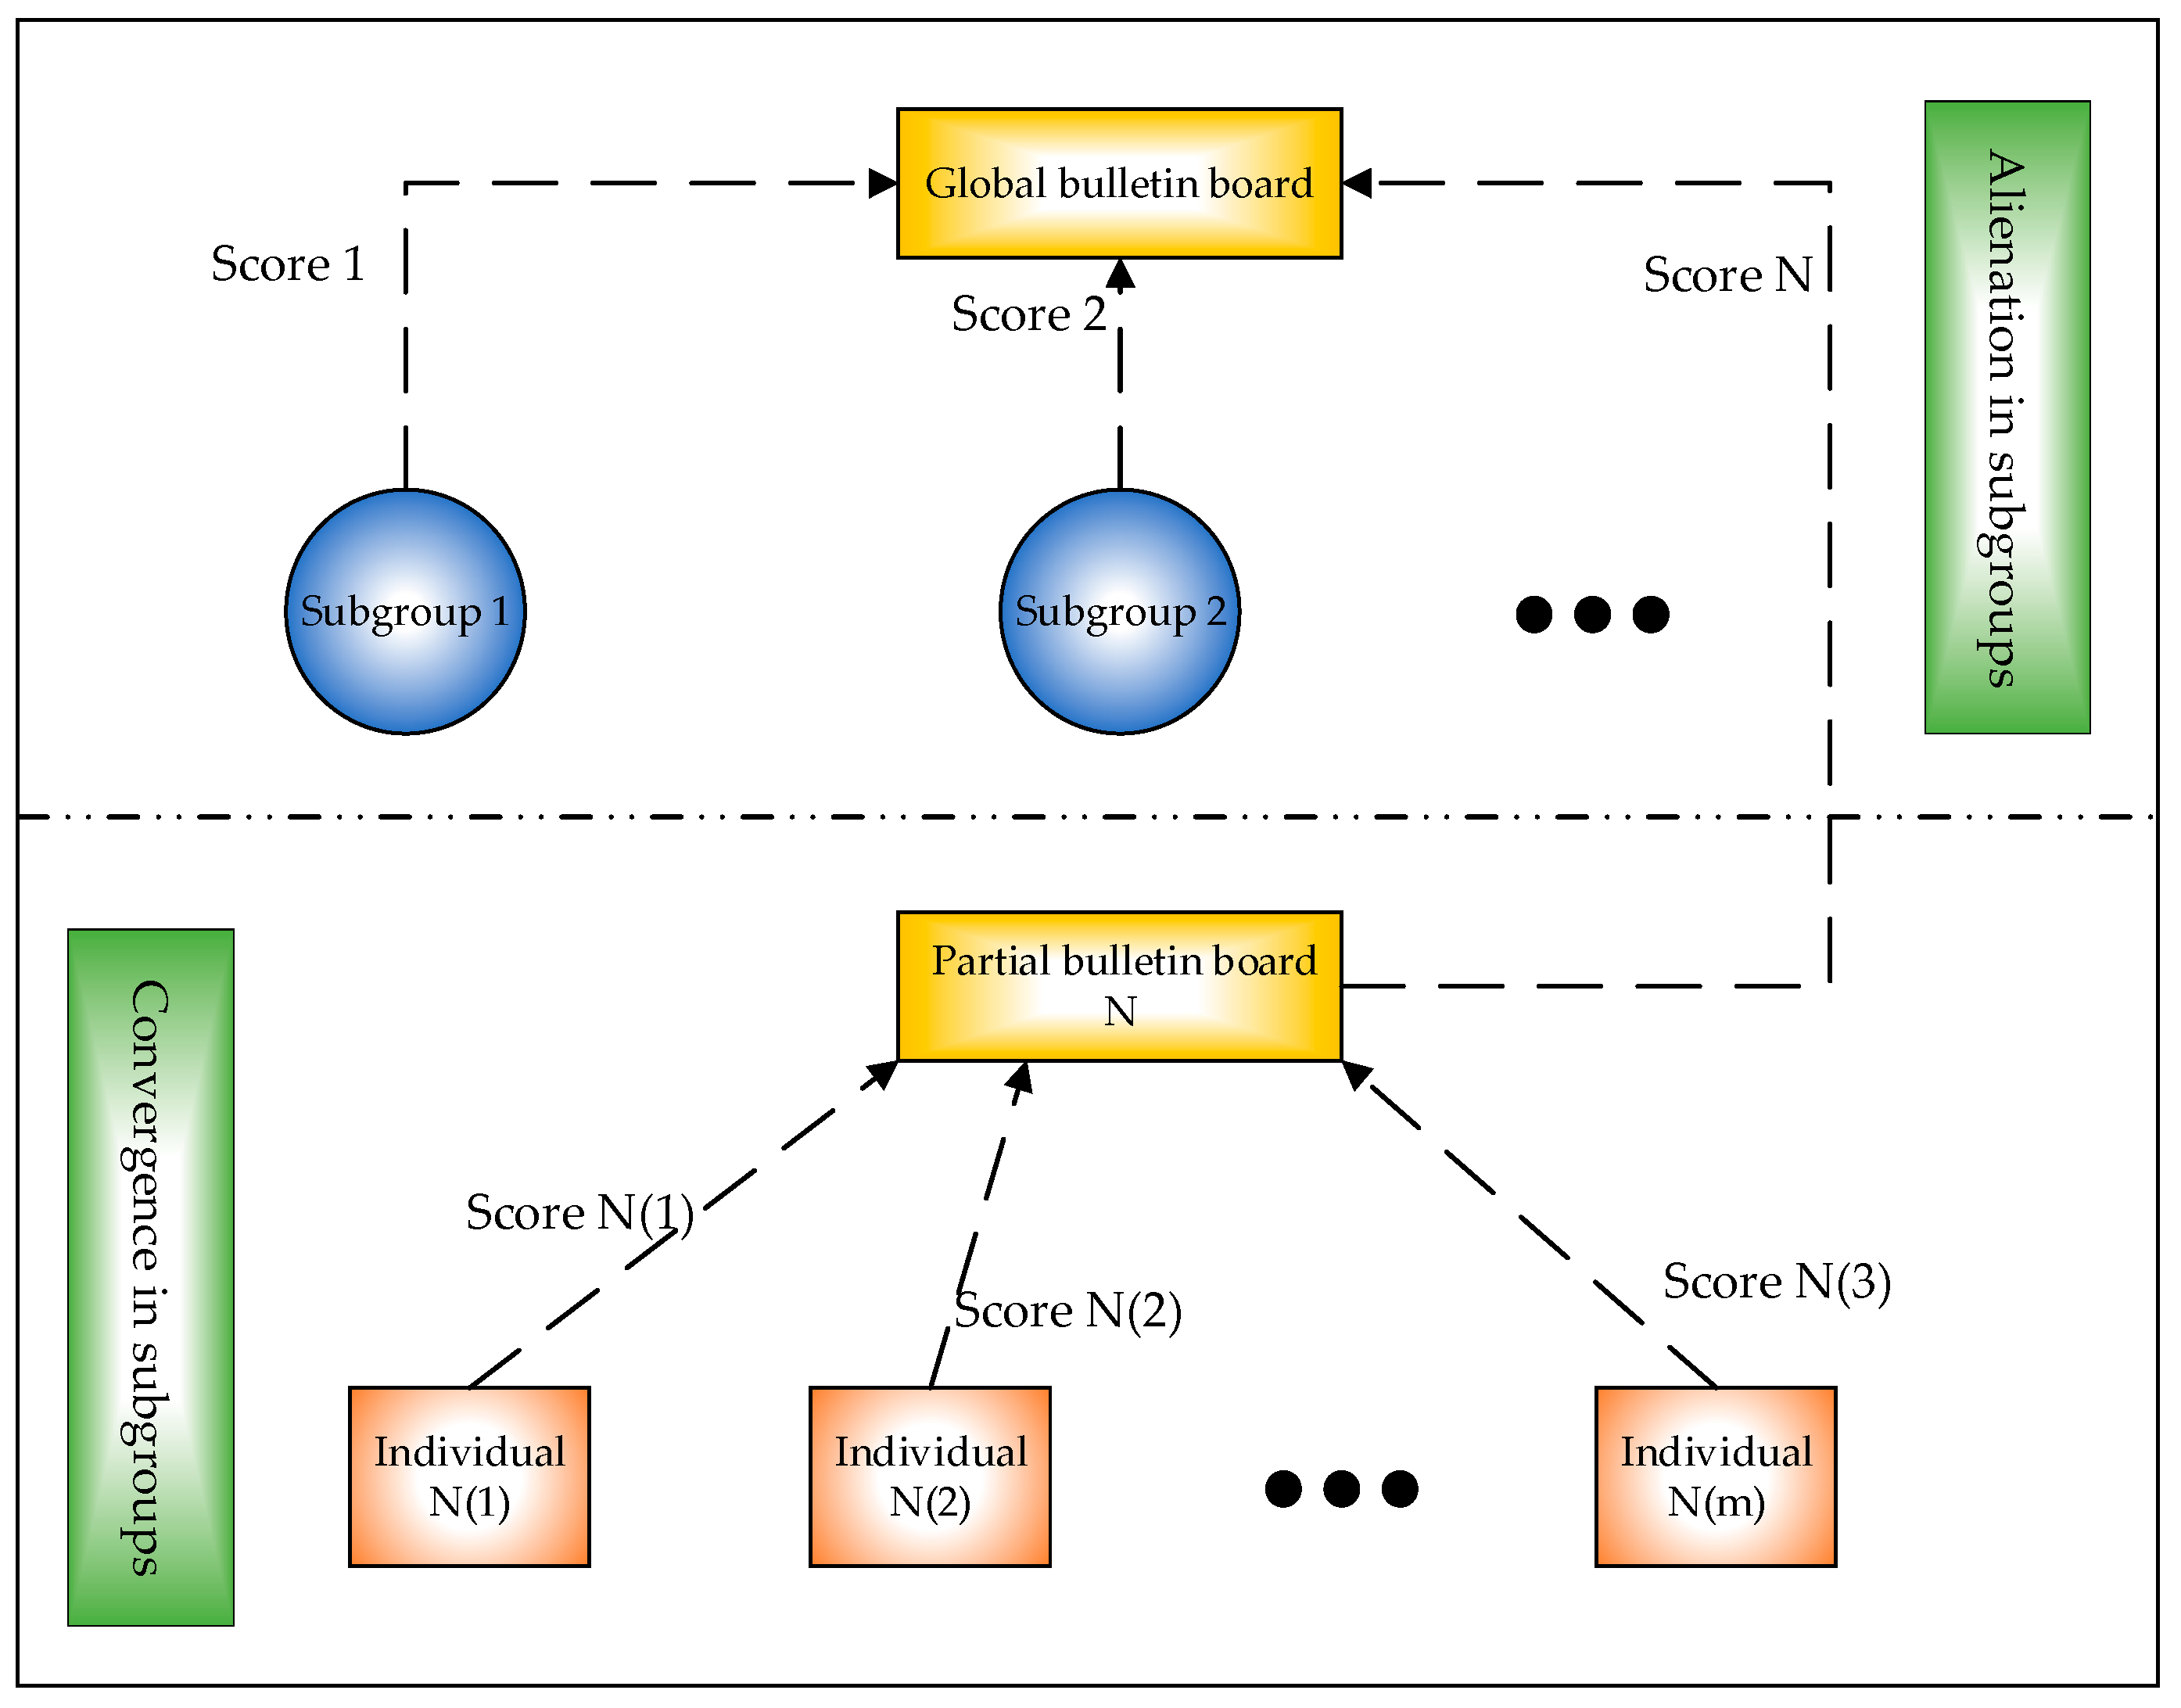
Figure 2.
The workflow of the proposed model.
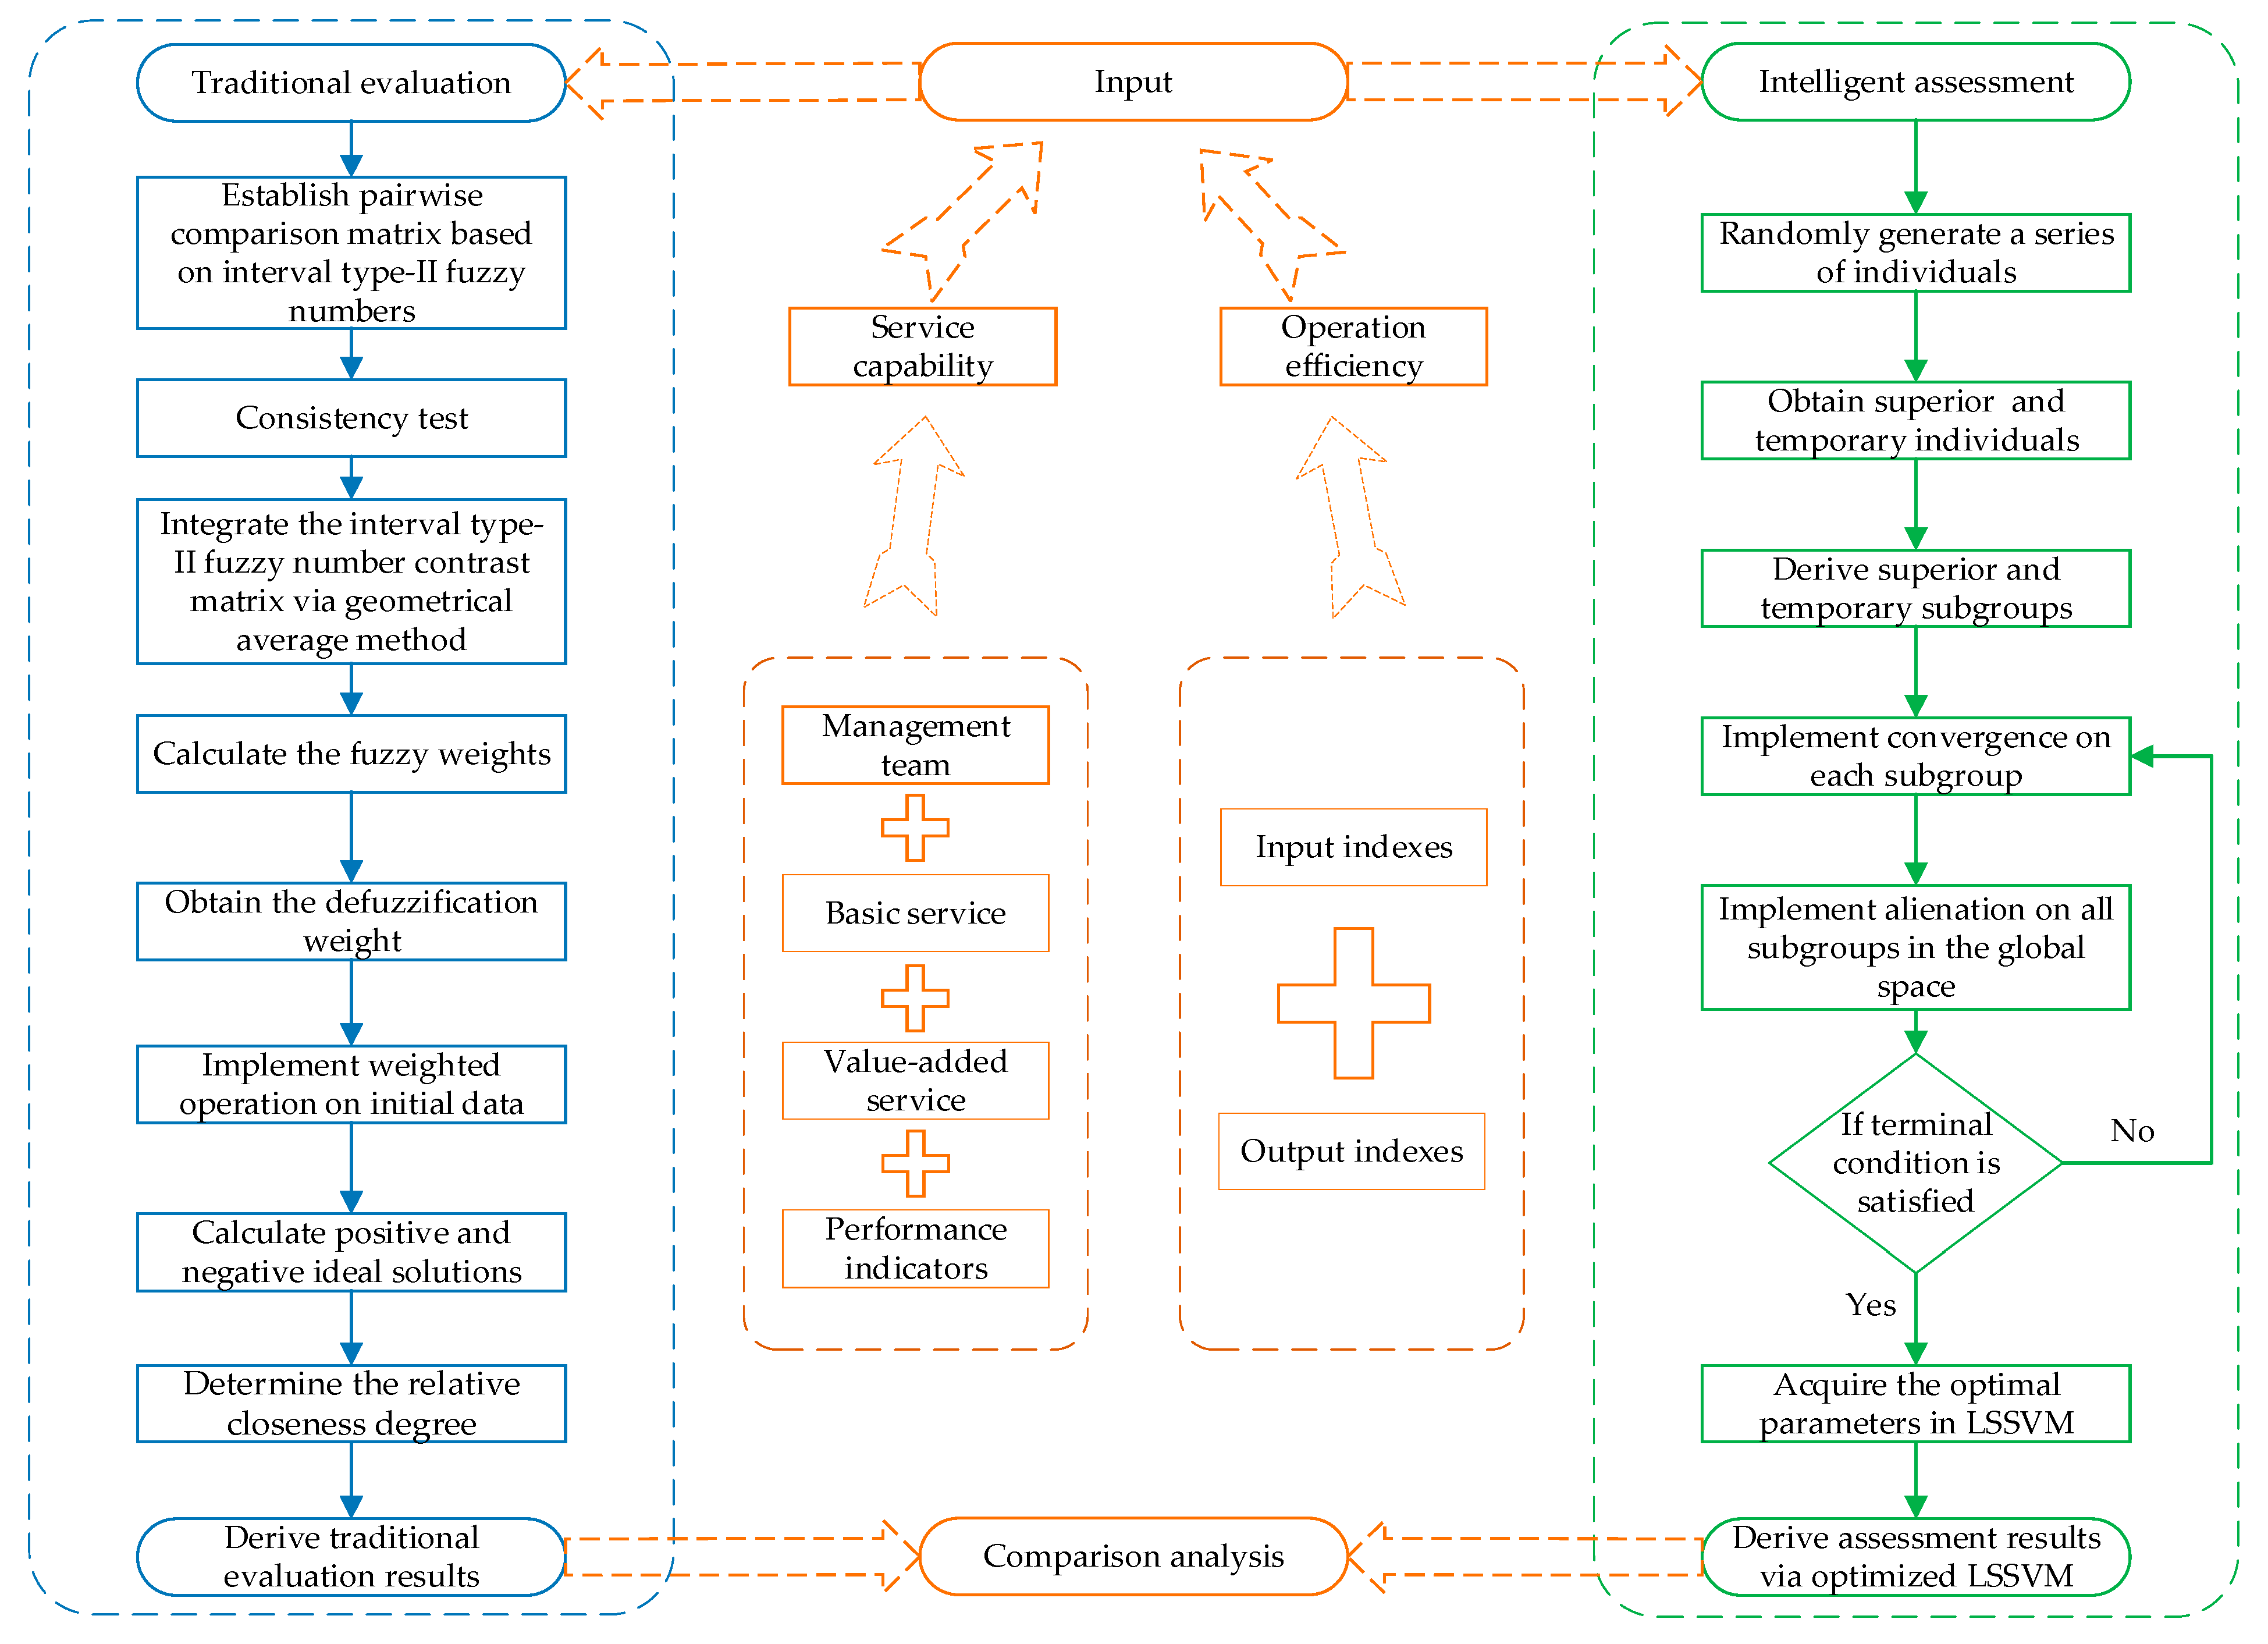
Figure 3.
Relative closeness degree of 30 renewable energy incubators. Note: (a) sequencing by sample number; (b) sequencing by relative closeness degree.
Figure 3.
Relative closeness degree of 30 renewable energy incubators. Note: (a) sequencing by sample number; (b) sequencing by relative closeness degree.
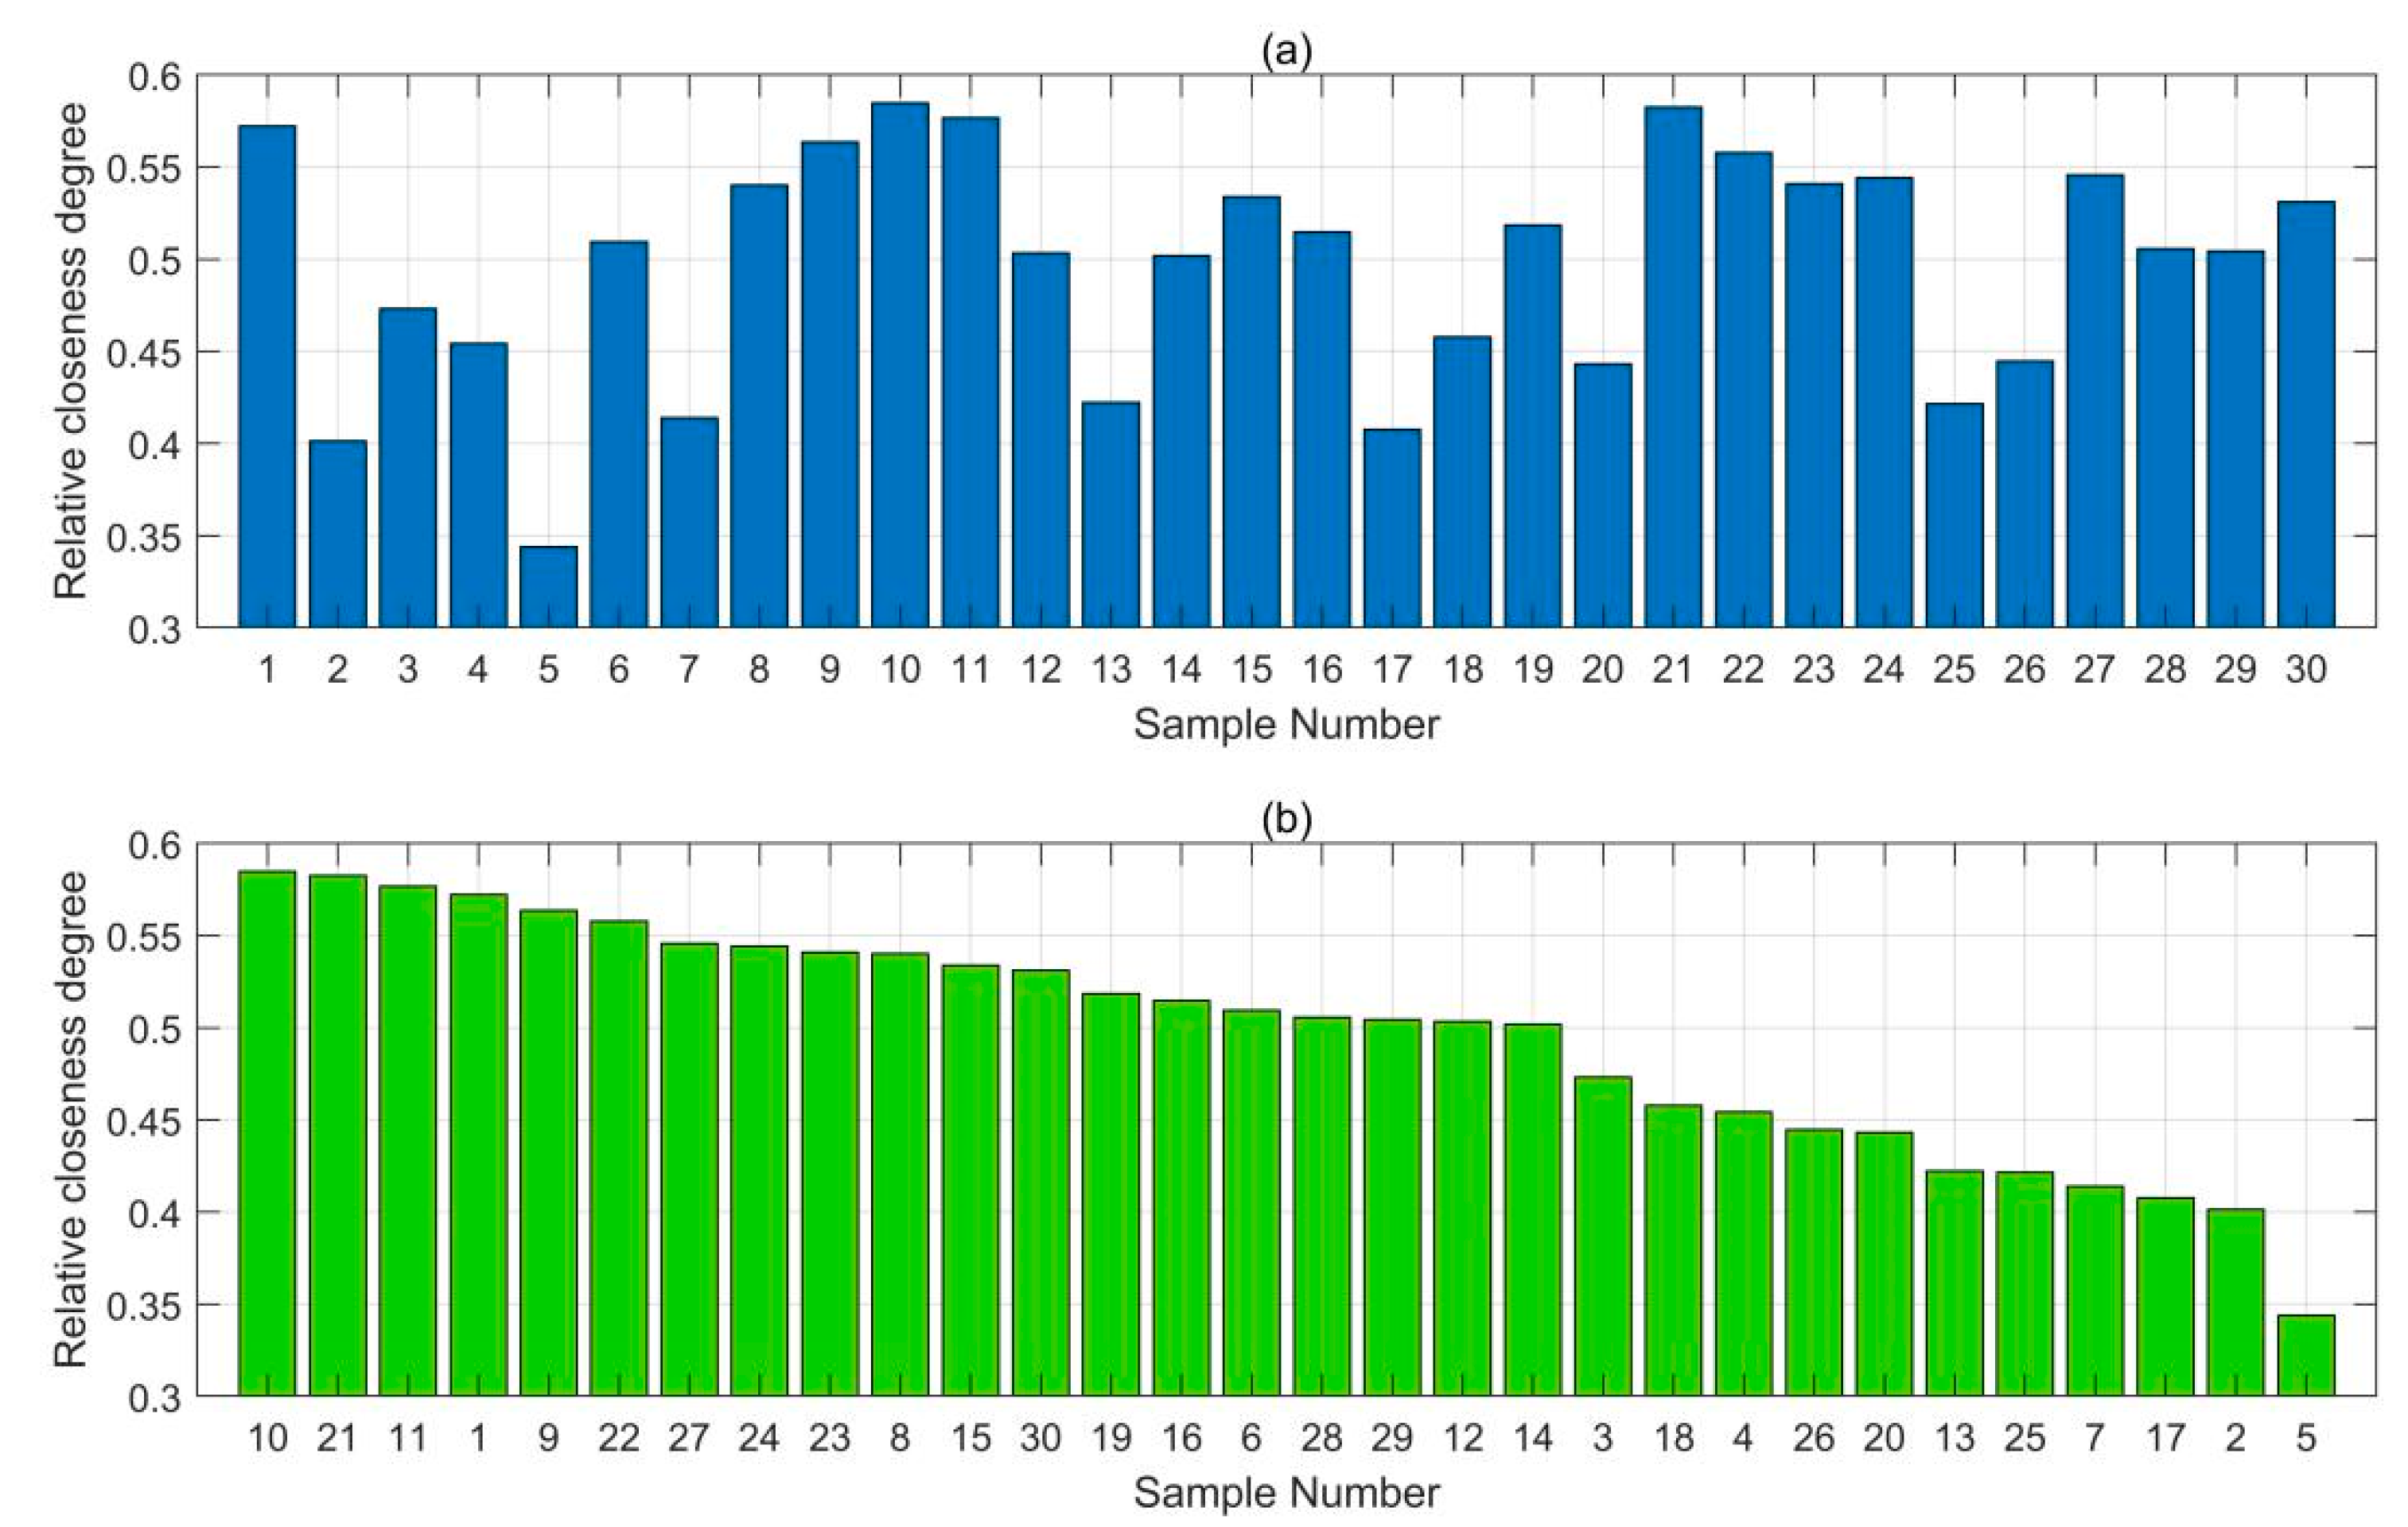
Figure 4.
Results of the test set. Note: (a) shows the results from sample No.21 to No.25; (b) shows the results from sample No.26 to No.30.
Figure 4.
Results of the test set. Note: (a) shows the results from sample No.21 to No.25; (b) shows the results from sample No.26 to No.30.
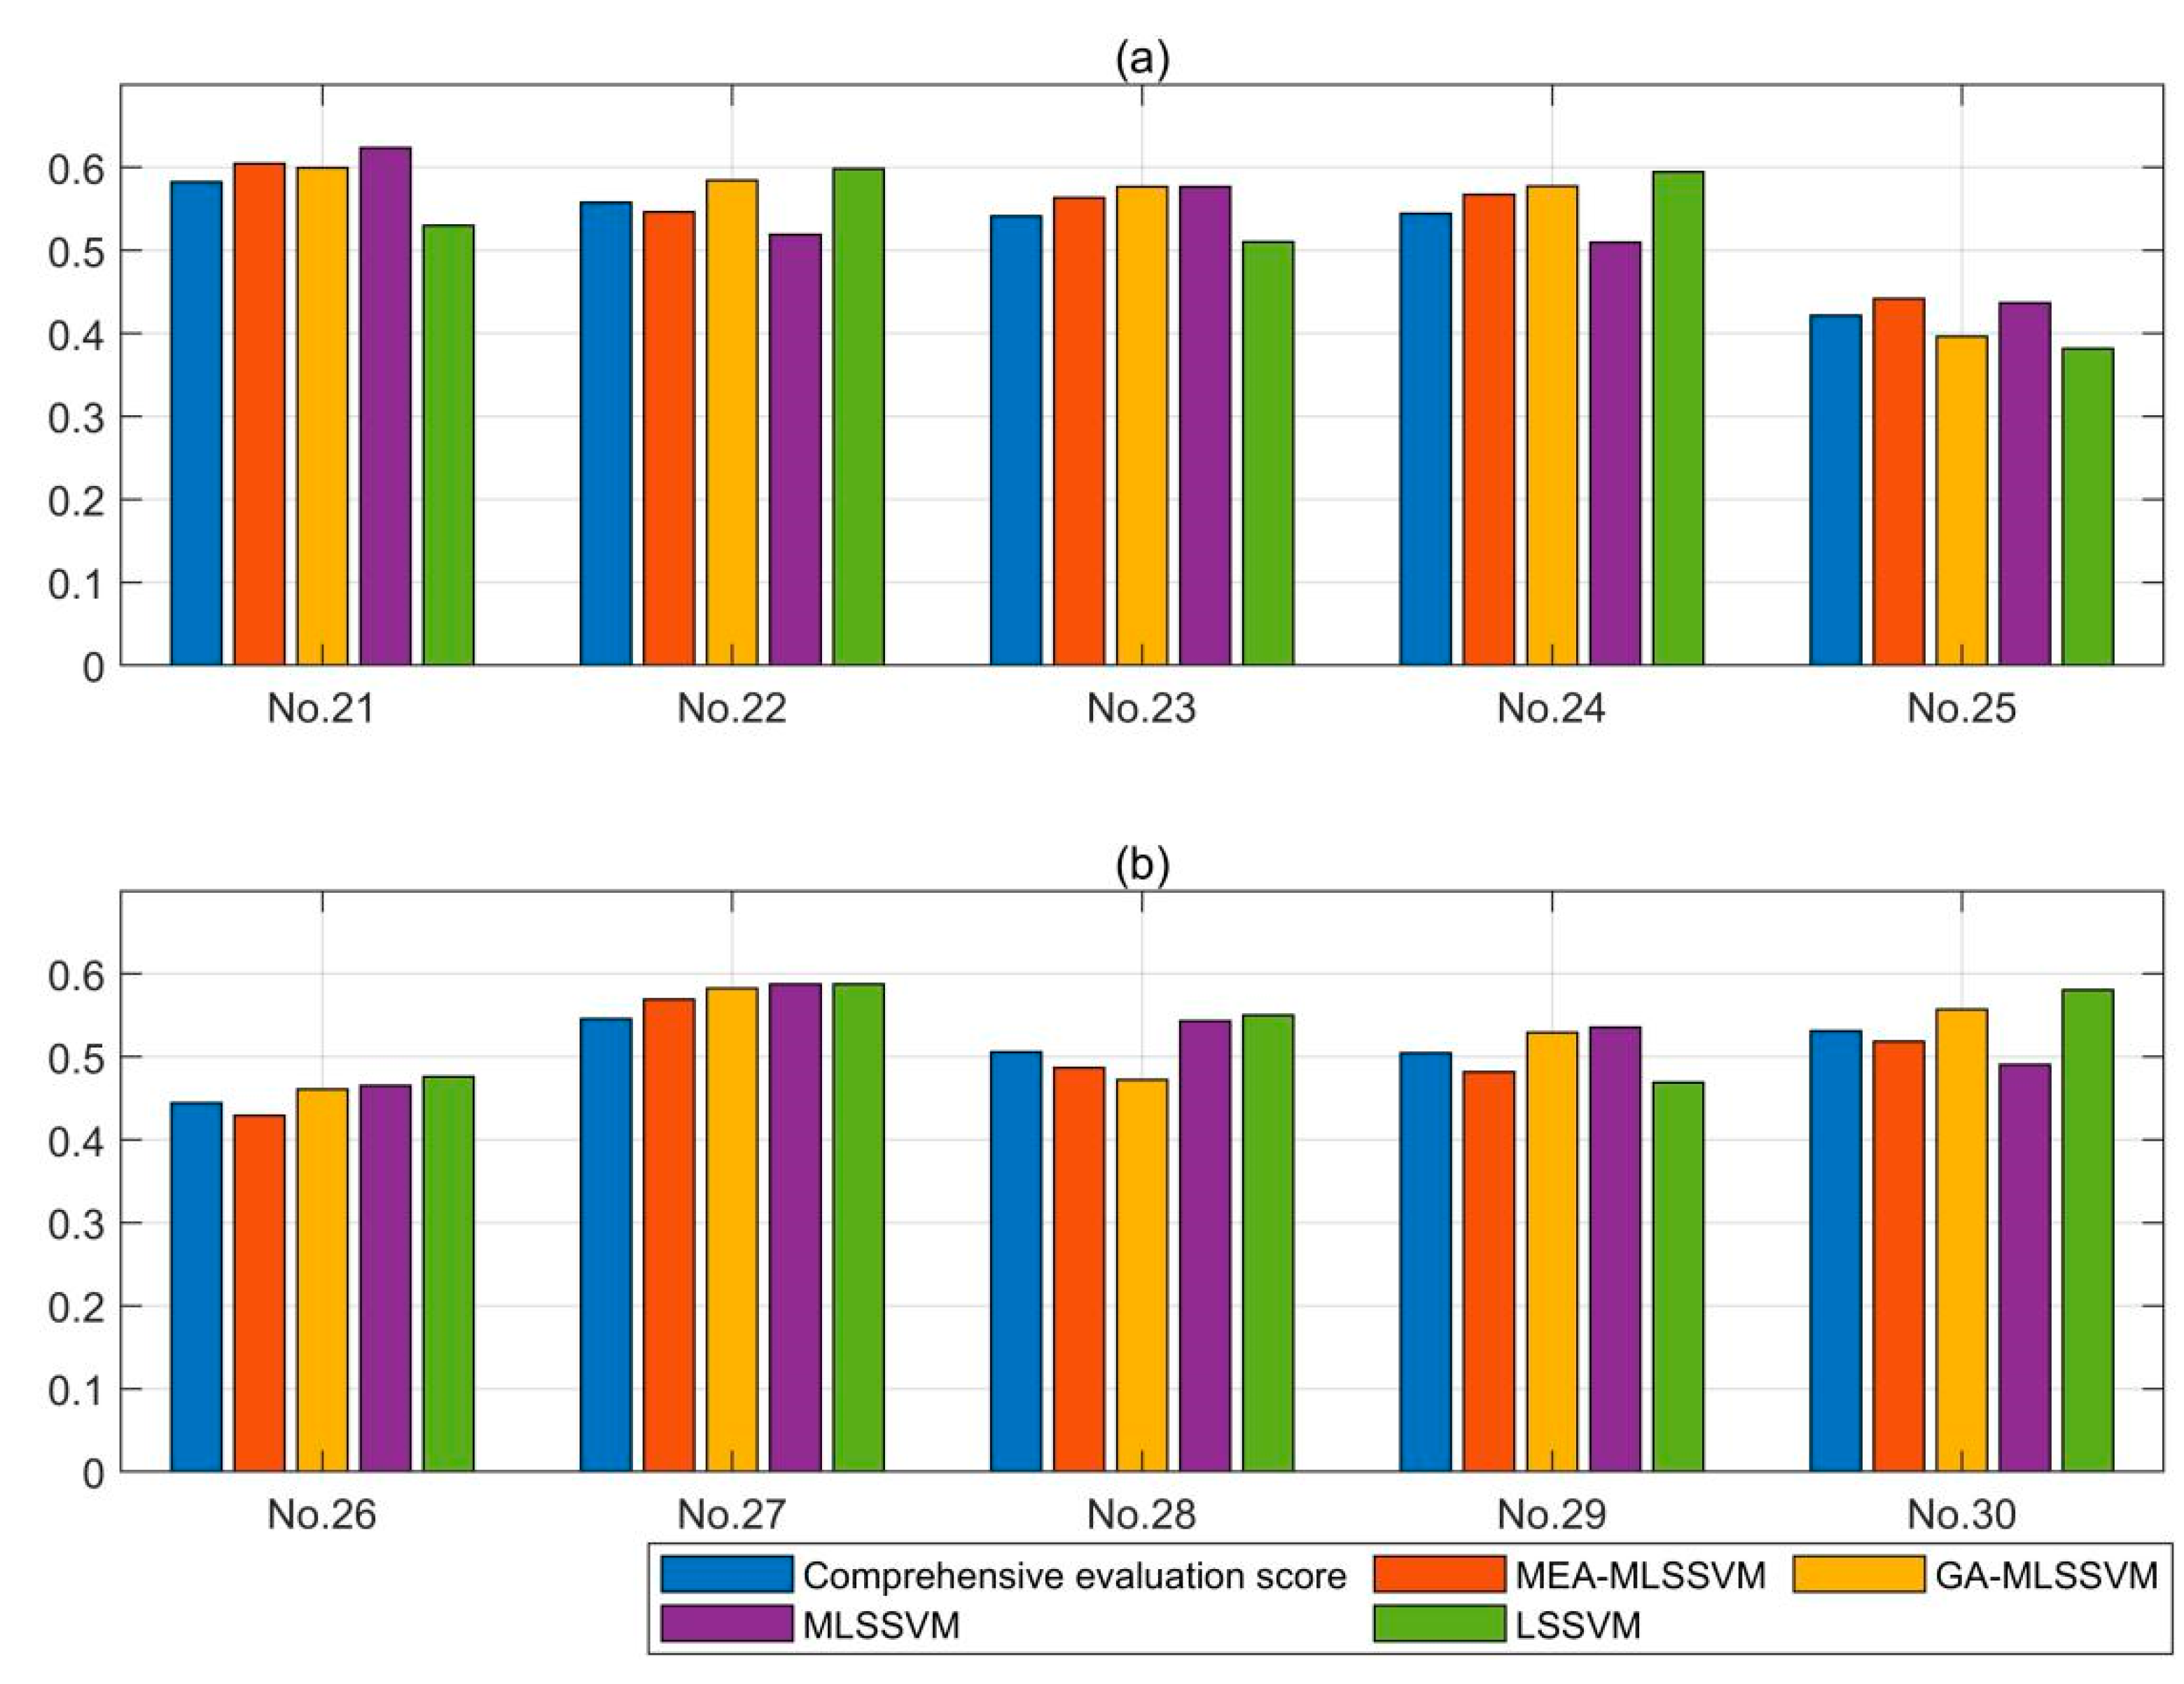
Figure 5.
Errors of the test set.

Table 1.
Evaluation indexes of service capability for renewable energy incubators.
| First-Grade | Second-Grade | Third-Grade |
|---|---|---|
| Service capability | Management team | Management system |
| Number of administrators in per incubated enterprise | ||
| The proportion of administrators with a bachelor degree or above | ||
| The proportion of administrators receiving professional training | ||
| Entrepreneurship cultivation | ||
| Basic service | Hard facilities | |
| Administrative service | ||
| Network service level | ||
| Value-added service | Number of entrepreneurial mentors of per incubated enterprise | |
| Number of experts in the accounting of per incubated enterprise | ||
| Number of experts in finance of per incubated enterprise | ||
| Number of experts in the law of per incubated enterprise | ||
| Number of experts in human resource of per incubated enterprise | ||
| Number of experts in the marketing of per incubated enterprise | ||
| Number of experts in renewable energy of per incubated enterprise | ||
| Performance indicators | Rate of enterprises graduated in the current year | |
| The average income of incubated enterprises (k yuan) | ||
| The proportion of high-tech renewable energy enterprises | ||
| The impact of incubated enterprises on local renewable energy development | ||
| Incubated enterprise satisfaction |
Table 2.
Evaluation indexes of operation efficiency for renewable energy incubators.
| First-Grade | Second-Grade | Third-Grade |
|---|---|---|
| Operation efficiency | Input indexes | Number of administrators |
| Number of guidance specialists | ||
| Investment in public technology service platform (k yuan) | ||
| The total amount of incubation fund (k yuan) | ||
| Site area (m2) | ||
| Total income of the incubator (k yuan) | ||
| Output indexes | Number of enterprises that acquire financing | |
| Number of enterprises that successfully graduate | ||
| Number of employees in the incubator and incubating enterprises |
Table 3.
Linguistic variables for criteria weights.
| Linguistic Variables | Interval Type-II Fuzzy Numbers | Reciprocal of Interval Type-II Fuzzy Numbers |
|---|---|---|
| AS | ((7,8,9,9;1,1), (7.2,8.2,8.8,9;0.8,0.8)) | ((0.11,0.11,0.12,0.14;1,1), (0.11,0.11,0.12,0.14;0.8,0.8)) |
| VS | ((5,6,8,9;1,1), (5.2,6.2,7.8,8.8;0.8,0.8)) | ((0.11,0.12,0.17,0.2;1,1), (0.11,0.13,0.16,0.19;0.8,0.8)) |
| FS | ((3,4,6,7;1,1), (3.2,4.2,5.8,6.8;0.8,0.8)) | ((0.14,0.17,0.25,0.33;1,1), (0.15,0.17,0.24,0.31;0.8,0.8)) |
| SS | ((1,2,4,5;1,1), (1.2,2.2,3.8,4.8;0.8,0.8)) | ((0.2,0.25,0.5,1;1,1), (0.21,0.26,0.45,0.83;0.8,0.8)) |
| E | ((1,1,1,1;1,1),(1,1,1,1;1,1)) | ((1,1,1,1;1,1),(1,1,1,1;1,1)) |
Table 4.
Linguistic values of indexes in the first-grade.
| Indexes | Service Capability | Operation Efficiency | ||||||
|---|---|---|---|---|---|---|---|---|
| Expert 1 | Expert 2 | ⋯ | Expert 40 | Expert 1 | Expert 2 | ⋯ | Expert 40 | |
| AS | E | E | ⋯ | E | 1/FS | 1/VS | ⋯ | VS |
| VS | FS | VS | ⋯ | 1/VS | E | E | ⋯ | E |
Table 5.
Index weight of the first-grade.
| Indexes | Fuzzy Weight | Deblurred Weight | Standardized Weight |
|---|---|---|---|
| Service capability | (0.12,0.16,0.36,0.56;1,1),(0.15,0.18,0.36,0.58;0.8,0.8) | 0.2953 | 0.5592 |
| Operation efficiency | (0.16,0.19,0.31,0.36;1,1),(0.12,0.16,0.28,0.37;0.8,0.8) | 0.2328 | 0.4408 |
Table 6.
Indicator weight.
| First- Grade | Weight | Second-Grade | Weight | Third-Grade | Weight |
|---|---|---|---|---|---|
| Service capability | 0.5592 | Management team | 0.1566 | Management system | 0.0268 |
| Number of administrators in per incubated enterprise | 0.0226 | ||||
| The proportion of administrators with a bachelor degree or above | 0.0201 | ||||
| The proportion of administrators receiving professional training | 0.0210 | ||||
| Entrepreneurship cultivation | 0.0168 | ||||
| Basic service | 0.1826 | Hard facilities | 0.0276 | ||
| Administrative service | 0.0267 | ||||
| Network service level | 0.0356 | ||||
| Value-added service | 0.2026 | Number of entrepreneurial mentors of per incubated enterprise | 0.0396 | ||
| Number of experts in the accounting of per incubated enterprise | 0.0358 | ||||
| Number of experts in finance of per incubated enterprise | 0.0258 | ||||
| Number of experts in the law of per incubated enterprise | 0.0228 | ||||
| Number of experts in human resource of per incubated enterprise | 0.0256 | ||||
| Number of experts in the marketing of per incubated enterprise | 0.0159 | ||||
| Number of experts in renewable energy of per incubated enterprise | 0.0568 | ||||
| Performance indicators | 0.1588 | Rate of enterprises graduated in the current year | 0.0368 | ||
| The average income of incubated enterprises (k yuan) | 0.0585 | ||||
| The proportion of high-tech renewable energy enterprises | 0.0599 | ||||
| The impact of incubated enterprises on local renewable energy development | 0.0258 | ||||
| Incubated enterprise satisfaction | 0.0296 | ||||
| Operation efficiency | 0.4408 | Input indexes | 0.1868 | Number of administrators | 0.0256 |
| Number of guidance specialists | 0.0258 | ||||
| Investment in public technology service platform (k yuan) | 0.0562 | ||||
| The total amount of incubation fund (k yuan) | 0.0696 | ||||
| Site area (m2) | 0.0358 | ||||
| Total income of the incubator (k yuan) | 0.0560 | ||||
| Output indexes | 0.1126 | Number of enterprises that acquire financing | 0.0367 | ||
| Number of enterprises that successfully graduate | 0.0386 | ||||
| Number of employees in the incubator and incubating enterprises | 0.0256 |
Table 7.
Standardized evaluation indicators.
| No. | Renewable Energy Incubators | |||||||||
|---|---|---|---|---|---|---|---|---|---|---|
| Sample 1 | Sample 2 | Sample 3 | Sample 4 | Sample 5 | Sample 6 | Sample 7 | Sample 8 | Sample 9 | Sample 10 | |
| 1 | 0.1463 | 0.1271 | 0.2255 | 0.1631 | 0.2350 | 0.2350 | 0.1727 | 0.1199 | 0.1607 | 0.1703 |
| 2 | 0.1696 | 0.1283 | 0.1650 | 0.1215 | 0.2223 | 0.2292 | 0.2154 | 0.1260 | 0.2223 | 0.1192 |
| 3 | 0.1292 | 0.1527 | 0.2326 | 0.2232 | 0.1903 | 0.2209 | 0.1880 | 0.1950 | 0.2138 | 0.1433 |
| 4 | 0.2197 | 0.2014 | 0.2037 | 0.1579 | 0.2060 | 0.1396 | 0.1694 | 0.1556 | 0.2174 | 0.1739 |
| 5 | 0.2186 | 0.2111 | 0.2186 | 0.1391 | 0.1490 | 0.2136 | 0.1689 | 0.1291 | 0.2359 | 0.2260 |
| 6 | 0.1452 | 0.1679 | 0.1838 | 0.2246 | 0.1566 | 0.2269 | 0.2087 | 0.1702 | 0.2110 | 0.1838 |
| 7 | 0.2168 | 0.1819 | 0.1495 | 0.2392 | 0.1919 | 0.1819 | 0.1420 | 0.1744 | 0.1669 | 0.1445 |
| 8 | 0.1543 | 0.1784 | 0.1518 | 0.1976 | 0.2362 | 0.1615 | 0.1711 | 0.1663 | 0.2290 | 0.2314 |
| 9 | 0.1751 | 0.2359 | 0.1289 | 0.1970 | 0.1484 | 0.2043 | 0.1265 | 0.1338 | 0.2165 | 0.1557 |
| 10 | 0.1265 | 0.1484 | 0.2238 | 0.2360 | 0.1557 | 0.1873 | 0.2384 | 0.1216 | 0.1824 | 0.1338 |
| 11 | 0.1737 | 0.1205 | 0.1668 | 0.2293 | 0.2224 | 0.1923 | 0.1668 | 0.1969 | 0.1760 | 0.1784 |
| 12 | 0.2243 | 0.2014 | 0.2243 | 0.1350 | 0.1144 | 0.1831 | 0.1991 | 0.2197 | 0.1922 | 0.1579 |
| 13 | 0.1237 | 0.1844 | 0.1892 | 0.1941 | 0.2086 | 0.1480 | 0.1674 | 0.1650 | 0.2038 | 0.1456 |
| 14 | 0.1532 | 0.2098 | 0.1485 | 0.2145 | 0.1745 | 0.2027 | 0.1792 | 0.1957 | 0.1556 | 0.2216 |
| 15 | 0.1715 | 0.1903 | 0.1433 | 0.1903 | 0.1785 | 0.2208 | 0.1950 | 0.2325 | 0.1362 | 0.1456 |
| 16 | 0.1914 | 0.1761 | 0.2016 | 0.1404 | 0.1761 | 0.1353 | 0.1888 | 0.1939 | 0.1276 | 0.1582 |
| 17 | 0.1764 | 0.2087 | 0.1888 | 0.2062 | 0.2112 | 0.1342 | 0.2385 | 0.1988 | 0.2062 | 0.1342 |
| 18 | 0.1479 | 0.1947 | 0.1651 | 0.1701 | 0.2070 | 0.1257 | 0.2194 | 0.1479 | 0.1503 | 0.1799 |
| 19 | 0.1483 | 0.1930 | 0.1789 | 0.1506 | 0.1459 | 0.2212 | 0.1483 | 0.2330 | 0.1600 | 0.2306 |
| 20 | 0.1989 | 0.2081 | 0.2218 | 0.2103 | 0.2058 | 0.2263 | 0.2149 | 0.2126 | 0.2149 | 0.2103 |
| 21 | 0.1448 | 0.2312 | 0.1308 | 0.1611 | 0.1541 | 0.1237 | 0.1891 | 0.2055 | 0.2078 | 0.1518 |
| 22 | 0.2284 | 0.1884 | 0.1318 | 0.2284 | 0.1695 | 0.2025 | 0.2307 | 0.1813 | 0.2119 | 0.1789 |
| 23 | 0.1826 | 0.2247 | 0.2317 | 0.1662 | 0.2247 | 0.1194 | 0.2060 | 0.1755 | 0.1732 | 0.2177 |
| 24 | 0.1654 | 0.2190 | 0.1584 | 0.2307 | 0.2143 | 0.1934 | 0.2120 | 0.1375 | 0.1258 | 0.1165 |
| 25 | 0.1493 | 0.1609 | 0.1726 | 0.1493 | 0.2099 | 0.2029 | 0.1190 | 0.1656 | 0.1773 | 0.1236 |
| 26 | 0.1917 | 0.1770 | 0.2458 | 0.1426 | 0.2458 | 0.1770 | 0.1770 | 0.1672 | 0.1426 | 0.1794 |
| 27 | 0.1272 | 0.2237 | 0.1342 | 0.1625 | 0.2143 | 0.2355 | 0.1837 | 0.1790 | 0.1601 | 0.2143 |
| 28 | 0.1491 | 0.1261 | 0.2087 | 0.1468 | 0.1904 | 0.1697 | 0.1307 | 0.1904 | 0.1697 | 0.1674 |
| 29 | 0.2057 | 0.2246 | 0.1844 | 0.2222 | 0.2081 | 0.2364 | 0.1489 | 0.1939 | 0.1560 | 0.2151 |
Table 8.
Calculation results of the weighted normalized matrix.
| No. | Renewable Energy Incubators | |||||||||
|---|---|---|---|---|---|---|---|---|---|---|
| Sample 1 | Sample 2 | Sample 3 | Sample 4 | Sample 5 | Sample 6 | Sample 7 | Sample 8 | Sample 9 | Sample 10 | |
| 1 | 0.0039 | 0.0034 | 0.0060 | 0.0044 | 0.0063 | 0.0063 | 0.0046 | 0.0032 | 0.0043 | 0.0046 |
| 2 | 0.0038 | 0.0029 | 0.0037 | 0.0027 | 0.0050 | 0.0052 | 0.0049 | 0.0028 | 0.0050 | 0.0027 |
| 3 | 0.0026 | 0.0031 | 0.0047 | 0.0045 | 0.0038 | 0.0044 | 0.0038 | 0.0039 | 0.0043 | 0.0029 |
| 4 | 0.0046 | 0.0042 | 0.0043 | 0.0033 | 0.0043 | 0.0029 | 0.0036 | 0.0033 | 0.0046 | 0.0037 |
| 5 | 0.0037 | 0.0035 | 0.0037 | 0.0023 | 0.0025 | 0.0036 | 0.0028 | 0.0022 | 0.0040 | 0.0038 |
| 6 | 0.0040 | 0.0046 | 0.0051 | 0.0062 | 0.0043 | 0.0063 | 0.0058 | 0.0047 | 0.0058 | 0.0051 |
| 7 | 0.0058 | 0.0049 | 0.0040 | 0.0064 | 0.0051 | 0.0049 | 0.0038 | 0.0047 | 0.0045 | 0.0039 |
| 8 | 0.0055 | 0.0063 | 0.0054 | 0.0070 | 0.0084 | 0.0057 | 0.0061 | 0.0059 | 0.0082 | 0.0082 |
| 9 | 0.0069 | 0.0093 | 0.0051 | 0.0078 | 0.0059 | 0.0081 | 0.0050 | 0.0053 | 0.0086 | 0.0062 |
| 10 | 0.0045 | 0.0053 | 0.0080 | 0.0084 | 0.0056 | 0.0067 | 0.0085 | 0.0044 | 0.0065 | 0.0048 |
| 11 | 0.0045 | 0.0031 | 0.0043 | 0.0059 | 0.0057 | 0.0050 | 0.0043 | 0.0051 | 0.0045 | 0.0046 |
| 12 | 0.0051 | 0.0046 | 0.0051 | 0.0031 | 0.0026 | 0.0042 | 0.0045 | 0.0050 | 0.0044 | 0.0036 |
| 13 | 0.0032 | 0.0047 | 0.0048 | 0.0050 | 0.0053 | 0.0038 | 0.0043 | 0.0042 | 0.0052 | 0.0037 |
| 14 | 0.0024 | 0.0033 | 0.0024 | 0.0034 | 0.0028 | 0.0032 | 0.0028 | 0.0031 | 0.0025 | 0.0035 |
| 15 | 0.0097 | 0.0108 | 0.0081 | 0.0108 | 0.0101 | 0.0125 | 0.0111 | 0.0132 | 0.0077 | 0.0083 |
| 16 | 0.0070 | 0.0065 | 0.0074 | 0.0052 | 0.0065 | 0.0050 | 0.0069 | 0.0071 | 0.0047 | 0.0058 |
| 17 | 0.0103 | 0.0122 | 0.0110 | 0.0121 | 0.0124 | 0.0078 | 0.0140 | 0.0116 | 0.0121 | 0.0078 |
| 18 | 0.0089 | 0.0117 | 0.0099 | 0.0102 | 0.0124 | 0.0075 | 0.0131 | 0.0089 | 0.0090 | 0.0108 |
| 19 | 0.0038 | 0.0050 | 0.0046 | 0.0039 | 0.0038 | 0.0057 | 0.0038 | 0.0060 | 0.0041 | 0.0060 |
| 20 | 0.0059 | 0.0062 | 0.0066 | 0.0062 | 0.0061 | 0.0067 | 0.0064 | 0.0063 | 0.0064 | 0.0062 |
| 21 | 0.0037 | 0.0059 | 0.0033 | 0.0041 | 0.0039 | 0.0032 | 0.0048 | 0.0053 | 0.0053 | 0.0039 |
| 22 | 0.0059 | 0.0049 | 0.0034 | 0.0059 | 0.0044 | 0.0052 | 0.0060 | 0.0047 | 0.0055 | 0.0046 |
| 23 | 0.0103 | 0.0126 | 0.0130 | 0.0093 | 0.0126 | 0.0067 | 0.0116 | 0.0099 | 0.0097 | 0.0122 |
| 24 | 0.0115 | 0.0152 | 0.0110 | 0.0161 | 0.0149 | 0.0135 | 0.0148 | 0.0096 | 0.0088 | 0.0081 |
| 25 | 0.0053 | 0.0058 | 0.0062 | 0.0053 | 0.0075 | 0.0073 | 0.0043 | 0.0059 | 0.0063 | 0.0044 |
| 26 | 0.0107 | 0.0099 | 0.0138 | 0.0080 | 0.0138 | 0.0099 | 0.0099 | 0.0094 | 0.0080 | 0.0100 |
| 27 | 0.0047 | 0.0082 | 0.0049 | 0.0060 | 0.0079 | 0.0086 | 0.0067 | 0.0066 | 0.0059 | 0.0079 |
| 28 | 0.0058 | 0.0049 | 0.0081 | 0.0057 | 0.0073 | 0.0066 | 0.0050 | 0.0073 | 0.0066 | 0.0065 |
| 29 | 0.0053 | 0.0057 | 0.0047 | 0.0057 | 0.0053 | 0.0061 | 0.0038 | 0.0050 | 0.0040 | 0.0055 |
Table 9.
Positive and negative solutions.
| No. | Positive Solutions | Negative Solutions | No. | Positive Solutions | Negative Solutions |
|---|---|---|---|---|---|
| 1 | 0.0064 | 0.0032 | 16 | 0.0093 | 0.0047 |
| 2 | 0.0052 | 0.0027 | 17 | 0.0140 | 0.0073 |
| 3 | 0.0047 | 0.0024 | 18 | 0.0140 | 0.0075 |
| 4 | 0.0048 | 0.0026 | 19 | 0.0061 | 0.0031 |
| 5 | 0.0042 | 0.0021 | 20 | 0.0067 | 0.0035 |
| 6 | 0.0063 | 0.0034 | 21 | 0.0059 | 0.0030 |
| 7 | 0.0065 | 0.0034 | 22 | 0.0060 | 0.0032 |
| 8 | 0.0084 | 0.0045 | 23 | 0.0130 | 0.0066 |
| 9 | 0.0096 | 0.0049 | 24 | 0.0162 | 0.0081 |
| 10 | 0.0085 | 0.0044 | 25 | 0.0083 | 0.0043 |
| 11 | 0.0059 | 0.0030 | 26 | 0.0138 | 0.0069 |
| 12 | 0.0052 | 0.0026 | 27 | 0.0086 | 0.0043 |
| 13 | 0.0061 | 0.0031 | 28 | 0.0086 | 0.0049 |
| 14 | 0.0036 | 0.0019 | 29 | 0.0061 | 0.0031 |
| 15 | 0.0132 | 0.0071 |
Table 10.
Euclidean distance to positive and negative solutions.
| Renewable Energy Incubators | Euclidean Distance to Positive Ideal Solution | Euclidean Distance to Negative Ideal Solution |
|---|---|---|
| Sample 1 | 0.0142 | 0.0106 |
| Sample 2 | 0.0105 | 0.0156 |
| Sample 3 | 0.0128 | 0.0142 |
| Sample 4 | 0.0121 | 0.0146 |
| Sample 5 | 0.0089 | 0.0170 |
| Sample 6 | 0.0142 | 0.0137 |
| Sample 7 | 0.0111 | 0.0157 |
| Sample 8 | 0.0142 | 0.0121 |
| Sample 9 | 0.0149 | 0.0116 |
| Sample 10 | 0.0158 | 0.0112 |
| Sample 11 | 0.0152 | 0.0112 |
| Sample 12 | 0.0128 | 0.0126 |
| Sample 13 | 0.0112 | 0.0153 |
| Sample 14 | 0.0138 | 0.0137 |
| Sample 15 | 0.0145 | 0.0127 |
| Sample 16 | 0.0132 | 0.0124 |
| Sample 17 | 0.0116 | 0.0169 |
| Sample 18 | 0.0124 | 0.0146 |
| Sample 19 | 0.0138 | 0.0129 |
| Sample 20 | 0.0125 | 0.0157 |
| Sample 21 | 0.0150 | 0.0108 |
| Sample 22 | 0.0151 | 0.0120 |
| Sample 23 | 0.0148 | 0.0125 |
| Sample 24 | 0.0144 | 0.0120 |
| Sample 25 | 0.0112 | 0.0154 |
| Sample 26 | 0.0124 | 0.0155 |
| Sample 27 | 0.0135 | 0.0112 |
| Sample 28 | 0.0131 | 0.0128 |
| Sample 29 | 0.0125 | 0.0123 |
| Sample 30 | 0.0143 | 0.0126 |
Table 11.
Relative closeness degree.
| Renewable Energy Incubators | Relative Closeness Degree | Ranking | Renewable Energy Incubators | Relative Closeness Degree | Ranking |
|---|---|---|---|---|---|
| Sample 1 | 0.5722 | 4 | Sample 16 | 0.5148 | 14 |
| Sample 2 | 0.4015 | 29 | Sample 17 | 0.4077 | 28 |
| Sample 3 | 0.4731 | 20 | Sample 18 | 0.4579 | 21 |
| Sample 4 | 0.4544 | 22 | Sample 19 | 0.5184 | 13 |
| Sample 5 | 0.3440 | 30 | Sample 20 | 0.4431 | 24 |
| Sample 6 | 0.5094 | 15 | Sample 21 | 0.5826 | 2 |
| Sample 7 | 0.4140 | 27 | Sample 22 | 0.5578 | 6 |
| Sample 8 | 0.5403 | 10 | Sample 23 | 0.5410 | 9 |
| Sample 9 | 0.5637 | 5 | Sample 24 | 0.5442 | 8 |
| Sample 10 | 0.5848 | 1 | Sample 25 | 0.4215 | 26 |
| Sample 11 | 0.5768 | 3 | Sample 26 | 0.4446 | 23 |
| Sample 12 | 0.5034 | 18 | Sample 27 | 0.5458 | 7 |
| Sample 13 | 0.4222 | 25 | Sample 28 | 0.5057 | 16 |
| Sample 14 | 0.5018 | 19 | Sample 29 | 0.5044 | 17 |
| Sample 15 | 0.5339 | 11 | Sample 30 | 0.5312 | 12 |
Table 12.
Results of the test set.
| Renewable Energy Incubators | Evaluation Scores | MEA-MLSSVM | GA-MLSSVM | MLSSVM | LSSVM |
|---|---|---|---|---|---|
| Sample 21 | 0.5826 | 0.6047 | 0.5993 | 0.6239 | 0.5296 |
| Sample 22 | 0.5578 | 0.5462 | 0.5842 | 0.5191 | 0.5986 |
| Sample 23 | 0.5410 | 0.5635 | 0.5767 | 0.5769 | 0.5103 |
| Sample 24 | 0.5442 | 0.5675 | 0.5777 | 0.5095 | 0.5946 |
| Sample 25 | 0.4215 | 0.4418 | 0.3963 | 0.4371 | 0.3816 |
| Sample 26 | 0.4446 | 0.4295 | 0.4610 | 0.4654 | 0.4763 |
| Sample 27 | 0.5458 | 0.5693 | 0.5824 | 0.5874 | 0.5873 |
| Sample 28 | 0.5057 | 0.4867 | 0.4722 | 0.5431 | 0.5501 |
| Sample 29 | 0.5044 | 0.4816 | 0.5292 | 0.5356 | 0.4689 |
| Sample 30 | 0.5312 | 0.5182 | 0.5571 | 0.4905 | 0.5808 |
Table 13.
Errors of the test set.
| Renewable Energy Incubators | MEA-MLSSVM | GA-MLSSVM | MLSSVM | LSSVM |
|---|---|---|---|---|
| Sample 21 | 3.80% | 2.86% | 7.09% | −9.09% |
| Sample 22 | −2.08% | 4.73% | −6.94% | 7.31% |
| Sample 23 | 4.15% | 6.59% | 6.63% | −5.68% |
| Sample 24 | 4.29% | 6.15% | −6.37% | 9.26% |
| Sample 25 | 4.82% | −5.97% | 3.69% | −9.46% |
| Sample 26 | −3.40% | 3.68% | 4.68% | 7.13% |
| Sample 27 | 4.31% | 6.71% | 7.63% | 7.61% |
| Sample 28 | −3.76% | −6.62% | 7.40% | 8.78% |
| Sample 29 | −4.53% | 4.91% | 6.18% | −7.03% |
| Sample 30 | −2.44% | 4.87% | −7.67% | 9.34% |
Publisher’s Note: MDPI stays neutral with regard to jurisdictional claims in published maps and institutional affiliations. |
© 2021 by the authors. Licensee MDPI, Basel, Switzerland. This article is an open access article distributed under the terms and conditions of the Creative Commons Attribution (CC BY) license (http://creativecommons.org/licenses/by/4.0/).
Share and Cite
MDPI and ACS Style
Liang, G.; Niu, D.; Liang, Y. Sustainability Evaluation of Renewable Energy Incubators Using Interval Type-II Fuzzy AHP-TOPSIS with MEA-MLSSVM. Sustainability 2021, 13, 1796. https://doi.org/10.3390/su13041796
AMA Style
Liang G, Niu D, Liang Y. Sustainability Evaluation of Renewable Energy Incubators Using Interval Type-II Fuzzy AHP-TOPSIS with MEA-MLSSVM. Sustainability. 2021; 13(4):1796. https://doi.org/10.3390/su13041796
Chicago/Turabian StyleLiang, Guangqi, Dongxiao Niu, and Yi Liang. 2021. "Sustainability Evaluation of Renewable Energy Incubators Using Interval Type-II Fuzzy AHP-TOPSIS with MEA-MLSSVM" Sustainability 13, no. 4: 1796. https://doi.org/10.3390/su13041796
Note that from the first issue of 2016, this journal uses article numbers instead of page numbers. See further details here.