Article

Effect of Cover Crop Type and Application Rate on Soil Nitrogen Mineralization and Availability in Organic Rice Production

1
Texas A&M AgriLife Research Center at Beaumont, Texas A&M University System, Beaumont, TX 77713, USA
2
School of Natural Sciences and Mathematics, University of Texas at Dallas, Richardson, TX 75080, USA
3
Department of Statistics, University of Connecticut, Storrs, CT 06269, USA
4
Department of Soil and Crop Sciences, Texas A&M University, College Station, TX 77843, USA
*
Author to whom correspondence should be addressed.
Sustainability 2021, 13(5), 2866; https://doi.org/10.3390/su13052866
Submission received: 13 February 2021 / Revised: 2 March 2021 / Accepted: 2 March 2021 / Published: 6 March 2021

Abstract

:
In drill-seeded, delay-flooded organic rice production, reliable predictions of N supply from cover crop (CC) residues to subsequent rice are still a challenge. An incubation was conducted to determine the effects of CC types (clover, ryegrass, clover and ryegrass mixtures, and fallow), residue application rates (0, 0.6, 1.2, 1.8, and 2.4%) and incubation time on soil CO2 evolution and N mineralization and availability. The cumulative CO2 evolution linearly increased with increasing residue rate. Compared to the control, adding CCs residue significantly increased the cumulative CO2 emission, which was greatest in soils with clover or mixtures of clover and ryegrass, followed by fallow, and lowest in soils with ryegrass. The modeling results indicated clover had the greatest initial C and N mineralization rates and the shortest half-lives. A temporary decrease in soil mineral N caused by immobilization occurred at the initial incubation stage in all treatments. However, the trend reversed progressively, with the clover treatment requiring the shortest time to meet the crossover point. The results suggested clover was the optimal CC type, 0.6% was the optimal residue rate, and a minimum of 27 days between CC termination and rice planting was required to maximize mineral N supply for organic rice.

1. Introduction

The organic industry in the U.S. has expanded rapidly to keep pace with market demand, and the planting acreage of organic rice in the U.S. has increased from 20,757 to more than 79,000 acres since 1995 [1,2]. Improving nutrient management, especially nitrogen (N) management, is a crucial battlefront for improving organic production and has drawn rapidly increasing attention from researchers, decision-makers, and producers [3]. Cover crops, especially leguminous cover crops, have been proposed as an effective N source to increase soil fertility and crop productivity [4,5,6], minimize N losses through nitrate leaching [7,8,9], suppress weeds through releasing of allelopathic exudates or competing for light, water, and nutrients [10,11], and support other ecosystem services [12,13].
When cover crops are incorporated into soils, nitrogen in the tissues can be mineralized to provide mineral N to the following cash crops [14,15]. Despite being an ideal N strategy for organic farming, that currently relies heavily on natural soil amendments (e.g., manure) instead of cover crops, one big challenge in adopting the cover crop approach is accurately predicting when the nitrogen in cover crops will become available to the subsequent cash crops. Several studies reported that the incorporation of winter cover crops increased rice yield 5–10% [16,17,18]. However, some studies reported no statistically significant difference in rice grain yield between cover crop and non-cover crop treatments [19,20]. The varying results indicated the complexity of the cover crop decomposition and N release processes owing to multiple impact factors, including the types of cover crops [6,19], the C:N ratio and lignin content of the cover crops [13,21,22,23,24], the application rate of cover crops [25], the timing of cover crop incorporation [14,26], and soil and environmental conditions [27,28]. The varying results also underline the importance of selecting appropriate cover crop type, application rate, and termination time to maximize soil N availability for rice growth and present challenges to researchers.
To tackle the challenges, several studies focused on a modeling approach to capture changes in N availability from microbial decomposition after cover crop termination [25,29,30,31]. Based on the first-order kinetic models, clover needs 9–27 days and ryegrass needs 58 days to degrade 50% or more of the N mineralization potential (N0) from cover crop residues [29,30,32]. Although considerable effort has been put into understanding the N dynamics after cover crop incorporation, N dynamics in organically managed soils, especially in drill-seeded, delay-flooded organic rice production, remain relatively unexplored, which prevents greater insight into the precise estimation of N mineralization and availability in organic rice. In organic rice field trials, winter cover crops are typically terminated from late March to early April and organic rice drill-seeded from late April to early May depending on the weather [33,34]. The focus of this study was to use an incubation trial to assess the dynamics of N mineralization after cover crop incorporation but before organic rice planting to predict soil available mineral N contents at planting and to improve soil N management in organic agriculture.
In microbial decomposition, the activities of microorganisms that decompose organic compounds into mineral forms are manageable through the adjustment of the C:N ratio [35], oxygen supply [36], moisture content [37], and temperature [37,38]. Laboratory incubations under controlled conditions hold constant environmental factors and have proved valuable in understanding C and N mineralization kinetics with inputs of diverse residue quality and quantity [39]. In this study, a 31-day aerobic incubation experiment was conducted using 1-L jars under controlled oxygen, moisture, and temperature conditions to determine the effects of cover crop type, residue application rate, and incubation time on soil N mineralization and mineral N availability. The observed data in the incubation experiment were also used to build C and N mineralization simulation models to estimate the C and N mineralization potentials (C0 and N0) and half-lives (t1/2).
Specifically, the objectives were to (1) determine the effects of cover crop mixtures [control, white clover, annual ryegrass, 70% clover + 30% ryegrass (C7R3), 30% clover + 70% ryegrass (C3R7), and fallow (volunteer weeds)], residue application rates (0, 0.6, 1.2, 1.8, and 2.4%), and incubation time on organically managed soil CO2 evolution, C and N mineralization potentials and half-lives, microbial biomass C and N, organic C and N contents, and mineral N availability, and (2) estimate the optimal cover crop type, residue replication rate, and termination time to maximize N availability at planting for organic rice growth.

2. Materials and Methods

2.1. Soil and Cover Crops Collection and Properties

Cover crops used in this incubation experiment were collected from a certified organic rice field in 2014. The organic rice yields were 7443, 7292, and 7312 kg ha−1 for the fields with clover (Trifolium repens), annual ryegrass (Lolium multiflorum), and fallow (volunteer weeds), respectively in 2012–2014 [33,34]. A total of 150 kg of surface soil (0–15 cm) was collected from a multiple-year fallow area of the certified organic field using a backhoe. Five cores of soil samples were mixed thoroughly, air-dried, ground, passed a 2-mm sieve, and stored in several large plastic cans for use in this study and other experiments in the organic project. The soil was a Morey loam (fine-silty, siliceous, superactive, hyperthermic Oxyaquic Argiudolls) with sand 47%, silt 36%, and clay 17%, and other properties were shown in Table 1. Soil pH and EC were determined in a 1:2 (w/v) soil: deionized water extractant using a VWR Symphony B20PI Benchtop pH meter (VWR International, LLC., Radnor, PA, USA) and Mettler Toledo EC meter (Mettler-Toledo, LLC, Columbus, OH, USA) [40,41]. Soil total C and total N contents were determined using a total carbon analyzer by reducing the primary sample ignition furnace to 650 °C following a combustion procedure described by McGeehan and Naylor [42]. Soil P, K, Ca, Mg, Na, Zn, Fe, Cu, and S were extracted using the Mehlich III extractant and determined by inductively coupled plasma spectrophotometry (ICP) according to Mehlich [43,44].
During our 2012–2014 organic rice field trials, the cover crops were planted from mid-October to early November, and terminated from late March to early April the following spring by cutting and tilling into soils with a John Deere disc (John Deere Pavilion, Moline, IL, USA) and a Lelyterra rotary harrow (Lely North America Inc., Pella, IW, USA). After incorporating for 2 to 4 weeks, organic rice was drill-seeded from late April to early May, depending on the weather conditions. The average dry biomass of Durana white clover (Trifolium repens), annual ryegrass (Lolium multiflorum), and fallow (volunteer weeds) were 4642, 5613, and 4020 kg ha−1, respectively, in our 2012–2014 organic rice field trials (Table 2). Cover crops properties are shown in Table 3 and Table S1. Briefly, the crude protein, total C, and total N were highest in clover, followed by C7R3 (70% clover + 30% ryegrass) and fallow, and lowest in ryegrass. The C:N ratio was <21 in clover, C7R3, and fallow but >21 in C3R7 (30% clover + 70% ryegrass) and ryegrass. The lignin:N ratio was highest in fallow, followed by ryegrass, and lowest in clover. The estimated index of net mineralization was <1 in all treatments. Cover crop crude protein and total nitrogen were determined by the high-temperature combustion process [42,45]. Lignin was determined using the Klason method [46]. Plant minerals, including P, K, Ca, Mg, Na, S, Zn, Fe, Cu, Mn, and B were extracted using a nitric acid digest method and determined by ICP [47,48].

2.2. Laboratory Incubation and Determinations

A 31-day aerobic incubation experiment was conducted in 2019 using 1-L, wide-mouth jars arranged in a completely randomized design (CRD) with three replications. Three experimental factors included six cover crop mixtures [control, white clover, annual ryegrass, 70% clover + 30% ryegrass (C7R3), 30% clover + 70% ryegrass (C3R7), and fallow (volunteer weeds)], five residue application rates (0, 0.6, 1.2, 1.8, and 2.4%), and seven incubation times (D0, D1, D3, D7, D17, D24, and D31). Cover crops were freeze-dried, ground, and passed 0.5-mm sieve for use. Dry ground cover crop residues were added into 10.000 g dry soil according to the application rates (w/w). We had 66 jars (no cover crop control × 6 replications + 5 cover crop mixtures × 4 residue application rates × 3 replications). Each jar contained one 50-mL centrifuge tube with 20 mL of 2 mol L−1 NaOH for CO2 evaluation determination, one 50-mL glass beaker with soil and cover crop residue mixture for microbial biomass C and N determinations, four 50-mL centrifuge tubes with soil and cover crop residue mixture for organic C and N as well as mineral N (ammonium, nitrite, nitrate) determinations, and one 25-mL plastic vial with water to maintain humidity. In parallel, we had another 66 jars each containing a 50-mL glass beaker with soil and cover crop residue mixture as the unfumigated control for microbial biomass C and N determinations and a water vial to maintain humidity. Soils in all glass beakers and centrifuge tubes were adjusted to 50% of water holding capacity before incubation. The whole incubation lasted 31 days at 25 °C using a Thermo Scientific incubator. During the incubation, water vials were checked routinely and refilled when necessary. Jars were opened at each sampling for 30 min to allow O2 exchange.
The CO2 evaluation during Day 0–1, 1–3, 3–7, 7–17, and 17–24 of incubation were measured at D1, D3, D7, D17, D24, respectively. At each sampling, the 50-mL centrifuge tube containing 20 mL of 2 mol L−1 NaOH was replaced from each jar and covered with a lid immediately for titration. As a replacement, a new 50-mL centrifuge tube with 20 mL 2 mol L−1 NaOH was put back into the jar after 30-min O2 exchange for a continuous incubation until the next sampling. At each sampling, 4 centrifuge tubes with 20 mL 2 mol L−1 NaOH were put in four jars without any samples as blank control, and another 4 centrifuge tubes with 20 mL 2 mol L−1 NaOH were covered with lids as initial NaOH control and kept outside the incubator. A total of 74 centrifuge tubes with NaOH solution were taken out at each sampling for titration. The initial NaOH concentration and the NaOH left in each centrifuge tube were titrated with 2 mol L−1 HCl with vigorous stirring in the presence of BaCl2 to a phenolphthalein endpoint. The CO2 evolution was calculated by subtracting the CO2 concentration in the blank control from the CO2 concentration in the jar with soil samples [25].
Soil mineral N contents ( NH 4 + + NO 3 +   NO 2 ) at D0 (background soil), D7, D17, D24 and D31 during incubation were determined. At each sampling, one centrifuge tube with soil and cover crop mixture was taken out from each jar, extracted with 40 mL 0.5 mol L−1 K2SO4, filtered with Whatman No. 2 filter paper, and determined for NH 4 + , NO 2 , NO 3 , pH, and EC. Soil NH 4 + was measured using a BioTek microplate reader at OD660nm [49,50,51]. Soil NO 2 was measured with a BioTek microplate reader at OD550nm, and NO 3 were first reduced to NO 2 using a Cd redactor and then measuring the concentration of NO 2 [51,52]. The relative nitrification index (RNI) at D0, D7, D17, D24, and D31 was estimated by calculating the proportion of the NO 3 to the sum of NO 3 and NH 4 + [RNI (%) = NO 3 /( NO 3 + NH 4 + ) × 100%] according to Lavoie and Bradley [53] and Tian and Toda [54]. Soil pH was determined using a VWR Symphony B20PI Benchtop pH meter (VWR International, LLC., Radnor, PA, USA). Soil EC was determined using a Mettler Toledo EC meter (Mettler-Toledo, LLC, Columbus, OH, USA).
Dissolved organic C (DOC) and dissolved organic N (DON) in soils collected at D0 (Background soil), D7, D17, D24, and D31 were determined. The soil was extracted with 40 mL 0.5 mol L−1 K2SO4, shaken for 30 min on a shaker, centrifuged at 6000 rpm for 10 min, filtered through a GF/F 47 mm 100 circles glass microfiber filter (Whatman, Cat No. 1825-047), and determined using a TOC-VCPH/CPN analyzer (Shimadzu Corporation, Kyoto, Japan) following the manufacturer’s instruction.
To determine soil microbial biomass C (MBC) and microbial biomass N (MBN), 132 glass beakers with soil and cover crop mixture were taken out of incubation jars at D7. Soils in 66 glass beakers were fumigated with CH3Cl chloroform in the desiccator for 24 h, and soils in the other 66 glass beakers were put in another desiccator and used as unfumigated control. At D8, both fumigated soil and unfumigated soil were extracted with 40 mL 0.5 mol L−1 K2SO4, shaken for 30 min on a shaker, centrifuged at 6000 rpm for 10 min, filtered through a GF/F 47 mm 100 circles glass microfiber filter (Whatman, Cat No. 1825-047), and determined using a TOC-VCPH/CPN analyzer (Shimadzu Corporation, Kyoto, Japan) following the manufacturer’s manual. MBC and MBN were calculated using DOC and DON contents according to the equations reported by Beck et al. [55] and Brookes et al. [56].
Carbon use efficiency (CUE) was estimated using the equation: CUE   =   MBC / ( CO 2   evolution + MBC ) [57]. CUE is an assessment of the biological activity associated with the decomposition of residues and reflects the partitioning of C between microbial growth and respiration per unit of substrate organic C consumed [35,58]. The greater the CUE, the greater the proportion of C converted to biomass rather than respired. The index of net N mineralization was calculated using the equation: Index of net N mineralization = cover crop C:N ratio × CUE/microbial biomass C:N ratio [35]. Index value >1 means net N mineralization, otherwise net N immobilization [35].

2.3. Soil Carbon and Nitrogen Mineralization Kinetics

The observed soil cumulative CO2 evolution (Cmin) over 0, 1, 3, 7, 17, and 24 days of incubation were fitted to a first-order kinetic model to estimate the amount of potentially mineralizable pool of C (C0) available for decomposers following residue additions (Equation (1)) [25,32,54,59]:
C   mineralization ,   C min   =   C 0   ·   ( 1     exp ( k C   ·   t ) )
where Cmin is the detected cumulative C mineralization up to time (mg C kg−1), C0 is the C mineralization potential (mg C kg−1), k is the decomposition rate constant (day−1), and t is the decomposition time (days). The decomposition rate constant kC describes the daily release of C from the pool, which is proportional to the initial amount of cover crop residue amended and is inversely related to the residence time of the substrate and measures C turnover period [25,60].
The observed soil cumulative CO2 (Cmin) and cover crop C:N ratio were used to estimate the N mineralization (Nmin) [54,61]. Nmin values were fitted to a first-order kinetics model Equation (2) to estimate the potentially mineralizable pool of N (N0) for decomposers following cover crop residue addition [25,30,54]:
N   mineralization ,   N min   =   N 0   ·   ( 1     exp ( k N   ·   t ) )
where Nmin is the mineral N (mg N kg−1) detected in the soil after time t (days); N0 is N mineralization potential (mg N kg−1); kN is the first-order rate constant (day−1).

2.4. Statistical Analysis

Multivariate analysis of variance (MANOVA) was performed in R [62] to evaluate the effects of cover crop mixtures, residue application rate, and decomposition time on soil CO2 evolution, microbial biomass C and N, dissolved organic C and N, and mineral N contents ( NH 4 + , NO 2 , and NO 3 ). Mean separation was done using Tukey’s multiple sample t-tests in R. All statistical tests were performed at a significance level of 0.05. The non-linear regression model was used to estimate the model parameters in the first-order equations, including C mineralization potential (C0), N mineralization potential (N0), C mineralization constant (kC), N mineralization constant (kN), and half-lives of C and N mineralization (t1/2) based on the Gauss-Newton method with function “nls” in R [25,30]. Pearson’s correlation coefficients (r) between the observed and fitted values were computed.

3. Results

3.1. Soil CO2 Evolution and the Estimation of Carbon (C) Mineralization

Cumulative CO2 evolution was significantly (p ≤ 0.001) affected by the highest-ranking interaction of cover crop type × residue application rate × incubation time (Table 4). Cumulative CO2 evolution increased with increasing incubation time, and a rapid rate of CO2 evolution was detected in the first 7 days, whereas a relatively slow rate of C mineralization was detected during Day 7–24 for all treatments. Cumulative CO2 evolution linearly increased with increasing cover crop residue rate (R2 > 0.99) (Figure 1). The results suggested that the addition of cover crop residues significantly affected the cumulative CO2 evolution. Doubling the application rate of cover crop residues increased cumulative CO2 evolution by 1.2–1.4 times in all treatments. Of different cover crops, the cumulative CO2 evolution during 0–24 days was highest in soils amended with clover and 70% clover + 30% ryegrass (C7R3), followed by 30% clover +70% ryegrass (C3R7) and fallow, and lowest in ryegrass.
The observed CO2 evolution data from the laboratory incubation experiment were fitted into the first-order kinetic model to estimate the C mineralization potentials (C0) and time required for mineralizing half of C0 (t1/2). The C mineralization model fitted the observed data with Pearson’s correlations (r) between the observed and fitted values being larger than 0.985 for all treatments (Table 5), although this may be partly due to the limited number of sampling points. The C mineralization potential (C0) was highest in soils with diverse volunteer weeds in fallow (9069 mg kg−1), followed by soils with the mixtures of clover and ryegrass (C7R3 9228 mg kg−1, C3R7 9232 mg kg−1), and lowest in soils with one cover crop (ryegrass 8638 mg kg−1, clover 8430 mg kg−1). The C0 was likely associated with the diversity of cover crops and the lignin:N ratio; soils with more diverse cover crops and higher lignin:N ratio tend to have higher C0. Interestingly, despite having the lowest C0, clover had the fastest initial C decomposition rate (1535 mg kg−1 day−1) and required the shortest time to approach half of the C0. Microbes in the control soil needed 17.2 days to mineralize half of C0 (4281 mg C kg−1), whereas they required 4.5 times shorter to decompose half of the C0 in soils with clover (8431 mg C kg−1).

3.2. Estimation of N Mineralization Potential (N0) and Half-Life (t1/2)

Soil CO2 evolution during C mineralization and cover crop C:N ratio were used to describe the N mineralization (Nmin) by fitting into a first-order model to estimate the N mineralization potential (N0) and half-life (t1/2) (Table 5). The models fitted the observed data in all treatments with correlation coefficients (r) between the observed and fitted values being larger than 0.985. Although the control had a good N mineralization potential (N0), its N mineralization half-life (t1/2) was 2.9–4.5 times longer than soils amended with cover crops. Of cover crops, clover had the greatest N0, the largest mineralization rate constant (kN), the fastest initial potential mineralization rate (N0kN), and the shortest time to mineralize half of the N0. Based on the model, clover needed 3.8 days to mineralize 264 mg N kg−1, C7R3 and fallow needed 4.5–4.8 days to mineralize 239–243 mg N kg−1, while C3R7 and ryegrass needed 5.4–6.0 days to mineralize as little as 114–178 mg N kg−1.
The total observed N in the microbial pool, dissolved organic pool, and inorganic pool (MBN + DON + TMN) and its correlation with estimated N mineralization (Nmin) is shown in Figure 2. The total observed N had a strong correlation with estimated N mineralization in all treatments (Figure 2a,b). The total observed N linearly (R2 > 0.930) increased with increasing cover crop residue application rate in all treatments except ryegrass (Figure 2c). It is surprising that the total observed N only accounted for <10% of the total estimated N mineralization. The results suggested that the microbial C use efficiency could be lower than we imagined and the mineralized N loss through N2O emission and/or NH3 volatilization could be more than we expected. The C use efficiency ranged from 5.21–8.97% for soils amended with cover crops in this study (Table S2).

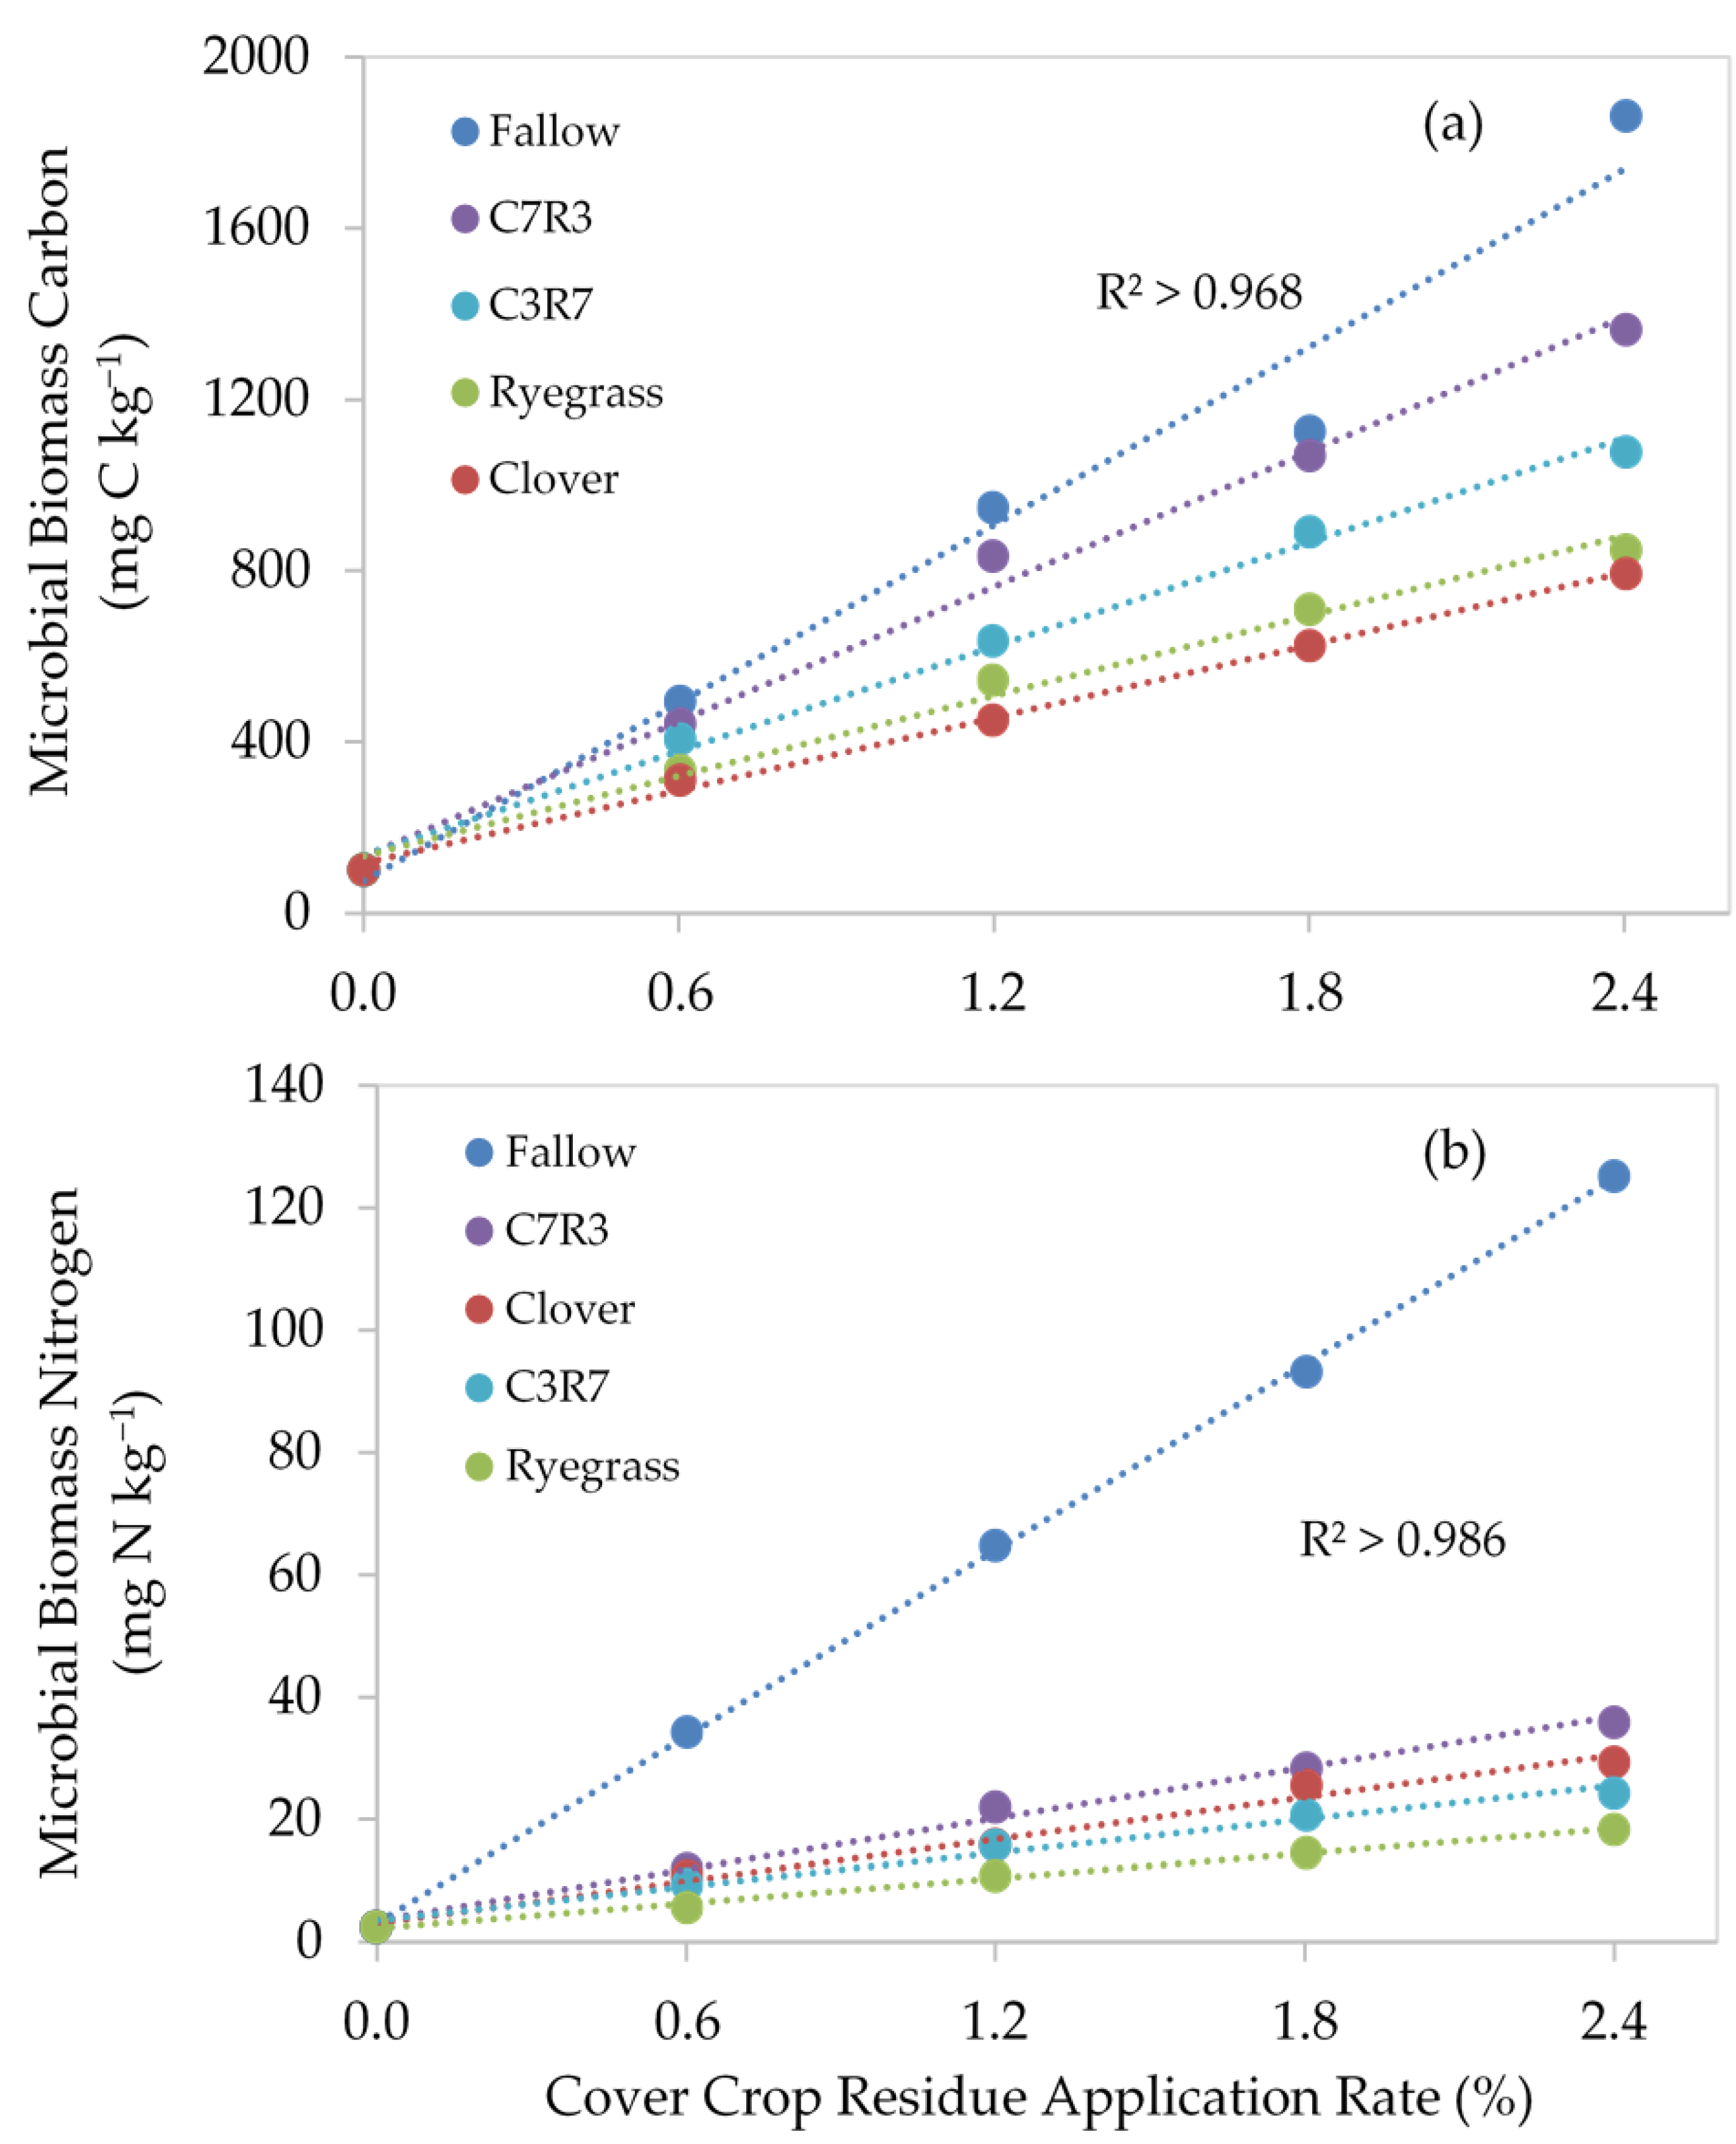
3.3. Soil C and N in Microbial and Organic Pools

Soil microbial biomass C (MBC) and microbial biomass N (MBN) were significantly affected by the interaction of cover crop type × application rate (p ≤ 0.001) (Table 4). Both MBC and MBN linearly increased with increasing cover crop residue rate (R2 > 0.96) (Figure 3). Among different cover crop types, fallow with diverse volunteer weeds had the greatest MBC, followed by the mixtures of clover and ryegrass, and least in ryegrass and clover. MBC is likely associated with cover crop diversity and lignin:N ratio; it was higher in soils with more diverse cover crops and higher in soils amended with high lignin:N ratio cover crop mixtures. Microbial biomass N was greatest in fallow, followed by C7R3 and clover, and lowest in ryegrass. MBN is likely associated with cover crop diversity and C:N ratio; it was higher in soils amended with more diverse cover crops and higher in soils amended with low C:N ratio cover crop mixtures. The ratio of soil MBC:MBN was higher than the ratio of cover crop material C:N in all treatments but fallow (Table 3), which suggested that not all organic materials in cover crop were readily decomposable. Nevertheless, it is consistent that fallow or clover had the lowest C:N ratios, followed by the mixes of clover and ryegrass, and lowest in ryegrass.
Soil dissolved organic C (DOC) was significantly affected by the interaction of cover crop type × application rate (p ≤ 0.05) (Table 4). Compared to the control, soils amended with cover crops increased DOC contents with a higher content detected in soils with a higher application rate. The DOC in soils with high application rates (1.8% and 2.4%) increased rapidly in the first 7 days then decreased gradually during 7–31 days. By contrast, DOC in soils with low application rates (0, 0.6%, and 1.2%) was relatively stable with incubation. Nevertheless, DOC contents in incubated soils were higher than that in background soil. Soil dissolved organic N (DON) was significantly impacted by the interactions of cover crop type × application rate (p ≤ 0.001) and application rate × incubation time (p ≤ 0.01) (Table 4). Compared to the control, cover crops amendment increased soil DON with a higher DON detected in soils with higher residue application rate. In the no cover crop control, soil DON increased with increasing incubation time, whereas the trends in soils with different cover crops were variable depending on the cover crop C:N ratio. In soils with low C: N ratio cover crops (clover, C7R3, and fallow), soil DON increased with time and peaked at D17, then decreased with time. In soils with relatively high C:N ratio cover crops (C3R7 and Ryegrass), soil DON was even lower than control during this experimental time range.

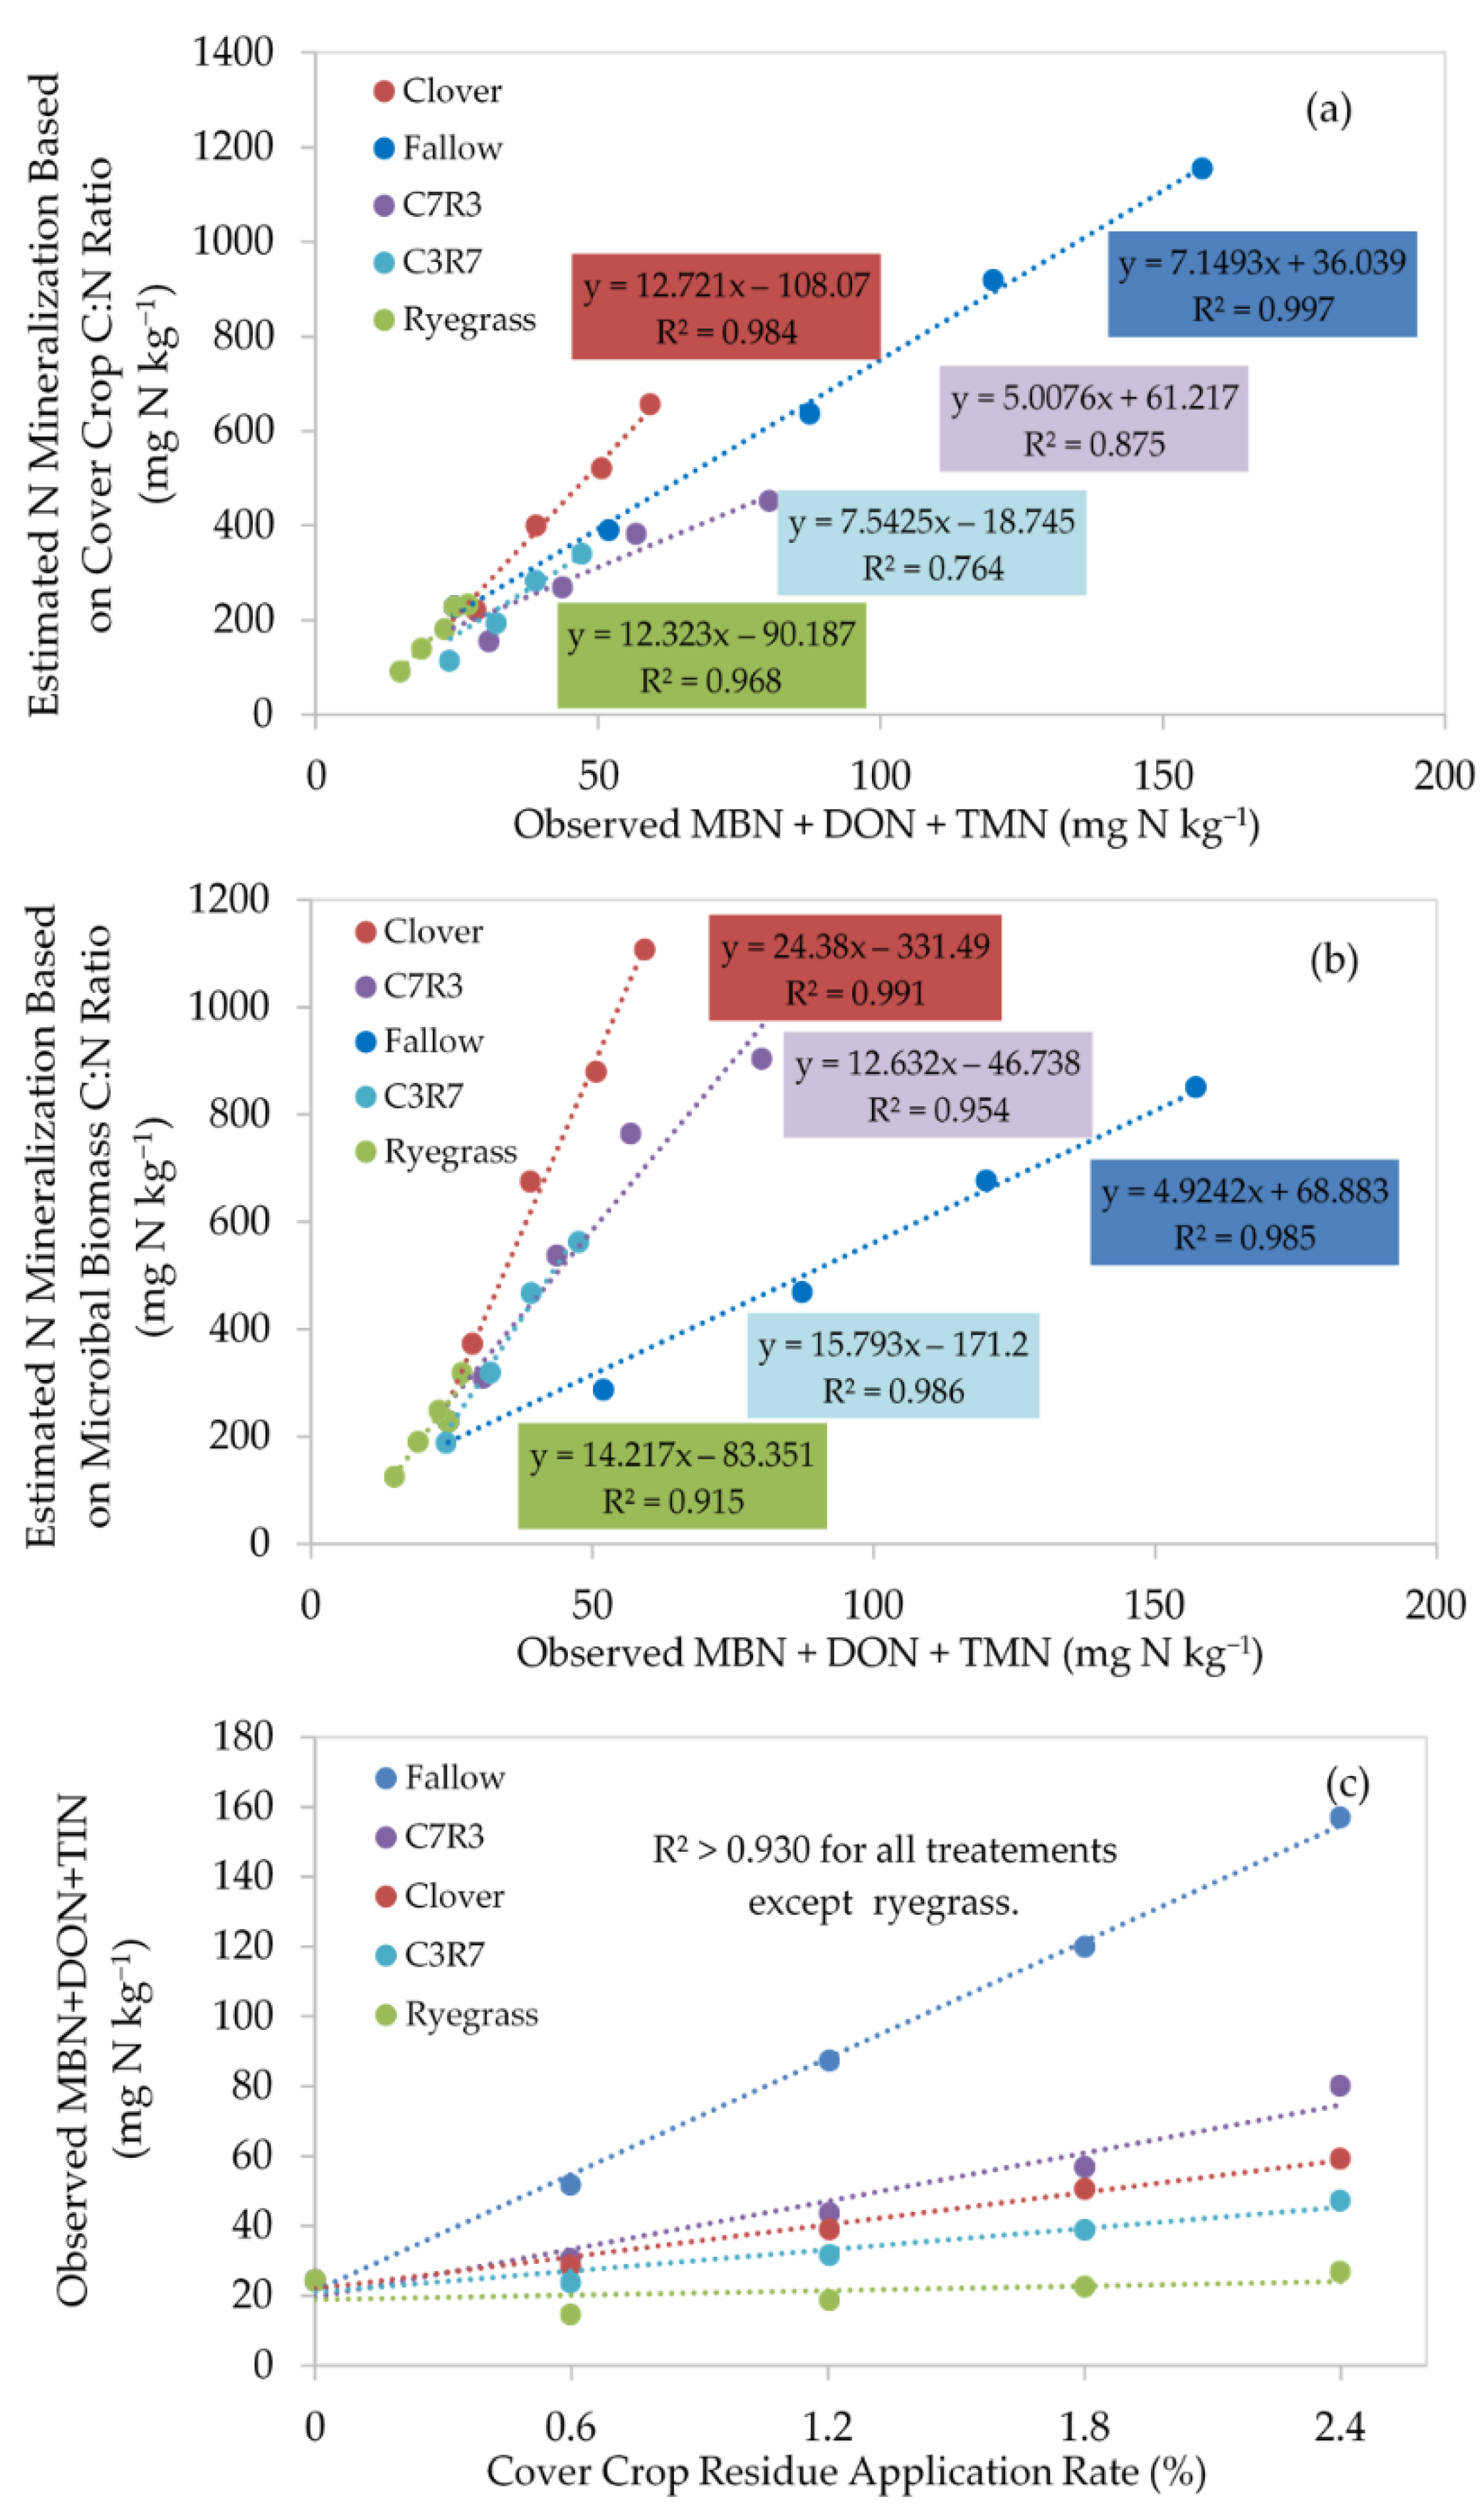
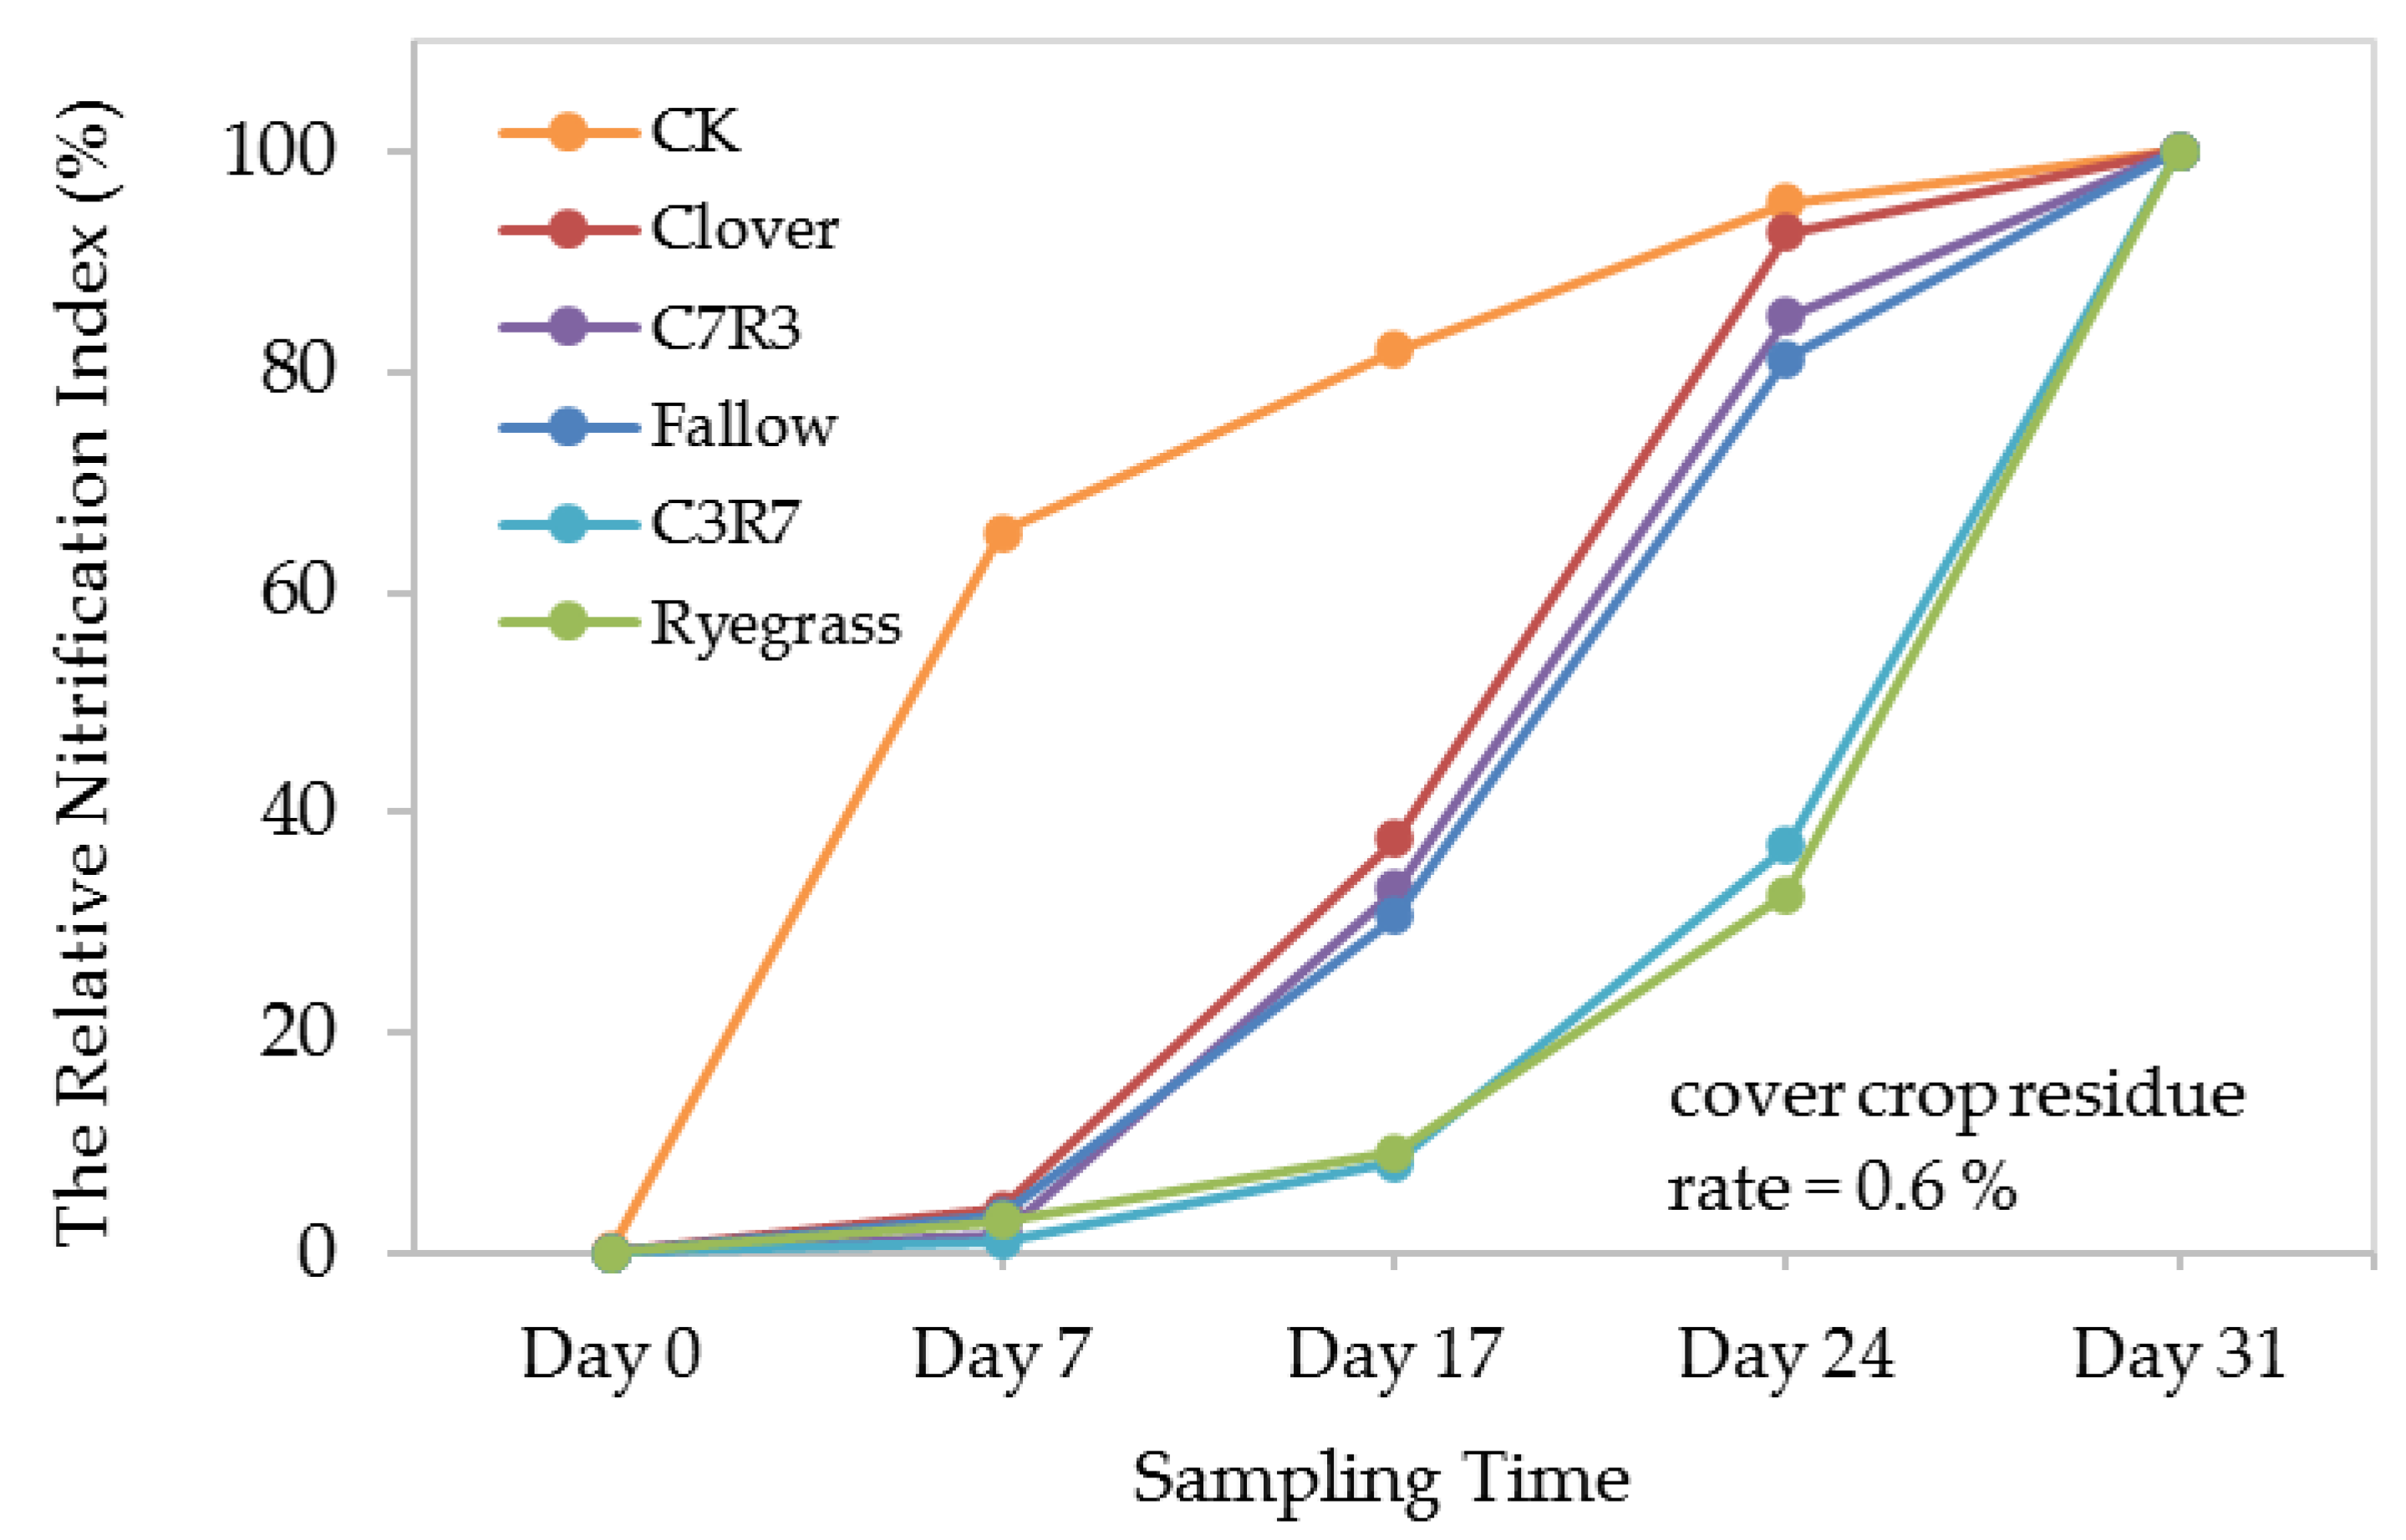
3.4. Soil Mineral Nitrogen Availability

Soil total mineral nitrogen (TMN) content during the 31-day incubation was significantly affected by the interaction of cover crop type × residue application rate × incubation time (Table 4). The dynamic of soil total mineral N during 0–31 days in soils amended with different cover crop mixtures and application rates is shown in Figure 4. Soil TMN in all treatments temporarily decreased at the initial stage of incubation when compared to the control, except for clover 2.4%, C7R3 2.4%, and fallow 2.4%. After a temporary decrease, TMN at residue application rate 0.6% lead the increase in TMN and required the shortest time to reach the crossover point (tc), at which the amount of TMN in soils amended with cover crop equaled that of the control soil (Figure 4). At 0.6%, the TMN in soils amended with clover, C7R3, and fallow started gradually increasing at Day 17. The result indicated that, during Day 0–17, the mineral N released by mineralization was less than the mineral N consumed by immobilization, while a net mineral N release was observed after Day 17. At 0.6%, clover needed 27 days to reach the crossover point. Clover needed the shortest time to start providing mineral N for organic rice use, followed by C7R3 and fallow, and C3R7 and ryegrass required the longest time to start providing mineral N to rice plants (Figure 4).
Of mineral N, NH 4 + and NO 3 are plant available N. During 0–31 days of aerobic incubation, nitrification occurred, which was evidenced by the dominance of NH 4 + before incubation and the dominance of NO 3 after incubation (Figure 5). Soil NH 4 + concentration generally decreased with increasing incubation time, while NO 3 concentration generally increased with increasing incubation time. The relative nitrification index (RNI), the proportion of the NO 3 to the sum of NO 3 and NH 4 + , increased with incubation time. Both NH 4 + and NO 3 , increased linearly (R2 > 0.89) with increasing cover crop residue rate, except the soils with ryegrass. Of different cover crops, NH 4 + content was highest in soils amended with C7R3 or fallow, followed by clover, and lowest in ryegrass. The trend of RNI of different cover crop mixtures can be divided into three groups: RNI in control increased rapidly in the first 7 days but relatively slow during Day 7–31; RNI in soils with low C:N ratio cover crop types (clover, C7R3, and fallow) increased slowly in the first 7 days but rapidly during 7–31 days, and the fastest increase was observed during Day 17–24; and RNI in soils with high C:N ratio cover crop types (C3R7 and ryegrass) increased slowly during the first 17 days but rapidly during Day 17–31, and the fastest increase was observed during Day 24–31.

4. Discussion

4.1. Carbon and Nitrogen Mineralization under Different Cover Crops and Application Rates

Soil CO2 evolution is a sensitive indicator of microbial decomposition of cover crop residue [25], in which CO2 is released from decomposing nutrients contained in soil organic matter to mineral forms by soil microbes and respiration from plant roots and soil fauna. We observed that cumulative CO2 evolution increased with increasing incubation time with a rapid evolution rate detected in the first 7 days and a relatively slow rate in the following days (Figure 1). The result suggested that the rapid breakdown of organic matter (organic acids, amino acids, and simple sugars) majorly occurred during 0–7 days and the C mineralization gradually decreased during 7–24 days. The results aligned with previous studies [25,61,63], which also reported a rapid increase at the initial stage and a relatively slower increase at the following stage. In these studies, however, the time duration of the initial rapid increase varied from one to two weeks depending on cover crop types, application rates, and soil types. Trinsoutrot et al. [59] interpreted that the initial decomposition rate was strongly related to the presence of soluble compounds, and the relationship between C mineralized and soluble fractions weakened as decomposition proceeded.
C mineralization varied among cover crop types and residue application rates (Figure 1, Table 5). Generally, plant residues with a low C:N ratio decompose faster than residues with a high C:N ratio [13,21,22,23,24,64]. In this study, clover, C7R3, and fallow had a lower C:N ratio when compared to C3R7 and ryegrass (Table 3). Wagger et al. [65] found increasing the plant residues C:N ratio from 28 to 37 increased net N immobilization from 12 to 33%. However, Carvalho et al. reported that the C:N ratio alone does not represent well the microbial decomposition because it does not take the quality of C into consideration [66]. The recalcitrant fraction of SOC, such as lignin, cellulose, etc. decomposed slowly and produced a small CO2 flux over a long time [67]. Numerous studies reported that cover crop decomposition rate was positively correlated with plant residue quality [23,64,68]. Tian et al. proposed a concept of plant residue quality index (PRQI) and reported that it was higher in cover crops with a low C:N ratio and low lignin content [68]. Silva et al. also observed a faster decomposition rate in soils with residues containing a high concentration of N and low lignin and polyphenol contents [64].
N mineralization and C mineralization are correlated and can be estimated by soil CO2 evolution and cover crop C:N ratio [54,61]. Although N mineralization potential (N0) in the control was estimated to be as high as 911 mg N kg−1, it would require 2.9–4.5 times longer to mineralize half of the N0. Adding cover crops into soil increased the mineralization rate constant by 2.9–4.6 times, increased the initial potential mineralization rate by 1.1–2.6 times, and shortened the half-life of mineralization (t1/2) by 2.9–4.5 times. Of cover crop types, clover showed the best performance in N mineralization to maximize the N availability in the shortest time. The promotion of mineralization by cover crops amendment was also observed by Ghimire et al. [25].

4.2. Effect of Cover Crop Types and Application Rates on Microbial Biomass Carbon and Nitrogen

Soil microorganisms are the key players in decomposing organic matter to mineral forms that are available to crops [69], and microbial biomass C can be used to assess the biological activity associated with the decomposition of residues using the equation: carbon use efficiency (CUE) = MBC/(CO2 evolution + MBC) [35,57,58]. The greater the CUE is, the greater the proportion of substrate organic C converted to microbial biomass rather than respired. In this study, the CUE ranged 5.21–8.97%, and was highest in fallow, followed by two mixtures, and lowest in clover (Table S2). CUE varied across conditions, especially soil moisture and temperature [38]. The low CUE also explained why the total observed N in the microbial pool, dissolved organic pool, and inorganic pool (MBN + DON + TMN) was only 10% or less of the total N mineralization potential (Table 5, Figure 2).
Microbial biomass C (MBC) is likely associated with cover crop diversity and lignin:N ratio; it was higher in soils with more diverse cover crops and higher in soils amended with high lignin:N ratio cover crops (Figure 3). The relationship between soil microbial biomass and cover crop diversity was also observed by Gentsch et al. [70], who reported that the microbial biomass contents were highest in soils with 12 cover crop mixes, followed by soils with 4 cover crop mixes, and lowest in soils with one cover crop. Lignin is a complex aromatic polymer and typically presents at 15–25% in lignocellulosic, which is the 2nd most abundant renewable and sustainable C source [71]. Lignin and N content as predictors of litter decay rates, and low lignin: N ratio is expected to lead to a higher decomposition rate [60]. In this study, the cover crop initial lignin:TN was highest in fallow, followed by ryegrass and two mixtures, and lowest in clover (Table 3).
Microbial biomass N (MBN) is likely affected by cover crop diversity and C:N ratio; it was higher in soils with more diverse cover crops and higher in soils amended with low C:N ratio cover crops (Figure 3). Microbial decomposition is an extraordinarily complex process. It is, however, generally agreed that soil microbes have an average C:N ratio of 7–8; only about 1/3 of C used by microbes is incorporated into their cells (MBC) and the remaining 2/3 is used as an energy source and respired as CO2 through a series of reactions ([C,O,4H] + O2 → CO2 + 2H2O + energy). Thus, microbes need at least 21 parts of C for every part of N assimilated. In this study, when cover crops with low C:N ratio (clover, fallow, and C7R3) were added into soil, cover crop residue potentially provides plenty of N for microbial growth. Microbes ‘attack’ cover crop residue for their growth and lead to an increase in microbial abundance and diversity, which was evidenced by the increased microbial biomass C and N. The thrived microbes digest organic residues to complex amino compounds (aminization: organic residues/proteins + O2 → complex amino compounds + CO2 + energy + other products). When sufficient C is available, the complex amino compounds can only be used in the synthesis of new cellular material. When the cover crop C:N ratio is low and C is not enough for microbes to incorporate all complex amino compounds into cellular structure, the extra complex amino acids (R-NH2) will be mineralized to produce energy and NH3 byproduct (ammonification: R-NH2 + HOH → R-OH + NH3 + energy). Depending on the pH and temperature, NH 4 + will be formed (pH < 7) and released to the soil (2NH3 + H2CO3 ←→ (NH4)2CO3 ←→ 2 NH 4 + + CO 3 2 ). With the presence of O2 during incubation, NH 4 + is nitrified and NO 3 is formed to produce more energy ( NH 4 + + 1.5O2 → H2O + 2 H + + energy, NO 2 + 0.5O2 NO 3 + energy). The occurrence of nitrification in this study was also supported by the results of relative nitrification index (RNI) in this study (Figure 5). When cover crops with a high C:N ratio (C3R7 and ryegrass) were added into soil, cover crop residue could not provide sufficient N for microbes to use all C in the residue to support microbial growth. In order to use C in the cover crop residue to produce energy and form cell structure (i.e., protein), microbes have to ‘rob’ mineral N from soil: NH 4 + and/or NO 3 → R-NH2 (immobilization) and lead to a temporary decrease in soil total inorganic N.

4.3. Soil Mineral N Availability under Different Cover Crop Types and Application Rates

A temporary decrease in soil total mineral nitrogen (TMN) content was detected in all treatments at the initial stage of incubation. The results indicated that immobilization occurred not only in soils with high C:N ratio cover crops (ryegrass and C3R7), but also in soils with low C:N ratio cover crops (clover, C7R3, and fallow). It suggested that cover crop materials with low C:N ratio are not always readily decomposable, since not all organic molecules are easily degraded. The cover crop C:N ratio is more a qualitative rather than a quantitative measure of substrate quality and the relative availability of C and N. If a considerable amount of C in cover crop residue is in the form of lignin or other resistant materials, the actual C:N ratio could be larger, which has been evidenced by the higher microbial biomass C:N ratio compared to cover crop C:N ratio (Table 3). The index of net N mineralization was calculated using the equation: Index of net N mineralization = cover crop C:N ratio * CUE/ microbial biomass C:N ratio [35]. An index value >1 indicated net N mineralization and an index value <1 indicated net N immobilization [35]. In this study, the index of net N mineralization was <1 in all treatments at D7 (Table S2), which explained why a temporary decrease in soil mineral N was detected at the initial stage of incubation. A similar trend was also observed in previous laboratory incubation studies and field trials [72,73], which reported that plant-available N ( NH 4 + + NO 3 ) was higher in control than soils with cover crops at the beginning of incubation, but the trend reversed after 20–30 days of incubation. The temporary decrease could be attributed to the N immobilization related to rapid microbial growth and N assimilation, denitrification caused by increased microbial activity, and increased NH3 volatilization during residue degradation [30,74]. Net immobilization of N took place during early decomposition with residue C:N as low as 15–21 in the initial weeks [72,75]. Mineral N, especially in the form of NH 4 + , is supposed to be the primary source for immobilization [76]). In the absence of NH 4 + , NO 3 was shown to be a good substrate for microbial assimilation [77]. The decrease in NH 4 + and increase in NO 3 in this study also supported the observations about a temporary decrease in TMN caused by immobilization (Figure 5).
After a temporary decrease, TMN in clover at residue application rate 0.6% showed an increase in TMN earliest compared to other residue rates and needed the shortest time to reach the crossover point (Figure 4). The results indicated that, after the incorporation of clover into soils, producers are needed to wait at least 27 days for organic rice planting to allow microbial decomposition to start supplying mineral N to the soil. When the time between cover crop incorporation and rice planting is too short, the soil TMN could be lower than the control. In this case, instead of providing N for organic rice, microbial immobilization can compete with rice regarding soil mineral N. Compared to the control, clover needed the shortest time while ryegrass required the longest time to start providing mineral N to the following crop (Figure 4). Kuo and Sainju reported that the time needed for soils amended with ryegrass to reach a crossover point was 30 weeks [30].
In practice, it is important to select the appropriate cover crop type, rate, and termination time. Of the cover crop types and rates tested, clover at 0.6% provided the greatest mineral N and required the shortest time to mineralize half of the N mineralization potential (N0). In our 2012–2014 organic rice field trials, the average annual clover dry biomass was 4642 kg ha−1 (Table 2). Assuming the soil weight is 1,820,000 kg dry soil ha−1 (15 cm deep, bulk density 1.2 g cm−3), the residue application rate of 0.6% would be 10,920 kg ha−1 dry biomass in the organic field. A seeding rate of 9 kg ha−1 was used to achieve 4642 kg ha−1 dry biomass in the organic field; thus, a seeding rate of 21 kg ha−1 clover seed and a minimum of 27 days between cover crop incorporation and planting would be needed to maximize the mineral N availability for rice growth at an early stage.

5. Conclusions

Incorporation of cover crops into soil can offer an effective way to increase mineral nitrogen (N) for organic rice growth. Cover crop C mineralization increased with increasing incubation time with a rapid mineralization rate detected in the first 7 days and a relatively slow rate detected in the following days. The addition of cover crop residues significantly increased the cumulative C mineralization, which linearly increased with increasing cover crop residue rate. Of different cover crop types, clover or mixtures of clover and ryegrass had the greatest cumulative C mineralization, followed by fallow, and the lowest in ryegrass. Clover had the greatest N mineralization potential and initial N mineralization rates, and required the shortest time to decompose half of the N mineralization potential (N0). Based on the observed and modeling results, clover is the optimal cover crop type, 0.6% is the optimal residue application rate, and a minimum of 27 days is required between cover crop termination and rice planting to provide mineral N for organic rice growth. The results indicated that adoption of clover at 0.6% (seeding rate 21 kg ha−1, dry biomass 10,920 kg ha−1) and incorporation of cover crop at least 27 days before seeding organic rice could be a promising strategy to improve soil mineral N availability and reduce fertilizer cost. The results of this study provide a great addition to the toolbox for decision-makers, researchers, county agents, and producers to adjust N application to more precisely match crop N demand and make improved organic adoption and management decisions. Still, further studies are needed to validate the results under field conditions in different soil types, at various locations, under other climate conditions, and associated with varying varieties of rice to ensure the success of organic rice production.

Supplementary Materials

The following are available online at https://www.mdpi.com/2071-1050/13/5/2866/s1, Table S1: Micronutrient contents of the cover crops, Table S2: Carbon use efficiency and index of net mineralization in soils amended with different cover crops.

Author Contributions

All authors provided critical feedback and helped shape the research, analysis, and manuscript. Conceptualization, X.L. and F.D.; methodology, X.L. and F.D.; software, K.C., Y.P. and X.L.; validation, X.L. and T.G.; formal analysis, X.L., K.C. and Y.P.; investigation, X.L. and A.T.; resources, F.D.; data curation, X.L. and F.D.; writing—original draft preparation, X.L. and F.D.; writing—review and editing, all authors; visualization, X.L.; supervision, F.D.; project administration, F.D.; funding acquisition, F.D. All authors have read and agreed to the published version of the manuscript.

Funding

This research was funded by the National Institute of Food and Agriculture, U.S. Department of Agriculture (USDA) (grant number 2012-51106-20137) and USDA Southern Sustainable Agriculture Research and Education Program (LS 12-249).

Conflicts of Interest

The authors declare no conflict of interest.

References

  1. USDA-ERS. Organic Production. Table 3. Certified Organic and Total U.S. Acreage, Selected Crops and Livestock, 1995–2011 (Last Updated on 24 October 2013). Economic Research Service, United States Department of Agriculture. Available online: https://www.ers.usda.gov/data-products/organic-production/ (accessed on 16 July 2020).
  2. USDA-NASS. Certified Organic Survey 2016 Summary Report (Released on 20 September 2017). National Agriculture Statistics Service, United States Department of Agriculture. Available online: https://downloads.usda.library.cornell.edu/usda-esmis/files/zg64tk92g/70795b52w/4m90dz33q/OrganicProduction-09-20-2017_correction.pdf (accessed on 16 July 2020).
  3. Jerkins, D.; Ory, J. National Organic Research Agenda: Outcomes and Recommendations from the 2015 National Organic Farmer Survey and Listening Sessions. 2016. Available online: https://ofrf.org/wp-content/uploads/2019/09/NORA_2016_final9_28.pdf (accessed on 27 May 2020).
  4. Robertson, G.P.; Vitousek, P.M. Nitrogen in agriculture: Balancing the cost of an essential resource. Annu. Rev. Environ. Resour. 2009, 34, 97–125. [Google Scholar] [CrossRef] [Green Version]
  5. Claire, C.; John, D.L.; Bill, D.; Laura, L.V.E. Legume cover crop management on nitrogen dynamics and yield in grain corn systems. Field Crops Res. 2017, 201, 75–85. [Google Scholar]
  6. Sainju, U.M.; Singh, H.P.; Singh, B.P.; Whitehead, W.F.; Chiluwal, A.; Paudel, R. Cover crop and nitrogen fertilization influence soil carbon and nitrogen under bioenergy sweet sorghum. Agron. J. 2018, 110, 463–477. [Google Scholar] [CrossRef] [Green Version]
  7. Ritter, W.F.; Scarborough, R.W.; Chirnside, A.E.M. Winter cover crops as a best management practice for reducing nitrogen leaching. J. Contam. Hydrol. 1998, 34, 1–15. [Google Scholar] [CrossRef]
  8. Shelton, R.E.; Jacobsen, K.L.; McCulley, R.L. Cover crops and fertilization alter nitrogen loss in organic and conventional conservation agriculture systems. Front. Plant Sci. 2018, 8, 2260. [Google Scholar] [CrossRef] [PubMed] [Green Version]
  9. Thapa, R.; Mirsky, S.B.; Tully, K.L. Cover crops reduce nitrate leaching in agroecosystems: A global meta-analysis. J. Environ. Qual. 2018, 47, 1400–1411. [Google Scholar] [CrossRef] [PubMed]
  10. Reberg-Horton, S.C.; Burton, J.D.; Danehower, D.A.; Ma, G.; Monks, D.W.; Murphy, J.P.; Ranells, N.N.; Williamson, J.D.; Creamer, N.G. Changes over time in the allelochemical content of ten cultivars of rye (Secale cereale L.). J. Chem. Ecol. 2005, 31, 179–193. [Google Scholar] [CrossRef]
  11. Cordeau, S.; Guillemin, J.P.; Reibel, C.; Chauvel, B. Weed species differ in their ability to emerge in no-till systems that include cover crops. Ann. Appl. Biol. 2015, 166, 444–455. [Google Scholar] [CrossRef]
  12. Schipanski, M.E.; Barbercheck, M.; Douglas, M.R.; Finney, D.M.; Haider, K.; Kaye, J.P.; Kemanian, A.R.; Mortensen, D.A.; Ryan, M.R.; Tooker, J.; et al. A framework for evaluating ecosystem services provided by cover crops in agroecosystems. Agric. Syst. 2014, 125, 12–22. [Google Scholar] [CrossRef]
  13. Finney, D.M.; White, C.M.; Kaye, J.P. Biomass production and carbon/nitrogen ratio influence ecosystem services from cover crop mixtures. Agron. J. 2016, 108, 39–52. [Google Scholar] [CrossRef] [Green Version]
  14. Cook, J.C.; Gallagher, R.S.; Kaye, J.P.; Lynch, J.; Bradley, B. Optimizing vetch nitrogen production and corn nitrogen accumulation under no-till management. Agron. J. 2010, 102, 1491–1499. [Google Scholar] [CrossRef]
  15. White, K.E.; Brennan, E.B.; Cavigelli, M.A.; Smith, R.F. Winter cover crops increase readily decomposable soil carbon, but compost drives total soil carbon during eight years of intensive, organic vegetable production in California. PLoS ONE 2020, 15, e0228677. [Google Scholar] [CrossRef]
  16. Dabney, S.M.; Breitenbeck, G.A.; Griffin, J.L.; Hoff, B.J. Subterranean clover cover crop used to increase rice yield. Agron. J. 1989, 81, 483–487. [Google Scholar] [CrossRef]
  17. Yu, Y.; Xue, L.; Yang, L. Winter legumes in rice crop rotations reduces nitrogen loss, and improves rice yield and soil nitrogen supply. Agron. Sustain. Dev. 2014, 34, 633–640. [Google Scholar] [CrossRef] [Green Version]
  18. Luo, M.; Wang, Z.; Yang, B.; Zheng, L.; Yao, Z.; Seyrek, U.A.; Chung, H.; Wei, H. Effects of winter cover crops on rice pests, natural enemies, and grain yield in a rice rotation system. J. Insect. Sci. 2019, 19, 1–8. [Google Scholar] [CrossRef] [PubMed]
  19. Correia, S.L.; Silva, P.R.F.; Boeni, M.; Bredemeier, C.; Anghinoni, I.; Menegati, G.B.; Maass, M.B.; Miozzo, L.C. Performance of flooded rice grown in succession to winter cover crops. Rev. Bras. Cienc. Solo. 2018, 42, e0160461. [Google Scholar] [CrossRef] [Green Version]
  20. Portugal, J.R.; Arf, O.; Buzetti, S.; Portugal, A.R.P.; Garcia, N.F.S.; Meirelles, F.C.; Garé, L.M.; Abrantes, F.L.; Rodrigues, R.A.F. Do cover crops improve the productivity and industrial quality of upland rice? Agron. J. 2020, 112, 327–343. [Google Scholar] [CrossRef]
  21. Kuo, S.; Huang, B.; Bembenek, R. Effect of winter cover crops on soil nitrogen availability, corn yield, and nitrate leaching. Sci. World J. 2001, 1 (Suppl. S2), 22–29. [Google Scholar] [CrossRef] [PubMed]
  22. Jahanzad, E.; Barker, A.V.; Hashemi, M.; Eaton, T.; Sadeghpour, A.; Weis, S.A. Nitrogen release dynamics and decomposition of buried and surface cover crop residue. Agron. J. 2016, 108, 1735–1741. [Google Scholar] [CrossRef]
  23. Lynch, M.J.; Mulvaney, M.J.; Hodges, S.C.; Thompson, T.L.; Thomason, W.E. Decomposition, nitrogen and carbon mineralization from food and cover crop residues in the central plateau of Haiti. Springerplus 2016, 5, 973–981. [Google Scholar] [CrossRef] [PubMed] [Green Version]
  24. White, C.M.; Finney, D.M.; Kemanian, A.R.; Kaye, J.P. A model-data fusion approach for predicting cover crop nitrogen supply to corn. Agron. J. 2016, 108, 2527–2540. [Google Scholar] [CrossRef] [Green Version]
  25. Ghimire, B.; Ghimire, R.; VanLeeuwen, D.; Mesbah, A. Cover crop residue amount and quality effects on soil organic carbon mineralization. Sustainability 2017, 9, 2316. [Google Scholar] [CrossRef] [Green Version]
  26. Thorup-Kristensen, K.; Dresbøll, D.B. Incorporation time of nitrogen catch crops influences the N effect for the succeeding crop. Soil Use Manag. 2010, 26, 27–35. [Google Scholar] [CrossRef]
  27. Vigil, M.F.; Kissel, D.E. Rate of nitrogen mineralized from incorporated crop residues as influenced by temperature. Soil Sci. Soc. Am. J. 1995, 59, 1636–1644. [Google Scholar] [CrossRef]
  28. Chaves, B.; De Neve, S.; Hofman, G.; Boeckx, P.; Van Cleemput, O. Nitrogen mineralization of vegetable root residues and greenmanures as related to their (bio)chemical composition. Eur. J. Agron. 2004, 21, 161–170. [Google Scholar] [CrossRef]
  29. Frankenberger, W.T., Jr.; Abdelmagid, H.M. Kinetic parameters of nitrogen mineralization rates from leguminous crops incorporated into soil. Plant Soil 1985, 87, 257–271. [Google Scholar] [CrossRef]
  30. Kuo, S.; Sainju, U.M. Nitrogen mineralization and availability of mixed leguminous and non-leguminous cover crop residues in soil. Biol. Fertil. Soil 1998, 26, 346–353. [Google Scholar] [CrossRef]
  31. Melkonian, J.; Poffenbarger, H.J.; Mirsky, S.B.; Ryan, M.R.; Moebius-Clune, B.N. Estimating nitrogen mineralization from cover crop mixtures using the precision nitrogen management model. Agron. J. 2017, 109, 1944–1959. [Google Scholar] [CrossRef] [Green Version]
  32. Breland, T.A. Enhanced mineralization and denitrification as a result of heterogeneous distribution of clover residues in soil. Plant Soil 1994, 166, 1–12. [Google Scholar] [CrossRef]
  33. Dou, F.; Zhou, X.; McClung, A.; Storlien, J.; Lang, Y.; Torbert, A.; Hons, F.; Wards, B.; Kresovich, S.; Wight, J. Cover crop, Soil amendments, and variety effects on organic rice production in Texas. In Proceedings of the 35th The Rice Technical Working Group Meeting, New Orleans, LA, USA, 18–21 February 2014; p. 141. [Google Scholar]
  34. Dou, F.; Anderson, D.; Kresovich, S.; McClung, A.; Ward, B.; Zhou, X. Improving Soil Quality to Increase Yield and Reduce Diseases in Organic Rice Production; Final Report for USDA SARE Grant LS12-249; USDA: College Park, MD, USA, 2015. Available online: https://projects.sare.org/project-reports/ls12-249/ (accessed on 20 September 2020).
  35. O’Connell, S.; Shi, W.; Grossman, J.M.; Hoyt, G.D.; Fager, K.L.; Creamer, N.G. Short-term nitrogen mineralization from warm-season cover crops in organic farming systems. Plant Soil 2015, 396, 353–367. [Google Scholar] [CrossRef]
  36. Zibilske, L.M.; Bradford, J.M. Oxygen effects on carbon, polyphenols, and nitrogen mineralization potential in soil. Soil Sci. Soc. Am. J. 2007, 71, 133–139. [Google Scholar] [CrossRef] [Green Version]
  37. Wang, C.; Wan, S.; Xing, X.; Zhang, L.; Han, X. Temperature and soil moisture interactively affected soil net N mineralization in temperate grassland in Northern China. Soil Biol. Biochem. 2006, 38, 1101–1110. [Google Scholar] [CrossRef]
  38. Pold, G.; Domeignoz-Horta, L.A.; Morrison, E.W.; Frey, S.D.; Sistla, S.A.; DeAngelis, K.M. Carbon use efficiency and its temperature sensitivity covary in soil bacteria. mBio 2020, 11, e02293-19. [Google Scholar] [CrossRef] [PubMed] [Green Version]
  39. Martin, J.V.; de Imperial, R.M.; Calvo, R.; Garcia, M.C.; Leon-Cofreces, C.; Delgado, M.M. Carbon mineralization kinetics of poultry manure in two soils. Soil Res. 2012, 50, 222–228. [Google Scholar] [CrossRef]
  40. Schofield, R.K.; Taylor, A.W. The measurement of soil pH. Soil Sci. Soc. Am. Proc. 1955, 19, 164–167. [Google Scholar] [CrossRef]
  41. Rhoades, J.D. Soluble salts. In Methods of Soil Analysis: Part 2. Agronomy Monograph 9, 2nd ed.; Page, A.L., Ed.; ASA: Madison, WI, USA; SSSA: Madison, WI, USA, 1982; pp. 167–178. [Google Scholar]
  42. McGeehan, S.L.; Naylor, D.V. Automated instrumental analysis of carbon and nitrogen in plant and soil samples. Commun. Soil Sci. Plant Anal. 1988, 19, 493–505. [Google Scholar] [CrossRef]
  43. Mehlich, A. New extractant for soil test evaluation of phosphorus, potassium, magnesium, calcium, sodium, manganese, and zinc. Commun. Soil Sci. Plant Anal. 1978, 9, 477–492. [Google Scholar] [CrossRef]
  44. Mehlich, A. Mehlich-3 soil test extractant: A modification of Mehlich-2 extractant. Commun. Soil Sci. Plant Anal. 1984, 15, 1409–1416. [Google Scholar] [CrossRef]
  45. Sweeney, R.A. Generic combustion method for determination of crude protein in feeds: Collaborative Study. J. Assoc. Off. Anal. Chem. 1989, 72, 770–774. [Google Scholar] [CrossRef]
  46. Dence, C.W. The determination of lignin. In Methods in Lignin Chemistry; Lin, S.Y., Dence, C.W., Eds.; Springer: Heidelberg, Germany, 1992; pp. 33–61. [Google Scholar]
  47. Isaac, R.A.; Johnson, W.C. Collaborative study of wet and dry ashing techniques for the elemental analysis of plant tissue by atomic absorption spectrophotometry. J. Assoc. Off. Anal. Chem. 1975, 58, 436–440. [Google Scholar] [CrossRef]
  48. Havlin, J.L.; Soltanpour, P.N. A nitric acid and plant digest method for use with inductively coupled plasma spectrometry. Commun. Soil Sci. Plant Anal. 1989, 14, 969–980. [Google Scholar] [CrossRef]
  49. Dorich, R.A.; Nelson, D.W. Direct colorimetric measurement of ammonium in potassium chloride extracts of soil. Soil Sci. Soc. Am. J. 1983, 47, 833–836. [Google Scholar] [CrossRef]
  50. Markus, D.K.; McKinnon, J.P.; Buccafuri, A.F. Automated analysis of nitrite, nitrate, and ammonium nitrogen in soils. Soil Sci. Soc. Am. J. 1985, 49, 1208–1215. [Google Scholar] [CrossRef]
  51. Kachurina, O.M.; Zhang, H.; Raun, W.R.; Krenzer, E.G. Simultaneous determination of soil aluminum, ammonium- and nitrate-nitrogen using 1 M potassium chloride extraction. Commun. Soil Sci. Plant Anal. 2000, 31, 893–903. [Google Scholar] [CrossRef]
  52. Keeney, D.R.; Nelson, D.W. Nitrogen—Inorganic forms. In Methods of Soil Analysis: Part 2. Agronomy Monograph 9, 2nd ed.; Page, A.L., Miller, R.H., Keeney, D.R., Eds.; ASA: Madison, WI, USA; SSSA: Madison, WI, USA, 1982; pp. 643–687. [Google Scholar]
  53. Lavoie, M.; Bradley, R.L. Short-term increases in relative nitrification rates due to trenching in forest floor and mineral soil horizons of different forest types. Plant Soil 2003, 252, 367–384. [Google Scholar] [CrossRef]
  54. Tian, Y.; Toda, H. pH and substrate regulation of nitrogen and carbon dynamics in forest soils in a karst region of the upper Yangtze River basin, China. J. For. Res. 2013, 18, 228–237. [Google Scholar] [CrossRef]
  55. Beck, T.; Joergensen, R.G.; Kandeler, E.; Makeschin, F.; Nuss, E.; Oberholzer, H.R.; Scheu, S. An inter-laboratory comparison of ten different ways of measuring soil microbial biomass C. Soil Biol. Biochem. 1997, 29, 1023–1032. [Google Scholar] [CrossRef]
  56. Brookes, P.C.; Kragt, J.F.; Powlson, D.S.; Jenkinson, D.S. Chloroform fumigation and the release of soil nitrogen: The effects of fumigation time and temperature. Soil Biol. Biochem. 1985, 14, 831–835. [Google Scholar] [CrossRef]
  57. Schroeder, J.; Jannoura, R.; Beuschel, R.; Pfeiffer, B.; Dyckmans, J.; Murugan, R.; Chavannavar, S.; Wachendorf, C.; Joergensen, R.G. Carbon use efficiency and microbial functional diversity in a temperate Luvisol and a tropical Nitisol after millet litter and N addition. Biol. Fertil. Soils 2020, 56, 1139–1150. [Google Scholar] [CrossRef]
  58. Manzoni, S.; Taylor, P.; Richter, A.; Porporato, A.; Ågren, G.I. Environmental and stoichiometric controls on microbial carbon-use efficiency in soils. New Phytol. 2012, 196, 79–91. [Google Scholar] [CrossRef] [PubMed]
  59. Trinsoutrot, I.; Recous, S.; Bentz, B.; Lineres, M.; Cheneby, D.; Nicolardot, B. Biochemical quality of crop residues and carbon and nitrogen mineralization kinetics under nonlimiting nitrogen conditions. Soil Sci. Soc. Am. J. 2000, 64, 918–926. [Google Scholar] [CrossRef]
  60. McFarland, J.W.; Ruess, R.W.; Kielland, K.; Pregiter, K.; Hendrick, R. Glycine mineralization in situ closely correlates with soil carbon availability across six North American forest ecosystems. Biogeochemistry 2010, 99, 175–191. [Google Scholar] [CrossRef]
  61. Kirchmann, H.; Bergqvist, R. Carbon and nitrogen mineralization of white clover plants (Trifolium repens) of different age during aerobic incubation with soil. J. Soil Sci. Plant. Nutr. 1989, 152, 281–286. [Google Scholar] [CrossRef]
  62. R Core Team. A Language and Environment for Statistical Computing; R Foundation for Statistical Computing: Vienna, Austria, 2015; Available online: https://www.r-project.org/ (accessed on 12 August 2020).
  63. Huang, Y.; Zou, J.W.; Zheng, X.H.; Wang, Y.S.; Xu, X.K. Nitrous oxide emissions as influenced by amendment of plant residues with different C:N ratios. Soil Biol. Biochem. 2004, 36, 973–981. [Google Scholar] [CrossRef]
  64. Silva, E.C.D.; Muraoka, T.; Franzini, V.I.; Sakadevan, K.; Buzetti, S.; Arf, O.; Bendassolli, J.A.; Soares, F.A.L. Use of nitrogen from fertilizer and cover crops by upland rice in an Oxisol under no-tillage in the Cerrado. Pesqui. Agropecu. Bras. 2016, 51, 728–737. [Google Scholar] [CrossRef] [Green Version]
  65. Wagger, M.G. Time of desiccation effects on plant composition and subsequent nitrogen release from several winter annual cover crops. Agron. J. 1989, 81, 236–241. [Google Scholar] [CrossRef]
  66. Carvalho, A.M.; de Souza, L.L.P.; de Guimarães Júnior, R.; Alves, P.C.A.C.; Vivaldi, L.J. Cover plants with potential use for crop-livestock integrated systems in the Cerrado region. Pesqui. Agropecu. Bras. 2011, 46, 1200–1205. [Google Scholar] [CrossRef]
  67. Staaf, H.; Berg, B. Accumulation and release of plant nutrients in decomposing scots pine needle litter—Long-term decomposition in a scots pine forest. Can. J. Bot. 1982, 60, 1561–1568. [Google Scholar] [CrossRef]
  68. Tian, G.; Brussaard, L.; Kang, B.T. An index for assessing the quality of plant residues and evaluating their effects on soil and crop in the (sub-) humid tropics. Appl. Soil Ecol. 1995, 2, 25–32. [Google Scholar] [CrossRef] [Green Version]
  69. Kaschuk, G.; Alberton, O.; Hungria, M. Three decades of soil microbial biomass studies in Brazilian ecosystems: Lessons learned about soil quality and indications for improving sustainability. Soil Biol. Biochem. 2010, 42, 1–13. [Google Scholar] [CrossRef]
  70. Gentsch, N.; Boy, J.; Batalla, J.D.K.; Heuermann, D.; von Wirén, N.; Schweneker, D.; Feuerstein, U.; Groß, J.; Bauer, B.; Reinhold-Hurek, B.; et al. Catch crop diversity increases rhizosphere carbon input and soil microbial biomass. Biol. Fertil. Soils 2020, 56, 943–957. [Google Scholar] [CrossRef]
  71. Argyropoulos, D.; Menachem, S. Lignin. In Biopolymers from Renewable Resources; Kaplan, D.L., Ed.; Springer: New York, NY, USA, 1998; pp. 292–322. [Google Scholar]
  72. Jensen, E.S. Mineralization-immobilization of nitrogen in soil amended with low C:N ratio plant residues with different particle sizes. Soil Biol. Biochem. 1994, 26, 519–521. [Google Scholar] [CrossRef]
  73. Woli, K.P.; Pantoja, J.L.; Sawyer, J.E. Soil inorganic nitrogen with incubation of rye cover crop biomass. Commun. Soil Sci. Plant Anal. 2016, 47, 2558–2572. [Google Scholar] [CrossRef]
  74. Quemada, M.; Carbrera, M.L. Carbon and nitrogen mineralized from leaves and stems of four cover crops. Soil Sci. Soc. Am. J. 1995, 59, 471–477. [Google Scholar] [CrossRef]
  75. Marstorp, H.; Kirchmann, H. Carbon and nitrogen mineralization and crop uptake of nitrogen from six green manure legume decomposing in soil. Acta Agric. Scand. 1991, 41, 243–252. [Google Scholar] [CrossRef]
  76. Abera, G.; Wolde-Meskel, E.; Bakken, L.R. Carbon and nitrogen mineralization dynamics in different soils of the tropics amended with legume residues and contrasting soil moisture contents. Biol. Fertil. Soils 2012, 48, 51–66. [Google Scholar] [CrossRef]
  77. Recous, S.; Machet, J.M.; Mary, B. The partitioning of fertilizer-N between soil and crop: Comparison of ammonium and nitrate applications. Plant Soil 1992, 144, 101–111. [Google Scholar] [CrossRef]
Figure 1. The cumulative CO2 (mg C g−1 soil) during (a) different times of incubation, (b) the cumulative CO2 during 0–24 d incubation of soils with different cover crop mixtures and residue application rates, and (c) the rate of CO2 evolution (mg C g1 soil day−1). Six cover crop mixtures included control (CK), white clover, annual ryegrass, 70% clover + 30% ryegrass (C7R3), 30% clover + 70% ryegrass (C3R7), and fallow (volunteer weeds), five residue application rates included 0, 0.6, 1.2, 1.8, and 2.4%, and five incubation times included 0–1, 0–3, 0–7, 0–17, and 0–24 day with three replications.
Sustainability 13 02866 g001
Figure 2. Relationship between estimated N mineralization (mg N kg−1) and observed MBN + DON + TMN (mg N kg−1) at Day 7. N mineralization potential was estimated by (a) C mineralization/ cover crop C:N ratio and (b) C mineralization/ microbial biomass C:N ratio, respectively. (c) The observed MBN + DON + TMN in soils with different cover crop mixtures and residue application rates. Six cover crop mixtures included control (no cover crop added), white clover, annual ryegrass, 70% clover + 30% ryegrass (C7R3), 30% clover + 70% ryegrass (C3R7), and fallow (volunteer weeds), five residue application rates included 0, 0.6, 1.2, 1.8, and 2.4%. MBN, microbial biomass N; DON, dissolved organic N; TMN, total mineral N.
Sustainability 13 02866 g002
Figure 3. Soil microbial biomass carbon (a) and microbial biomass nitrogen (b) under different cover crop residue mixtures and application rates. Six cover crop mixtures included control (no cover crop added), white clover, annual ryegrass, 70% clover + 30% ryegrass (C7R3), 30% clover + 70% ryegrass (C3R7), and fallow (volunteer weeds), five residue application rates included 0, 0.6, 1.2, 1.8, and 2.4%.
Sustainability 13 02866 g003
Figure 4. Dynamics of soil total mineral N during 0–31 day in soils with different cover crop mixtures and application rates. (a) Total mineral N in soils with clover at different application rates; (b) total mineral N in soils with 70% clover + 30% ryegrass (C7R3) at different application rates; (c) total mineral N in soils with fallow (volunteer weeds) at different application rates; (d) total mineral N in soils with 30% clover + 70% ryegrass (C3R7) at different application rates; (f) total mineral N in soils with different cover crop mixtures at the residue application rate of 0.6%. Six cover crop mixtures included control (CK), white clover, annual ryegrass, 70% clover + 30% ryegrass (C7R3), 30% clover + 70% ryegrass (C3R7), and fallow (volunteer weeds), five residue application rates included 0, 0.6, 1.2, 1.8, and 2.4%.
Sustainability 13 02866 g004
Figure 5. The relative nitrification index (RNI) during 0–31 day in soils with different cover crop mixes at the optimal residue application rate of 0.6%. RNI was estimated by RNI (%) = NO 3 /( NO 3 + NH 4 + ) × 100% according to Lavoie and Bradley [53] and Tian and Toda [54]. Six cover crop mixtures included control (CK), white clover, annual ryegrass, 70% clover + 30% ryegrass (C7R3), 30% clover + 70% ryegrass (C3R7), and fallow (volunteer weeds), and five sampling times included Day 0, Day 7, Day 17, Day 24, and Day 31.
Sustainability 13 02866 g005
Table 1. Properties of the background soil used for the laboratory incubation.
pHEC (μS/cm)WHC (%)Total CTotal NDOCDON N H 4 + N O 2 N O 3 PCaMgSNa
g kg−1mg kg−1
Background Soil6.311851.211.92.582.34.416.160.010.024118912111855
The soil was collected from a certified organic rice field in 2014, air-dried, and passed 2-mm sieve for chemical analysis. EC, electrical conductivity; WHC, field water holding capacity; DOC, dissolved organic C; DON, dissolved organic N.
Table 2. Description of the cover crop biomass and organic rice yield in the 2012–2014 organic rice field trials.
Cover CropCover Crop Seeding Rate (kg ha−1)Cover Crop Fresh Biomass (kg ha−1)Cover Crop Moisture (%)Cover Crop Dry Biomass (kg ha−1)Organic Rice Yield (kg ha−1)
Fallow916,58579.040207312
Clover920,99977.846427443
Ryegrass925,40075.856137292
Table 3. Cover crop properties and soil microbial biomass C:N ratio.
Cover CropCrude Protein
(g kg−1)
Lignin
(g kg−1)
Total C
(g kg−1)
Total N
(g kg−1)
P
(g kg−1)
K
(g kg−1)
Cover Crop Lignin:N RatioCover Crop C:N RatioSoil Microbial Biomass C:N Ratio
Fallow11012034117.63.228.66.81914
Clover1594039825.41.510.81.61627
C7R3 *1304039320.81.813.81.91938
C3R7 *924038514.62.217.72.72643
Ryegrass634038010.02.520.743852
* C7R3, 70% Clover + 30% Ryegrass; C3R7, 30% Clover + 70% Ryegrass.
Table 4. Significance of the interactions and main effects of cover crop (CC) type, cover crop residue application rate, and incubation time on the flush of CO2, soil organic and mineral C and N, pH, and EC.
Cumulative CO2 N H 4 + N O 2 N O 3 TMNDOCDONpHEC
CC Type≤0.001 ***≤0.001 ***0.222≤0.001 ***≤0.001 ***0.010 *≤0.001 ***≤0.001 ***≤0.0001 ****
CC Rate≤0.001 ***≤0.001 ***0.8040.017 *0.001 **≤0.001 ***≤0.001 ***0.005 **≤0.0001 ****
Incubation Time≤0.001 ***≤0.001 ***0.019 *≤0.001 ***0.011 *0.925≤0.001 ***≤0.001 ***≤0.001 ***
CC Type × CC Rate≤0.001 ***≤0.001 ***0.437 0.0530.024 *0.033 *≤0.001 ***≤0.001 ***≤0.001 ***
CC Type × Incubation Time≤0.001 ***≤0.001 ***0.238≤0.001 ***≤0.001 ***0.670 0.450≤0.001 ***0.853
CC Rate × Incubation Time≤0.001 ***≤0.001 ***0.761≤0.001 ***≤0.001 ***0.1430.005 **0.003 **0.005 **
CC Type × CC Rate × Incubation Time≤0.001 ***≤0.001 ***0.694 0.005 **0.040 *0.5640.717 0.003 **0.718
* p ≤ 0.05, ** p ≤ 0.01, *** p ≤ 0.001, and **** p ≤ 0.0001. TMN, total mineral N; DOC, dissolved organic C; DON, dissolved organic N.
Table 5. Carbon (C) and Nitrogen (N) mineralization parameters during the 0–31 day of incubation of soil amended with different cover crop mixtures.
ModelCover CropResidue Application Rate (%)Mineralization Potential (C0, N0) (mg kg−1)Mineralization Rate Constant (kC, kN) (day−1)Initial Potential Mineralization Rate (C0kc, N0kN) (mg kg−1 day−1)Half-Life of Mineralization
(t1/2) (day)
Correlation Coefficient (r)
C Mineralization Model
Cmin = C0 · (1 − exp(−kC · t))
CK042810.040172.917.20.987
Fallow0.690690.1451318.84.80.970
Clover0.684300.1821534.63.80.991
Ryegrass0.686380.1281102.65.50.970
C7R30.692280.1551433.54.50.985
C3R70.692320.1151063.76.00.987
N Mineralization Model
Nmin = N0 · (1 − exp(−kN · t))
CK09110.04036.817.20.993
Fallow0.64770.14569.44.80.985
Clover0.65270.18295.93.80.995
Ryegrass0.62270.12829.05.40.985
C7R30.64860.15575.44.50.992
C3R70.63550.11540.96.00.993
Cmin, C mineralization estimated by CO2 evolution (mg kg−1); Nmin, N mineralization estimated by CO2 evolution/cover crop C:N ratio (mg kg−1); C0, C mineralization potential (mg kg−1); N0, N mineralization potential (mg kg−1); kC, C mineralization rate constant (day−1); kN, N mineralization rate constant (day−1); C0kC initial potential N mineralization rate; N0kN initial potential N mineralization rate; t1/2, time for mineralization of half of C0 or N0; r, the correlation coefficient between model fitted values and observed values.
Publisher’s Note: MDPI stays neutral with regard to jurisdictional claims in published maps and institutional affiliations.

