
Quantification of the Outdoor Thermal Comfort within Different Oases Urban Fabrics
by
 , , and
Mohamed Elhadi Matallah
1,2,3 ,
,
Djamel Alkama
4,
Jacques Teller
3,
Atef Ahriz
5 and
Shady Attia
2,*
1
Laboratory of Design and Modelling of Architectural and Urban Forms and Ambiances (LACOMOFA), Department of Architecture, University of Biskra, Biskra 07000, Algeria
2
Sustainable Building Design (SBD) Lab, Department of UEE, Faculty of Applied Sciences, Université de Liège, 4000 Liège, Belgium
3
Local Environment Management and Analysis (LEMA) Lab, Department of UEE, Faculty of Applied Sciences, Université de Liège, 4000 Liège, Belgium
4
Department of Architecture, University of Guelma, Guelma 24000, Algeria
5
Department of Architecture, University of Tebessa, Constantine road, Tebessa 12000, Algeria
*
Author to whom correspondence should be addressed.
Sustainability 2021, 13(6), 3051; https://doi.org/10.3390/su13063051
Submission received: 28 January 2021
/
Revised: 27 February 2021
/
Accepted: 5 March 2021
/
Published: 10 March 2021
(This article belongs to the Collection Adaptive Cities: Urban Planning and Design Contribution for Achieving Climate Resilient Cities)
Abstract
:Oases settlements are common entities of human agglomerations throughout desert regions. Oases settlements face several environmental challenges such as climate change, which can render them insufferably hot and unlivable within decades. Therefore, this study aims to assess the outdoor thermal comfort variation within three different oases urban fabrics of Tolga Oases Complex in Algeria. The overarching aim is to quantify thermal comfort and guide landscape, and urban designers improve outdoor thermal comfort. The methodology relies on microclimatic measurements and weather datasets (TMY2, TMY3, TMYx), combining observations and numerical simulations. A total of 648 Physiological Equivalent Temperature (PET) values were calculated in three different urban fabrics in Tolga Oases Complex, Algeria. Between 2003 and 2017, a remarkable microclimatic change was found, causing a high and accelerated heat stress level of 76%. The study results inform architects, urban planners and climatologists about climate change effects and urban sprawl impact on the oases lands. Moreover, urban strategies should seek mitigation and adaptation benefiting from the existing green infrastructure of palm groves.
1. Introduction
Urbanization in desert regions and the Sahara region faces many challenges regarding people’s livelihood and well-being. Oases settlements have evolved historically representing a combination between physical human settlements and cultivated land in the desert environment) [1]. For centuries, the urban design strategies were adapted to the local conditions found in the vernacular and traditional architecture [2]. The link between the cultivated areas, which are palm grove areas mostly, and the built areas was often respected throughout the Sahara’s Region of North Africa, and represents an inspirational model of the thermal adaptation [3]. Thermal adaptation is an urban design principle that allows a suitable microclimate for occupants, especially during the hot season. Thermal adaptation involves shading strategies, natural ventilation strategies, and local building materials, which help people adapt their behavior and comfort expectations depending on the season [2]. The new generation of urban patterns has seen different modern forms mostly built without respecting the climatic context. However, as the planet warms, these regions face enormous challenges, including rapid urbanization and climate change. In parallel, oases settlements suffered during the last thirty years poor urban design and climate adaptation. In oases, temperatures reach more than 50 °C in summers, which is a cause of stressful discomfort during hot seasons [4]. The outdoor thermal comfort in oases settlements has shown an elevation in heat stress in most urban areas that limits the livability, particularly during the hot season. Therefore, this study investigates the outdoor thermal comfort in three different neighborhoods in Tolga Oases Complex. Tolga Oases Complex is one of the most significant oases settlements in North Africa that has been surrounded by over 1,000,000 palm trees [5]. The research questions corresponding to the research objectives are:
- What are the various levels of outdoor thermal comfort in oases settlements in summer in the long-term?
- How severe is the impact of climate change on the outdoor thermal comfort during summer?
- How can the urban fabric design be adapted to mitigate high heat stress levels in Tolga oases settlements?
Thus, this study aims to promote a comparative approach by assessing the outdoor thermal comfort during a thirty-year period based on real-time observations. The paper adopts a combined methodology of empirical and numerical techniques. The current study’s objectives are to quantify outdoor thermal comfort inside the oases settlements following an empirical approach; to assess the long-term heat stress variation in different oases urban forms.
2. Literature Review
The importance of outdoor thermal comfort studies is growing as the planet warms and summers become longer and less bearable. Heatwaves are coming to represent an existential threat to oases settlements. Our literature review included over 120 publications, found on Scopus and the Web of Science, relevant to outdoor thermal comfort and the urban heat island (UHI) effect. However, we selected the most relevant publications and classified them using two main categories described in the following paragraphs.
The first group of studies characterize the urban heat island effects and their impact on the thermal comfort based on field observations. They aim to inform urban and landscape designers through recommendations to reimagine, redesign and rebuild urban environments. For example, Potchter et al. [6] investigated the urban warming elevation in the desert city of Beer Sheva (Israel) for forty years, by combining two phenomena—the urban warming and global warming effects using both of Physiological Equivalent Temperature (PET) and Discomfort index (DI) indices to conclude on a noticeable impact during daytime in the summer season. Johansson et al. [7] investigated the outdoor thermal comfort in the summer season using the PET index in Fez, Morocco. They selected several urban forms classified into old neighborhood and new neighborhood. Results show that the deep street canyons are relatively comfortable, whereas the shallow canyons are extremely uncomfortable. Bourbia and Awbi. [8,9] focused on finding the interaction between urban canyon geometry and incident solar radiation in the city of El-Oued, Algeria. Their study showed that the street canyon orientation (and not only the H/W ratio) has a considerable effect on solar shading and urban microclimate, in another investigation area. In another context, Jamei et al. [10] did a review study on the impact of urban geometry and pedestrian level greening on the outdoor thermal comfort for different climate zones. The review analyzed various data including simulation results and field measurements studies.
Berardi et al. [11] in Toronto, Canada, investigated how new constructions will affect the urban microclimate and propose strategies to mitigate possible UHI effects, following empirical approaches and the numerical model ENVI-met. Shanshan et al. [12] did an experimental study focusing on the impact of urban morphology on the urban heat island (UHI) intensity and microclimate conditions and thermal comfort in a newly developed metropolitan area in Tianjin city, China. In addition, Bao-Jie He and al. [13] investigated the relationships between urban morphology and precinct ventilation performance in coastal Sydney, Australia, and their influence on the UHI and the outdoor thermal comfort on the basis of PET index. In the study conducted by Darbani et al. [14], researchers sought to discover the impact of urban forms’ multi-characteristics such as H/W ratio, street orientation, tree canopy cover, and building materials on the pedestrian outdoor thermal comfort arid climate of the city of Mashhad in Iran. This last study is based on simulation with ENVI-met software, and Arcmap to calculate the (UHI) in Mashhad city. On the other hand, the study of Ahmed Mahmoud et al. [15] demonstrated variations in PET index values due to the difference in sky view factor (SVF) through a park in a hot and dry Cairo climate Egypt. Similarly, Venhari et al. [16] presented a significant correlation between SVF and variations in PET and Mean Radiant Temperature (Tmrt) in an arid climate. The study showed urban street greenery type and arrangements on thermal comfort and heat stress in summer. Furthermore, He and al. [17] investigated the cooling effect of the sea breeze in Sydney, Australia, on the outdoor thermal environment within an open space. Results indicate the large potential cooling of wind and its influence on the outdoor thermal quality. Middel et al. [18] highlighted the importance of active solar access and shading management in hot urban areas to reduce thermal stress. However, Balogun et al. [19] investigated the outdoor thermal comfort condition of Akure city, Nigeria, where four locations in the town (Airport, Ijapo, Alagbaka, and Oja Oba) with varying urban settings were assessed. Karakounos et al. [20] emphasized mitigation techniques in a dense urban environment affect microclimate parameters and outdoor thermal comfort in Greece. For thermal comfort ranges, studies of Cohen et al. [21] and Elnabawi et al. [22] showed ranges of 17 °C and 26 °C (arid climate) and 23 °C and 32 °C, respectively, for PET index comfort zone. Otherwise, in the Algerian studies, Boukhabla et al. [23] evaluated the heat flow exchanged between the soil, with two different types (soil in concrete and soil in asphalt), and the urban environment on a street of open shape in Biskra city, Algeria. Masmoudi and Mazouz. [24] showed that the thermal regulation of the urban microclimate in hot and dry climate areas is possible by judicious choices of the orientation of the place, space form, size, provision, and importance of the vegetable masses.
The second group of studies mainly focuses on microclimatic models and software used on an urban scale to assess thermal comfort levels and provide designers’ recommendations. Despite the advancement of worldwide numerical models [25], two software programs have been selected: ENVI-met [26,27], and RayMan [28,29] which identify the most relevant models in urban climate numerical design. Tsoka et al. [30] ensured that ENVI-met model is one of the most widely employed dynamic simulation tools. This study aimed to perform a meta-analysis of the reported evaluation results, reflecting the model’s ability to calculate microclimatic variables accurately. Thus, Sharmin et al. [31] conducted their study to show the variation in microclimatic conditions of a tropical warm-humid context in Dhaka, Bangladesh, inside several urban geometries (traditional and new geometries) and aimed to make a specific comparison between measured and simulated data by using ENVI-met software. Among the most relevant similar topic studies in Algeria was the work of Ali-Toudert and Meyer [32]. An investigation of the microclimatic changes within urban environments in a high spatial and temporal resolution in the hot and dry climate of Ghardaia, Algeria, is based on the three-dimensional model by ENVI-met (the outdoor thermal comfort was assessed with PET index). Another study of Sadoudi et al. [33] investigated the impact of a green area’s spatial configuration on the cooling effect, using 25 idealized design scenarios simulated in ENVI-met and RayMan.
Similarly, Qunshan et al. [34] simulated a real neighborhood with current tree arrangement in ENVI-met. They validated the reliability of ENVI-met models by comparing the simulated results with systematic temperature collection transects. Deng and Wong [35] showed the level of influence of the canyon aspect ratio and the outdoor thermal comfort orientation by using ENVI-met software. The study of Berkovic et al. [36] investigated thermal comfort in an enclosed courtyard numerically using a three-dimensional prognostic microclimate model. Furthermore, studies conducted by Ambrosini et al. [37] and Acero et al. [38] searched on the possibility of the formation of a UHI and its magnitude through a small city context. Among those studies that followed a modeling approach are some local studies in Algeria. Boukhabla and Alkama. [39] tried to determine the real impact of vegetation on air temperature in Biskra city based on newly developed ENVI-met. Boukhelkhal and Bourbia [40] discussed and assessed the effect of the geometry and shade trees on the open spaces in Ghardaia (hot and dry climate) using a numerical model: ENVI-met. Furthermore, Kedissa et al. [41] aimed to evaluate the impact of the urban geometry configurations on outdoor comfort levels in Constantine city, Algeria. The study was performed basically on ENVI-met 3.1, TownScope 3.1 software, and RayMan 1.2 models.
However, none of the previous studies assessed the overall outdoor urban comfort in oases urban settlements for a long-term period. Most of the abovementioned studies had short running simulation time, which affects the validity and accuracy.
3. Methodology
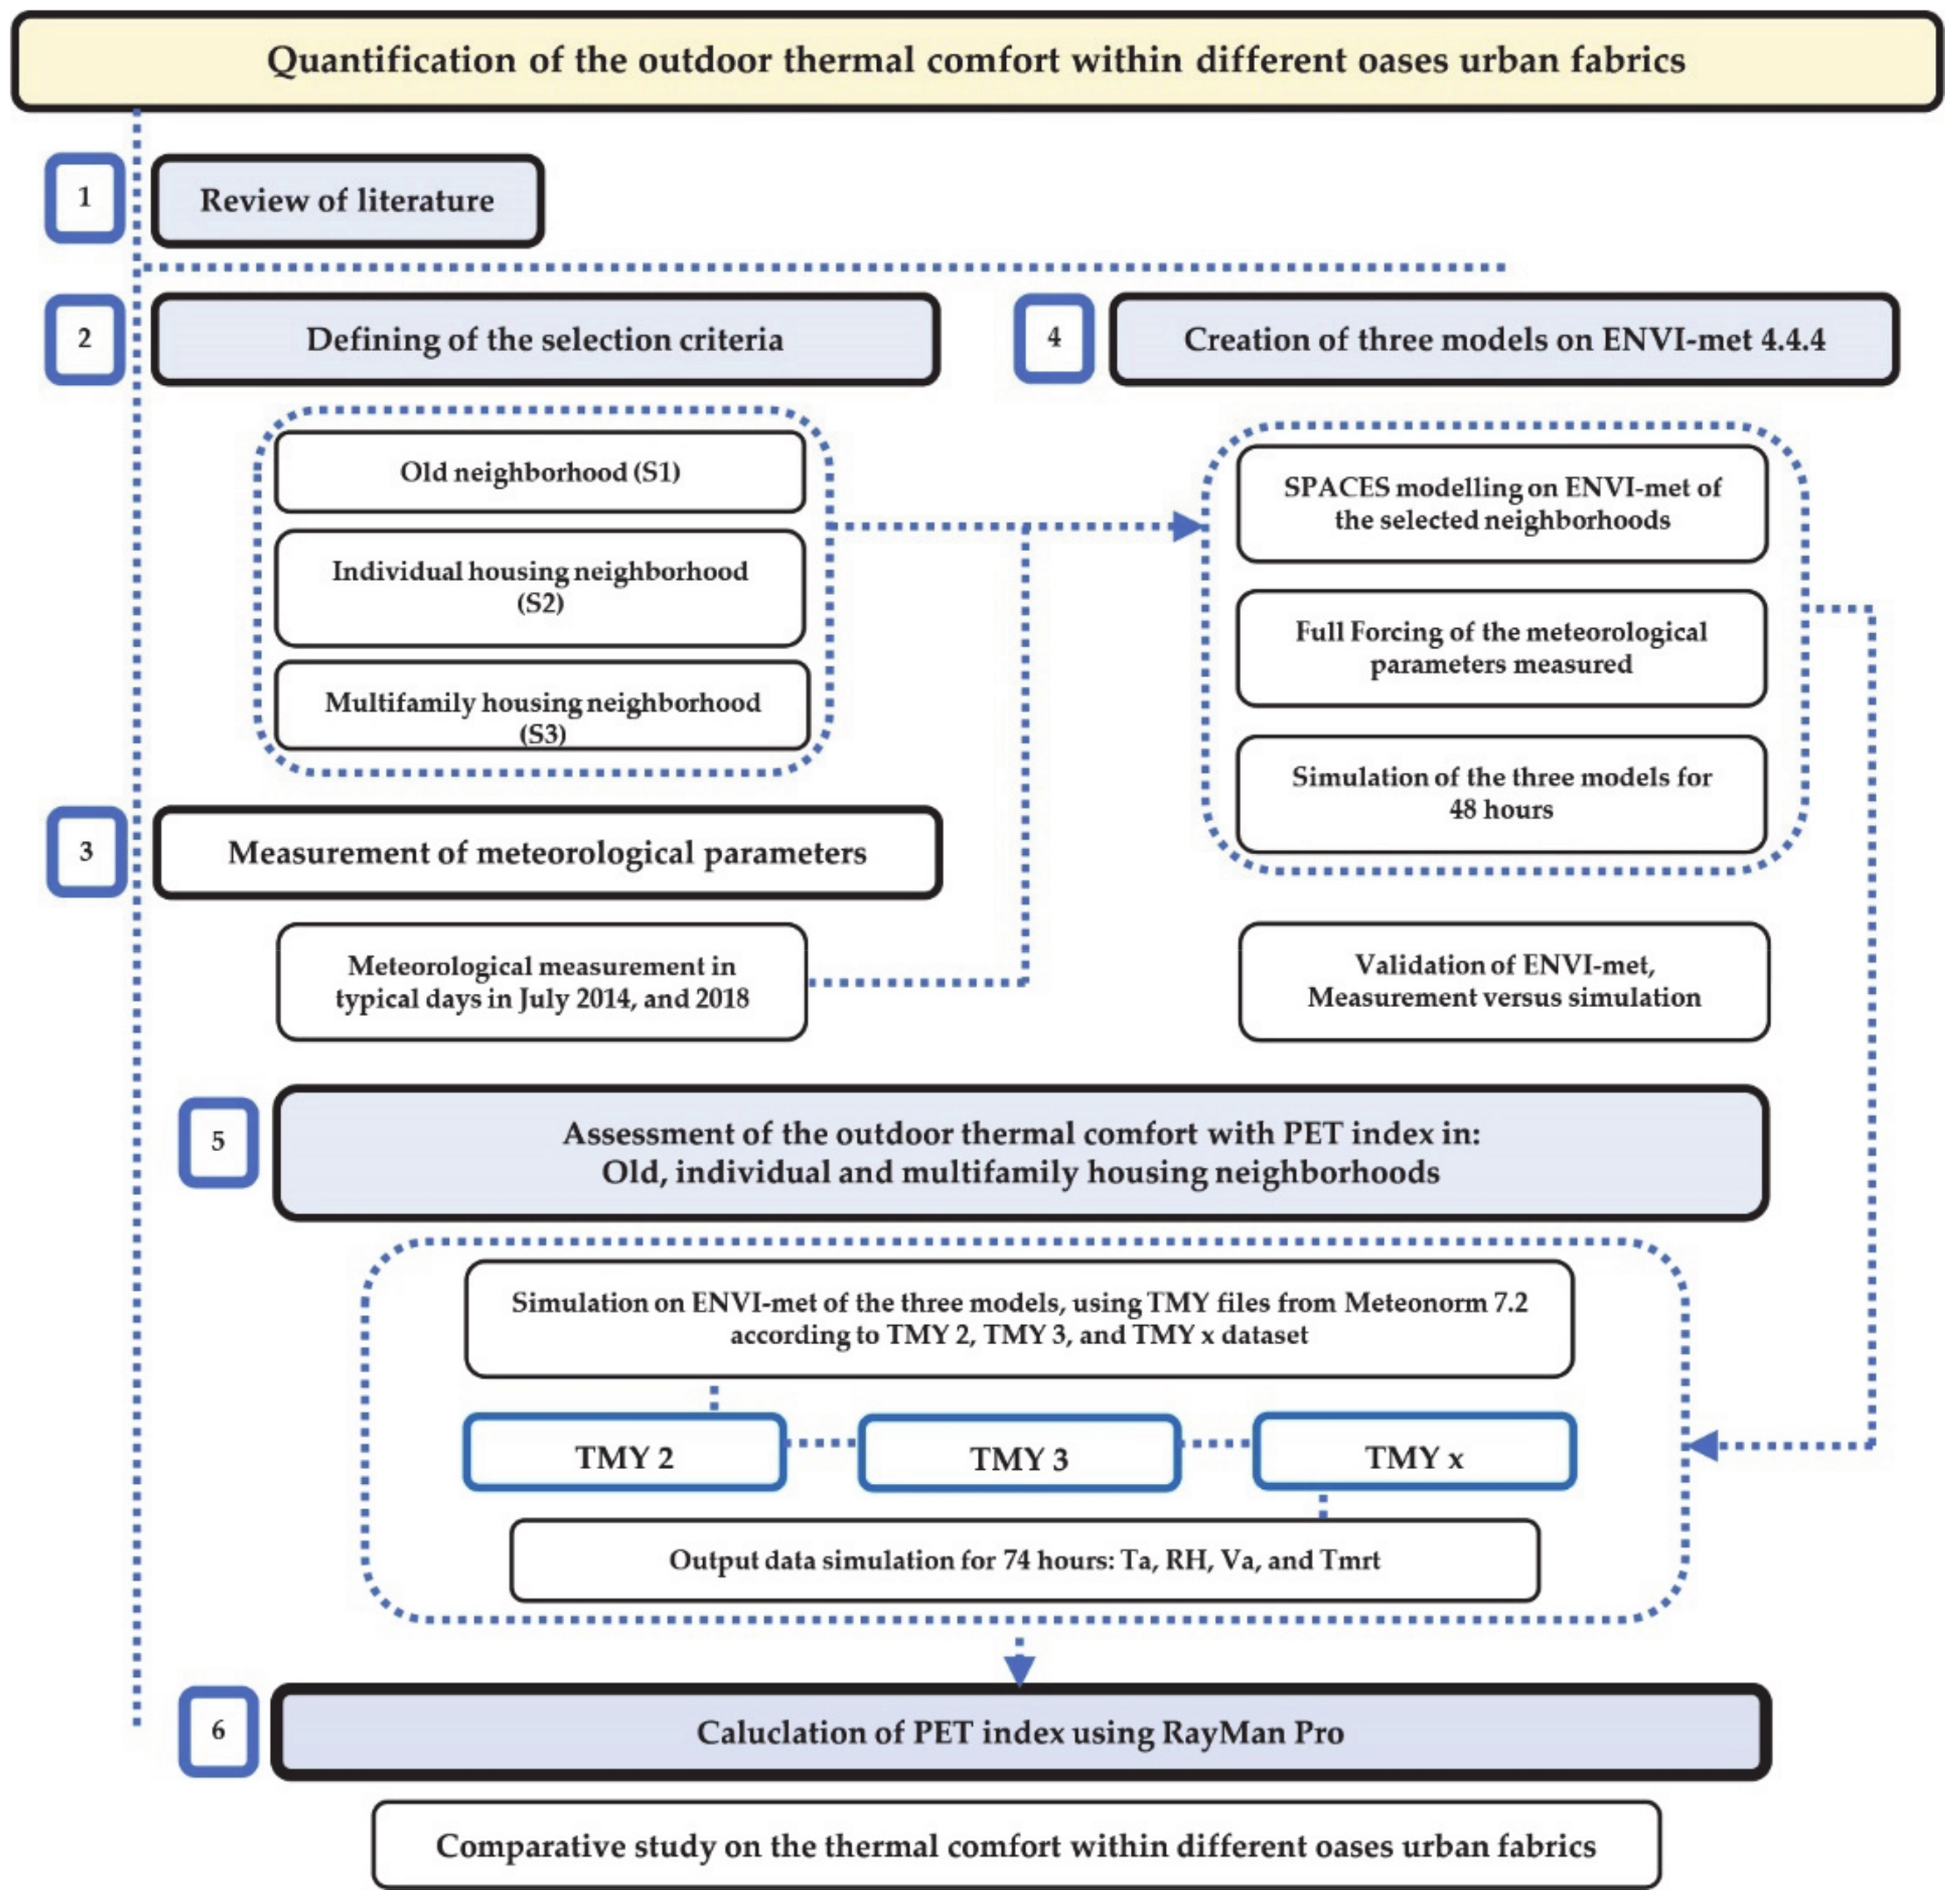
In this section, we present the research methodology, including the study conceptual framework. Our research methodology combines an observational approach based on field measurements and a modeling approach to assess the outdoor thermal comfort. We developed a study conceptual framework that summarizes and visualizes our research methodology, as shown in Figure 1.
3.1. Review of Literature
The literature review included recent and relevant publications that assess outdoor thermal comfort based on simulation worldwide. However, to narrow and concentrate our study’s scope, we divided the publications under two categories: (1) urban warming and outdoor thermal comfort in hot climate; (2) thermal comfort numerical assessment.
3.2. Defining of the Selection Criteria
3.2.1. Case Study
The study is conducted in Tolga city (34°43′00″ N and 5°23′00″ E), in Biskra region [42], and 363 km the south-east of the capital Algiers (Figure 2); it represents the most significant Tolga Oasis Complex territory in Algeria [43]. The Oasis Complex is composed of 6 oases cities polarized by Tolga city, which presents the biggest urban area of the Oasis Complex. The study area has a hot arid climate (Köppen-Geiger BWh) with a variation between summer and winter temperatures. Since 1995, Tolga Oasis Complex has registered significantly less rainfall quantity with a yearly average of 126 mm (Figure 3). According to the meteorological station WMO 605265, the heating degree days estimated during the last five years (2016–2020) were 293 HDD. However the cooling degree days were greater with 1113 CDD. Otherwise, the highest temperature registered during the last decade is 46 °C in July, when the lowest is 3.0 °C in January [5]. These last weather data indicate the climactic nature of the territory, which is hot and arid. Furthermore, Tolga Oasis Complex’s population reached 150,036 in 2017, where 50% of the total population is concentrated in the Tolga city area. Since 1987, Tolga city demography has been growing five times more than the surrounding cities’ communes, reflecting the attractiveness of the living facilities provided in the city. Additionally, the Oasis Complex’s urban landscape shows a strong integration into the rural world and the urban area’s attachment to the Palm Grove [44]. Overall, Tolga Oasis Complex (Appendix A) is surrounded by 1,006,600 palm trees, “Phoenix Dactylifera” where 31% of them are situated in Tolga city land’s limit.
3.2.2. Selection Criteria
In this research, three urban fabrics are selected to be assessed in terms of outdoor thermal comfort in Algeria’s dry climate. The investigated urban fabrics are chosen from Tolga Oasis Settlements and represent three different typologies of housing: Old neighborhood (S1), Individual Housing neighborhood (S2), and Multifamily Housing neighborhood (S3) (Figure 4). We named the selected neighborhoods by sites (S) to describe the three numerical models in the second methodology step. The selection criteria were explicitly based on: (i) age of the urban fabric “built-up history”, (ii) urban fabric typology, and (iii) urban geometry characteristics (Table 1).
- Old neighborhood (S1):
As first sight, the old neighborhood (S1) is an ancient settlement built before 1900, representing the first urban fabric in Tolga Oasis Complex. Moreover, (S1) is characterized by a compact built environment, high density: 82% of built-up occupancy, winding street pattern (<4 m) and variable building height: 3 m < H < 7.10 m (Table 1). The (S1) is located inside the Palm Grove area, surrounded by palm trees “Phoenix Dactylifera”.
- 2.
- Individual Housing neighborhood (S2):
The individual housing neighborhood (S2) is situated inside the new Tolga downtown, it has a regular geometry with an arranged and narrow street with variable widths: 3.60 m < W < 3.90 m, mean density: 60%, and a uniform building height: H = 6.40 m (Table 1).
- 3.
- Multifamily Housing neighborhood (S3):
The multifamily housing neighborhood (S3) is also located in the new Tolga downtown. It has a typical geometry with separated blocs, endowed uniform height: H = 12.50 m ranging to four stories, with low compacity, and a very low density of built-up occupancy: 18% (Table 1).
The three selected oases urban fabrics comprise several residential buildings. The old neighborhood (S1) comprises ancient and unplanned settlements, while it was entirely rebuilt by its inhabitants after 1990. The new oases settlements (S2) and (S3), in Tolga new downtown represent a planned urban settlement, representing the most common models of the Algerian authorities’ programs on the residential sector. The multifamily housing typology represents 51% of the residential sector, while individual housing accounts for 49% of Algeria’s residential sector [45].
Overall, it is remarkable that throughout the individual and the multifamily housing neighborhoods the urban vegetation arrangements are missing. We can only observe small green surfaces, grass, and a few trees such as ’Ficus rubiginosa‘ which are spontaneously implanted. Otherwise, the three neighborhoods contain practically the same number of houses with 150 dwellings. The three selected neighborhoods include several residential individual buildings. Dimensions in (S1) are variable from one house to another, however in (S2) and (S3), the house dimensions are similar to a typical architecture design.
In the study case, it is necessary to indicate that the distance between neighborhoods and Palm Grove is essential. (S1) is considered the closest to the Palm Grove with a distance (<100 m), while the (S2) and (S3) are further (>1000 m) [5].
After the selection of the study sites, we followed several steps to quantify the outdoor thermal comfort:
- Measurement of meteorological parameters in the selected sites.
- Creation of the sites numerical models using ENVI-met software (https://www.envi-met.com/ accessed on 24 April 2020) [46].
- Validation of the numerical models based on measured parameters through: (1) mean bias error (MBE) and (2) root-mean-square error (RMSE) [47].
- Simulation of the main microclimatic parameters for quantifying the outdoor thermal comfort through the PET index.
- Calculation of PET index using RayMan model based on the simulated data.
3.2.3. Measurement of Meteorological Parameters
Several microclimatic parameters were monitored simultaneously; fish-eye images were gathered within the three neighborhoods to quantify the outdoor thermal comfort. Overall, nine points were selected for the measurements according to their SVF variations (Table 1):
- (a)
- Old neighborhood (S1): (1, 2, 3).
- (b)
- Individual Housing neighborhood (S2): (4, 5, 6).
- (c)
- Multifamily Housing neighborhood (S3): (7, 8, 9).
In this case study, it was necessary to multiply the number of measured points to see the correlation between SVF and outdoor thermal comfort variations [16].
Furthermore, meteorological measurements were conducted for two days in (15th, 16th) July 2014, and four days in (25th, 26th, 28th, and 29th) July 2018. The field measurements included: air temperature (Ta), relative humidity (RH), wind velocity (Va), which were taken during 48 h [48]. Otherwise, measurements were taken at a 1.4 m height and at least 1 m distant from the nearby buildings in the street to avoid data distortion due to the radiation from the soil and walls [32]. Table 2 lists the name, the range, and accuracy used in the study monitoring (Table 2) [49].
3.2.4. Creation of the Three Models on ENVI-met 4.4.4
ENVI-met software has a CFD microclimatic model designed to simulate the interactions between building, pavement, and natural surfaces in a virtual environment by reproducing the major atmospheric process [26,27]. The generated output contains the main four thermal comfort parameters: air temperature, relative humidity, air velocity, and mean radiant temperature [50]; it is based on a sequence of mathematical calculations established by the laws of fluid dynamics and thermodynamics which govern the atmospheric motions. It is a non-hydrostatic RANS model with a typical horizontal resolution from 0.5 to 10 m, a time frame of 24–48 h, and a time-step of 1–5 s [50]. Moreover, the high resolution helps identify pedestrian comfort issues and interactions between individual buildings, surfaces, and plants. As far as mathematical computation is concerned, it is very complicated to carry out a full three-dimensional calculation of a large urban area [51].
ENVI-met is adopting a holistic approach to compute fine details at an urban scale; it is not surprising that the computation time and computer power are substantial. Although ENVI-met has one of the highest spatial resolutions available for microclimatic modeling, a compromise must be made to reduce the computation time. Consequently, even with reasonably high resolution like 2 m × 2 m, many detailed morphological aspects are disregarded which has significant consequences on solar exposure and affects the radiation budget [31]. Additionally, and despite such limitations, ENVI-met is a reputable model widely validated and used for urban microclimate assessment; It is the only model with the features and capabilities necessary for the study at hand. Otherwise, the calculation of Tmrt by ENVI-met considers the direct and diffuse short-wave irradiances and the long-wave radiation fluxes originating from the ground, building surfaces, and the free atmosphere [52]. Accordingly, the ENVI-met model is one of the most suitable software programs for microclimate simulations and the outdoor thermal comfort assessment.
- (a)
- SPACES modeling on ENVI-met of all the selected sites:
By using the SPACES configuration in ENVI-met, the three studied sites were modeled. The 2D drawings were done based on existing plans on bmp formats. All the geographic coordinates and the northern orientation degree were added in the Edit area interface (Table 3). Additionally, building materials, vegetation, and soil were chosen according to the existing materials (Table 3).
- (b)
- Full forcing of the meteorological parameters measured:
Regarding the microclimatic parameters, our simulations were set in two periods according to the measured data days: (S1), (S2) on 25th/26th, and 28th/29th July 2018, respectively, and (S3) on 15th/16th July 2014.
The meteorological data were used based on CSV files according to WMO 605265 dataset and entered on the full forcing manager settings on ENVI-met. We should indicate that CSV data files contained all meteorological parameters measured in sites. However, Tmrt is taken from the simulation results.
- (c)
- Validation of ENVI-met, Measurement versus simulation:
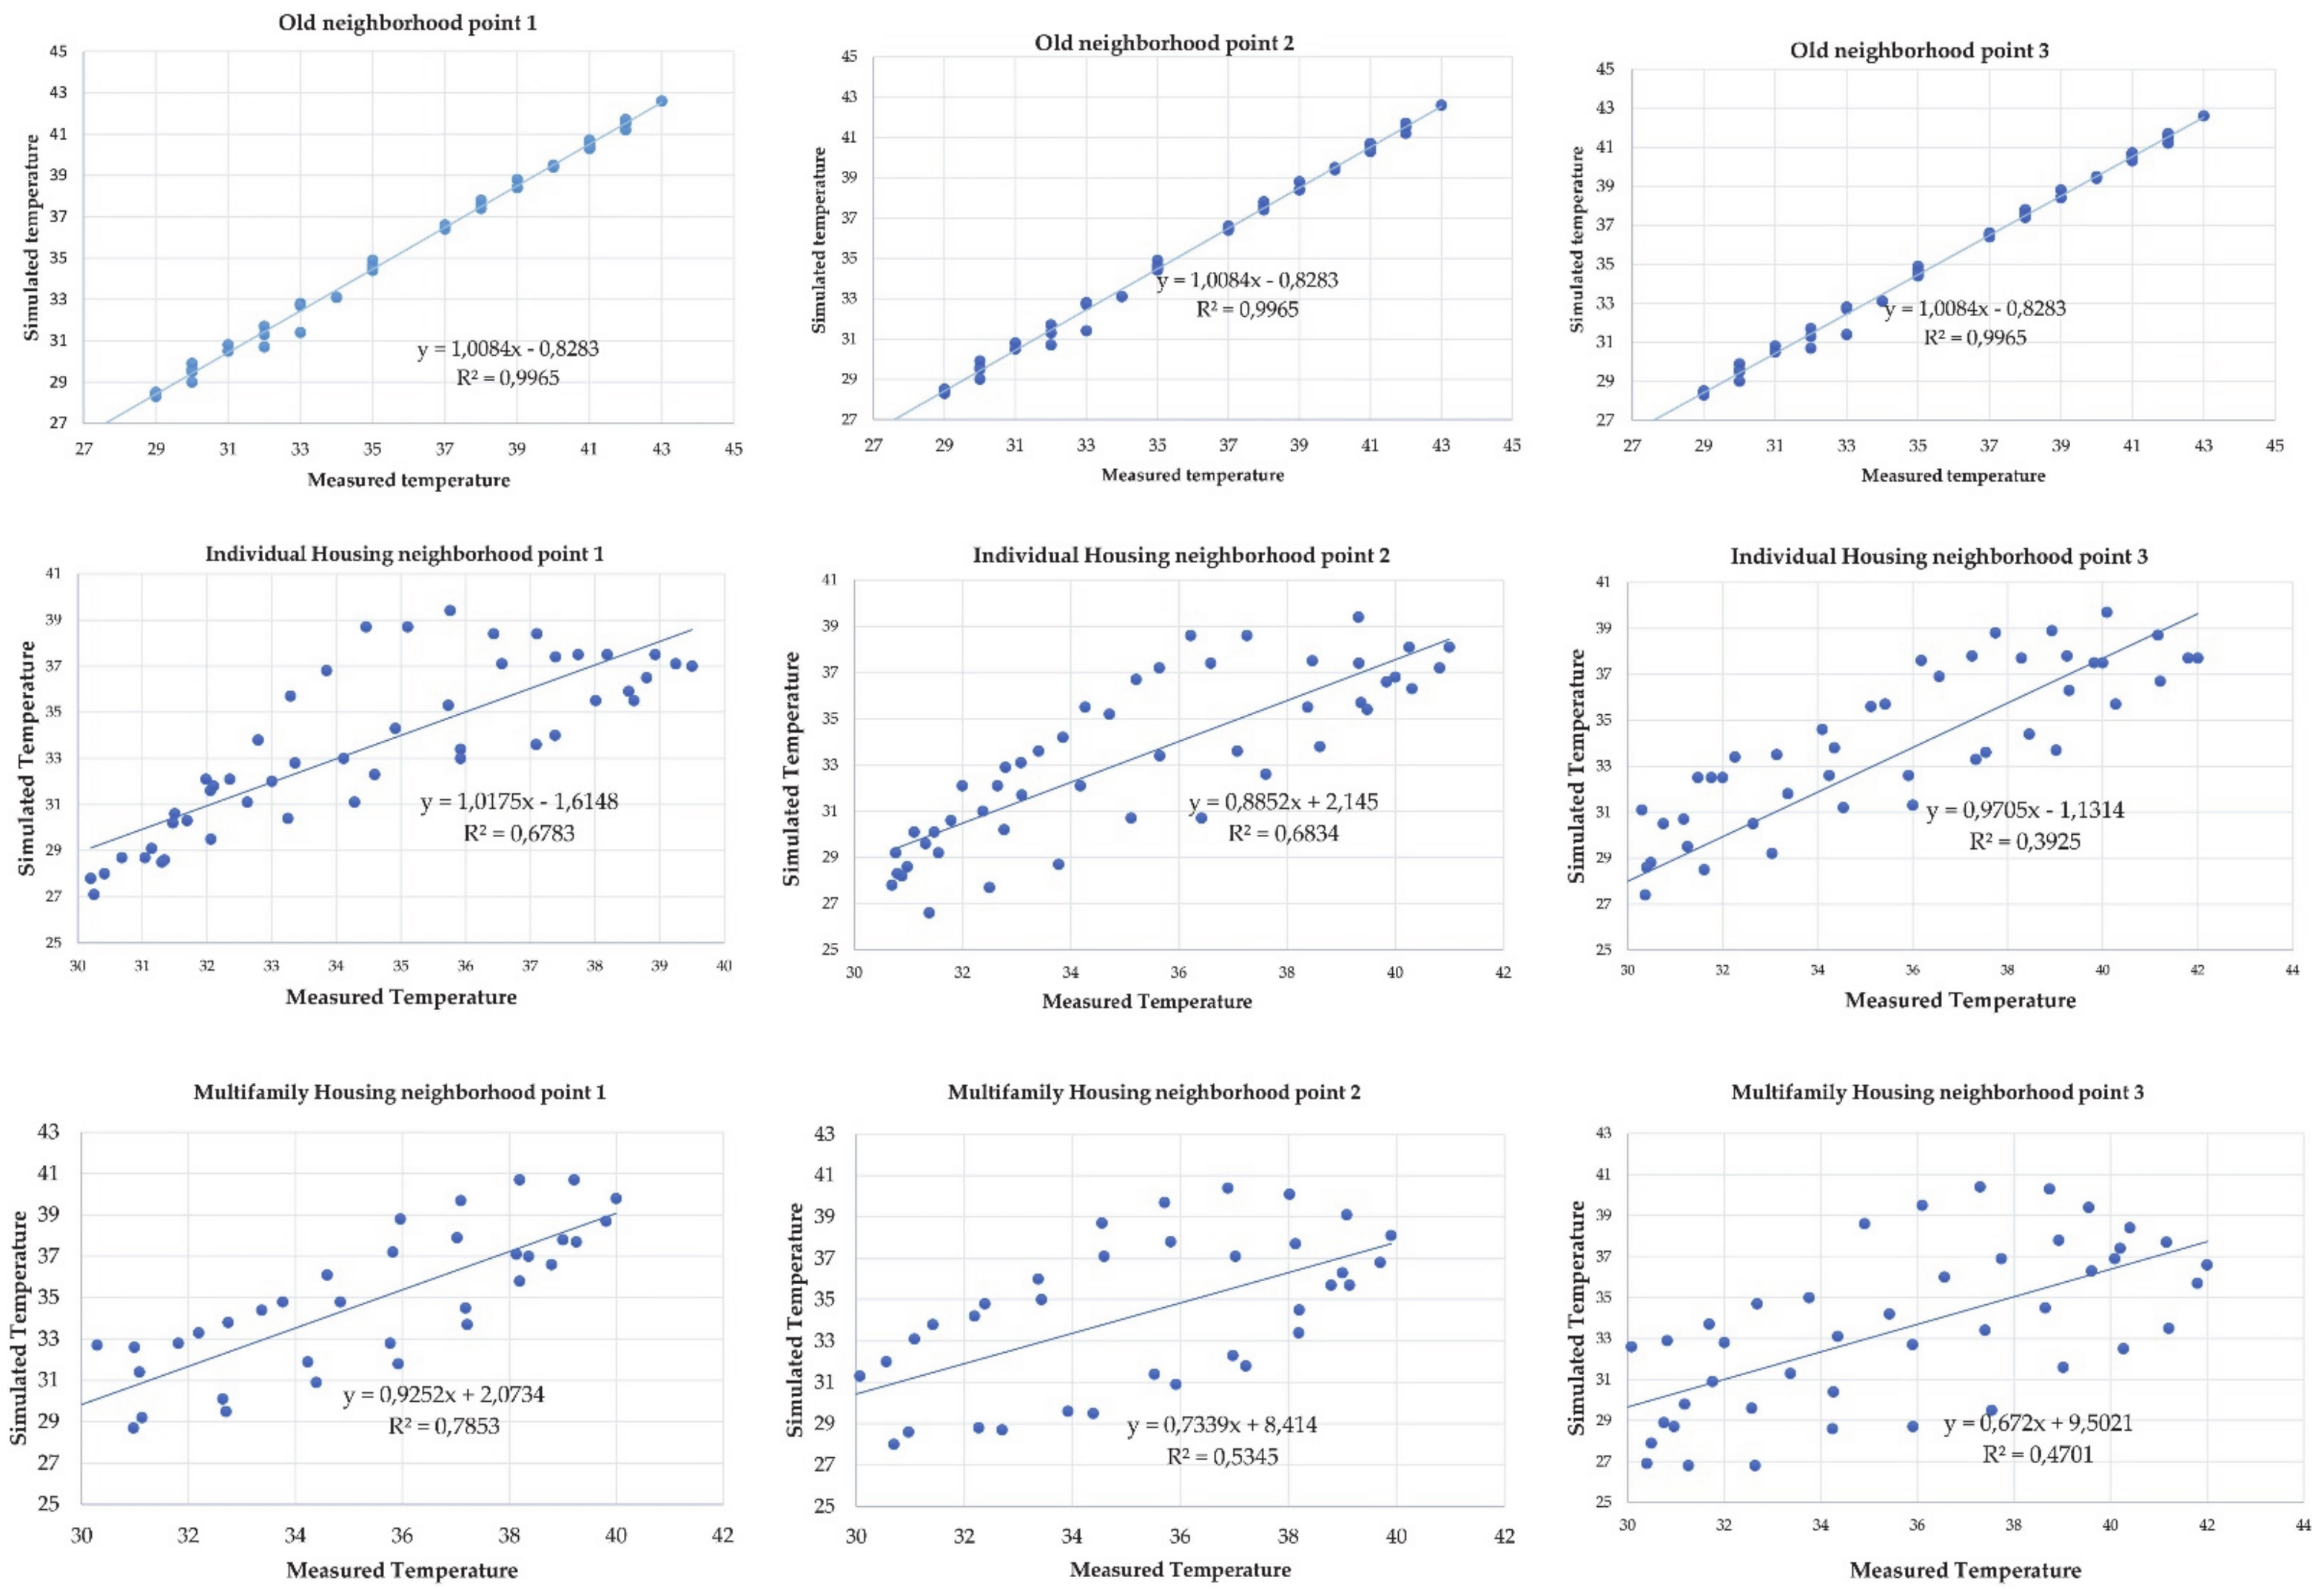
The accuracy of the ENVI-met model simulation was validated through a comparison between the measured and simulated data. This step focused on how close the simulated data are to the measured data. The validation is an essential step to create a reliable numerical model. To validate the neighborhood’s models, we followed ASHRAE 14 guidelines, using two indices: (1) mean bias error (MBE) and (2) root-mean-square error (RMSE) [47]. The MBE is a nondimensional measure of the overall bias error between the measured and simulated data with a known time resolution. The (RMSE) indicates how well the simulation model describes the variability in the measured data [53]. Moreover, for the validation step, simulation was run for 48 h because we considered this a sufficient duration for the model’s validation (Figure 5) and (Table 4).
where Sim and Obs are the simulated and observed (measured) data, and n is the number of the data values used for the calculation.
According to ASHRAE Guideline 14, the simulation model is considered validated if:
The hourly (MBE) values are within ±10%, and hourly (RMSE) values are below 30%.
We should indicate that only a few studies validated their numerical models. However, the same studies validated only 20 h [31] and 28 h [50]. In our study, we followed the studies of Sadoudi et al. [33] and Hien et al. [54] in which the validation was done with 48 h simulation running. For their models’ validation, all these studies used only the air temperature for the comparison between the simulated and measured data.
Notably, it appears that the accuracy of simulated data is shown after the first four hours, so the ENVI-met team recommends displaying the simulation time to have accurate results.
3.2.5. Assessment of the Outdoor Thermal Comfort with PET Index
- (a)
- Simulation on ENVI-met of three models, using EPW data according to TMY2, TMY3 and TMYx files:
We simulate the three models based on the Typical Meteorological Year (TMY) files with Epw format: TMY2 (1981–1990), TMY3 (1991–2005) taken from Meteonorm 7.2 database (https://meteonorm.com/en/ accessed on 20 August 2020) [55], and TMYx (2003–2017) (Figure 6). The last meteorological file is taken from http://climate.onebuilding.org/ (accessed on 20 August 2020) [56], which is validated by the study of Semahi et al. [53] and shows a high-quality.
- (b)
- Output data simulation for 74 h: Ta. RH. Va. Tmrt:
Secondly, simulation running time covered 74 h, the equivalent of three respective days of assessment. In this step, we carried four principal parameters of outdoor thermal comfort: air temperature, relative humidity, air velocity, and the mean radiant temperature; all the values are reported in Matallah et al. Study Report [48]. Thus, the assessment of outdoor thermal comfort in the three models is based on the PET, one of the most common indices used to assess the urban scale’s thermal comfort [57].
- (c)
- Calculation of PET index using RayMan Pro:
Thirdly, the PET index calculation is done with RayMan Pro 3.1 Beta Software, which essentially needs the four microclimatic parameters. RayMan Pro 3.1 Software is a micro-scale model developed for environmental meteorology [28,29]. In our study, it is used to calculate the Physiologically Equivalent Temperature (PET) as a thermal comfort index at the nine studied points. Furthermore, GIMP 2.10 (GNU Image Manipulation Program) is developed for image manipulation and used to process the fish-eye images modeled on a square shape [28,29].
All the meteorological parameters and fish-eye images are inputted in RayMan model to calculate PET and SVF values. Simultaneously to the meteorological measurements and fish-eye images, other geographical data are used in this study such as: “longitude (°E) 5°23′, the latitude (°N) 34°43′, the altitude (m) 147, and the time zone (UTC + h) 1.0.
4. Results
As explained, the three models were simulated for three consecutive days during (15th, 16th, and 17th) July in three different periods: TMY2 (1986), TMY3 (2001), and TMYx (2016). In this section, all PET maximums, minimums, and averages are reported through the total values of PET [48]; otherwise, only the 15th July is demonstrated in the summary of the results.
Initially, TMY2: Table 5 shows the variation of PET values balanced between a minimum PETmin = 17.2 °C carried in S1, and maximum PETmax = 47.2 °C carried in S2. Furthermore, the PET average value within the three sites is equal to PETave = 29.4 °C.
Secondly, TMY3: Table 6 shows the PET values balanced between a minimum PETmin = 17.3 °C carried in S1, and maximum PETmax = 50.5 °C carried in S3, while the PET average value between the three sites is equal to PETave = 30.5 °C.
Thirdly, TMYx: Table 7 shows an increase in PET values balanced between a minimum PETmin = 21.5 °C, and maximum PETmax = 59.7 °C in S1. Otherwise, the PET average value taken in the three sites is equal to PETave = 36.0 °C.
In summary, between 1986 and 2016, the PETmin values were founded in point 2 (S1); however, PETmax values were established in point 7 (S3). The PET index ranges obtained between 1986 and 2016 show an increase of (+5.8 °C) in S1, (+6.7 °C) in S2, and (+7.2 °C) in S3, with a difference reaching 1.4 °C between S1 and S3. Thus, the growth of the thermal stress zone is more remarkable in TMYx within the three sites. From a holistic reading of Table 5, Table 6 and Table 7, we found that S2 and S3 showed the same microclimatic changes, unlike S1 that showed comparatively different modifications.
Otherwise, the PET index examination during July (long-term 1986–2016) showed a variation in the diurnal and nocturnal stress levels: neutral, slightly warm, warm, hot, and very hot. Firstly, PET averages show that in the long-term, in July, which represents the hottest period of the year, the thermal stress assessment was always in the warm thermal zone. The neutral zone generally occupied the nocturnal daytime hours; in contrast, the stress thermal zone occupied practically all the daylight hours. The neutral zone represented an average of 46% and 43%, respectively, in 1986 and 2001, equal to 10 h of daytime, and has mostly occurred after the sunset to sunrise, decreasing to 24% in 2016, equal to 7 h of daytime between 0:00 a.m. and 6:00 a.m. (Table 5, Table 6 and Table 7). Moreover, the daytime thermal stress duration includes four levels: slightly warm, warm, hot, and very hot, showed averages higher than neutral zone with values: 54 % in 1986, 57% in 2001 equal to 14 h of daytime. Thus, 2016 represents 76%, equal to 17 h of daytime (Table 5, Table 6 and Table 7).
In the long-term from 1986 to 2016, the neutral zone within the three sites decreased from 46% to 24%, i.e., 10 h to 7 h of daytime. However, the very hot zone increased from 11% to 34%, i.e., three hours to 8 h of daytime. Therefore, the most increasing thermal stress zone was found in S3 with 79% in 2016 versus 72% in S1; this last result represents the minimum percentages during the three periods. (Table 5, Table 6 and Table 7).
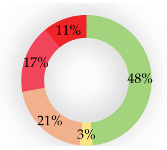
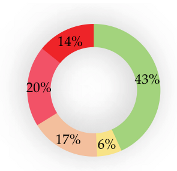
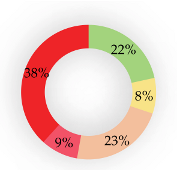
For TMY2 period, the results show that about half of the summer season is under the thermal neutral zone with close results of 48% and 47% in S2 and S3, respectively, while S1 is slightly less with 44%. The very hot zone represents an average of 10%, with a minimum of 9% at the S1 and 12% as a maximum in the S3 (Table 8). For the TMY3 period, the results also show that about half of the summer season is under the thermal neutral zone, with similar results for the three sites with 43%. The very hot zone is slightly increasing around 13%, with a minimum of 10% at the S1 and 16% as a maximum in the S3 (Table 8). Finally, for the TMYx period, the results show that only 25% as average of the summer season is under the thermal neutral zone with a minimum of 21% in S3 and 28% as a maximum in S1. The very hot zone became more important, with an average of 34% where we found a minimum of 31% in S1 and 38% as a maximum in S2 (Table 8).
In another analysis, we found that the neutral zone was major in the TMY2 period with an average of 46%, slightly decreasing in TMY3, giving a similar value in all sites with an average of 43%. However, at TMYx, results show a remarkable decrease in the neutral zone with more than 50% of its precedent value to be at a level of 24% as average. Additionally, in the long-term, we found that the very hot zone was the smallest one with averages of 11% and 13% in TMY2 and TMY3 periods, respectively. At the same time, it jumps to double, reaching 34% in the TMYx period.
In 1986, points 1, 2, 3, and 9 show a PET maximum at 1:00 p.m. practically at the same hour. However, other points show their maximums after 2:00 p.m. From 1986 to 2016, all points represent a close similarity on thermal stress level during nighttime. TMY3 was the period that showed a close value from 6:00 p.m. to 6:00 a.m. through all points. TMYx shows an extended overheating time zone compared to TMY2 and TMY3, where points 1, 2, and 3 are refreshed faster when specially observed on TMY3 and TMYx.
Finally, PET maximum values in the long-term are registered in points 7 and 6 with PETmax.ave 51.9 °C and 50.7 °C, respectively, while the minimum values are taken in point 2 and 1 with PETmin.ave 17.2 °C and 18.9 °C in order. PET values are increased from 1986 to 2016, and more observed between 11:00 a.m. to 6:00 p.m. when the thermal stress becomes higher in all site points.
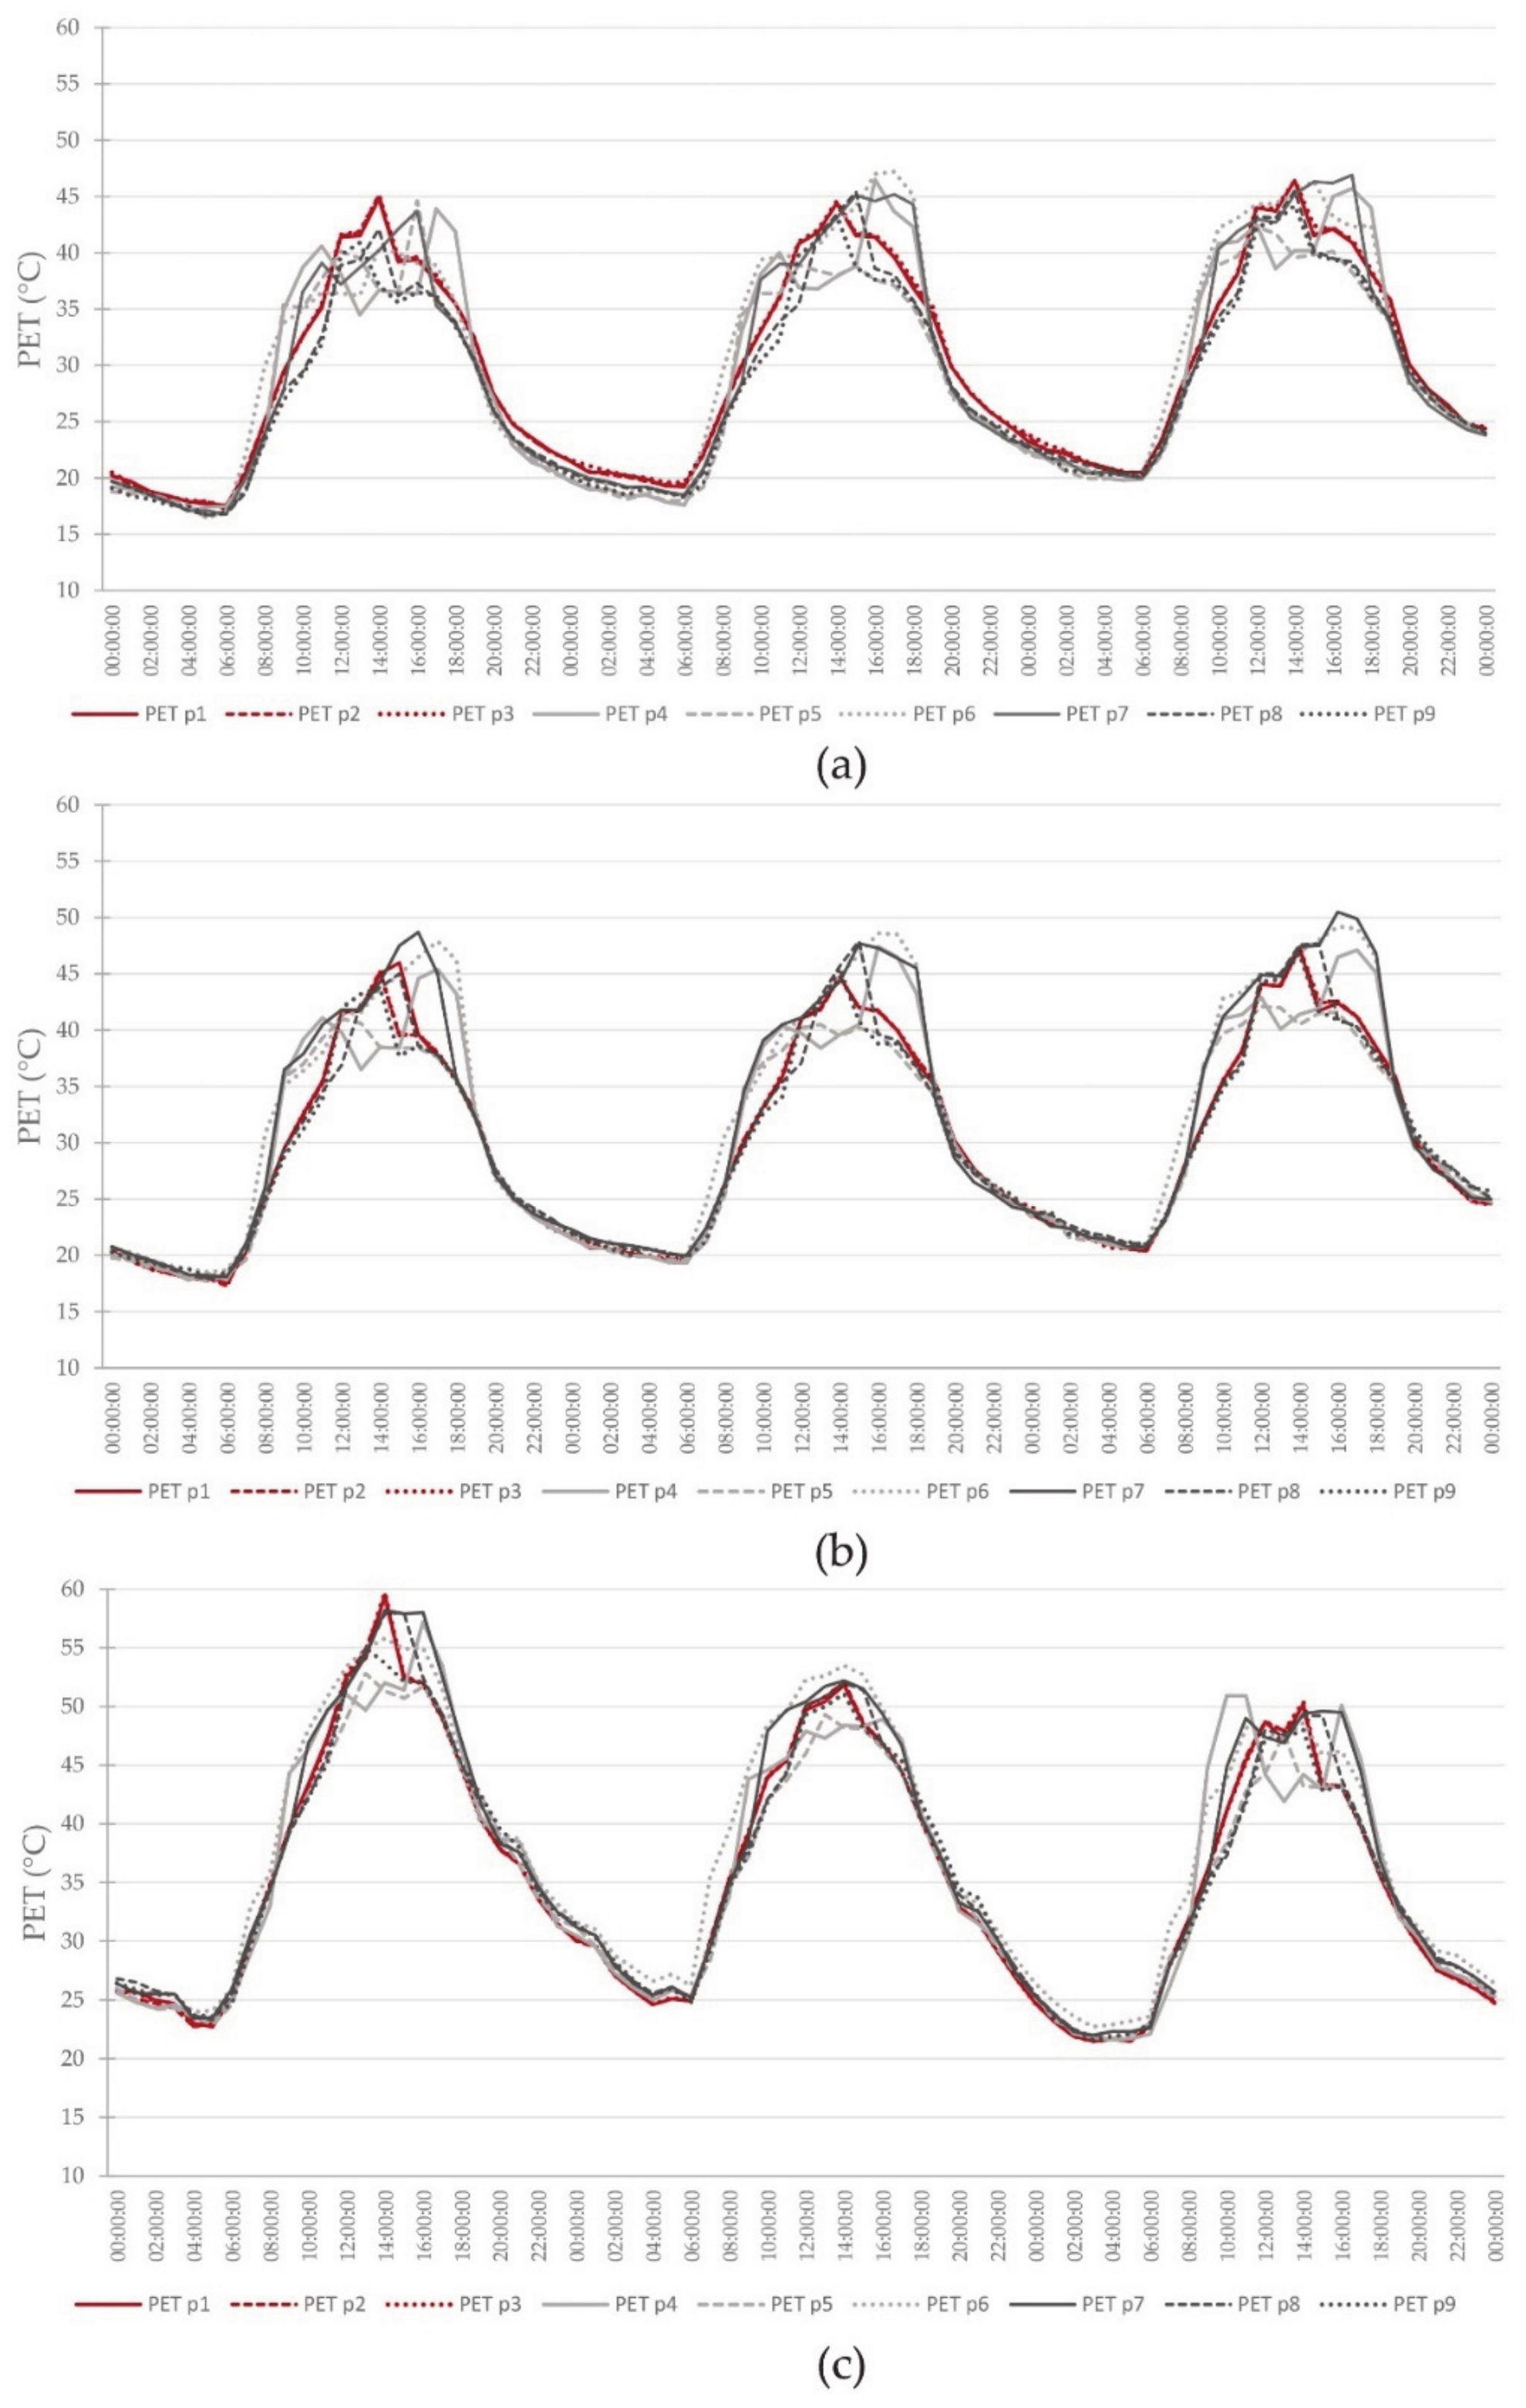
During the simulations, there was a significant variation in PET values throughout the three sites. In the long-term, points 1, 2, and 3 indicate a slow overheating during summer daytime compared to all other points. Furthermore, point 4 shows fewer values versus all points from 12:00 p.m. to 3:00 p.m. and becomes higher after 4:00 p.m. to sunset (Figure 7). During all periods, point 4 always shows a decrease in PET index values between 12:00 p.m. and 3:00 p.m. in contrast to all points presenting an increase in PET values at the same duration. Besides, there were no clear correlations found among PET value variations and the SVF of all points during simulation time. Close similarity is mostly observed between all measured points (Figure 7). Otherwise, PET values continuously increase over time within all measured points, while the last evaluated 15 years (TMYx) presents the most critical period.
In summary, PET values of TMY2 show an urban warming phenomenon in PET ranges in all points varying between 0.1 and 6.2 °C. Otherwise, the old neighborhood (S1) is the least affected by the urban warming with 0.6 °C as a max value recorded in point 3 and with 0.37 °C as a maximum average. Secondly, PET values of TMY3 indicate that the individual housing (S2) and the multifamily housing (S3) neighborhoods show the same reading with an urban warming in the afternoon reaching 3 °C in PET ranges and 6.2 °C as a maximum. Finally, the spatiotemporal reading confirms that the urban warming phenomenon begins at the morning from 10:00 a.m. to 11:00 a.m. and attains its maximum values in the afternoon. Some records present a max warming at 8:00 p.m. to 10:00 p.m. Consequently, as a reading between the SVF and the PET ranges on TMY2 and TMY3, we found a resemblance between the measurement points in each site.
5. Discussion
In this study, we performed a microclimatic analysis of three oasis urban fabrics in Tolga city “Tolga Oasis Complex” (Appendix A) in three different periods to assess the outdoor thermal comfort variations over 30 years. Initially, we applied simulation models, using three Typical Meteorological Year (TMY) files—TMY2 (1981–1990), TMY3 (1991–2005), and TMYx (2003–2017)—to enlarge the assessment of the outdoor thermal comfort duration, and to analyze the thermal stress changes during this time. Thus, TMY hourly weather files can improve and reinforce studies investigating the long-term outdoor thermal comfort’s assessment as well as for the future microclimate prediction. Moreover, this study is based on two numerical software programs: CFD ENVI-met for the validation and the simulation of the models and RayMan for the PET index calculation. To summarize the simulation readings, we list the significant findings of the analysis of the outdoor thermal comfort:
5.1. Study Findings and Recommendations
Our study indicates that in the 1980s (TMY2 period), the heat stress level was moderate (slightly above 50%), and the outdoor thermal comfort levels were identical when the neutral zone represented 46%. A slight variation in thermal comfort level occurred during the 1990s (TMY3 period). The models showed the same percentage of the neutral zone of 43%. In parallel, a slight increase in the heat stress zone (+3% comparing to the precedent duration). The third-period TMYx (2003–2017) represents a significant microclimatic change, causing a high and accelerated heat stress level from 57% to 76%, which is related to urban warming and the built environment’s development. The neutral zone registered a retreat from 43% to 24%, and this variation is due to the remarkable global warming intensity during the last 15 years. The last period is considered very critical to human body health and causes a significant impact on inhabitants’ well-being. Additionally, climate change and the frequent heat waves in the arid regions can be a serious cause to increase the rate of morbidity and mortality.
Results show an urban warming-effect [58] on PET ranges within all points varying between 0.1 and 6.2 °C, where the old neighborhood (S1) is the least affected by the warming-effect with 0.6 °C as maximum value recorded in point 3 and 0.4 °C as max average. Although (S1) represents the site where is surrounded by the palm trees “Phoenix Dactylifera” has benefited from the oasis cooling-effect [59] due to irrigated area especially at nighttime hours. However the (S2) and (S3) are more affected by the UHI [60].
Notably, (S1) is quickly cooling down after sunset in all periods compared to (S2) and (S3), which is likely due to the oasis cooling-effect phenomenon [61]. We should indicate that the oasis cooling-effect registered in (S1) has decreased during the last period (TMYx) compared to the precedent periods, possibly due to global warming increase [6].
From the spatiotemporal reading, we found that the real warming-effect phenomenon begins in late morning from 11:00 a.m. and reaches its maximum values in the afternoon. At the same time, some records represent a max warming-effect value at 8:00 p.m. to 10:00 p.m. In comparison between PET index values throughout the different SVFs of sites points, results showed a similarity of PET index values of the measured points between 0:00 a.m. and 6:00 a.m., likely due to homogeneity of building materials in all sites and their thermal aspects at nighttime. The last 15 years (2001–2016) have witnessed a remarkable change of the microclimatic parameters, including air temperature increase and relative humidity decrease. Thus, outdoor thermal comfort levels have declined and most probably will continue to decline in the future, in the short-term and long-term.
Therefore, results can instruct architects, urban planners, and climatologists to pay more attention to climate change effects caused by urban development in oases lands. Adapted urban climate strategies should be implemented in the arid climate, thus moderating the potential increase in air humidity. In desert cities, irrigated surfaces can cause long-term thermal heat stress growth, especially in summer daytime hours. However, deciduous trees can create shading and protect spaces from direct sun, which is most remarkable on the cooldown temperature time. Moreover, it is mandatory at the urban planning stage to know what kind and type of vegetation arrangement must be implanted on the oasis urban area in the earlier urban planning stages. All of these strategies should follow a quantitative approach such as PET index calculation and shading area estimation.
5.2. Strength and Limitations
The strength of this study relates to the combination between an empirical approach and simulation model analysis. The study is based on high-quality real-time data extracted from a climatic dataset of Algerian weather stations. The study presents new and unique findings for outdoor thermal comfort assessment of oasis settlements during several periods based on different TMY files. Previous studies were based only on the recent climatic dataset, i.e., for a short-term (days). Therefore, this study provides an accurate and long-term (30 years) quantification of the outdoor thermal comfort in Algeria’s oases settlements. In contrast to previous research focused only on limited geographical areas and short time assessment periods. Worldwide, few studies have assessed outdoor thermal comfort in the long-term, analyzing the evolution of climate change and the urban form’s impact on outdoor thermal stress sensation.
This study is technically based on the simulation model’s validation as the first stage, which needs 150 h only for the validation step, then more than 1000 h of running simulations. We should indicate that we carried around 7776 microclimatic data including air temperature, relative humidity, air velocity, and mean radiant temperature, which is equal to 2592 data per period. We needed to calculate 648 PET values at the three Typical Meteorological Year for the outdoor thermal comfort assessment in the three studied sites. Methodologically, we used a coupling between the two most used software programs on urban climate studies: ENVI-met (CFD) and RayMan as calculation models.
This study might be considered a vital step for future urban climate research; it could support the outdoor thermal comfort predictions in the oasis settlements based on the Intergovernmental Panel on Climate Change (IPCC) scenarios [62]. Moreover, the study represents a new approach in Algerian studies on urban climate, especially in hot environments.
On the other hand, this study has several limitations. The work does not consider the buildings’ shell details, i.e., doors, windows, roofs, and façade details, impacting outdoor thermal comfort. The study focused only on the hot period, which could have benefited from a more extended monitoring period (one year or more), to use the annual hourly data for the validation and calibration if necessary, and to assess the thermal comfort during the cold period. Moreover, for the Tmrt parameter, this could be calculated mathematically based on air temperature, air velocity, and globe temperature. At the same time, this last indicator needs a specific monitoring instrument which was unavailable for the current study.
5.3. Implication on Practice and Research
This study identified levels of outdoor thermal comfort in the oasis urban fabrics through several periods. Thus, future urban design in Algeria must be based on urban climate studies and follow long-term predictions. So far, Algeria’s urban policies are not considered concerning the urban climate changes and the quantitative approach for master plans projects. We believe that this study can guide decision-makers, architects, and urban planners to apply our findings in the early design stages to improve the outdoor thermal comfort depending on the urban design. Additionally, we believe that not only architects or urban experts are concerned by this study. Climate scientists and especially the practitioners in the meteorological domains may benefit from our outcomes to analyze the curve of climate change and predict the short- and long-term future effects.
6. Conclusions
This study focuses on assessing the outdoor thermal comfort within three different oasis urban fabrics, which can elaborate an evidence-based guideline for landscape and urban designers who want to build or rebuild thermally comfortable outdoor climates in oases settlement regions. The study investigated the evolution of the heat stress level by quantifying outdoor thermal comfort in the urban fabric of Tolga oasis city during a period of 30 years. The most appropriate PET index to evaluate the human thermal stress in an arid climate was used together with Typical Meteorological Year (TMY) files. The research methodology combined empirical and numerical modeling approaches to create a valid model for the three oasis urban fabric typologies. The research methodology reflects a novel approach to urban climate analysis based on real-time monitoring, CFD simulations, and meteorological calculation. This paper’s outcomes showed that climate change and the accumulated effect of urban climate modification induced significant heat stress values over 30 years. Heat stress levels remarkably increased in the last 15 years in all three urban fabrics. Regarding the effect of the various oases’ urban forms on the outdoor thermal comfort, it is not easy to specify the most influenced urban form or orientation among the three models. However, PET index values showed a smaller decrease in the old neighborhood (S1) than other neighborhoods, possibly due to the Palm Grove surrounding the area (S1). Overall, the study results in direct architects, urban planners, and climatologists to include urban climate variations during long-term assessment within the Saharan Oases’ urban planning stages.
Author Contributions
Conceptualization, M.E.M., D.A., and S.A.; methodology, M.E.M., D.A., J.T., S.A., and A.A.; software, M.E.M.; validation, M.E.M., D.A., J.T., S.A., and A.A.; formal Analysis, M.E.M.; investigation, M.E.M.; resources, M.E.M., D.A., J.T., S.A., and A.A.; data curation, M.E.M.; writing—original draft preparation, M.E.M.; writing—review and editing, M.E.M., J.T., D.A., S.A., and A.A.; visualization, M.E.M.; supervision, D.A., and S.A. All authors have read and agreed to the published version of the manuscript.
Funding
The authors acknowledge the Ministry of Higher Education of Algeria for providing necessary funds and resources to complete the PhD studies of the first author under the PNE program with the reference no. 19/enseignant/Belgique/2018–2019.
Institutional Review Board Statement
Not applicable.
Informed Consent Statement
Not applicable.
Data Availability Statement
Data are contained within the article. They are also available on request from the main and the corresponding authors.
Acknowledgments
We acknowledge the Algerian Ministry of Higher Education for providing a funded internship to the first author at the University of Liege through the “Programme National Exceptionnel (PNE) under file no. 19/enseignant/Belgique/2018–2019. We would like to acknowledge the LACOMOFA Laboratory, University of Biskra, the Sustainable Building Design (SBD) Laboratory, and the Local Environment Management & Analysis Laboratory (LEMA) at the University of Liege, Belgium for the use of the monitoring equipment in this research and valuable support during the experiments and data analysis. The authors would also like to thank the University of Biskra. Algeria and the University of Liege, Belgium for their assistance in administrative procedures.
Conflicts of Interest
The authors declare no conflict of interest. The funders had no role in the study’s design; in the collection, in the Analysis, or interpretation of data; in the writing of the manuscript, or in the decision to publish the results.
Appendix A
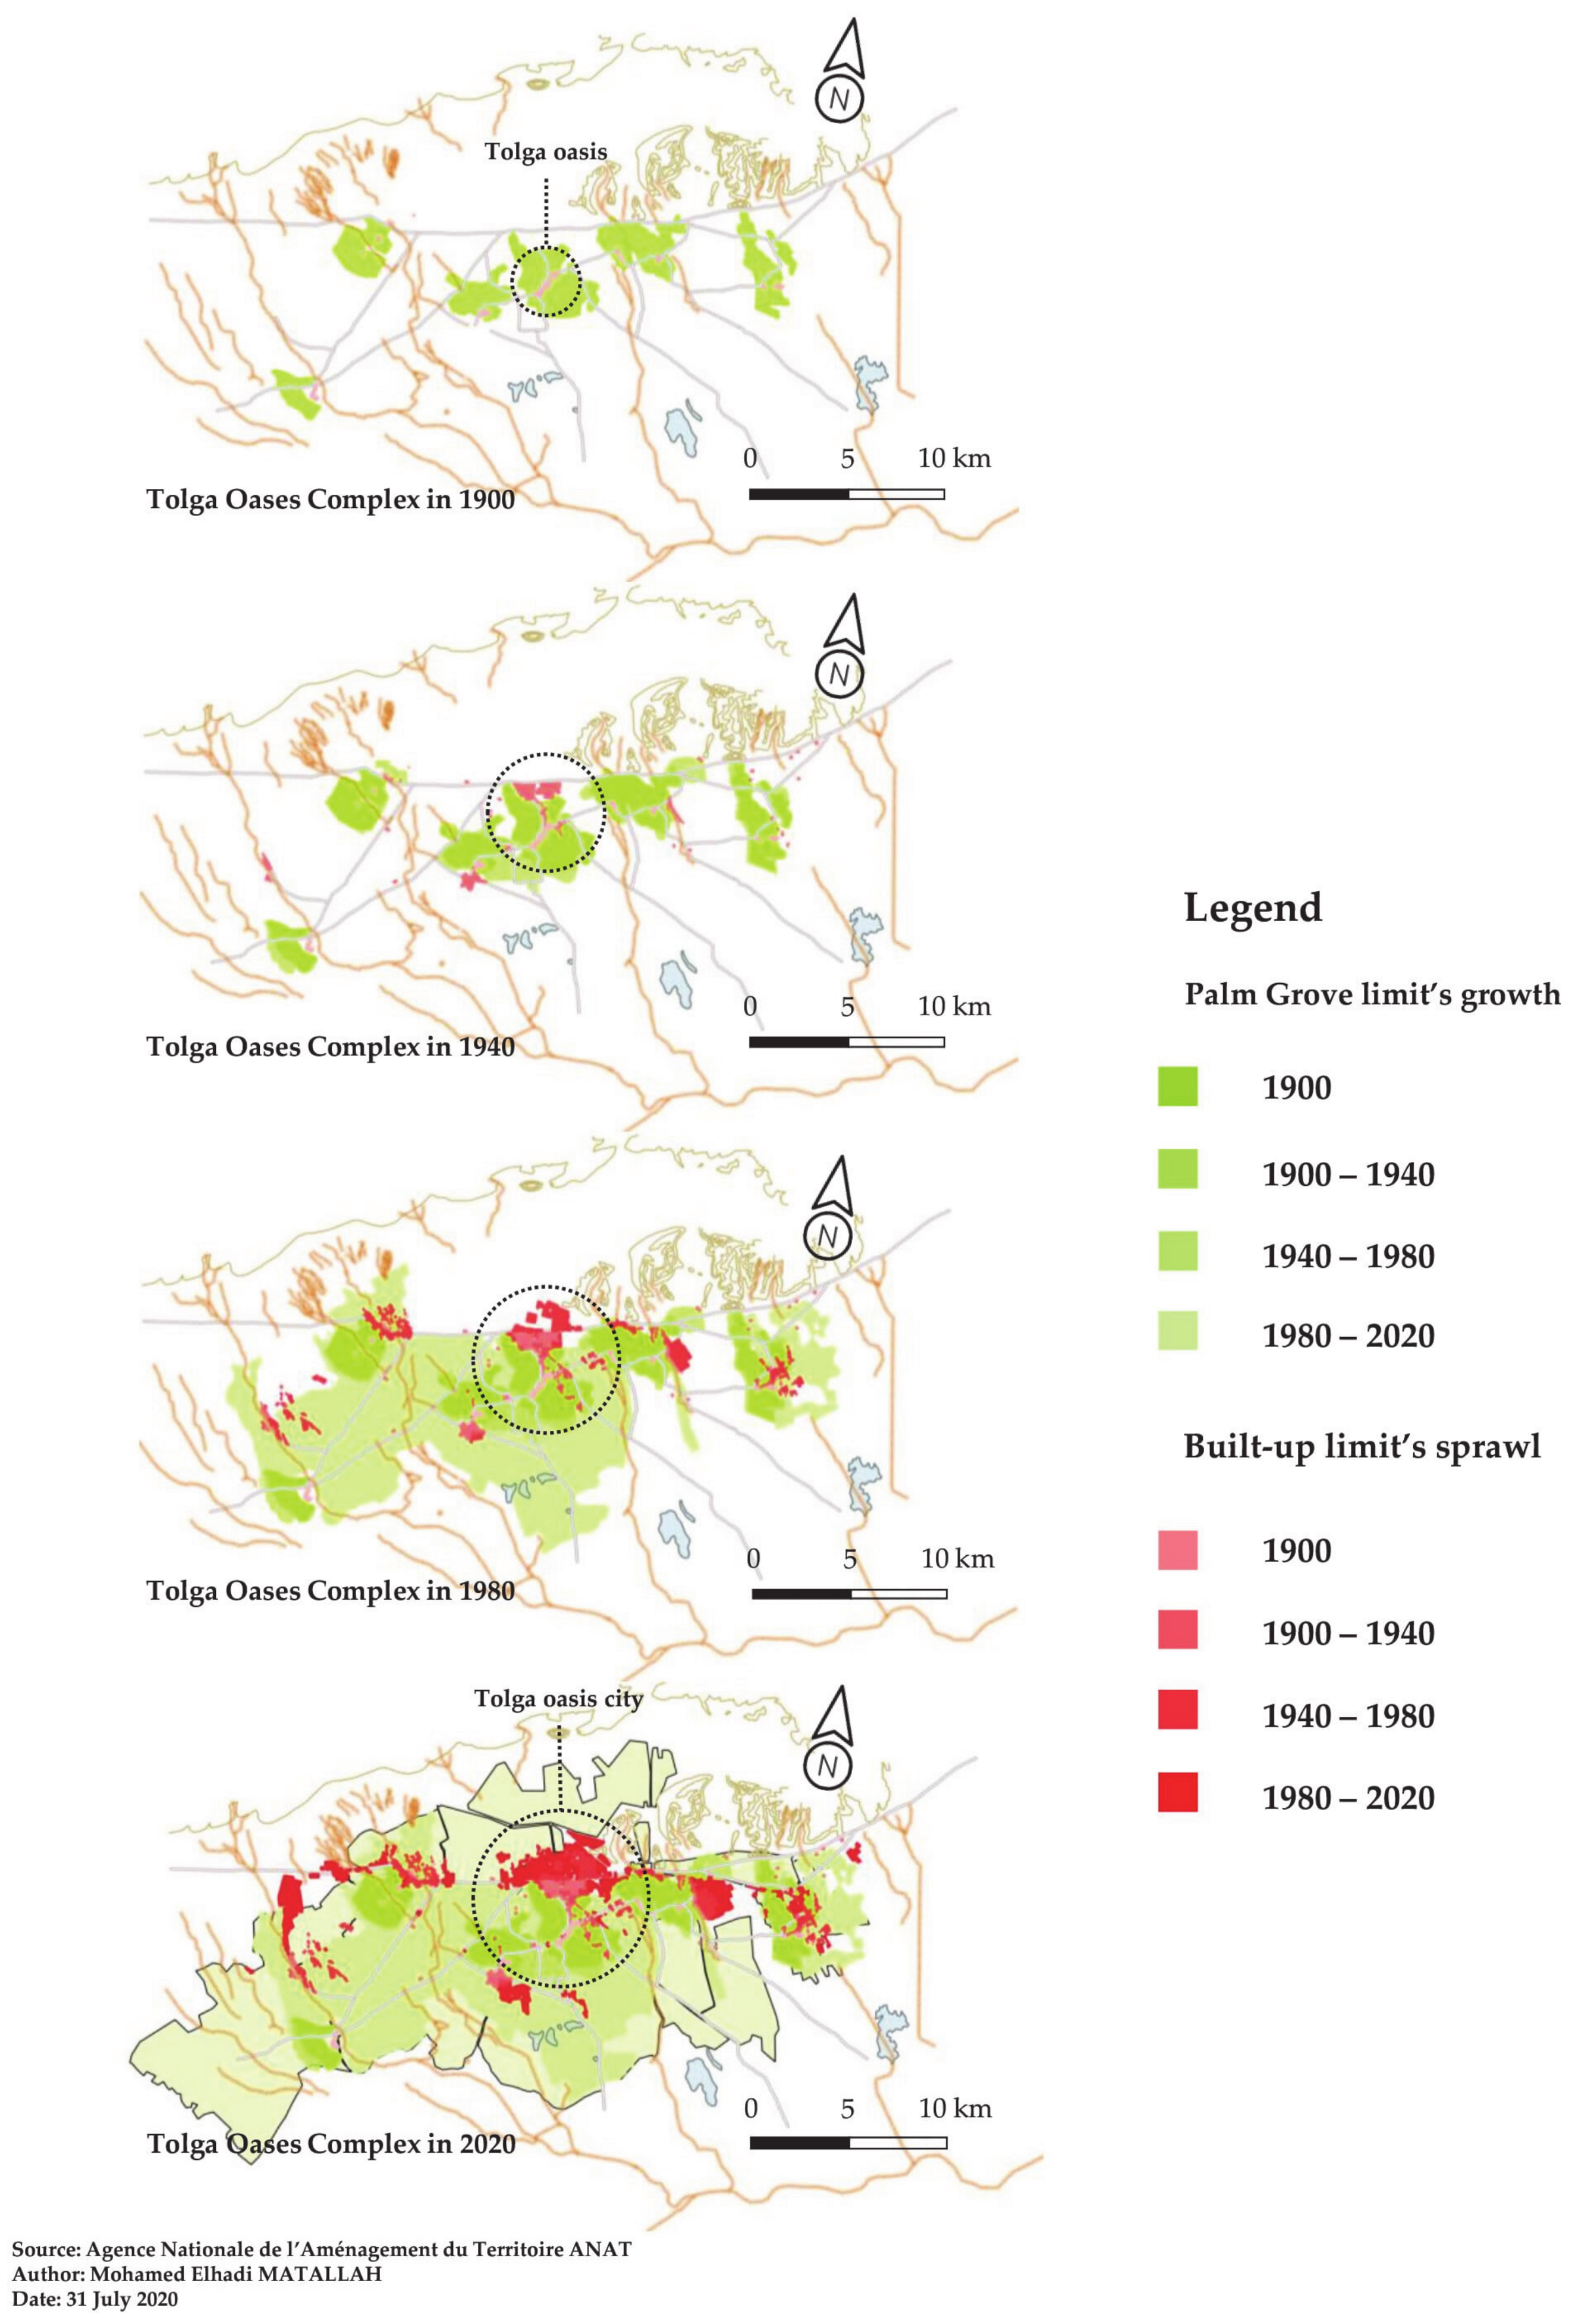
Figure A1.
The development of Tolga Oases Complex between 1900 and 2020.

References
- Battesti, V. Jardins au Désert: Évolution des Pratiques et Savoirs Oasiens: Jérid Tunisien; IRD Éditions: Marseille, France, 2005. [Google Scholar]
- Attia, S. Spatial and Behavioral Thermal Adaptation in Net Zero Energy Buildings: An Exploratory Investigation. Sustainability 2020, 12, 7961. [Google Scholar] [CrossRef]
- Coté, M. La Ville et le Désert: Le Bas-Sahara Algérien; Karthala Éditions: Paris, France, 2005. [Google Scholar]
- Ahriz, A.; Fezzai, S.; Mady, A.A.M. Predicting the limits of the oasis effect as a cooling phenomenon in hot deserts. Desert 2019, 24, 255–266. [Google Scholar]
- Matallah, M.E.; Alkama, D.; Ahriz, A.; Attia, S. Assessment of the Outdoor Thermal Comfort in Oases Settlements. Atmosphere 2020, 11, 185. [Google Scholar] [CrossRef] [Green Version]
- Potchter, O.; Ben-Shalom, H.I. Urban warming and global warming: Combined effect on thermal discomfort in the desert city of Beer Sheva, Israel. J. Arid. Environ. 2013, 98, 113–122. [Google Scholar] [CrossRef]
- Johansson, E. Influence of urban geometry on outdoor thermal comfort in a hot dry climate: A study in Fez, Morocco. Build. Environ. 2006, 41, 1326–1338. [Google Scholar] [CrossRef]
- Bourbia, F.; Awbi, H.B. Building cluster and shading in urban canyon for hot dry climate: Part 1: Air and surface temperature measurements. Renew. Energy 2004, 29, 249–262. [Google Scholar] [CrossRef]
- Bourbia, F.; Awbi, H.B. Building cluster and shading in urban canyon for hot dry climate: Part 2: Shading simulations. Renew. Energy 2004, 29, 291–301. [Google Scholar] [CrossRef]
- Jamei, E.; Rajagopalan, P.; Seyedmahmoudian, M.; Jamei, Y. Review on the impact of urban geometry and pedestrian level greening on outdoor thermal comfort. Renew. Sustain. Energy Rev. 2016, 54, 1002–1017. [Google Scholar] [CrossRef]
- Berardi, U.; Wang, Y. The Effect of a Denser City over the Urban Microclimate: The Case of Toronto. Sustainability 2016, 8, 822. [Google Scholar] [CrossRef]
- Tong, S.; Wong, N.H.; Tan, C.L.; Jusuf, S.K.; Ignatius, M.; Tan, E. Impact of urban morphology on microclimate and thermal comfort in northern China. Solar Energy 2017, 155, 212–223. [Google Scholar] [CrossRef]
- He, B.-J.; Ding, L.; Prasad, D. Relationships among local-scale urban morphology, urban ventilation, urban heat island and outdoor thermal comfort under sea breeze influence. Sustain. Cities Soc. 2020, 60, 102289. [Google Scholar] [CrossRef]
- Darbani, E.S.; Parapari, D.M.; Boland, J.; Sharifi, E. Impacts of urban form and urban heat island on the outdoor thermal comfort: A pilot study on Mashhad. Int. J. Biometeorol. 2021. [Google Scholar] [CrossRef]
- Mahmoud, A.H.A. Analysis of the microclimatic and human comfort conditions in an urban park in hot and arid regions. Build. Environ. 2011, 46, 2641–2656. [Google Scholar] [CrossRef]
- Venhari, A.A.; Tenpierik, M.; Taleghani, M. The role of sky view factor and urban street greenery in human thermal comfort and heat stress in a desert climate. J. Arid. Environ. 2019, 166, 68–76. [Google Scholar] [CrossRef]
- He, B.J.; Ding, L.; Prasad, D. Outdoor thermal environment of an open space under sea breeze: A mobile experience in a coastal city of Sydney, Australia. Urban Clim. 2020, 31, 100567. [Google Scholar] [CrossRef]
- Middel, A.; Selover, N.; Hagen, B.; Chhetri, N. Impact of shade on outdoor thermal comfort—A seasonal field study in Tempe, Arizona. Int. J. Biometeorol. 2016, 60, 1849–1861. [Google Scholar] [CrossRef] [Green Version]
- Balogun, I.A.; Daramola, M.T. The outdoor thermal comfort assessment of different urban configurations within Akure City, Nigeria. Urban Clim. 2019, 29, 100489. [Google Scholar] [CrossRef]
- Karakounos, I.; Dimoudi, A.; Zoras, S. The influence of bioclimatic urban redevelopment on outdoor thermal comfort. Energy Build. 2018, 158, 1266–1274. [Google Scholar] [CrossRef]
- Cohen, P.; Shashua-Bar, L.; Keller, R.; Gil-Ad, R.; Yaakov, Y.; Lukyanov, V.; Potchter, O. Urban outdoor thermal perception in hot arid Beer Sheva, Israel: Methodological and gender aspects. Build. Environ. 2019, 160, 106169. [Google Scholar] [CrossRef]
- Elnabawi, M.H.; Hamza, N.; Dudek, S. Thermal perception of outdoor urban spaces in the hot arid region of Cairo, Egypt. Sustain. Cities Soc. 2016, 22, 136–145. [Google Scholar] [CrossRef]
- Moufida, B.; Djamel, A.; Noureddine, M.; Soumia, B. The energy balance behavior in Open Street. Case study city of Biskra, Algeria. Energy Procedia 2014, 50, 3–9. [Google Scholar] [CrossRef] [Green Version]
- Masmoudi, S.; Mazouz, S. Relation of geometry, vegetation and thermal comfort around buildings in urban settings, the case of hot arid regions. Energy Build. 2004, 36, 710–719. [Google Scholar] [CrossRef]
- Teller, J.; Azar, S. Townscope II—A computer system to support solar access decision-making. Sol. Energy 2001, 70, 187–200. [Google Scholar] [CrossRef] [Green Version]
- Bruse, M.; Fleer, H. Simulating surface–plant–air interactions inside urban environments with a three dimensional numerical model. Environ. Model. Softw. 1998, 13, 373–384. [Google Scholar] [CrossRef]
- Bruse, M. ENVI-Met 3.0: Updated Model Overview. University of Bochum. 2004. Available online: www.envi-met.com (accessed on 24 April 2020).
- Matzarakis, A.; Rutz, F.; Mayer, H. Modelling radiation fluxes in simple and complex environments—Application of the RayMan model. Int. J. Biometeorol. 2007, 51, 323–334. [Google Scholar] [CrossRef]
- Matzarakis, A.; Rutz, F.; Mayer, H. Modelling radiation fluxes in simple and complex environments: Basics of the RayMan model. Int. J. Biometeorol. 2010, 54, 131–139. [Google Scholar] [CrossRef] [PubMed] [Green Version]
- Tsoka, S.; Tsikaloudaki, A.; Theodosiou, T. Analyzing the ENVI-met microclimate model’s performance and assessing cool materials and urban vegetation applications–A review. Sustain. Cities Soc. 2018, 43, 55–76. [Google Scholar] [CrossRef]
- Sharmin, T.; Steemers, K.; Matzarakis, A. Microclimatic modelling in assessing the impact of urban geometry on urban thermal environment. Sustain. Cities Soc. 2017, 34, 293–308. [Google Scholar] [CrossRef]
- Ali-Toudert, F.; Mayer, H. Numerical study on the effects of aspect ratio and orientation of an urban street canyon on outdoor thermal comfort in hot and dry climate. Build. Environ. 2006, 41, 94–108. [Google Scholar] [CrossRef]
- Sodoudi, S.; Zhang, H.; Chi, X.; Müller, F.; Li, H. The influence of spatial configuration of green areas on microclimate and thermal comfort. Urban For. Urban Green. 2018, 34, 85–96. [Google Scholar] [CrossRef]
- Zhao, Q.; Sailor, D.J.; Wentz, E.A. Impact of tree locations and arrangements on outdoor microclimates and human thermal comfort in an urban residential environment. Urban For. Urban Green. 2018, 32, 81–91. [Google Scholar] [CrossRef] [Green Version]
- Deng, J.Y.; Wong, N.H. Impact of urban canyon geometries on outdoor thermal comfort in central business districts. Sustain. Cities Soc. 2020, 53, 101966. [Google Scholar] [CrossRef]
- Berkovic, S.; Yezioro, A.; Bitan, A. Study of thermal comfort in courtyards in a hot arid climate. Sol. Energy 2012, 86, 1173–1186. [Google Scholar] [CrossRef]
- Ambrosini, D.; Galli, G.; Mancini, B.; Nardi, I.; Sfarra, S. Evaluating mitigation effects of urban heat islands in a historical small center with the ENVI-Met® climate model. Sustainability 2014, 6, 7013–7029. [Google Scholar] [CrossRef] [Green Version]
- Acero, J.A.; Arrizabalaga, J. Evaluating the performance of ENVI-met model in diurnal cycles for different meteorological conditions. Theor. Appl. Clim. 2018, 131, 455–469. [Google Scholar] [CrossRef]
- Boukhabl, M.; Alkam, D. Impact of Vegetation on Thermal Conditions Outside, Thermal Modeling of Urban Microclimate, Case Study: The Street of the Republic, Biskra. Energy Procedia 2012, 18, 73–84. [Google Scholar] [CrossRef] [Green Version]
- Boukhelkhal, I.; Bourbia, P.F. Thermal comfort conditions in outdoor urban spaces: Hot dry climate-Ghardaia-Algeria. Procedia Eng. 2016, 169, 207–215. [Google Scholar] [CrossRef]
- Kedissa, C.; Outtas, S.; Belarbi, R. The impact of height/width ratio on the microclimate and thermal comfort levels of urban courtyards. Int. J. Sustain. Build. Technol. Urban Dev. 2016, 7, 174–183. [Google Scholar] [CrossRef]
- Berkouk, D.; Bouzir, T.A.K.; Maffei, L.; Masullo, M. Examining the Associations between Oases Soundscape Components and Walking Speed: Correlation or Causation? Sustainability 2020, 12, 4619. [Google Scholar] [CrossRef]
- Côte, M. Signatures Sahariennes: Terroirs & Territoires Vus du Ciel; Presses Universitaires de Provence (PUP): Aix-en-Provence, France, 2012. [Google Scholar]
- Alkama, D.; Tacherift, A. Essai d’analyse typo-morphologique des noyaux urbains traditionnels dans la région des Ziban. Courrier du Savoir 2001, 1, 81–88. [Google Scholar]
- Semahi, S.; Benbouras, M.A.; Mahar, W.A.; Zemmouri, N.; Attia, S. Development of Spatial Distribution Maps for Energy Demand and Thermal Comfort Estimation in Algeria. Sustainability 2020, 12, 6066. [Google Scholar] [CrossRef]
- ENVI-Met Software. 2019. Available online: https://www.envi-met.com/ (accessed on 24 April 2020).
- ASHRAE. ASHRAE Guideline 14-2002. Measurement of Energy and Demand Savings, 8400; ASHRAE: Atlanta, GA, USA, 2002. [Google Scholar]
- Matallah, M.E.; Ahriz, A.; Attia, S. Quantification of the Outdoor Thermal Comfort Process: Simulation & Calculation Data; Sustainable Building Design Lab., Ed.; University of Liège: Liège, Belgium, 2020. [Google Scholar]
- TESTO. TESTO 480 Climate Measuring Instrument; TESTO Instruments: 2020. Available online: https://static-int.testo.com/media/cf/01/1ff8d8380280/testo-480-Instruction-manual.pdf (accessed on 18 December 2020).
- Taleghani, M.; Kleerekoper, L.; Tenpierik, M.; Dobbelsteen, A.V.D. Outdoor thermal comfort within five different urban forms in the Netherlands. Build. Environ. 2015, 83, 65–78. [Google Scholar] [CrossRef]
- Ratti, C.; Baker, N.; Steemers, K. Energy consumption and urban texture. Energy Build. 2005, 37, 762–776. [Google Scholar] [CrossRef]
- Ali-Toudert, F.; Mayer, H. Effects of asymmetry, galleries, overhanging façades and vegetation on thermal comfort in urban street canyons. Sol. Energy 2007, 81, 742–754. [Google Scholar] [CrossRef]
- Semahi, S.; Zemmouri, N.; Singh, M.K.; Attia, S. Comparative bioclimatic approach for comfort and passive heating and cooling strategies in Algeria. Build. Environ. 2019, 161, 106271. [Google Scholar] [CrossRef] [Green Version]
- Hien, W.N.; Ignatius, M.; Eliza, A.; Jusuf, S.K.; Samsudin, R. Comparison of STEVE and ENVI-met as temperature prediction models for Singapore context. Int. J. Sustain. Build. Technol. Urban Dev. 2012, 3, 197–209. [Google Scholar] [CrossRef]
- Meteonorm Software. Available online: https://meteonorm.com/en/ (accessed on 20 August 2020).
- Climate.OneBuilding. Repository of Free Climate Data for Building Performance Simulation. 2020. Available online: http://climate.onebuilding.org/ (accessed on 20 March 2020).
- Potchter, O.; Cohen, P.; Lin, T.P.; Matzarakis, A. Outdoor human thermal perception in various climates: A comprehensive review of approaches, methods and quantification. Sci. Total Environ. 2018, 631, 390–406. [Google Scholar] [CrossRef]
- Oke, T.R. Boundary Layer Climates; Routledge: London, UK, 2002. [Google Scholar]
- Boudjellal, L.; Bourbia, F. An evaluation of the cooling effect efficiency of the oasis structure in a Saharan town through remotely sensed data. Int. J. Environ. Stud. 2018, 75, 309–320. [Google Scholar] [CrossRef]
- Taleghani, M. Outdoor thermal comfort by different heat mitigation strategies—A review. Renew. Sustain. Energy Rev. 2018, 81, 2011–2018. [Google Scholar] [CrossRef]
- Potchter, O.; Goldman, D.; Kadish, D.; Iluz, D. The oasis effect in an extremely hot and arid climate: The case of southern Israel. J. Arid. Environ. 2008, 72, 1721–1733. [Google Scholar] [CrossRef]
- Rogelj, J.; Meinshausen, M.; Knutti, R. Global warming under old and new scenarios using IPCC climate sensitivity range estimates. Nat. Clim. Change 2012, 2, 248–253. [Google Scholar] [CrossRef]
Figure 1.
Study conceptual framework.
Figure 2.
Location of the study area throughout Tolga Oasis Complex.
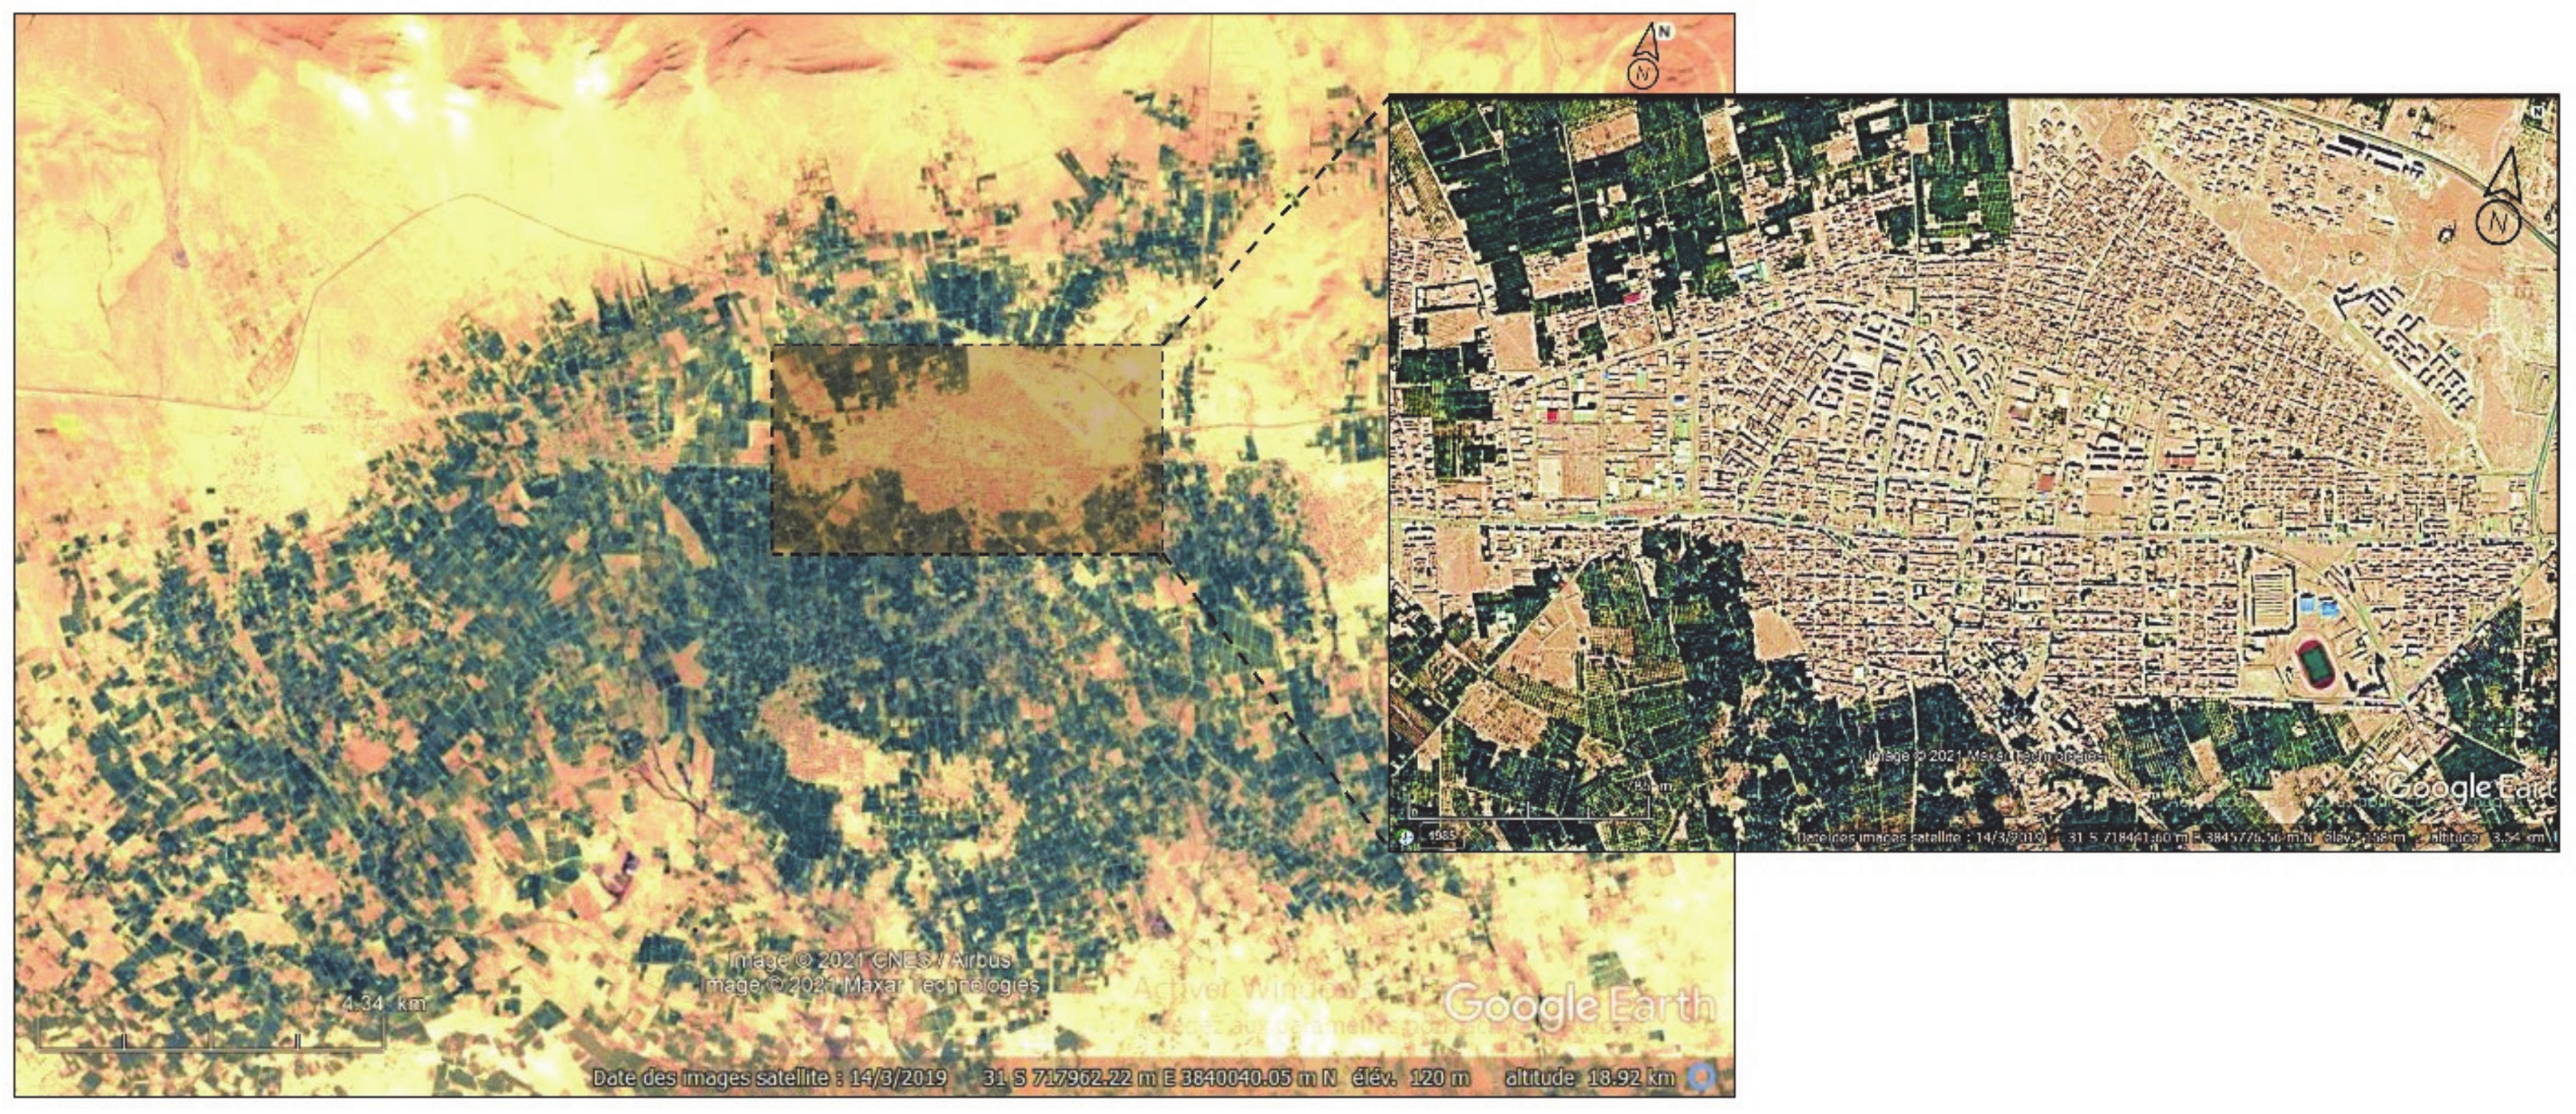
Figure 3.
Temperature and rainfall averages for 30 years (1988–2017) in Tolga Oasis Complex: (a) Monthly averages of temperature for 30 years; (b) Annual rainfall averages during 30 years.
Figure 3.
Temperature and rainfall averages for 30 years (1988–2017) in Tolga Oasis Complex: (a) Monthly averages of temperature for 30 years; (b) Annual rainfall averages during 30 years.
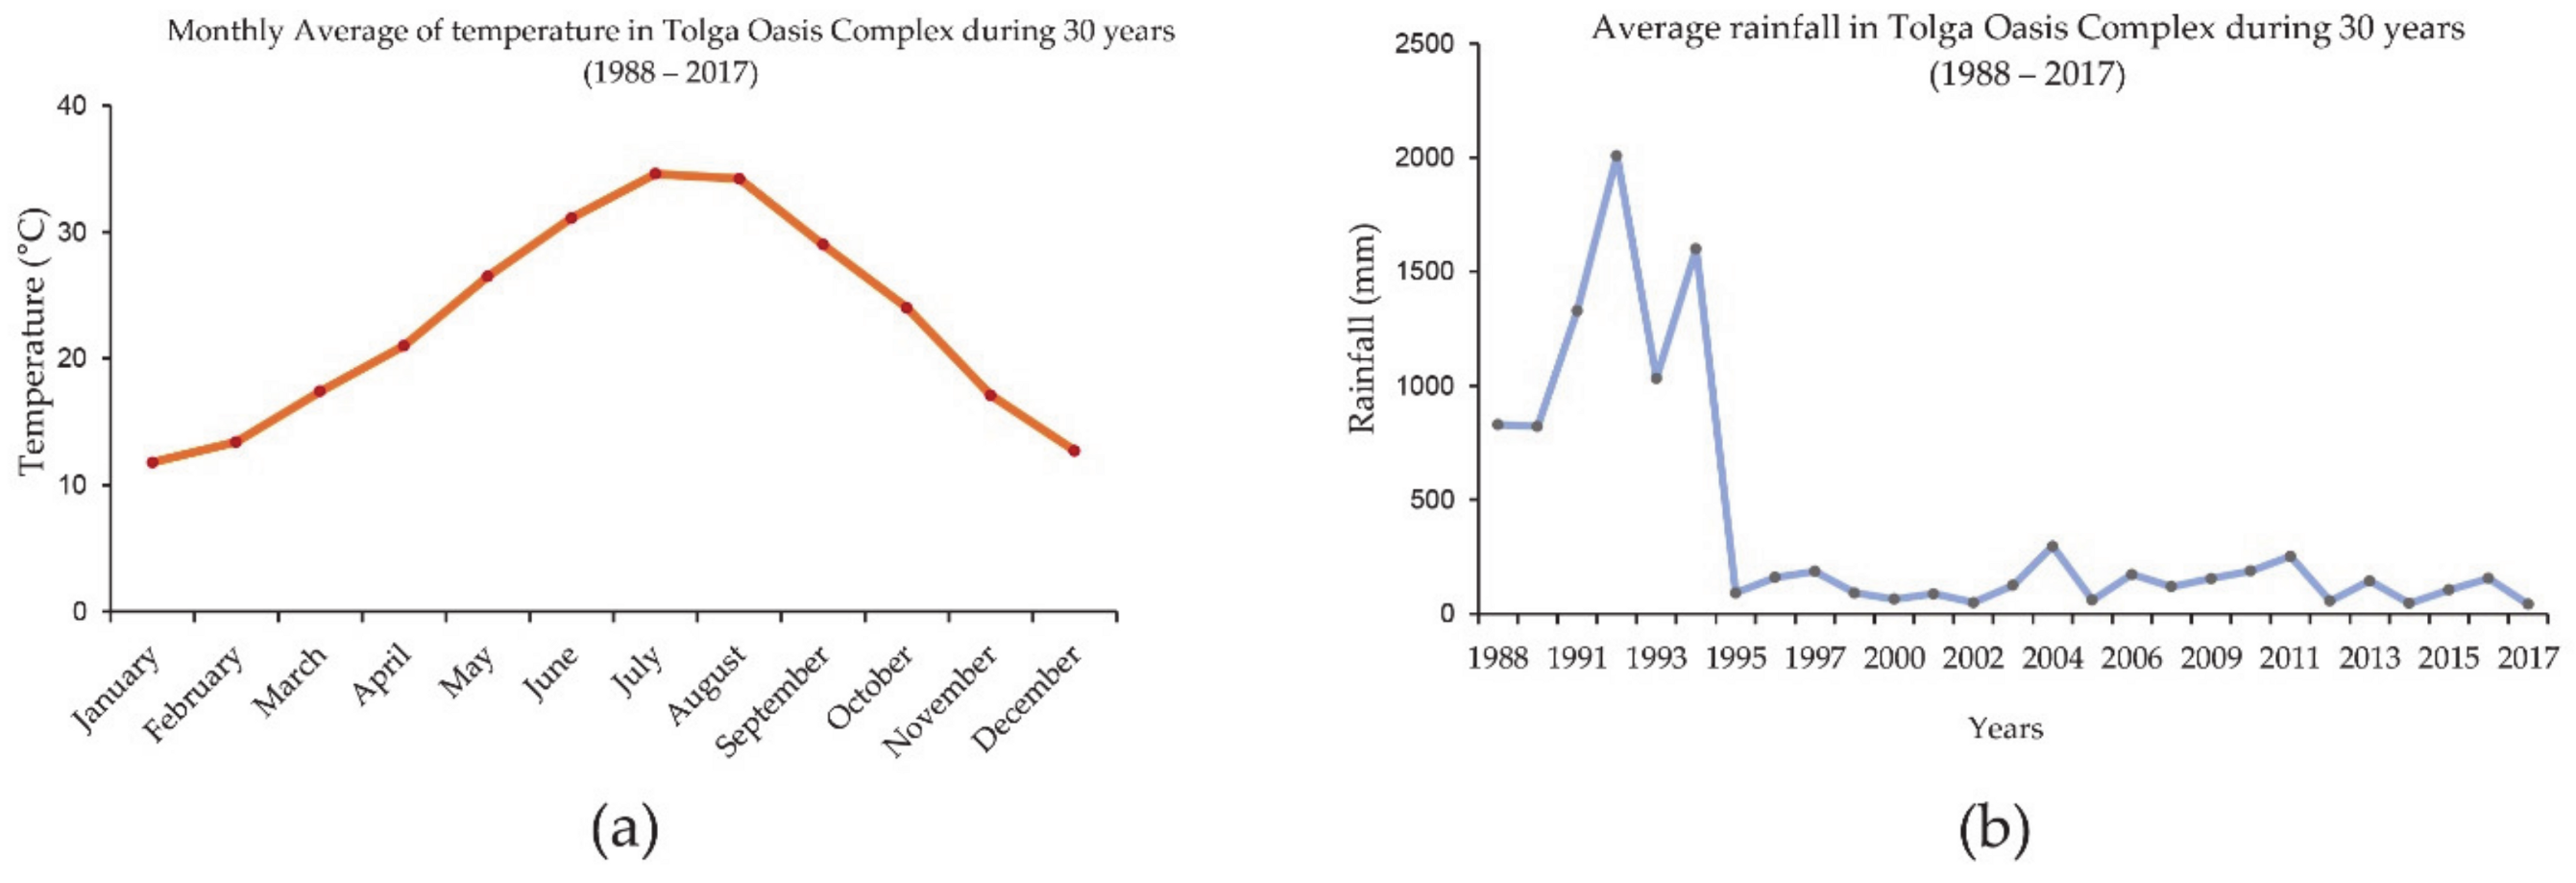
Figure 4.
Locations and shapes of the study sites in Tolga oasis city; S1: old neighborhood. S2: individual housing neighborhood, S3: multifamily housing neighborhood.
Figure 4.
Locations and shapes of the study sites in Tolga oasis city; S1: old neighborhood. S2: individual housing neighborhood, S3: multifamily housing neighborhood.

Figure 5.
Comparison between simulated and measured outdoor temperature during the monitored period in the three studied sites.
Figure 5.
Comparison between simulated and measured outdoor temperature during the monitored period in the three studied sites.

Figure 6.
Simulation periods of the three case-study models according to TMY2, TMY3, and TMYx.
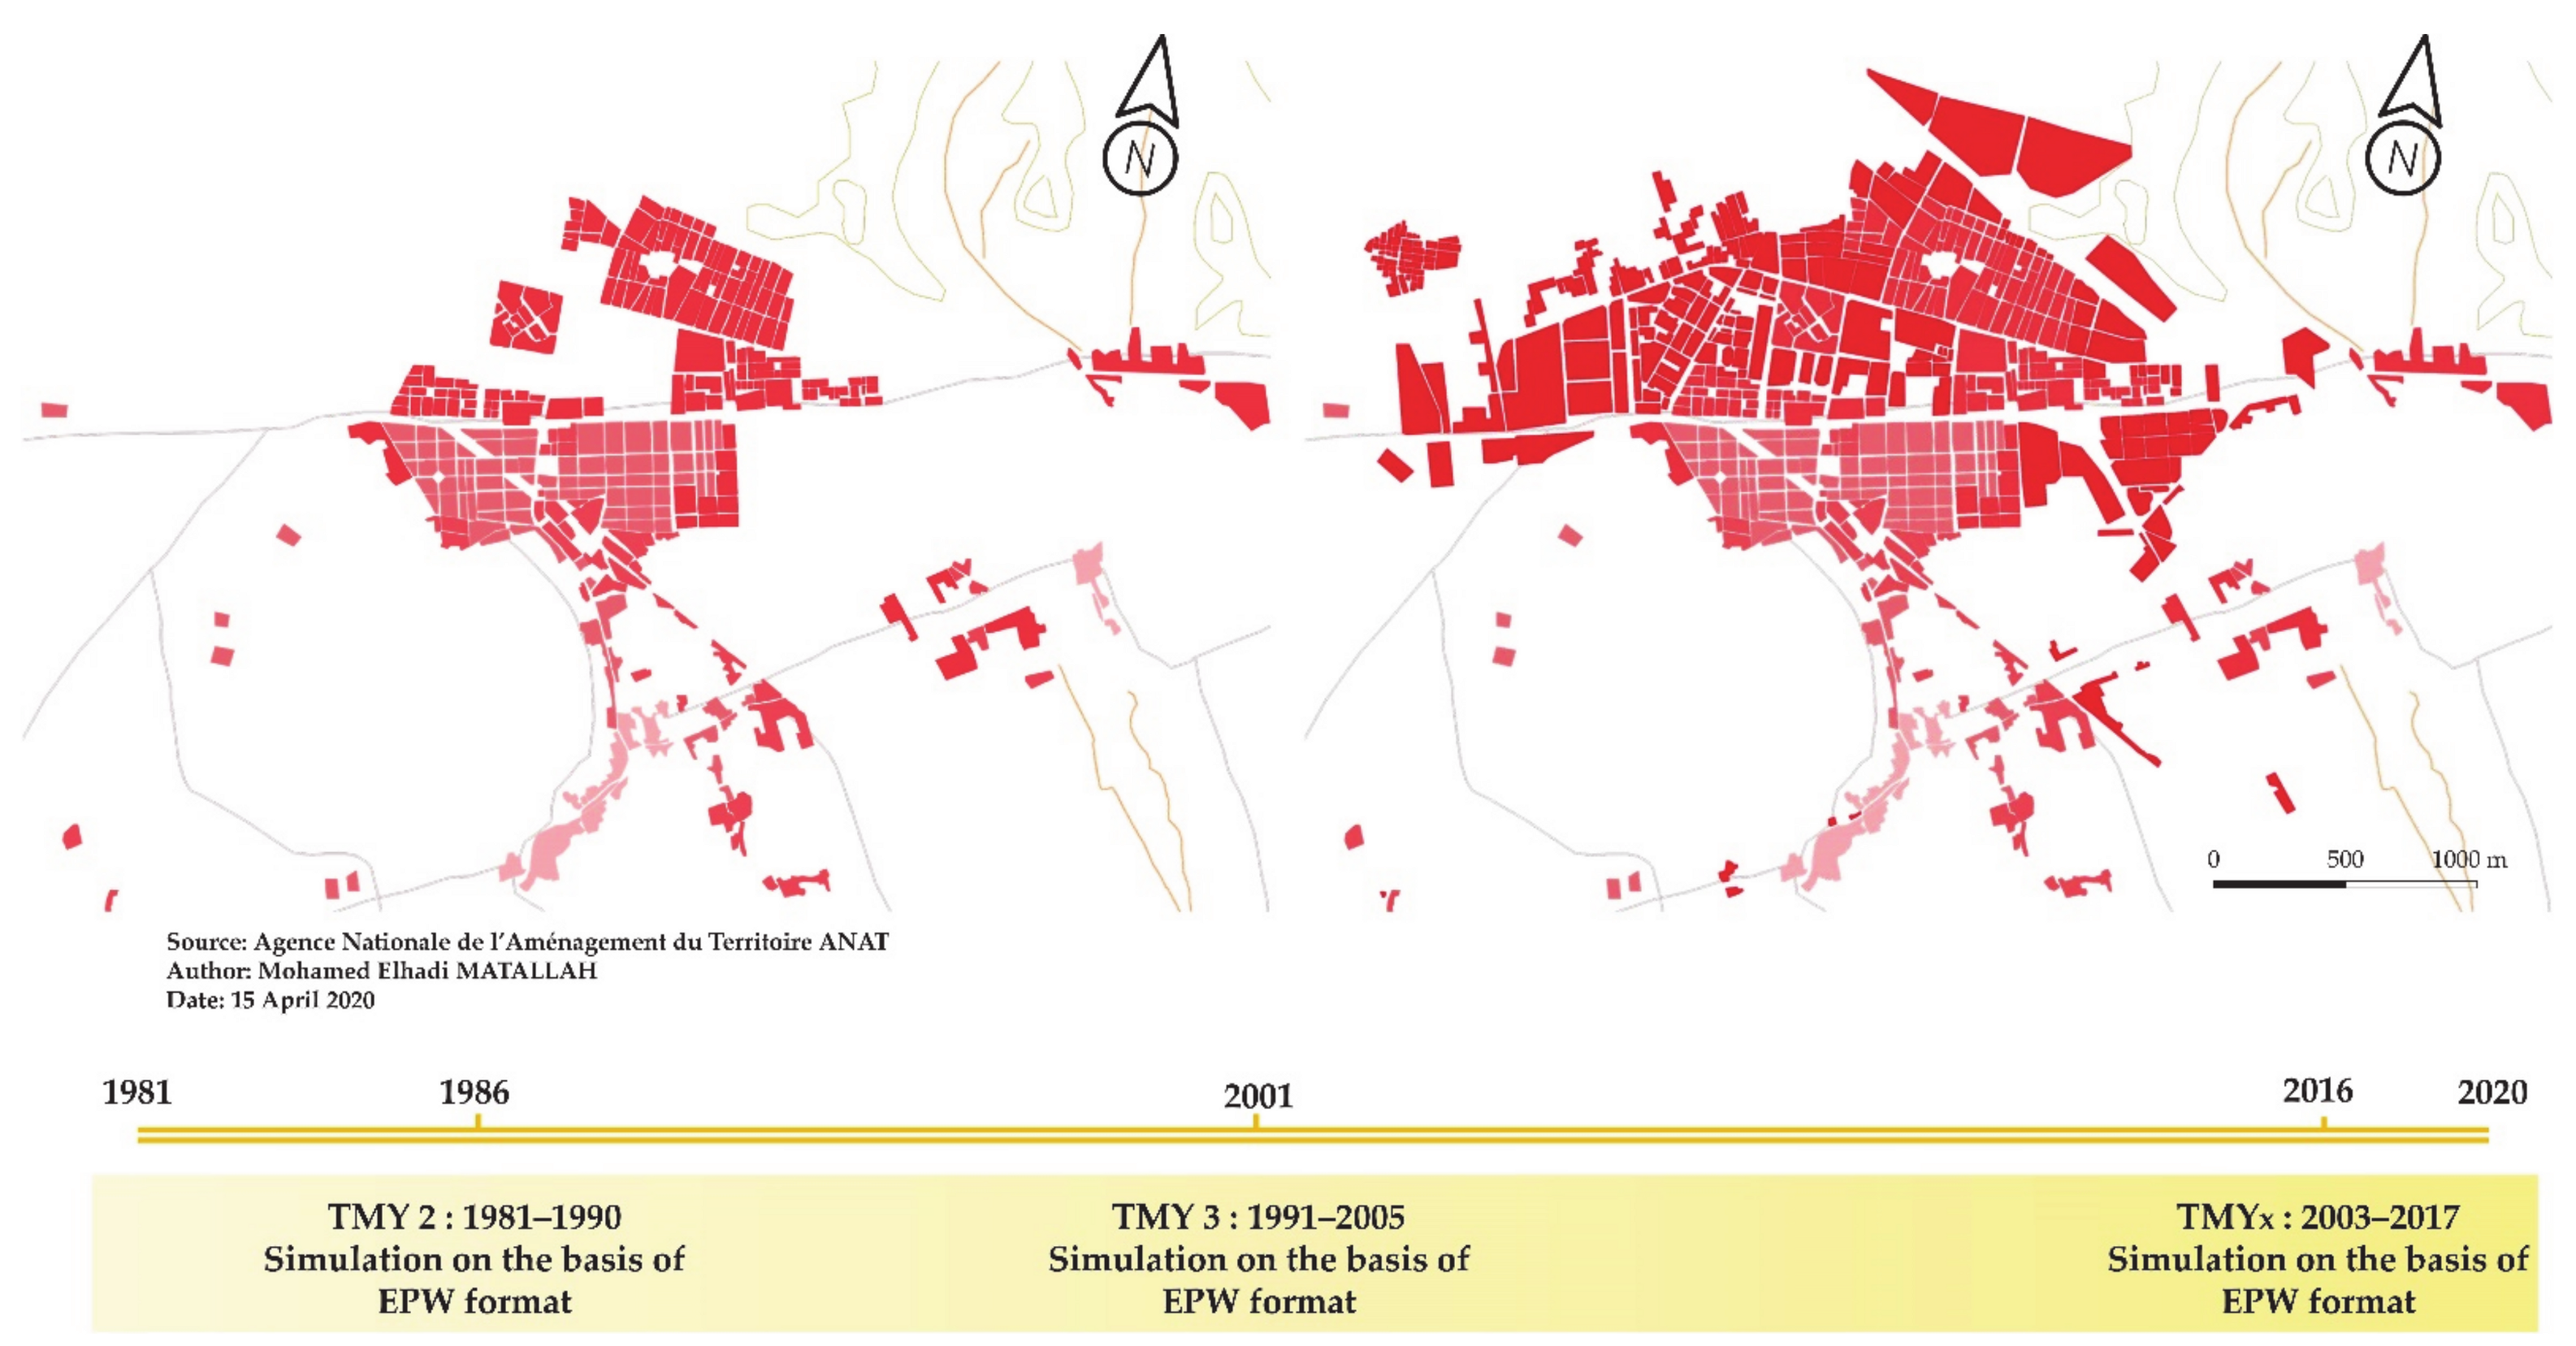
Figure 7.
Variation of PET. index values throughout the study points during TMY2, TMY3, and TMYx: (a) TMY2; (b) TMY3; (c) TMYx.
Figure 7.
Variation of PET. index values throughout the study points during TMY2, TMY3, and TMYx: (a) TMY2; (b) TMY3; (c) TMYx.

Table 1.
Morphological parameters of the selected sites in Tolga oasis city.
| Morphological Parameters | Old Neighborhood (S1) | Individual Housing Neighborhood (S2) | Multifamily Housing Neighborhood (S3) | ||||||
|---|---|---|---|---|---|---|---|---|---|
| Urban grids |  |  | 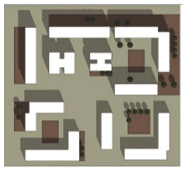 | ||||||
| Built-up area (m2) | 14,000 | 22,000 | 28,000 | ||||||
| Measurement points | 1 | 2 | 3 | 4 | 5 | 6 | 7 | 8 | 9 |
| Length (m) | 50.35 | 150.00 | 58.70 | 72.20 | 40.00 | 56.10 | 45.70 | 56.00 | 75.00 |
| Height (m) | 3.70 | 7.10 | 3.00 | 6.40 | 6.40 | - | 12.50 | 12.50 | 12.50 |
| Width (m) | 3.40 | 3.15 | 4.00 | 3.20 | 3.90 | - | - | 12.50 | 14.00 |
| H/W | 1.09 | 2.25 | 0.75 | 2.00 | 1.64 | - | - | 1 | 0.89 |
| Street orientation | N-S | E-W | N-S | E-W | N-S | - | - | N-S | E-W |
| Sky View Factor (SVF) | 0.32 | 0.18 | 0.56 | 0.39 | 0.42 | 0.67 | 0.87 | 0.78 | 0.64 |
| Fish-eye |  |  |  |  |  |  |  |  |  |
| Tree specie | Phoenix dactylifera—Grass | Ficus rubiginosa—Grass | Ficus rubiginosa—Grass | ||||||
Table 2.
Instruments used for the meteorological measurements.
| Meteorological Data Parameters | |||||
|---|---|---|---|---|---|
| Variable | Device | Probe Reference | Unit | Accuracy | Range |
| Air temperature (Ta) | Testo 480 0563 4800 | 12 Φ 0636 9743 | °C | ±0.5 °C | −20 to +70 °C |
| Kimo HD 100 | 13 Φ lg. 110 mm | °C | ±0.3 °C | −20 to +80 °C | |
| Relative humidity (RH.) | Testo 480 0563 4800 | 12 Φ 0636 9743 | % | ±1.0% | 0% to 100% |
| Kimo HD 100 | 13 Φ lg. 110 mm | % | ±1.8% | 5% to 95% | |
| Wind velocity (Va) | Testo 480 0563 4800 | Helix 100 Φ mm 0635 9343 | m/s | ±0.1 m/s | 0.1 to 15 m/s |
| Kimo LV 100 | Helix 100 Φ mm lg. 310 mm | m/s | ±0.1 m/s ±0.2 m/s | 0.2 to 3 m/s 3.1 to 35 m/s | |
| Fish-Eye Images Parameters | |||||
| Camera | Focal length | Resolution | Dimensions | Colors representation | |
| Canon EOS 6D | 8 mm | 72 ppp | 5472 × 3648 | sRGB | |
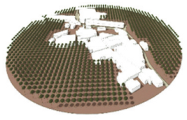
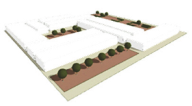
Table 3.
Input data for the three sites’ models in ENVI-met software.
| Old Neighborhood (S1) | Individual Housing Neighborhood (S2) | Multifamily Housing Neighborhood (S3) | |||||||
|---|---|---|---|---|---|---|---|---|---|
| Street orientation | 1 | 2 | 3 | 4 | 5 | 6 | 7 | 8 | 9 |
| N-S | E-W | N-S | E-W | N-S | - | - | N-S | E-W | |
| Model area | |||||||||
| Main Model Area | 240 m × 240 m | 120 m × 120 m | 120 m × 120 m | ||||||
| Grid size in meter | |||||||||
| dx = size of X grid | dx = 2 | dx = 2 | dx = 2 | ||||||
| dy = size of Y grid | dy = 2 | dy = 2 | dy = 2 | ||||||
| dz = size of Z grid | dz = 2 | dz = 1 | dz = 1 | ||||||
| Construction material | |||||||||
| Building material | Wall: brick wall (burned). Roof: lightweight concrete | Wall: cast dense concrete. Roof: lightweight concrete | Wall: brick wall (aerated). Roof: lightweight concrete | ||||||
| Soil | Road: asphalt. Natural surfaces: loamy soil | Road: asphalt. Pavement: concrete pavement grey. Pavement concrete used/dirty. Natural surfaces: loamy soil | Road: asphalt. Pavement: concrete pavement grey. Natural surfaces: loamy soil | ||||||
| Vegetation | Palm Trees: Palm, large trunk, dense, medium (15 m); Grass: 50 cm aver. dense | New deciduous Trees: spherical (small trunk. sparse. small (5 m)); Grass: 50 cm aver. dense | New deciduous Trees: spherical (small trunk. sparse. small (5 m)); Grass: 50 cm aver. dense | ||||||
| 3D model | 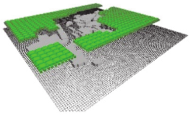 | 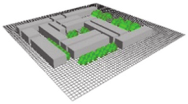 | 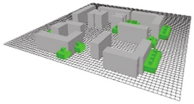 | ||||||
| Position | |||||||||
| Longitude (°) | 34.93 | same | same | ||||||
| Latitude (°) | 5.13 | same | same | ||||||
| Start and duration of the model | |||||||||
| Date of Simulation | 28–29/07/2018 | 25–26/07/2018 | 15–16/07/2014 | ||||||
| Start time | 00:00 | same | same | ||||||
| Total simulation time (h) | 48 | 48 | 48 | ||||||
| Initial meteorological conditions | |||||||||
| Full forcing | CSV data | same | same | ||||||
Table 4.
Summary of the validation of the simulated models (S1), (S2) and (S3).
| Sample | Indices | Point 1 | Point 2 | Point 3 | |||
|---|---|---|---|---|---|---|---|
| S1 | RMSE | 0.69 | 1.93% | 0.76 | 2.12% | 0.60 | 1.67% |
| MBE | −0.62 | 1.74% | −0.69 | 1.93% | −0.53 | 1.48% | |
| S2 | RMSE | 2.22 | 6.44% | 2.77 | 7.88% | 2.46 | 6.99% |
| MBE | −1.01 | 2.94% | −1.89 | 5.37% | −1.50 | 4.26% | |
| S3 | RMSE | 2.92 | 8.75% | 2.98 | 8.96% | 3.75 | 10.70% |
| MBE | −0.36 | 1.08% | −0.44 | 1.31% | −1.99 | 5.67% | |
Table 5.
Summary of the Physiological Equivalent Temperature (PET) values of the simulated models on 15th July 1986.
Table 5.
Summary of the Physiological Equivalent Temperature (PET) values of the simulated models on 15th July 1986.
| Date | Time | PET.—S1 | PET.—S2 | PET.—S3 | ||||||
|---|---|---|---|---|---|---|---|---|---|---|
| 1 | 2 | 3 | 4 | 5 | 6 | 7 | 8 | 9 | ||
| 0.32 | 0.18 | 0.56 | 0.39 | 0.42 | 0.67 | 0.87 | 0.78 | 0.64 | ||
| 15.07.1986 | 00:00 | 20.2 | 20.2 | 20.5 | 19.2 | 18.8 | 19.7 | 19.7 | 19.7 | 19.1 |
| 01:00 | 19.7 | 19.4 | 19.5 | 19 | 18.6 | 19.1 | 19.2 | 19.1 | 18.4 | |
| 02:00 | 18.8 | 18.8 | 18.8 | 18.4 | 18.6 | 18.5 | 18.5 | 18.5 | 18.1 | |
| 03:00 | 18.4 | 18.3 | 18.3 | 17.8 | 18.1 | 18 | 17.9 | 17.8 | 17.6 | |
| 04:00 | 17.9 | 17.9 | 18 | 17.1 | 17.6 | 17.3 | 17.1 | 17.1 | 17.5 | |
| 05:00 | 17.7 | 17.9 | 17.9 | 17.4 | 17.4 | 17.9 | 17.1 | 17.1 | 17.3 | |
| 06:00 | 17.6 | 17.2 | 17.4 | 17.5 | 17.2 | 17.9 | 17 | 17.2 | 17.1 | |
| 07:00 | 20.3 | 20.7 | 20.3 | 19.8 | 18.8 | 22 | 20 | 18.7 | 18.9 | |
| 08:00 | 25 | 25 | 24.9 | 23.2 | 23.6 | 29.9 | 23.9 | 23.8 | 23.3 | |
| 09:00 | 29.5 | 29.4 | 29.3 | 34.9 | 35.4 | 33.8 | 27.8 | 27.8 | 26.9 | |
| 10:00 | 32.6 | 32.5 | 32.6 | 38.7 | 35.1 | 34.9 | 36.5 | 29.4 | 29.2 | |
| 11:00 | 35.1 | 35.3 | 35.4 | 40.6 | 37.7 | 36.5 | 39.1 | 32.6 | 31.9 | |
| 12:00 | 41.4 | 41.5 | 41.6 | 38.1 | 40.1 | 36.4 | 37.2 | 38.9 | 39.8 | |
| 13:00 | 41.5 | 41.8 | 41.9 | 34.5 | 39.5 | 36.2 | 38.7 | 39.4 | 40.9 | |
| 14:00 | 44.8 | 45.1 | 45.1 | 36.7 | 36.7 | 40.4 | 40.2 | 42.1 | 37.1 | |
| 15:00 | 39.2 | 39.3 | 39.6 | 36.5 | 36.4 | 40 | 42.1 | 36.2 | 35.6 | |
| 16:00 | 39.4 | 39.6 | 39.6 | 36.4 | 44.6 | 39.1 | 43.7 | 37.3 | 36.5 | |
| 17:00 | 37.5 | 37.8 | 38 | 43.9 | 35.9 | 38.9 | 35.3 | 35.9 | 36.2 | |
| 18:00 | 35.5 | 35.5 | 35.5 | 41.9 | 33.8 | 35.6 | 33.7 | 33.9 | 33.5 | |
| 19:00 | 32.3 | 32.5 | 32.3 | 30.8 | 30.2 | 30.4 | 30.5 | 30.3 | 30.5 | |
| 20:00 | 27.5 | 27.4 | 27.4 | 27.1 | 25.7 | 25.1 | 26 | 26 | 26 | |
| 21:00 | 24.8 | 24.8 | 24.9 | 22.9 | 23.3 | 23 | 23.5 | 23.6 | 23.6 | |
| 22:00 | 23.6 | 23.4 | 23.5 | 21.4 | 21.8 | 22.1 | 22.1 | 22.4 | 22.3 | |
| 23:00 | 22.4 | 22.3 | 22.3 | 20.8 | 20.5 | 21 | 21.2 | 21.5 | 21.2 | |
| Thermal comfort stress level | 17–26 | 26–28 | 28–37 | 37–42 | >42 | |||||
| Neutral | Slightly warm | Warm | Hot | Very hot | ||||||
| No thermal stress | Slight heat stress | Moderate heat stress | Strong heat stress | Extreme heat stress | ||||||
Table 6.
Summary of the PET values of the simulated models on 15th July 2001.
| Date | Time | PET.—S1 | PET.—S2 | PET.—S3 | ||||||
|---|---|---|---|---|---|---|---|---|---|---|
| 1 | 2 | 3 | 4 | 5 | 6 | 7 | 8 | 9 | ||
| 0.32 | 0.18 | 0.56 | 0.39 | 0.42 | 0.67 | 0.87 | 0.78 | 0.64 | ||
| 15.07.2001 | 00:00 | 20.3 | 20.4 | 20.3 | 20.1 | 19.8 | 20.6 | 20.8 | 20.7 | 20.3 |
| 01:00 | 19.7 | 19.5 | 19.5 | 19.8 | 19.5 | 20.3 | 20.1 | 20 | 19.7 | |
| 02:00 | 18.9 | 18.8 | 18.8 | 19.2 | 18.9 | 19.6 | 19.6 | 19.5 | 19.4 | |
| 03:00 | 18.4 | 18.4 | 18.4 | 18.6 | 18.6 | 19.1 | 19 | 18.8 | 18.9 | |
| 04:00 | 18 | 17.9 | 18 | 17.8 | 18 | 18.8 | 18.3 | 18.3 | 18.8 | |
| 05:00 | 18 | 18 | 18 | 18.4 | 17.7 | 18.5 | 18.2 | 17.9 | 18 | |
| 06:00 | 17.6 | 17.3 | 17.3 | 17.8 | 18.2 | 18.7 | 18.1 | 18.2 | 18.5 | |
| 07:00 | 20.3 | 20.9 | 20.9 | 20.8 | 19.6 | 20.9 | 21.1 | 20.3 | 20.3 | |
| 08:00 | 25 | 25.1 | 24.9 | 24.6 | 24.5 | 30.8 | 26 | 25.1 | 24.7 | |
| 09:00 | 29.5 | 29.5 | 29.4 | 35.8 | 35.8 | 35.1 | 36.5 | 29.5 | 28.8 | |
| 10:00 | 32.6 | 32.4 | 32.6 | 39.2 | 37 | 36.4 | 37.9 | 31.9 | 31.2 | |
| 11:00 | 35.5 | 35.3 | 35.4 | 41.1 | 39.3 | 38 | 40.5 | 34.6 | 33.9 | |
| 12:00 | 41.6 | 41.5 | 41.6 | 39.8 | 41 | 41.4 | 41.8 | 36.9 | 42 | |
| 13:00 | 41.7 | 41.9 | 41.9 | 36.5 | 40.6 | 41.6 | 41.8 | 42.4 | 43.2 | |
| 14:00 | 45 | 45.2 | 45.2 | 38.5 | 38.5 | 43.7 | 44.3 | 43.8 | 43.8 | |
| 15:00 | 46 | 39.5 | 39.6 | 38.4 | 38.4 | 44.9 | 47.5 | 45 | 37.7 | |
| 16:00 | 39.6 | 39.6 | 39.6 | 44.6 | 38.4 | 46.5 | 48.7 | 38.6 | 38.6 | |
| 17:00 | 37.6 | 38 | 38 | 45.4 | 37.6 | 47.9 | 45 | 37.8 | 37.8 | |
| 18:00 | 35.6 | 35.6 | 35.6 | 43.2 | 35.5 | 46.2 | 35.5 | 35.7 | 35.4 | |
| 19:00 | 32.4 | 32.6 | 32.3 | 32.3 | 32 | 32.4 | 32.1 | 32.2 | 32.1 | |
| 20:00 | 27.3 | 27.7 | 27.4 | 27.6 | 27.4 | 26.8 | 27.1 | 27.7 | 27.7 | |
| 21:00 | 24.9 | 25.1 | 24.9 | 25.1 | 24.9 | 24.8 | 25 | 25.2 | 25.3 | |
| 22:00 | 23.6 | 23.5 | 23.5 | 23.4 | 23.5 | 23.8 | 23.7 | 24.2 | 24 | |
| 23:00 | 22.4 | 22.4 | 22.3 | 22.4 | 22.5 | 22.7 | 22.9 | 23.2 | 23.1 | |
| Thermal comfort stress level | 17–26 | 26–28 | 28–37 | 37–42 | >42 | |||||
| Neutral | Slightly warm | Warm | Hot | Very hot | ||||||
| No thermal stress | Slight heat stress | Moderate heat stress | Strong heat stress | Extreme heat stress | ||||||
Table 7.
Summary of the PET values of the simulated models on 15th July 2016.
| Date | Time | PET.—S1 | PET.—S2 | PET.—S3 | ||||||
|---|---|---|---|---|---|---|---|---|---|---|
| 1 | 2 | 3 | 4 | 5 | 6 | 7 | 8 | 9 | ||
| 0.32 | 0.18 | 0.56 | 0.39 | 0.42 | 0.67 | 0.87 | 0.78 | 0.64 | ||
| 15.07.2016 | 00:00 | 25.7 | 25.6 | 25.7 | 25.6 | 26 | 26.5 | 26.4 | 26.8 | 26.4 |
| 01:00 | 25.7 | 25.1 | 25.6 | 24.8 | 25 | 25.9 | 25.6 | 26.5 | 25.8 | |
| 02:00 | 25 | 24.7 | 24.9 | 24.3 | 24.2 | 25.6 | 25.5 | 25.8 | 25.4 | |
| 03:00 | 24.7 | 24.3 | 24.7 | 24.6 | 24.3 | 25.4 | 25.5 | 25.4 | 25.5 | |
| 04:00 | 23 | 22.7 | 22.8 | 23.6 | 23.5 | 24 | 23.4 | 23.7 | 23.7 | |
| 05:00 | 22.7 | 23 | 23.2 | 23.2 | 22.9 | 24.1 | 23.5 | 23.3 | 23.6 | |
| 06:00 | 25.1 | 25.3 | 25.5 | 25.1 | 24.6 | 26 | 25.9 | 25.4 | 24.7 | |
| 07:00 | 30.3 | 30.3 | 30.3 | 29 | 29.5 | 33 | 30.7 | 30.3 | 29.6 | |
| 08:00 | 34.5 | 34.8 | 34.8 | 33 | 34.5 | 35.8 | 34.4 | 34.4 | 34.4 | |
| 09:00 | 39.6 | 39.7 | 39.6 | 44.3 | 39.4 | 44.2 | 39.2 | 39.2 | 39.3 | |
| 10:00 | 43.4 | 43.2 | 43 | 46.3 | 42.6 | 48 | 46.9 | 42.2 | 42.2 | |
| 11:00 | 47.4 | 47.2 | 47 | 49.7 | 45.5 | 50.8 | 49.7 | 45.9 | 45.2 | |
| 12:00 | 52.6 | 52.3 | 52.9 | 51 | 49 | 53.4 | 51.6 | 51.6 | 51.9 | |
| 13:00 | 54.1 | 54.9 | 54.5 | 49.7 | 52.8 | 54.9 | 54.3 | 54.6 | 55 | |
| 14:00 | 59.5 | 59.2 | 59.7 | 52 | 51.3 | 55.8 | 58.2 | 57.9 | 53.7 | |
| 15:00 | 52.3 | 52.6 | 52.5 | 51.4 | 50.7 | 54.9 | 57.9 | 58 | 52.1 | |
| 16:00 | 52 | 52 | 51.9 | 57.2 | 51.7 | 55 | 58 | 52.4 | 52.1 | |
| 17:00 | 49 | 49 | 49 | 53.5 | 49.5 | 51.6 | 52.5 | 49.3 | 49.2 | |
| 18:00 | 44.8 | 44.8 | 44.7 | 46.4 | 44.5 | 45.1 | 47.1 | 45.1 | 45.1 | |
| 19:00 | 40.4 | 40.6 | 40.4 | 40.6 | 42.5 | 40 | 41.8 | 41.7 | 42.5 | |
| 20:00 | 37.9 | 37.8 | 37.9 | 38.7 | 39 | 39.1 | 38.3 | 38.5 | 39.6 | |
| 21:00 | 36.6 | 36.6 | 36.7 | 38.5 | 36.6 | 38.7 | 37.6 | 37.6 | 38 | |
| 22:00 | 33.6 | 33.7 | 33.7 | 35 | 33.7 | 35.1 | 34.7 | 34.3 | 34.2 | |
| 23:00 | 31.5 | 31.5 | 31.5 | 31.3 | 31.9 | 33.2 | 32.5 | 32.6 | 32.4 | |
| Thermal comfort stress level | 17–26 | 26–28 | 28–37 | 37–42 | >42 | |||||
| Neutral | Slightly warm | Warm | Hot | Very hot | ||||||
| No thermal stress | Slight heat stress | Moderate heat stress | Strong heat stress | Extreme heat stress | ||||||
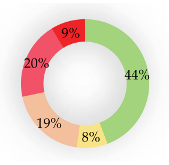
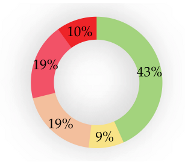
Table 8.
Evolution of heat stress levels within the sites during the three periods TMY2, TMY3, and TMYx.
Table 8.
Evolution of heat stress levels within the sites during the three periods TMY2, TMY3, and TMYx.
| Sites | TMY2 | TMY3 | TMYx | ||||
|---|---|---|---|---|---|---|---|
 |  |  |  | ||||
 |  |  |  | ||||
 | 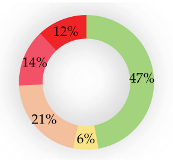 | 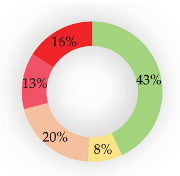 | 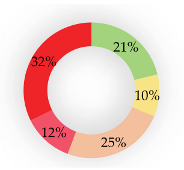 | ||||
| Thermal comfort stress level | 17–26 | 26–28 | 28–37 | 37–42 | >42 | ||
| Neutral | Slightly warm | Warm | Hot | Very hot | |||
| No thermal stress | Slight heat stress | Moderate heat stress | Strong heat stress | Extreme heat stress | |||
Publisher’s Note: MDPI stays neutral with regard to jurisdictional claims in published maps and institutional affiliations. |
© 2021 by the authors. Licensee MDPI, Basel, Switzerland. This article is an open access article distributed under the terms and conditions of the Creative Commons Attribution (CC BY) license (http://creativecommons.org/licenses/by/4.0/).
Share and Cite
MDPI and ACS Style
Matallah, M.E.; Alkama, D.; Teller, J.; Ahriz, A.; Attia, S. Quantification of the Outdoor Thermal Comfort within Different Oases Urban Fabrics. Sustainability 2021, 13, 3051. https://doi.org/10.3390/su13063051
AMA Style
Matallah ME, Alkama D, Teller J, Ahriz A, Attia S. Quantification of the Outdoor Thermal Comfort within Different Oases Urban Fabrics. Sustainability. 2021; 13(6):3051. https://doi.org/10.3390/su13063051
Chicago/Turabian StyleMatallah, Mohamed Elhadi, Djamel Alkama, Jacques Teller, Atef Ahriz, and Shady Attia. 2021. "Quantification of the Outdoor Thermal Comfort within Different Oases Urban Fabrics" Sustainability 13, no. 6: 3051. https://doi.org/10.3390/su13063051
Note that from the first issue of 2016, this journal uses article numbers instead of page numbers. See further details here.