1. Introduction
Technological innovation has had an important role in supporting economic growth, creating new job opportunities, and enhancing societal well-being, and also technological innovation has been of interest to most researchers and policy makers for long periods. Interestingly, innovation creates opportunities in developed countries as well as in less developed countries [
1,
2]. Therefore, the creation of innovative technologies and ideas created by people is fundamental to advancement in all sectors and aspects of human life [
3]. Consequently, human resources are responsible for innovation, and it affects it greatly in countries with limited natural resources, or rich countries. The important thing here is how to manage and develop human capital. Despite most people believing that natural resources are the main source of income for any country, there are many countries that do not possess many natural resources but have high economic growth and economic development in all fields; this is due to the interest in human capital in terms of education and training [
4]. Hence, human capital refers to the knowledge and skills possessed by manpower that provides potential or actual economic value [
5].
Moving forward in the same context, the concept of foreign direct investment has recently evolved to include not only the transfer of money from one country to another, but also a mixture of financial and intangible assets such as technology, management capabilities, skills, marketing, etc. [
6,
7]. Hence, attracting foreign direct investment is an intermediate goal that economic policy makers in developing countries, work to achieve as an effective means of job creation, technology transfer, and skills improvement. Therefore, this works to correct labor market imbalances and build new productive capacities, in order to achieve the ultimate goals of the economic policies of growth and economic prosperity. Over the last two decades, foreign direct investment (FDI) funds from developing countries have grown at an annual average higher than those from developed countries, and their outward stock has increased more than 15 percent of the world’s outward stock of FDI compared to less than 10 per cent in the 1990s [
8,
9]. Globally, foreign direct investment plays an important role in transferring the new technology to the host country and accordingly leads to higher productivity and economic growth. Further, this positive spread came mainly from the interaction of the multinational companies with the local suppliers and customers, as well as from the imitation of technology and knowledge from the local manufacturers competing with these companies. As multinational companies will be concerned with protecting their competitive advantage among enterprises in the same industry, in addition, they are also interested in improving the efficiency and product quality of the suppliers they do business with. Consequently, foreign direct investment affects economic growth and development in a direct way by contributing to the formation of total fixed capital, and indirectly through the channels that constitute external influences related to foreign direct investment [
10,
11].
In general, the influx of foreign direct investment has become a global phenomenon, with many developed and developing countries alike competing for the largest share of this inflow. Economic globalization and the opening of export markets have increased the need to raise the competitiveness of countries to increase their share of exports, and therefore foreign direct investment here plays an important role in narrowing the technological gap between developing and developed countries through technology transfer. It also helps it reach overseas markets as a base for exporting and distributing products abroad. Because of the multiple benefits, developing countries have put in place a number of policies to facilitate the flow of foreign direct investment, such as encouraging investment, facilitating foreign trade procedures, and developing export areas [
12,
13]. In addition to foreign direct investment, innovation and technological progress are considered in growth theory as major determinants of economic growth. Technological progress stimulates economic growth by creating external factors that compensate for the decrease in capital [
14], improving the efficiency of capital in production due to the technical change contained in capital assets, and enhancing the spread of knowledge produced in society, which helps to increase the level of productivity of the economy. We also see technological improvements as a conduit for moving international trade and attracting multinational companies [
15], and enhancing competition between domestic and foreign firms [
16,
17]. Therefore, efforts should be made to ensure the development of human resources and qualifications to support economic growth. On the other hand, inflation rates increased in Egypt as a result of the depreciation of the local currency, the increase in dependence on commodity imports, and thus the widening of the trade balance deficit, which led to a decline in Egypt’s GDP [
18]. Here, technological innovation and foreign direct investment play an important role, especially in the development process in Egypt, as they act as a supplement to domestic savings and as an alternative to external borrowing, the consequent burden that drains the returns achieved from production factors. Moreover, the flow of these investments is often accompanied by the transfer of expertise in modern technology management. This contributes to increasing productivity and improving the competitiveness of existing industries, as well as creating new industries, which leads to the creation of more job opportunities and the exploitation of the resources available to the state.
However, considering the positive positions foreign direct investment can play in achieving economic growth, some research findings illustrate the negative effect of FDI inflows on efforts to innovate and the current account deficit. As a result, according to them, FDI is behaving adversely on economic development. Indeed, companies that conduct such investment possess market leverage and are thus able to limit competition and economic growth. From this viewpoint, FDI will create a wasteful distribution of capital due to distortions correlated with government interference in the host nation in the context of price regulation [
19]. Similarly, the introduction of foreign direct investment in a state does not really have a positive effect on local enterprises and associated skills. Instead, they could suffer a dramatic decrease in productivity. In particular, we may conclude that the economic literature is pointing to a contentious outcome. In order to explain this correlation, it may be argued that FDI will lead to stronger economic development if a certain level of technological innovation (INV) is reached.
Furthermore, economists differed on the interpretation of the relationship between foreign direct investment and economic growth, as there are those who consider the level of economic growth as the determining factor for foreign direct investment. In addition, the large influx of foreign direct investment inward leads to high economic growth, and the opposite is true, and through this reference is made to several relationships that explain the relationship between foreign direct investment and economic growth [
20,
21].
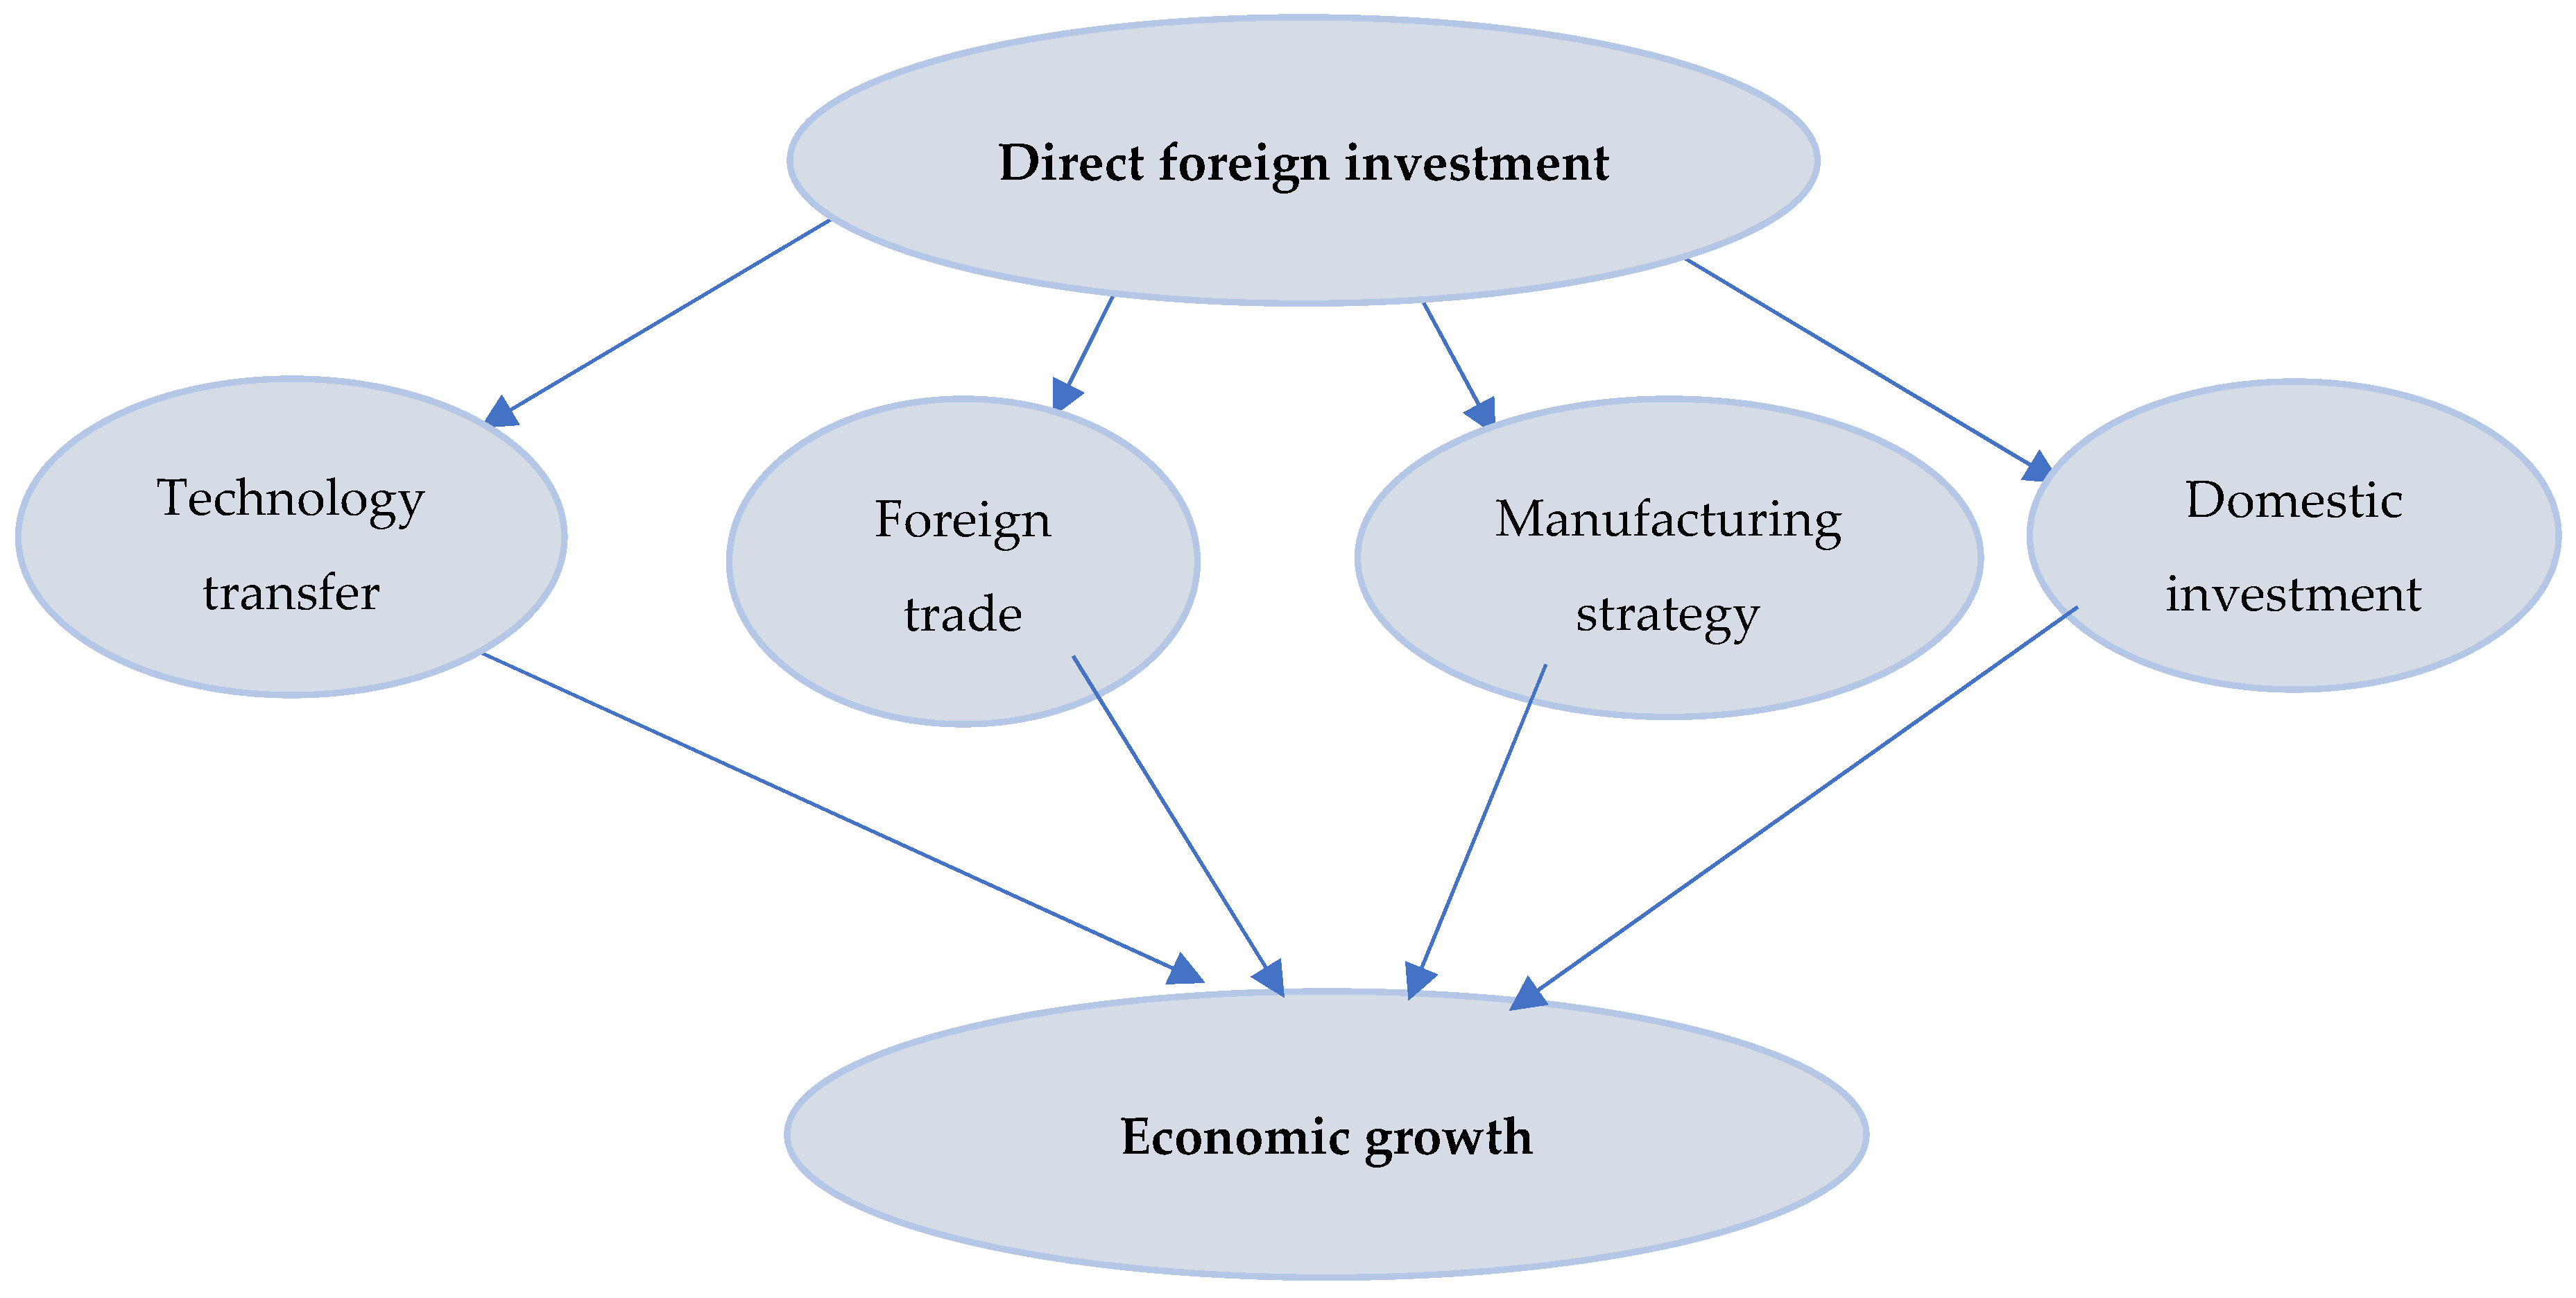
From
Figure 1 it can be seen that technological progress helps create competition between local companies and branches of foreign companies, thus expanding and spreading technology and transferring skills from branches of foreign companies to local companies, which leads to an increase in productivity of local companies and thus an increase in the rate of economic growth, while foreign trade represents the channel through which foreign direct investment is affected by economic growth in host countries. Therefore, each of them stimulates the other, that is, there is a causal relationship. The presence of export incentives in the host countries may stimulate the flow of foreign direct investment in those countries. Moreover, the presence of foreign direct investment may stimulate more imports to meet its production requirements that have not been produced in the domestic market of the host countries [
22].
Perhaps one of the most prominent tools for technology transfer is foreign direct investment, especially since multinational companies are the main source of research and development in the developed world. Their total expenditure on research and development are equivalent to about 80% of the total expenditure allocated for this purpose in all parts of the world. By encouraging multinational companies to invest within them, developing countries hope to generate the indirect effects of transferring the accompanying technology, as the impact of technology associated with foreign direct investment on stimulating economic growth depends on the extent of their contribution to creating returns for local companies, or the so-called positive external effects and the extent of substitution or complementarity between modern technology associated with foreign direct investment and technology applied in local companies in host countries [
23]. The positive indirect effects of foreign direct investments in economic growth are realized if these investments are accompanied by external effects that lead to an increase in the productivity of labor and capital in these countries. The positive external effects that accompany foreign direct investment are achieved through four channels.
Competition channel: The competition channel focuses on the fact that the entry of foreign companies into the host countries leads to an increase in competition in the domestic market of these countries. This pushes national companies towards using the existing technology in more efficient ways by modernizing their technological base in accordance with the modern technology applied in the field of production of competing companies.
Imitation channel: This is based on the idea that local companies in the host countries will become more productive by imitating the most advanced technologies or management practices of foreign companies available in these countries. The effects of imitation occur through the transfer of labor from foreign companies to local companies, with workers who have received ample training in the use of modern technology in foreign companies in the host countries.
Training channel: The transfer of technology from the parent company to the branches operating in the host countries is not only embodied in machinery, equipment, and patents, but also involves the transfer of managerial and technical skills and training for work elements from the host country. Rather, the transfer of these skills is not limited to workers in the company itself but extends to workers in local companies that deal with that foreign company. The need for a training channel for human capital increases in the host countries in the event of the introduction of new technology, as the adaptation of technology to local conditions can only come with the presence of a trained and qualified workforce in a way that makes them able to absorb and use this technology. In addition, the competition imposed by the foreign company motivates local companies to train their own workers, in addition to the possibility of benefiting from trained and qualified workers that transfer from foreign companies to national companies [
24,
25].
Channel links: The technology transfer and dissemination process take place through the front and backlinks that occur between foreign companies and local companies. As for front links, they are established through direct foreign companies’ transactions with clients. These links lead to an increase in the technical progress of local companies. Foreign companies spend on research and development to the extent that it leads to the production of new products, and this matter stimulates local companies wishing to compete to increase their expenditures for research and development. As for backlinks, they are established through foreign companies’ transactions with local companies. These links lead to the transfer of new technology to local companies through foreign companies obtaining their resources, raw materials, and intermediate goods from national suppliers (local companies), as well as the work of multinational companies to provide technical assistance, training, and other information to improve the quality of products and vendors. In the same context, many multinational companies are helping local suppliers to purchase raw materials and intermediate goods and modernize or improve production facilities. Egypt, as a developing country, is working hard towards that, encouraging the flow of more foreign direct capital to obtain foreign capital, and making use of advanced technology and company formation management skills. Foreign companies bring modern technology to motivate local companies wishing to maintain market share and stability in front of companies. Local and foreign companies that are highly competitive can achieve their goals by developing production methods or local simulations. The positive effects through which technology transfer from foreign direct investment takes place take the following forms, as shown in
Figure 2.
From the previous figure, it is clear that the research and development activities that accompany foreign direct investment create competition within the host countries, which leads to encouraging local companies to increase their research and development activities. This leads to an increase in the volume of new knowledge and as a result of this, improvement of the quality of the existing products and the production of new products on the one hand and the productivity of the factors of production on the other hand, which leads to achieving high growth rates [
26].
Based on the foregoing, the study problem can be raised, represented in the following:
What is the impact of technological innovation and foreign direct investment on economic growth in Egypt?
The two research hypotheses can be formulated as follows:
There is a positive significant relationship between foreign direct investment and economic growth in the long and short term for the Egyptian economy.
There is a positive significant relationship between technological innovation and economic growth in the long and short term for the Egyptian economy.
The aim of the study was to provide a detailed description of the relationship between foreign direct investment, technological innovation, and economic growth in the Arab Republic of Egypt, in addition to testing that relationship using the autoregressive distributed lag (ARDL) model for simultaneous integration during the period 1990–2019. The findings of this research can be useful in developing a long-term strategy to support sustainable development through knowing which of the independent variables has the most impact on Egyptian economic growth. To answer the above question, we will present the remainder of the paper on the following axes. The first axis will be presenting the literature of previous empirical studies. The second axis is defining the model and the data used. In the third axis, we present the evaluation strategy, and in the fourth the evaluation results. Finally, comes the fifth axis discussing the results of the study.
Our study contributes to the literature in the following ways. Firstly, to our knowledge, this is the first study that finds a systematic relationship between technological innovation, foreign direct investment, and growth in the Egyptian economy. There are many studies that talk about the relationship between technological innovation and economic growth, or studies that talk about the relationship between foreign investment and economic growth. As for our study, it combined technological innovation with foreign direct investment, especially in the Egyptian economy. Second, we document this through the results of the study, so we find the Technological Innovation Index is expected to have a positive effect on countries, while the results were completely different. In the short term, it was not significant in the model, and in the long term, it had a negative impact on the Egyptian economy, which means Egypt needs more of these studies to find out the reasons for the weakness of the economy, like many developing countries.
2. Theoretical Foundation and Review of the Literature
Before defining the main dimensions of the relationship between foreign direct investment and technological innovation and knowing their impact on economic growth, it is important to investigate the results that are most relevant to the concept of foreign direct investment, long-term economic growth, and technological innovation.
The economic literature describes a variety of channels whereby the FDI creates economic growth. Neoclassical growth theory suggests that foreign investment raises the wealth in host nations through multinational companies. This will allow faster growth than would have been possible due to counting on domestic savings. According to the context of the theory of endogenous expansion, technological innovation boosts economic growth by creating externalities that compensate for diminishing returns on capital [
14]. The general understanding of MNEs is twofold: first, they play a dominant position in research and development operations and in the generation of emerging innovations, and they have a strong impact on local economies. As a result, their actions have stimulated a wide discussion, making the issue of the domestic implications of their activities one of the most frequent questions raised by field researchers, such as Anwar, S. and S. Sun, (2011), Hassen, S. and O. Anis (2012), and Dunning, J.H. and S.M. Lundan (2008) [
27,
28,
29]. The previous studies were divided into three groups as follows:
First, there is foreign direct investment and its relationship to economic growth. Among the most important studies that focused on this aspect, Richardson’s (1997) study concluded that foreign direct investment had a major role in stimulating economic growth in Southeast Asian countries through its role in increasing the total productivity of the factors of production using the accompanying modern technology, as well as its role in increasing the exports of these countries and the availability of skilled labor in the host countries. The foregoing leads to an increase in economic growth rates by contributing to the growth of productivity and exports in the host countries [
30]. However, it is noted that these effects differ according to the characteristics of the industry and the political environment in each host country separately. The same previous effect occurred in terms of the effect of increasing the rate of economic growth in Cameroon due to positive external influences, while Hoekman and Djankov found the same effect as before when applying to Czechoslovakia. Testing the data used from 12 Asian economies during the period from (1987–1997), it was found that the total foreign direct investment flows affect economic growth significantly. As for the classification of the types of flows that entered these economies, it was found that foreign direct investment, only in the manufacturing sector, does have a large and positive impact on economic growth and the characteristics of this effect are the positive contribution to the side effects of foreign direct investments [
31]. Moreover, the study by Elkomy et al. (2020) examined the main role of foreign technology in the growth of domestic productivity in Egyptian manufacturing industries during the period 2006 to 2009, and the study concluded that only technologically intensive industries in Egypt have the absorptive capacity to effectively absorb foreign technology [
32].
Gui-Diby, S.L.’s (2014) study focused on testing the effect of foreign direct investment on economic growth in 50 African countries using the GMM (Generalized Method of Moments) approach for the period from 1980–2009, and the results of the assessment found that foreign direct investment had a significant impact on economic growth in the African region. During the respective period, she also mentioned that the low level of human resources does not limit the impact of foreign direct investment, and that foreign direct investment was negative during the period 1980–1994 and positive during the period 1995–2009 [
33]. In addition, Su, Y., and Z. Liu (2016) focused on the determinants of economic growth, focusing on the role of foreign direct investment and human capital using panel data for some Chinese cities during the period 1991–2010. The results concluded that the rate of growth in per capita GDP is inversely related to the rate of population growth and is positively related to the rate of investment in physical and human capital. Foreign direct investment also has a positive effect on the rate of per capita GDP [
34]. The study of S. Dilek, which focused on analyzing the relationship between foreign direct investment and economic growth in Turkey using the VAR (The vector autoregression) model between the period 1980–2013, where foreign direct investment was used as a dependent variable, inflation rate, GDP, share of loans granted to the sector, found a short-term causal relationship between foreign direct investment, inflation, and loans granted to the private sector, and a long-term causal relationship between foreign direct investment and GDP, loans granted to the private sector, and enrollment rate in secondary schools [
35]. Topallı, N.’s (2016) study, which aimed to analyze the relationship between foreign direct investment, trade openness, and economic growth in the BRICS countries (Brazil, Russia, India and China) and Turkey during the period 1982–2013 using the unit root simultaneous integration and causation test, found the existence of two-way causation between economic growth and trade openness, and the existence of a two-way causal relationship between foreign direct investment and economic growth [
36]. Arısoy, İ.’s (2012) study focused on estimating the contributions of foreign direct investment to economic growth, and if the foreign direct investment was on the overall productivity in Turkey during the period 1960–2005, using econometric methods. The experimental results indicated that foreign direct investment contributes positively to overall productivity and economic growth through capital accumulation and technology transfer [
37]. The John Isaac Emmanuel (2016) study examined that relationship in Nigeria during the period 1981–2015 using multiple regression techniques and using the standard analysis program, Gretel. It concluded that foreign direct investment has a positive and significant impact on the gross domestic product. It was also found that the exchange rate has a positive effect, but does not have a significant effect on the GDP [
38]. Furthermore, Haque et al. (2017) reached the same results, which is the existence of a positive relationship between foreign direct investment and the gross domestic product in Kuwait, and statistical tools such as correlation, analysis of variance (ANOVA), and regression were used [
39].
The study by Habibi, F. (2017) aimed to find out whether foreign direct investment affects economic growth in the Gulf Cooperation Council (GCC) during the period 1980–2014 using the ARDL methodology and concluded that foreign direct investment is one of the main engines of economic growth in Iran and the GCC countries. The border test result also indicated a stable long-term relationship between foreign direct investment and gross domestic product (GDP) in Iran and for each country in the Gulf Cooperation Council. The results of the Granger causality test also indicated a two-way causal relationship from foreign direct investment to real GDP growth in Qatar, Saudi Arabia, and the United Arab Emirates, and a one-way causal relationship from foreign direct investment to the rate of real GDP in Kuwait and Oman [
40]. The study by Mohamed et al. (2017) found a negative relationship between foreign direct investment (FDI) and economic growth. This study examined that relationship in the Somali economy by using detailed sectoral data of foreign direct investment flows to Somalia during the period 1980–2015 using multiple regression to measure the relationship between the independent variable (FDI) and dependent variables (macroeconomic indicators) [
41]. The study by Demirsel et al. (2014), aimed to verify the relationship between foreign direct investment and GDP in Turkey during the period 2002–2014 by using the unit root test and the Johansen method of cointegration, the study concluded that there is no long-term relationship between these variables [
42]. The same results were reached by a Gerceker (2015) study in Turkey using the same methodology, but during a different period of time (1998–2014) [
43].
Second, there are studies of technological innovation and its relationship to economic growth. In the globalization of the global economy, technological differences explain the reason for the difference in economic growth and income inequality between countries. The goal of science and technology is to enable companies and individuals to use more efficient technologies because this leads to lower costs and increased productivity. Among the most important studies that focused on examining the relationship between technological innovation and economic growth, we find E. Saridogan, S. Sener (2011), M. Adak (2015).
M. Adak’s study (2015) focused on the impact of technological progress and innovation on the Turkish economy, as quantitative methods were used to analyze the relationship between technology investments and economic growth. Econometric results showed an impact of advancement and technological innovation in economic growth [
44]. The study of E. Saridogan, S. Sener (2011) focused on the implications of technological innovation directed at global competitiveness strategies and the mechanism of economic growth transmission for high-income OECD countries. It was found that countries with a technological innovation wave of global competitiveness strategies have sustainable competitiveness, long-term growth, and the ability to design economic policies’ [
45]. Vu, K.M.’s (2013) study focused on realizing a comprehensive measure of the contributions of information and communication technology to the economic growth of Singapore during the period 1990–2008. Three main results were obtained, first, the existence of a strong positive relationship between the intensity of the use of information and communication technology and the growth of value-added productivity and work at the sector level; second, the investment of information and communication technology contributed approximately 1% of the GDP in Singapore during 1990–2008, and its role in driving economic growth became increasingly important over time; and third, the contribution of information and communication technology to the manufacturing sector was noticeable in achieving growth in Singapore but it retreated in light of the challenges of restructuring [
46]. The study by Dhrif (2015) aimed to examine the relationship between foreign direct investment, technological innovation, and economic growth using a simultaneous equations model to describe the reciprocal relationship between foreign direct investment, technological innovation, and economic growth of 83 developed and developing countries during the period 1990–2012. It concluded that there is a positive and significant impact of foreign direct investment on economic growth only in middle- and high-income countries, while foreign direct investment in low-income countries does not have a positive impact on these economies. It also concluded that technical advancement plays a significant role in deciding the relationship between foreign direct investment and economic growth [
47].
Third, there are studies on foreign direct investment, technological innovation, and economic growth. Foreign direct investment can affect technological innovation in host nations through a variety of mechanisms: backlinks, forward links, competitive impacts, demonstration, effects, impacts on the development of human resources, and the diffusion of information through brains [
48].
Backlinks: Multinational corporations (MNCs) will provide locally sourced inputs and services. These links are good opportunities for spillover from multinational corporations. In this case, subsidiaries of multinational companies provide information on international quality standards and can even support local service providers through financial assistance, technology transfer, training, and information and knowledge exchange [
49]. Forward links: The subsidiaries of the multinational company sell products to local customers thus leading to a transfer of knowledge (especially in the case of selling capital equipment) by providing training in order to learn to operate and maintain the equipment. The competitive influence of multinational companies often enters local markets and competes with local companies. This can motivate local companies to increase their efforts to improve the technologies that allow them to do so, increasing competitiveness. However, this competitive effect could threaten local firms exiting the market (crowd-out effect). Demo effect: The subsidiaries of multinational companies are distinguished by the high quality of their technology and management practices. Local firms are likely to benefit if they set out to monitor, copy, and adapt these technologies and practices. Impacts on human capital formation: The subsidiaries are linked to national research and education institutions to ensure an adequate supply of human resources. In this case, MNCs provide funding for students and access to new technologies [
50]. Moreover, employment opportunities in subsidiaries of multinational companies may encourage students to choose science and technology fields. As long as multinational companies do not absorb all graduates, this may lead to increased availability of skilled labor. Spreading knowledge through employee mobility: Multinational companies are characterized by the use of advanced technologies and the application of modern management practices and their employees learn by practice and receive additional training in order to meet skill requirements. Thanks to labor mobility, knowledge and skills are being disseminated in the host economy [
49]. Moreover, former employees can use this knowledge to set up their own businesses, thus enriching the economic structure.
However, the indirect technological fallout that foreign firms generate on domestic firms may be less than expected. In fact, sometimes multinational corporations are not ready to transfer the most advanced technology because they fear losing intellectual property and future competing companies that learn new technologies [
51]. From a multinational corporate viewpoint, it would make sense to transfer outdated technology. These older technologies have additional benefits. They are less complicated and require less skilled personnel in the host country, they are less expensive and easier to interpret. The limits to the success of technology transfer from multinationals are also on the host country side. Indeed, the technological capabilities of the recipient firms in developing countries and the skills of their employees often prevent an immediate understanding of advanced technologies [
52]. In addition, communication barriers (different languages and methods of individual interaction) may impede effective technology transfer.
In light of these arguments, it is not shocking that despite this, possible benefits of international technology transferring the results of empirical works on the impact of FDI on innovation are mixed. In what follows, we review literature according to three groups of studies: those which find positive effects, those which find negative effects, and those which show a non-linear effect in the relationship between FDI and innovation. In the first group, we reference the Sjoholm (1999) study [
53], which indicates that FDI is advantageous to companies in Indonesia. Using data on US manufacturing companies during the period 1987–1996, the Keeler and Yeaple (2009) study showed that the ramifications from foreign multinationals to US firms could explain a large portion of manufacturing productivity growth in the United States [
54]. Branstetter’s study (2001) concluded that foreign direct investment encourages the spread of technology through subsidiaries that bring technology from their countries of origin and through multinational companies that facilitate the learning of foreign technologies. In addition, it found positive effects of foreign direct investment on the number of patents in China; data on Japanese foreign direct investment in the United States [
55], in the study by Cheung and Lin (2004). In contrast, in the second set of studies, Chen (2007) showed that spillover effects in China are not as important as previously thought. In fact, the effect of FDI on regional innovation capacity is found to be weak: the entry of FDI is not significant in improving domestic innovation capacity. Moreover, FDI inflows can have crowding-out effects on innovation and national R&D activity. Using residents of UK manufacturing companies [
56], Aitken and Harrison (1999) also found that foreign participation in a firm’s capital is positively related to productivity only in the case of small firms. However, they did not find indirect effects related to joint ventures of companies without foreign participation with lower productivity due to foreign direct investment, and that was in Venezuela [
57]. Regarding the third and final group of studies, it indicates that technology transfer through foreign direct investment needs the absorption capability of host countries. A firm’s absorptive capacity is “the ability to recognize the value of new information, assimilate and apply it for industrial purposes” [
52]. Sinani and Klaus (2004) analyzes the relationship between foreign presence and productivity through the host country’s human capital and emphasizes human capital’s catalyst impact of this association. Similarly [
23], Yokota and Tomohara (2010) find that the transition of technology through FDI relates to the resources of the professional labor force of host countries [
58]. Monasteries and Alegria (2011) investigated the existence of a significant effect of the technological distance between the investing country and the host country, and the ability of the host country to absorb it in the field of technology transfer through FDI [
59]. The study by Xu (2000) provided a comparison of the effects of foreign direct investment caused by US multinational corporations on the national productivity level of the host country between developed and developing countries. After performing a longitudinal analysis using data collected from 40 countries from 1966 to 1994 in which multinational corporations were operating in the United States, it found that multinational corporations in the United States contribute to productivity growth in developed countries but not in low-growth countries [
60].
After reviewing the previous literature, we found that there are deficiencies in the studies on Egypt in researching the relationship between technological innovation and foreign direct investment and the extent of the contributions of these independent variables to the dependent parameter, which is economic growth. Next, we present the motives for the current research based on the two hypotheses and results of the most relevant literature and we proceed to define experimental methods aimed at finding answers to the fundamental questions of the study.
5. Discussion
This study aimed to measure the impact of technological innovation and foreign direct investment on economic growth in the short and long term in the Egyptian economy during the period 1990–2019. To achieve this goal, the unrestricted error correction model was applied by using the proposed bounds testing approach to cointegration, Pesaran et al. (2001), and the autoregressive distributed lag (ARDL) approach proposed by Pesaran and Shin (1999) with the aim of estimating long and short-term elasticities.
To test the effect of foreign investment and technological innovation on economic growth, an unrestricted error correction model was estimated in which the impact of each of the factors on economic growth in the short and long term was tested (the inflation index that was presented in the model to assess the impact of macroeconomic stability on economic growth, the technological innovation index, total capital formation, incoming foreign direct investment, and human capital).
The most important results of this study are summarized as follows: (1) The presence of a significant positive (negative but not significant) impact of foreign direct investment on economic growth in the long and (short) terms; (2) the presence of a negative and significant impact of inflation on economic growth in the long and short term; (3) the presence of a strong positive and significant effect of total capital formation on economic growth in the long and short term; (4) the presence of a negative significant (positive and non-significant) effect of the innovation index on the rate of economic growth in the long term (short term); and (5) the presence of a little positive significant effect of capital on economic growth in the short and long term. In this axis, we will try to provide explanations for the results obtained, as we have concluded that foreign direct investment and total capital formation positively affect economic growth, while the impact of human capital and the innovation index was weak in the Arab Republic of Egypt during 1990–2019.
Our study found that the value of an incoming foreign direct investment and the total formation of capital had a significant positive impact on economic growth in the Arab Republic of Egypt in the long run. This means that the promotion of economic growth comes through foreign direct investment and the total formation of capital. While human capital has had a positive impact on economic growth, it is weak. This result does not agree with previous studies, this means that the Egyptian economy is in urgent need of attention to the human element, whether in terms of training or meeting the requirements of the Egyptian labor market. Another interesting finding is that, contrary to our expectations, the Egyptian Innovation Index was not a positive sign, but it was a negative sign. One possible explanation for this finding might be that the Egyptian economy did not meet the requirements of the Global Innovation Index. Another possible reason is the failure to provide the appropriate capabilities to encourage and stimulate investment in scientific research and technological development to build and maximize competitiveness. Therefore, the results were consistent with what was reported in previous studies (Richardson, P. (1997), Gui-Diby, S.L. (2014), Su, Y. and Z. Liu, (2016), Arısoy, İ. (2012), and Haque, A., A.K et al., (2017)) and were inconsistent with what was mentioned in the studies by Mohamed, M, et al. (2017), Demirsel, et al. (2014), and Dehrifi, A (2015)).
The development of the influx of foreign direct investments in the Egyptian economy.
The Egyptian economy has witnessed a remarkable increase in the flow of foreign direct investments over the past few years, and this is due to the many reforms that were made at the macro-economic level, which contributed to improving the investment climate. These reforms, especially in the field of facilitating investment procedures, led to an increase in the number of founding companies as well as the expansion of the already existing companies, which led to an increase in the net inflows of foreign direct investment during the period from 2004 to 2010.
The influx of foreign investments increased during the period from 2001 to 2009 until it reached about 71% of the total flow of direct foreign investment during the period from 1975 to 2009, and this is due to the legislative reforms undertaken by Egypt.
The Egyptian government is constantly trying to increase foreign direct investment, and in 2011, the year of the January 25 revolution, we notice that the influx of foreign investment coming into Egypt was negative, reaching a rate of (−0.20), which rose to (2.973) in 2019, as shown in
Figure 6. Consequently, Egypt needs more flows of foreign direct investment in order to stimulate economic growth, creating more job opportunities, and reducing poverty, in addition to the urgent need for methods of modern technology. Thus, foreign direct investment can play an effective and fundamental role in the development process in Egypt, as a complement to domestic savings and as an alternative to external borrowing and the subsequent burdens that drain what is achieved, in addition to the fact that the flow of these investments is often accompanied by the transfer of expertise in management and modern technology, which it contributes to increasing productivity and improving the competitiveness of existing industries, as well as creating new industries that lead to the creation of more job opportunities and the exploitation of available resources.
With regard to the multinational companies operating in Egypt (companies with foreign capital in thousands of pounds), it is noted that the activity of multinational companies operating in Egypt in recent years has increased as a result of the Egyptian government working to complete the process of privatization and openness to the global market, as the number of multinational companies reached according to the annual report of the Investment and Free Zones Authority for the year 2002/2003, which contributed to companies that were established in the industrial field according to the investment law, about 175 companies with issued capital amounted to 7 billion pounds and their investment costs exceeded 11 billion pounds, and these companies contributed about 37 thousand pounds. These companies were distributed as follows: 10 companies in the textile industries, 23 in the food industries, 35 companies in the chemical industries, 64 companies in the engineering industries, 6 companies in the building materials industries, 19 companies in the metal industries, and 18 companies in the pharmacokinetics industries. It is also noticeable that the percentage of foreign contributions increased, whether in companies that were established in accordance with the Investment Law No. 8 for the year 1997 or according to the Companies Law No. 159 of 1981 It rose from 14.3% in 2002 to 25.7% in 2003, and from 4.8% in 2002 to 18.3% in 2003, respectively. We also find that human capital, according to the theoretical and applied literature, can contribute to economic growth. The economic literature has differed regarding the most important indicators of human capital, as some studies use the average years of schooling as an indicator of human capital, while other studies use government spending on education as an indicator. Some studies have sought to use the number of enrolled students in primary, secondary, and university education as indicators of human capital. Likewise, some studies have used health and education as indicators of human capital. In our study, we use average high school years in the total population. The weak positive impact of human capital can be explained by the fact that learning in Egypt does not meet the requirements of the labor market.
Based on the previous findings of the study, and in light of the challenges that the Egyptian economy is facing at the current stage, the study concludes with a number of recommendations regarding the relationship between foreign direct investment, inflation, gross capital formation, innovation index, and human capital. The results previously showed that there is a positive relationship between foreign direct investment as an independent variable and economic growth as a dependent variable, whereby an increase in foreign direct investment leads to an increase in economic growth at an increasing rate. Therefore, there is no doubt that the Egyptian government has a very positive outlook and full of optimism and confidence towards foreign investment, and the importance of attracting it to Egypt to bridge the gap between national savings and the investments needed to achieve economic growth. Based on the experimental analysis conducted in our study, we believe that it is necessary to do the following:
- -
Attention to attracting foreign investments to the education sector and through partnerships with the government sector, in a way that contributes to providing qualified and skilled manpower that can easily enter the labor market and attract more investments.
- -
Stimulating foreign direct investment based on innovation and technology transfer, such as the informatics, communication, and information technology sectors, because even if it did not achieve the goal of increasing growth in the short term, by stimulating productivity and growth in the long term, it can generate increased job opportunities.
The results showed the existence of a negative relationship between inflation as an independent variable and economic growth as a dependent variable, whereby an increase in the inflation rate leads to a decrease in economic growth at a decreasing rate.
There is a need to pay attention to raising investment rates because there is a direct relationship between investment and the increase in the supply of goods and services (thus reducing inflation), and increasing economic growth rates in terms of GDP.
It is necessary to continue to apply economic reform policies, while working to spread public awareness of the importance and feasibility of these reforms in providing the components of sustainable development in the long term and the stability required in price levels.
As for performance, technological innovation, the study found the weak performance of the innovation index in the Arab Republic of Egypt, and this may be due to the fact that some data for Egypt are not available or not updated. If available, this will change the arrangement and the value of the index, especially with regard to some data related to education and training, exports of creative products, intellectual property rights, and new business and IT services. Hence, based on the experimental analysis conducted in our study, we believe that it is necessary to do the following: help innovators and creators to promote their creativity, and stimulating building partnerships to enhance the role of scientific research in achieving sustainable industrial development.
Encouraging the creation of alternative products for what is imported from abroad.
The necessity for research centers to collaborate to support innovation, innovators, and applied research, and market them to solve Egypt’s problems and enhance its competitive capabilities.
Paying attention to green innovations, whether in designing sustainable industrial areas or production processes, developing green economy industries, and promoting low-emission industries, and technologies based on sustainable environmental dimensions.
More support and encouragement for innovators and entrepreneurs in green technologies.
To further encourage the participation of programmers in international competitions such as international robotics competitions.
Cooperation and linking between universities, local and international research centers, factories, institutions, and production companies to implement innovations.
Finally, our study aims to determine the importance of technological innovation and foreign direct investment, the vital role that innovation and investment can play in enhancing the domestic product of the Egyptian economy, and whether Egypt is able to direct, organize, and plan these investments well. Because these investments are necessary for the Egyptian economy to meet its needs by introducing modern technology and opening job opportunities for the citizens of the host country for investment and providing them with training opportunities, in addition to transferring technical and administrative knowledge to the crisis for the sake of development, and work in the absence of other sources of financing. As a result, technological innovation and foreign direct investment have become imperatives that every country seeks, regardless of their nature. However, the matter is not easy, as Egypt is a developing country in which it is difficult to provide data for those who want to study the variables and know their impact on the country’s progress, and therefore when submitting research proposals that can be dealt with in the future in this area, the obstacle of data availability must be taken into account.


