Article

Time–Frequency Analysis of Diesel Engine Noise Using Biodiesel Fuel Blends

by
Nemat Keramat Siavash
1,
Golamhassan Najafi
1,
Sayed Reza Hassan-Beygi
2,
Hossain Ahmadian
1,
Barat Ghobadian
1,
Talal Yusaf
3,* and
Mohammed Mazlan
4
1
Department of Mechanical & Biosystems Engineering, Tarbiat Modares University, Tehran P.O. Box 14115-336, Iran
2
Department of Mechanical Biosystems Engineering, Tehran University, Tehran P.O. Box 3391653755, Iran
3
Chief Business Development Officer—CBDO, Activation Australia, Brisbane, QLD 4009, Australia
4
Advanced Material Research Cluster, University Malaysia Kelantan, Jeli Campus, Jeli 17600, Kelantan, Malaysia
*
Author to whom correspondence should be addressed.
Sustainability 2021, 13(6), 3489; https://doi.org/10.3390/su13063489
Submission received: 25 December 2020 / Revised: 4 March 2021 / Accepted: 12 March 2021 / Published: 22 March 2021
(This article belongs to the Special Issue Renewable Energy and Environmental Pollution)

Abstract

:
In recent years, biodiesel has been demonstrated to offer a suitable level of reliability and attracted the attention of many researchers. Accordingly, various studies have been carried out to account for the biodiesel production and application, producing valuable reports and findings. In this research study, the effects of biodiesel on engine noise were studied on the basis of a time–frequency analysis. To do so, the acquired acoustic signal was initially filtered and denoised. Then the signal was transferred to the time–frequency SPL domain using short-time Fourier transform. In the A weighted signal, the SPL of all treatments were compared using an innovative visual technique. In this novel approach, the values of area percentages of the obtained SPL in the time–frequency domain were used to compare the propagated noise due to variables. The method revealed a consistent trend for all fuel blends at all engine rotational speeds. The analysis results showed that B10 (10% methyl/ethyl ester and 90% diesel fuel) and B30 had the lowest and highest A-Weighted SPL, respectively. Additionally, it was found that the engine had a maximum sensitivity for all fuel blends at an engine rotation speed of 1600 RPM. Moreover, Z-weighted (linear) signal processing was used to investigate what happens in a complete thermodynamic cycle at 1600 RPM. The developed time–frequency methodology successfully exposed all of the important acoustic events of the engine. The results of this study showed that the most effective acoustic events in engine noise were combustion, piston slap, and outlet valve closing. Furthermore, higher percentages of biodiesel blends resulted in longer combustion duration.

1. Introduction

Internal combustion (IC) engines are machines associated with development; however, air pollution and their dependency on fossil fuels are major and inexcusable problems. One of the well-known solutions for addressing these problems simultaneously is the use of biodiesel in diesel engines. Biodiesel is a bio-based fuel that is used in a specific combination with diesel, and can reduce some of the pollutants. Feeding a diesel engine with biodiesel leads to some alterations in its performance, resulting in air pollution, noise, and vibration, which have been studied by many researchers. Currently, a blend of up to 7% biodiesel (by volume) is accepted for addition to diesel fuel in accordance with the EN 590 and DIN 51628 standards, and this could conceivably be increased to 10% (B10), or even up to 20% (B20) by volume, although this would require appropriate compatibility tests to be carried out on the fuel and the engines [1]. As biodiesel increases the oxygen content in the fuel blend, it is expected that the flame temperature will be higher than that of neat diesel fuel. The higher temperature will result in a more complete combustion and, therefore, lower amounts of carbon monoxide (CO) and unburned hydrocarbon components (HC) being released [2,3]. However, the higher temperature will also act as a catalyst for the generation of some compounds of nitrogen and oxygen (NOX), as indicated by Yasin et al. [4]. Because, as with many things, biodiesel has some destructive consequences, appropriate strategies such as the use of three injection nozzles, are necessary to assist engines in minimizing them [5]. In this work, the effects of biodiesel on the engine combustion process will be surveyed using a time–frequency technique.
Tarbiat Modares University in Tehran, Iran has established a Renewable Energies laboratory that specializes in biofuel technology, production, and application. In this laboratory, the entire biodiesel fuel production process, as well as its effect on engine behavior, is investigated; this includes engine performance, exhaust gas emission, engine vibration, engine noise, and combustion simulation. This team studies the production and the use of biodiesel based on waste cooking oil in Internal Combustion Engines and their effect on noise reduction.
In this paper, a vibration advance method was adopted to investigate the effect of engine noise on human hearing when biodiesel fuels were used as an alternative fuel for a commercial diesel engine. Different biodiesels with different blend ratios of B10 and B20 were used in this work. An innovative visual method was used to compare the overall sound pressure level SPL (sound pressure level) of any spectrum for one cycle, on the basis of an average of 15 cycles.
To further minimize the effects of mechanical noise on engine performance and extract the biodiesel-based noise more clearly and in more detail, additional work will be implemented using a 6-cylinder diesel engine.

2. Literature Review

2.1. Diesel Engine Noise Sources

Noise sources in diesel engines can be categorized as direct and indirect combustion noise, aerodynamic noise, and mechanical noise:
  • Direct combustion noise (DCN) is a structure-borne noise that originates from the excitation of the combustion chamber walls by the gas force. Any reduction in DCN can dampen the radiated noise throughout the entire operating range of the diesel engine. The DCN of direct injection engines is typically 10 dB greater than that of indirect injection engines [1]. DCN can be reduced by delaying the starting point of injection, advancing the start of ignition (reducing the ignition delay), and modifying the shape of the injection spray (a properly shaped injection can lower the DCN by 10 dB while idling and 3 dB overall) [1].
  • Indirect combustion noise (ICN) is caused by relative movements influenced by gas and load-dependent forces such as the crank mechanism and injection pump. Piston noise, which is known as “piston slap”, and which is produced by shock excitations between the piston and the cylinder liner, is the most significant source in this category [1]. A piston can oscillate up to 10 times per thermodynamic cycle, whereby its head and skirt come into contact with the cylinder liner on one side. Piston slap is likely to predominate by up to 5–10 dB at a limited frequency range above 800 Hz [6]. Piston slap is a function of bore–piston clearance. Aluminum pistons have greater clearance in comparison to cast iron ones, as they have a higher heat conductivity coefficient. As a result, under cold operating conditions, cast iron pistons will be quieter [7]. Optimizing the clearance can lead to a noise reduction of 2–4 dB(A) [6]. In supercharged diesel engines, injection pump and crankshaft noise are also important, along with piston slap [8].
  • Aerodynamic noise is mainly generated by air intake and burned exhaust gas. Cooling fan noise also belongs to this classification [1]. The greatest contribution among these three aerodynamic noise sources is made by burned gas rush. Aerodynamic noise is affected by obstacles in the way, as well as the shape of the air’s path (air inlet and gas outlet). A properly designed muffler damps the exhaust noise. Mufflers can be designed to reduce a distinct domain of frequencies. So, using the engine noise spectrum data, the noise could be controlled successfully in defined distinct frequencies. In general, a well-designed muffler might reduce the overall emitted noise by 30–35 dB(A) [9]. The air cleaners also can damp the air inlet excited noise, which in super/turbochargers will be more visible. Any venturi in the air inlet line will attenuate the higher frequencies energy as the resonators weaken the low-frequency components [1].
  • Mechanical noise stands on relative movements influenced by inertial forces. Valve gears, valve trains, oil pump, water pump, fuel pump, and so on are the excitation source of this category. Valve noise (the noise that mainly is resulted from valve closing and its drive train) is annoying as it is highly impulsive. The valve noise could be reduced by considering its drive gear natural frequency, optimizing the cam contour dynamically, using a hydraulic valve clearance, using a hydraulic valve tappet, reducing the moving mass of drive train components, applying a slight angular offset on the cams phasing, and using more than two valves per cylinder. Increasing the oil pressure will magnify the oil pump’s excited noise. But it can be controlled by lowering the peak pressure [1,6].

2.2. Background

Research works performed by Dal et al. [10] and Rakopoulos et al. [8] reveal that the biodiesel has no significant effect on diesel engine noise. Chiatti et al. [11] expressed that B10 and B40 had the greatest and smallest sound pressure level (SPL) in comparison with other treatments. This is while; research work conducted by Siavash et al. [12] showed that B10 had the smallest SPL and Kerimcan et al. [13] reported that biodiesel increases the engine SPL in comparison with the diesel fuel. Uludamar et al. [14] developed a multiple linear regression model, which claims that the noise and vibration of a diesel engine decreases with biodiesel ratio increment until pure biodiesel usage.
Biodiesel effects on a diesel engine noise can be categorized in two main stages: its effect on the combustion process and its effect on fuel injection; including injection mechanism and fuel spray pattern. Biodiesel has two main weaknesses; greater corrosion in comparison with the neat diesel and its several times higher viscosity [3]. In order to solve the viscosity problem, in some cases, a small proportion of methanol (5% by volume) has been added to the biodiesel blend. Adding 5% methanol to a B20 can raise the cylinder pressure for a limited crankshaft rotation. Luca et al. [15] have studied the biodiesel effect on injection characteristics and engine performance. They revealed that the higher sound velocity excited by the biodiesel leads to advance injection timing. According to the study, the higher the mean injection pressure (due to its higher viscosity) the longer fuel spray presentation. Yang et al. [16] have shown that the cylinder pressure, especially in its peak point is significantly higher for pure diesel in comparison to neat biodiesel. The claim has been restated by Zhao et al. [17]; they show that biodiesel has a shorter ignition delay at any operating condition, which decreases by injected fuel amount increment [17]. Some researcher claim that biodiesel percentage growth in diesel fuel blend increases the kinematic viscosity and surface tension, which causes bigger droplets in the fuel atomization process [18,19]. Patel et al. [20,21] correlate the higher combustion noise level of biodiesel (from Karanja seed and Jatropha) blend (B20) to the shorter combustion duration, increased ignition delay, and higher heat release rate. Nonetheless Sanjid et al. [22] claim that a combined biodiesel (Palm-Jatropha) B5 and B10 reduces the SPL of propagated noise by 2.5% and 5%, respectively; due to the fuels lubricity and damping properties. Sanjid et al. [23] as Patel et al. [20,21] have repeated the work for Brassica Juncea-based biodiesel. These similar works with different biodiesel-extracted seeds emphasize that the base-seed for biodiesel esterification can significantly alter the products of the combustion; including pollutant level, noise, vibration, and engine working parameters such as torque ad power. In this regard, Fattah et al. [24] have investigated the biodiesel coming from edible (soybean, rapeseed, and palm) and non-edible (Jatropha and Cotton) seeds. The study reveals significant differences in emission excitation and engine noise propagation, which has a decreasing trend (the palm-based one has the least). However, the intensity of vibration and noise of biodiesel can exceed the pure diesel at higher compression ratios and loads [25].
In conclusion, the induced acoustical signals of an engine can interfere with its inside invents. In a distinct engine rotation speed, the difference between treatments will illustrate the differences in the combustion process. There are two important factors that the fuel can alter in combustion and may change the propagated noise characteristics; ignition delay and gas temperature [26]. However, in this research work different levels of biodiesel blend in diesel fuel were used to monitor its effect on engine noise; mainly in combustion stroke. According to this brief literature review, there is not any published work that uses a time-frequency approach to survey the engine noise using biodiesel fuel blends. As a result, in this research, a time-frequency technique was utilized to detect any event inside an engine using biodiesel fuel blends, to find any variation caused by biofuel, which can acoustically be rooted up. Also, a completely creative visual technique is used to survey the time-frequency model output, which is the other novelty of work.

3. Materials and Methods

As mentioned, this paper will cover the interaction of diesel engine noise and biodiesel. Using a time-frequency analysis, the combustion process will be surveyed. Here in this section, a brief description clarifies what was the used material; biodiesel, engine, and the methods; data acquisition and time-frequency approach.

3.1. Biodiesel

Biodiesel is a methyl/ethyl ester that is obtained during a transesterification process, as the most common process, from the vegetable and animal oil sources. In this method, the oil is converted to biodiesel fuel during the preparation process, dissolving the catalyst in alcohol, transesterification reaction, titration, extraction of excess methanol, separation of glycerin from biodiesel and leaching and purification of biodiesel [27]. Biodiesel have experience 4 generation up to now; edible oils (1st generation), non-edible oils (2nd Gen.), waste oils (3rd Gen.), and finally advance solar oils (4th Gen.) [28]. The excessive O2 in biodiesel fuel makes it more efficient, and improve the combustion quality, complete combustion. As a result, exhaust gas emission components such as HC and CO are expected to be reduced significantly [29].
In this study, biodiesel is produced from waste cooking oil. The biodiesel fatty acid composition is illustrated in Figure 1 using a gas chromatographer (GC), which C18:2, C18:1, and C16:0 have higher compositions. Their fatty acid type is unsaturated linoleic, unsaturated oleic and saturated palmitic with 31.8%, 29.6% and 20% composition, respectively. The x-axis of the figure shows the detection time of any component. Any component has a distinct time of detection, which can be found through the GC machine instruction manual. For example, C18 will be appear at 18.27 min. The y-axis is the running voltage, which the area under the peak points represent the mass percentage of any component. Some other specifications of pure diesel fuel and biodiesel are listed in Table 1.
The net diesel fuel used in this work was purchased from a fuel station in Tehran, Iran, which its characteristics are given in Table 1. The fuel combination was carried out according to experiments that have been done before to determine engine operation parameters. According to this, the experiment matrix (Table 2) has been derived; 7 step fuel blends and 6 step engine angular speed.

3.2. Experimental Set-Up and Data Acquisition

The investigation was performed in an outdoor, which there was no obstacle on the leveled ground up to at least 15 m. The microphone was located 1.5 m away from exhaust, which its exit was upward (Figure 2). All the condition was set to meet ISO-5131 [30] and SAE-J1174 [31] standards requirement. The engine rotational speed was measured using Lurton 2364 tachometer with 0.001 rpm accuracy. The engine noise was measured using HT157 sound level meter and digitalized and saved with Sound View software. HT157 is equipped to a low impedance, capacitor-type microphone with a unidirectional pattern. The microphone size, sensitivity and frequency range is 1/2, 50 mV/Pa and 10–20 kHz with a flat extrusion respectively.
In this study, a single-cylinder, water-cooled, direct injection four-stroke diesel engine (ASHTAD DF120-RA70) is used. The engine, which its nominal power is 7.5 HP at 2200 RPM, was mounted on a two-wheel tractor. As the experimented tractor is used in agricultural applications (in Iran mainly in rice fields), and further biodiesel is mainly from agricultural products waste, so it is not far from vision to experiment with this kind of machine.

3.3. Signal Analysis

Acoustical signal analysis can provide an approach to solve noise problems, engine diagnosis and also combustion process detection [32]. Fourier transform is utilized to detect the noise and vibration sources in machinery and IC engines [11,33,34]. However, the Fourier transform is not efficient for non-stationary events; like cross-terms and systems with rapid changes in time and frequency [27]. In such cases, time-frequency (TF) analysis is a convenient method that is used to observe events in the time and frequency domains simultaneously [35]. Chiolaz et al. [35] have applied the Winger-Ville transform, which is a TF approach to provide energy distribution in the time-frequency domain as the method has high time and frequency resolution and precise location of patterns. However, event detection using a noise/vibration signal needs a time-frequency representation (TFR) method such as a Short-term Fourier Transform (STFT), which is used in this work. Other Method is wavelet analysis, which was utilized by Ahmadian et al. [36] to evaluate the combustion induced noise and vibration in a diesel engine fueled with pure diesel fuel. They reported that increasing load would increase wavelet coherency between the cylinder pressure (CP) and liner vibrations at frequencies higher than 1 kHz. The coherent regions between CP and noise were mainly at frequencies higher than 1 kHz while advancing the fuel injection timing had shifted the coherency toward lower frequencies. Also, with advancing injection timing, the coherent regions between liner vibration and noise have appeared to be at frequencies between 100 and 500 Hz [36].
Acoustic signal analysis can be performed in two different methods; parametric and nonparametric. Parametric methods such as time-series study the dynamic structure of data. In time series methodology, using the current situation and considering the past, the oncoming events are anticipated. Most known nonparametric analysis for noise signal time-frequency investigation are STFT (Short-term Fourier Transform), WVD (Winger-Ville Distribution), CWD (Choi-Williams Distribution), ZAMD (Zhao–Atlas–Marks distribution) and RMSD (Reassigned Morlet Scalogram Distribution) [37]. However, Taghizadeh et al. [37] declared that the STFT method is the most efficient method to identifying events in an up-to 10 kHz signal; especially for real-time applications, as Bares et al. [38] used the method to identify the knock event in a spark-ignition engine.

3.3.1. Short-Term Fourier Transform

Fourier transform decomposes a signal to its basic component. It converts the signal from its original domain (time) to the frequency ( ω ) . Fast Fourier transform (FFT) uses an algorithm to compute its discrete form. FFT of continues, x ( t ) and discrete, x [ t ] signal in time domain, can be calculated mathematically using Equations (1) and (2) respectively [39]:
X ( ω ) = + x ( t ) e i ω t d t
X ( e i ω ) = n = + x [ n ] e i ω n
Although the FFT extracts the frequencies from the time domain, it is not useful to attribute an event to a specific frequency. As a result, a short term FFT algorithm is utilized to do that. In 1946 Dennis Gabor adapted the FFT to analyze only a small section of the signal at a time by windowing the signal with a finite length [34]. STFT is actually time-dependent Fourier transform that can be calculated using Equation (3) [37]:
X ( ω , τ ) = 1 2 π + x ( t ) w ( t τ ) e i ω t d t
where, w ( t ) is the central windowing function at time t ,which is equal to [37]:
+ w ( τ ) d τ = 1
And the discrete form of STFT will be as Equation (5):
X ( n , ω ) = n = + x [ n ] w [ n m ] e i ω n
STFT resolution depends on the windowing process. In this study, the Hamming window was implemented as Taghizadeh [27,37] and Suh [34] have used, which is defined as [39]:
w [ n ] = 0 · 54 0 · 46 cos ( 2 π n M )               f o r             0 n M
Which, M is the order of system function polynomial, where window length is L = M + 1 . In Figure 3 time and frequency domain of the Hamming window for L = 128 is illustrated.
In signal processing, a window is a mathematical function that is zero-valued outside of the chosen interval. Windows are commonly used for spectrum analysis as well as for finite impulse response filter design. Applying a window to a signal reduces spectrum resolution and leakage, which are influenced by the width of the main lobe and the relative amplitude of the main lobe to the side lobes of w ( e i ω ) respectively. The width of the main lobe and the relative side-lobes amplitude depend primarily on the window length L and the amount of tapering (window shape). The main purpose of the window in the STFT is to make the spectral characteristics constant over its duration by limiting the extent of the sequence to be transformed. Window length depends on signal characteristics change speed (SCCS). For the higher ranges of SCCS, the window should be shorter and vice versa. As the window becomes shorter, frequency resolution decreases and on the other hand whereas, the ability to resolve changes with time increases. Consequently, the determination of window length becomes a trade-off between frequency resolution and time resolution. However, the need for good time resolution and good frequency resolution often requires compromise [39].
In a window, there is three important parameters that should be recognized: window type, size and overlap. In this study the Hamming window was used, which its size, and overlap was 128 and ½ respectively.

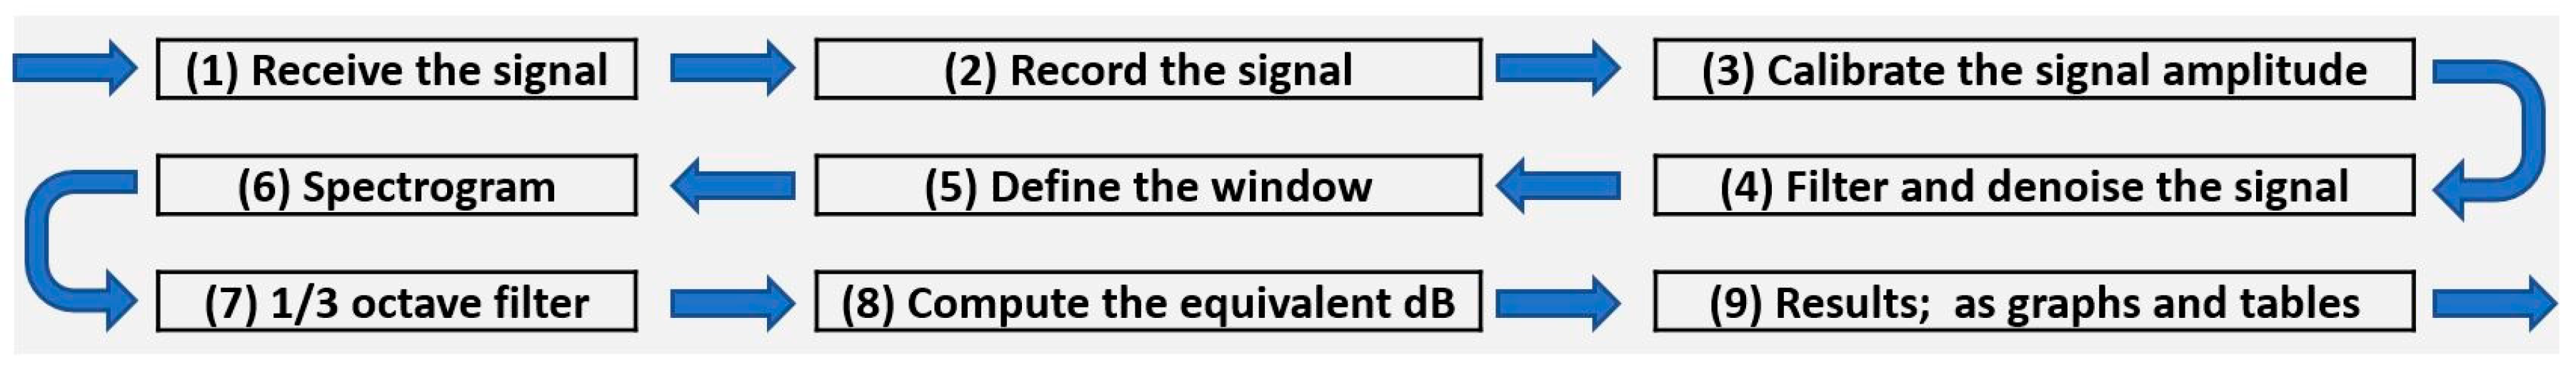
3.3.2. Running Algorithm

The utilized sound level meter (HT157) gives two different series of outputs: analyzed SPL and frequency and raw analogue signal. The analyzed output was used in authors previous works to study the engine noise regarding to overall SPL for NVH purposes [12]. In order to run a time-frequency analysis such as STFT, it is needed to access the raw signal in time domain. So, the HT157 was used just as a simple microphone; such microphone that meets the required specification for the experiment accuracy. However, the overall signal analysis method that is used in this work are as the simplified chain shown in Figure 4.
The acoustical signal was received using a microphone (1 (step number)) and recorded using by Cool Edit Pro 2.1 software [40]. As the threshold hearable acoustic signal frequency is 20 kHz, consequently regarding the Nyquist frequency, which indicates that the sampling rate in discrete signals has to be at least twice the signal biggest frequency component [39], the sampling ratio was considered 48 kHz (2). In continuing, a signal containing 15 complete thermodynamic cycles was selected and an average signal (one cycle) was calculated to be used in TFR consideration.
In continues, the magnitude of the signal was calibrated using the signal reference value of the microphone. The microphone has a calibrator, which generates a single frequency (1 kHz) sound with 94 dB magnitude. Considering this and recording the single tone, the calibration ratio was obtained (3). Continuously the signal was filtered for the frequencies outside of the range (20–20,000 Hz) and denoised using wavelet signal denoising algorithm (wdenoise) (4), which one example is illustrated for one complete thermodynamic cycle in Figure 5. The original signal is the net unfinished.
Then, as mentioned in the previous section, the Hamming window was applied to windowing the filtered signal. The STFT was computed using MATLAB spectrogram function. The input of the function is corrected signal amplitude (y), window type (win), window overlap (hop), number of FFT for each window (nfft) and sampling ratio (fs). As a result, the STFT will make a 3-D output consisting of time (t), frequency (f) and signal amplitude (s) (6). In the next step, the well-known 1/3 octave band was applied on the frequency domain. The band was implemented using a simple double for loop in MATLAB (7). In 1/3 octave band, a distinct domain of frequency is represented with a central frequency that the lower and upper bound for the central frequencies can be calculated as:
f l o w e r   b o u n d = f c e n t r a l / 2 1 / 6
f u p p e r   b o u n d = f c e n t r a l × 2 1 / 6
The reference central frequency in acoustics is 1000 Hz.

4. Result and Discussion

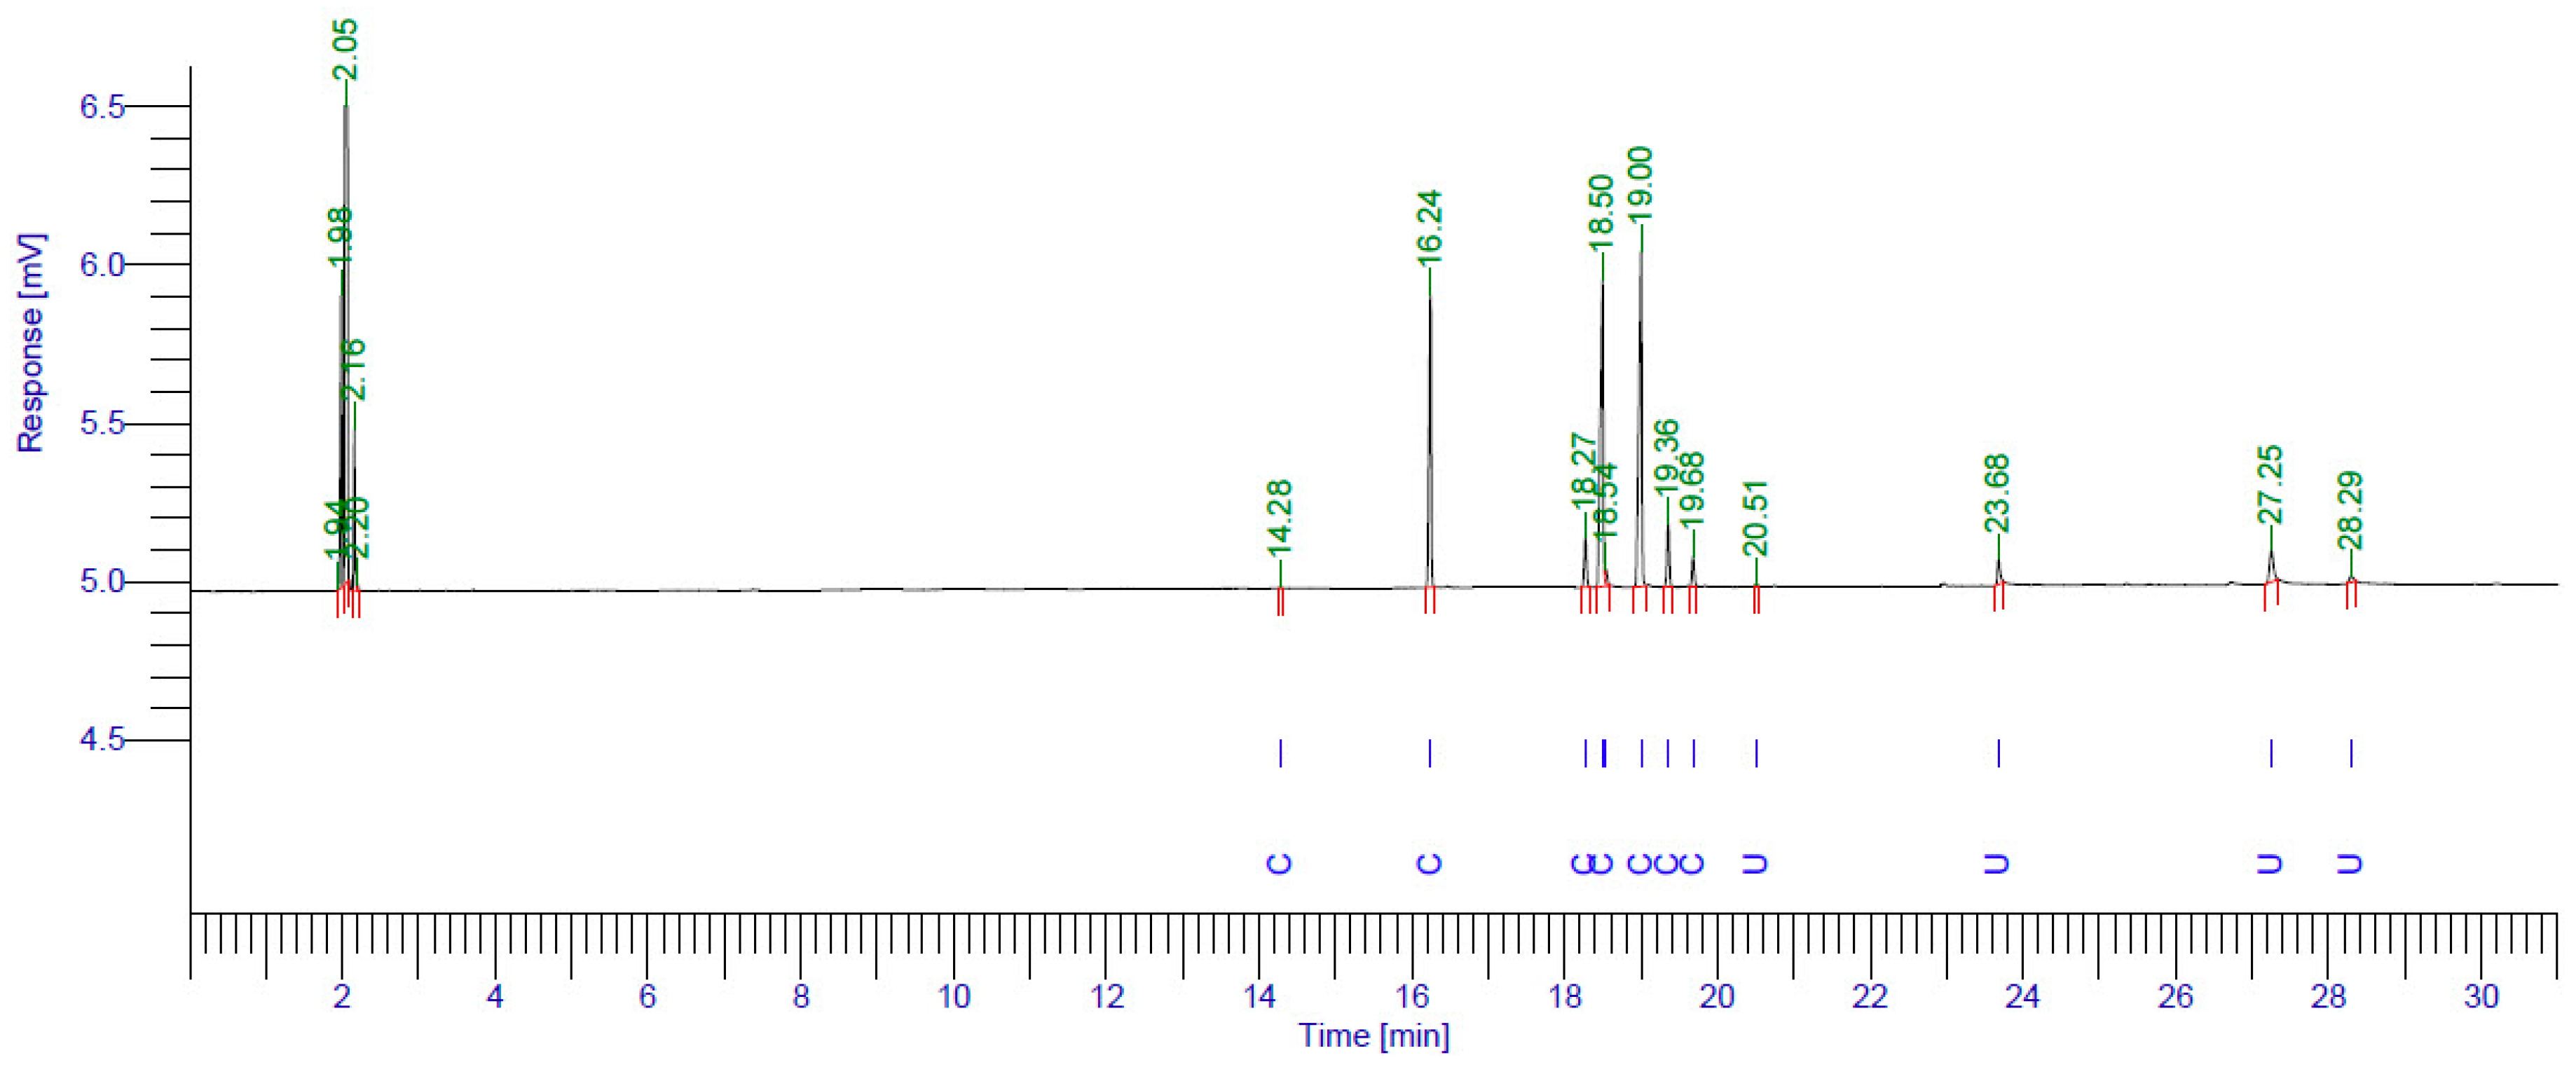
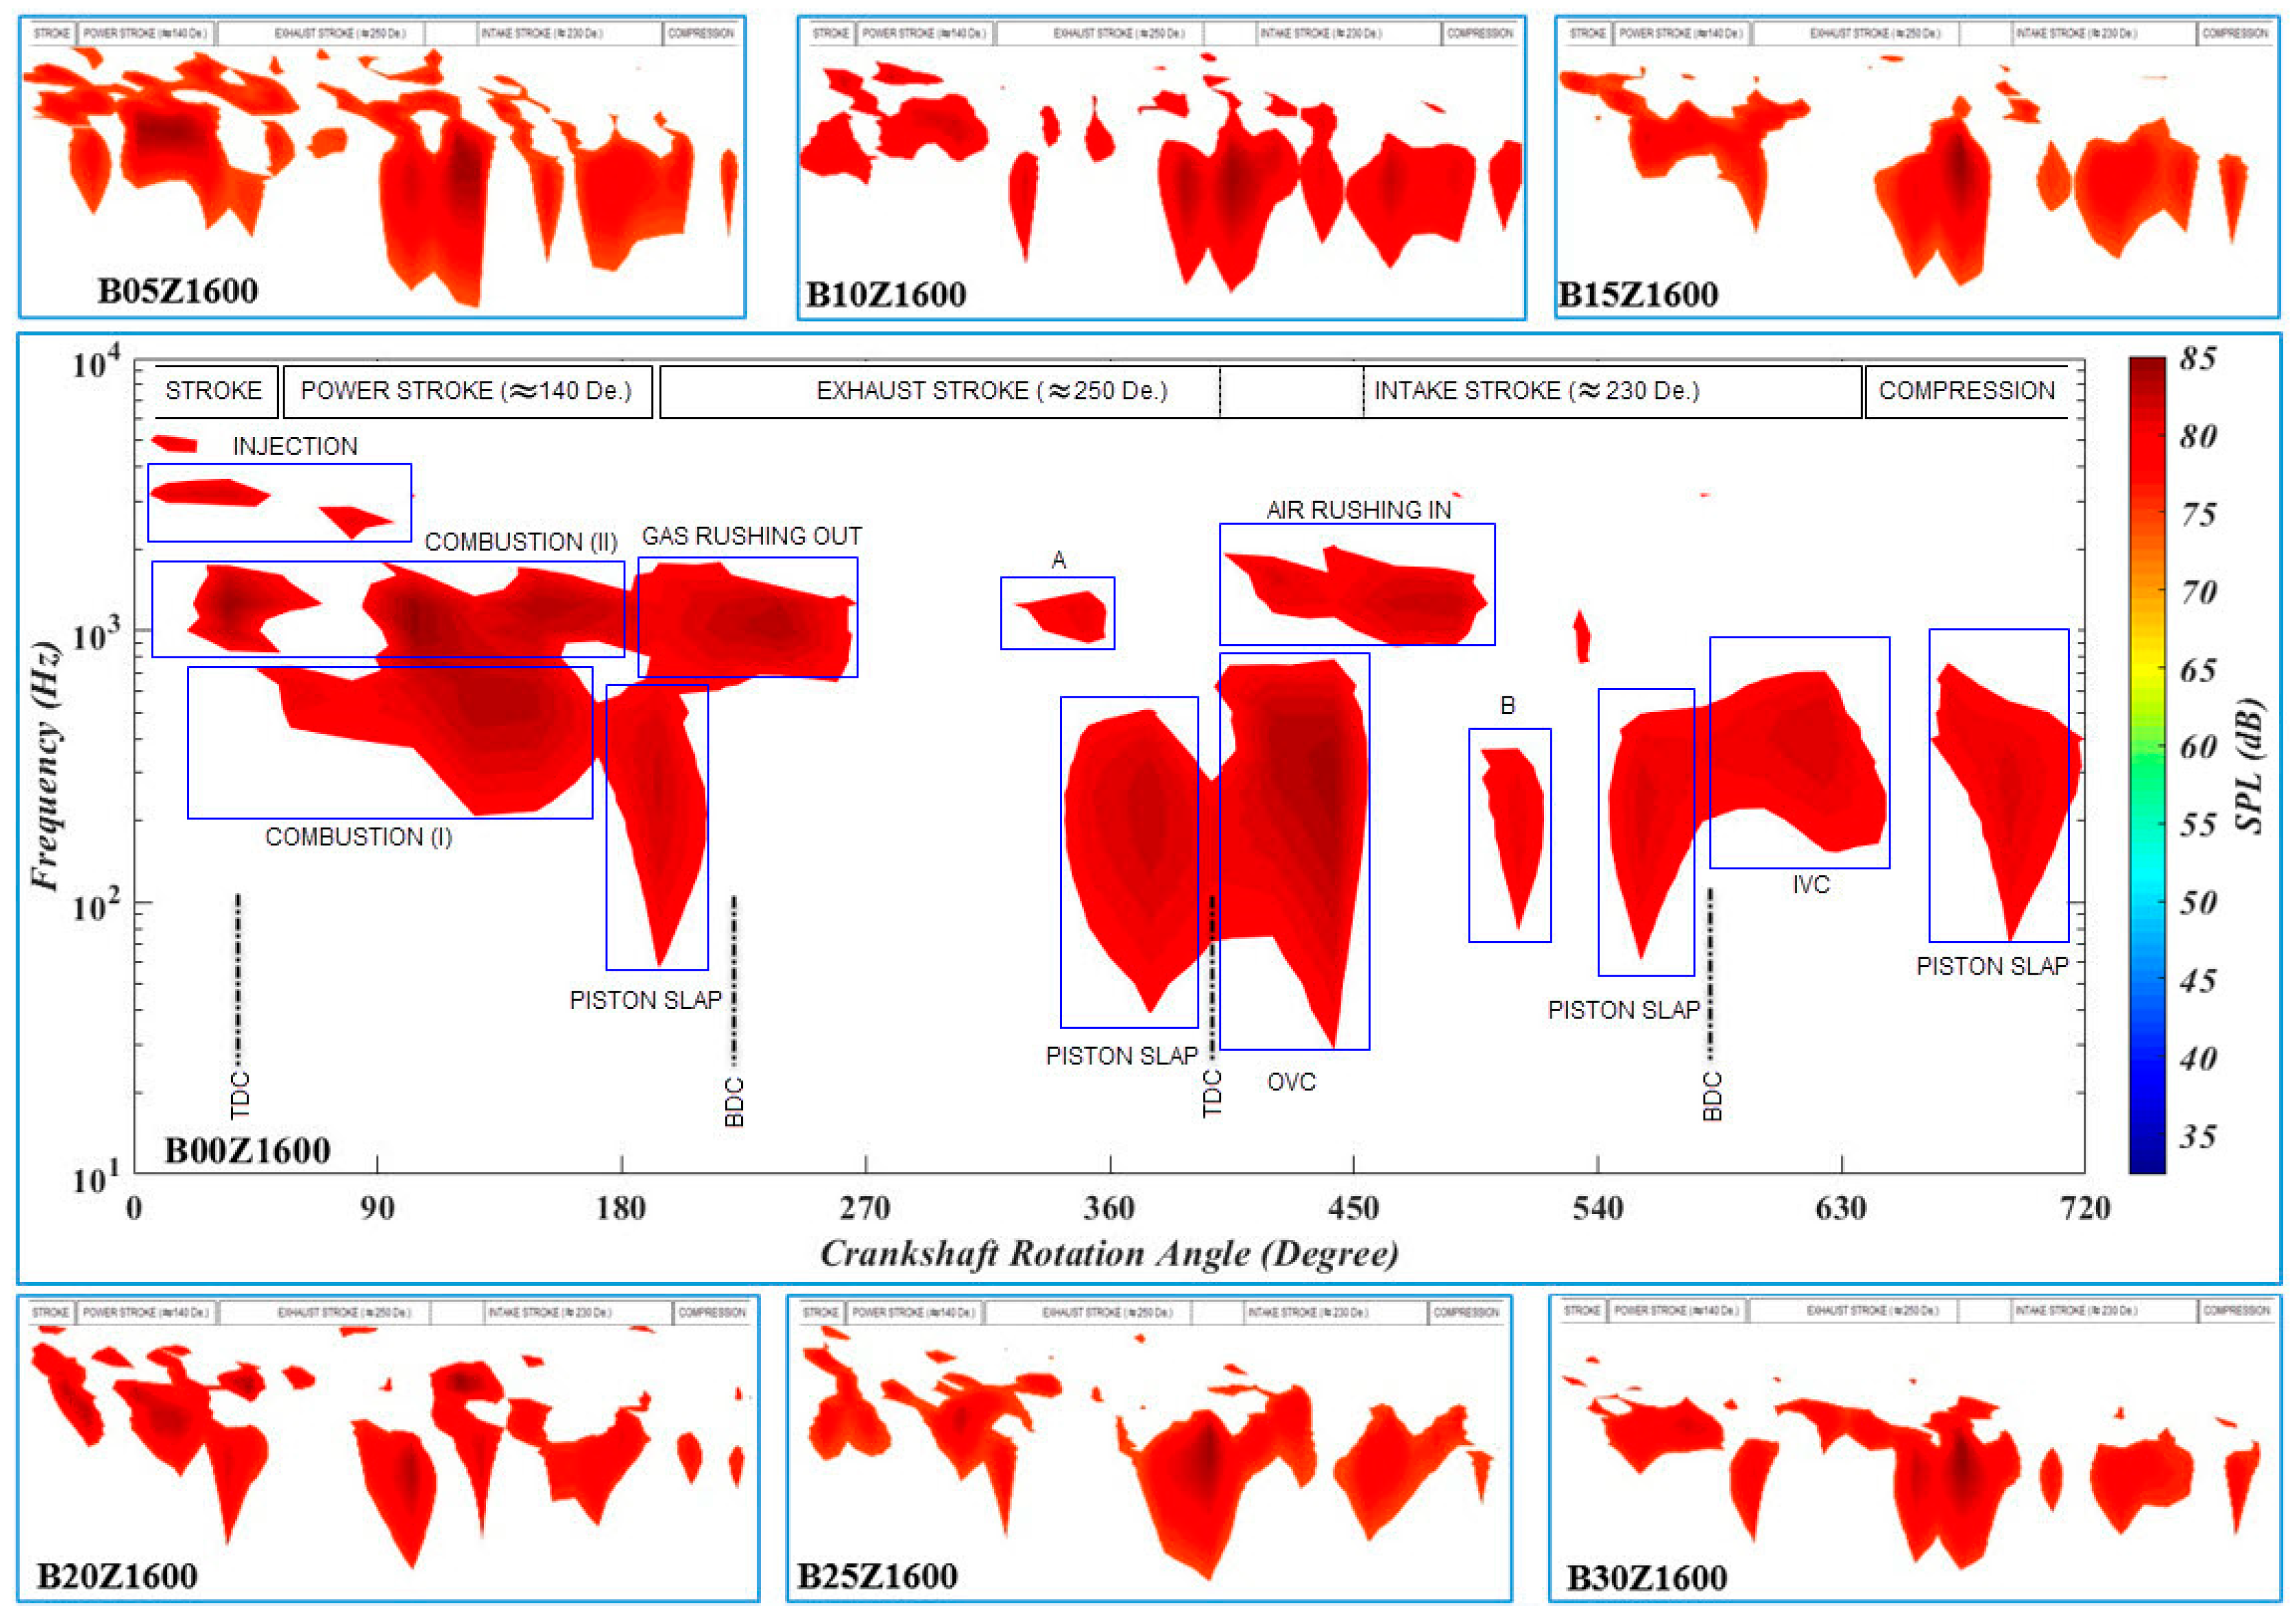
4.1. The Engine Probable Acoustical Peak Points

In this part, it is tried to express the engine working cycles in detail; in acoustical events point of view. In a single-cylinder diesel engine, some distinguished acoustic peak points can be expected considering its valve timing. As an expert, and considering a complete thermodynamic cycle of a four-stroke diesel engine, the most effective events on its noise, which are running inside an engine can be forecasted with an acceptable approximation as illustrated in Figure 6. The figure starts with the combustion stroke, which illustrates the start point of any event. As the combustion-produced signal is strongest, so it can be easily recognized and as a result, it can be used as the starting point of a thermodynamic cycle and find the other events according to it. In Figure 6, the horizontal axis indicates the crankshaft rotation angle (720 degrees for a complete thermodynamic cycle) as well as the vertical axis that shows the expected approximate noise power; dimensionless digit that attributed to have a predictive vision. In the endpoint of the compression stroke, the fuel is injected inside the combustion chamber. It should be mentioned that all the acoustical events will be received by the microphone in 4.4 milliseconds after its real position; as the microphone is located 1.5 away from the engine. So, the signal will be shifted backward to fit its real position. Shifting size depends on microphone distance and the engine rotation speed. For example, in 1600 RPMs the shifting will be 42 degrees; ( 1.5   ( m ) 343 ( m s ) × 360 × 1600 60 42 ° ). After a distinct short time (ignition delay), some advanced uncontrolled limited combustion occurs (AUC) [1]. Immediately, the premixed combustion process starts, which has a higher heat release rate. At the vital point of this phase, the cylinder pressure will reach its maximum point but the heat release is not complete (PC). In this phase, the strongest acoustic spectrum of the cycle is expected [24]. In continues, the combustion process is controlled, which its determinative subject is to make the combustion chamber pressure constant during the process [7]. However, besides the pressure reduces in controlled combustion, heat release will be growing [41]. In this phase, some insular-combustion may be seen (ITC). Piston expands the cylinder. Regarding the experiment engine, 135 degrees from premixed combustion the exhaust valve opens (EVO). The valve opening will generate an acoustic signal due to the valve train, which may have a more silence action as it is just after a piston slap (PS). By opening the valve, the burned gas will rush to exit and will produce a howling low-frequency noise (BGR). After 160 degrees of exhaust valve opening, the inlet air valve will open, as a result, another acoustical strike will appear (IVO). For 21 degrees of crankshaft rotation, both of the valves will be open at the same time (valves overlap). In continue, the outlet valve will be closed. The rapid contact between the valve and its seat will produce another observable acoustic pulse. Piston slaps (PS) will reveal repetitive energetic peak points at the TDC and BDC, which some of them will be highlighted or omitted depending on piston structure, velocity, and combustion chamber gas pressure [6,42]. Expected piston slaps are presented in red color at the figure; the most powerful piston slap will appear immediately after combustion. It should be noted that the expected pulses in Figure 6 are just starting point of each phenomena. The referenced valve timing values belong to the experimented engine.

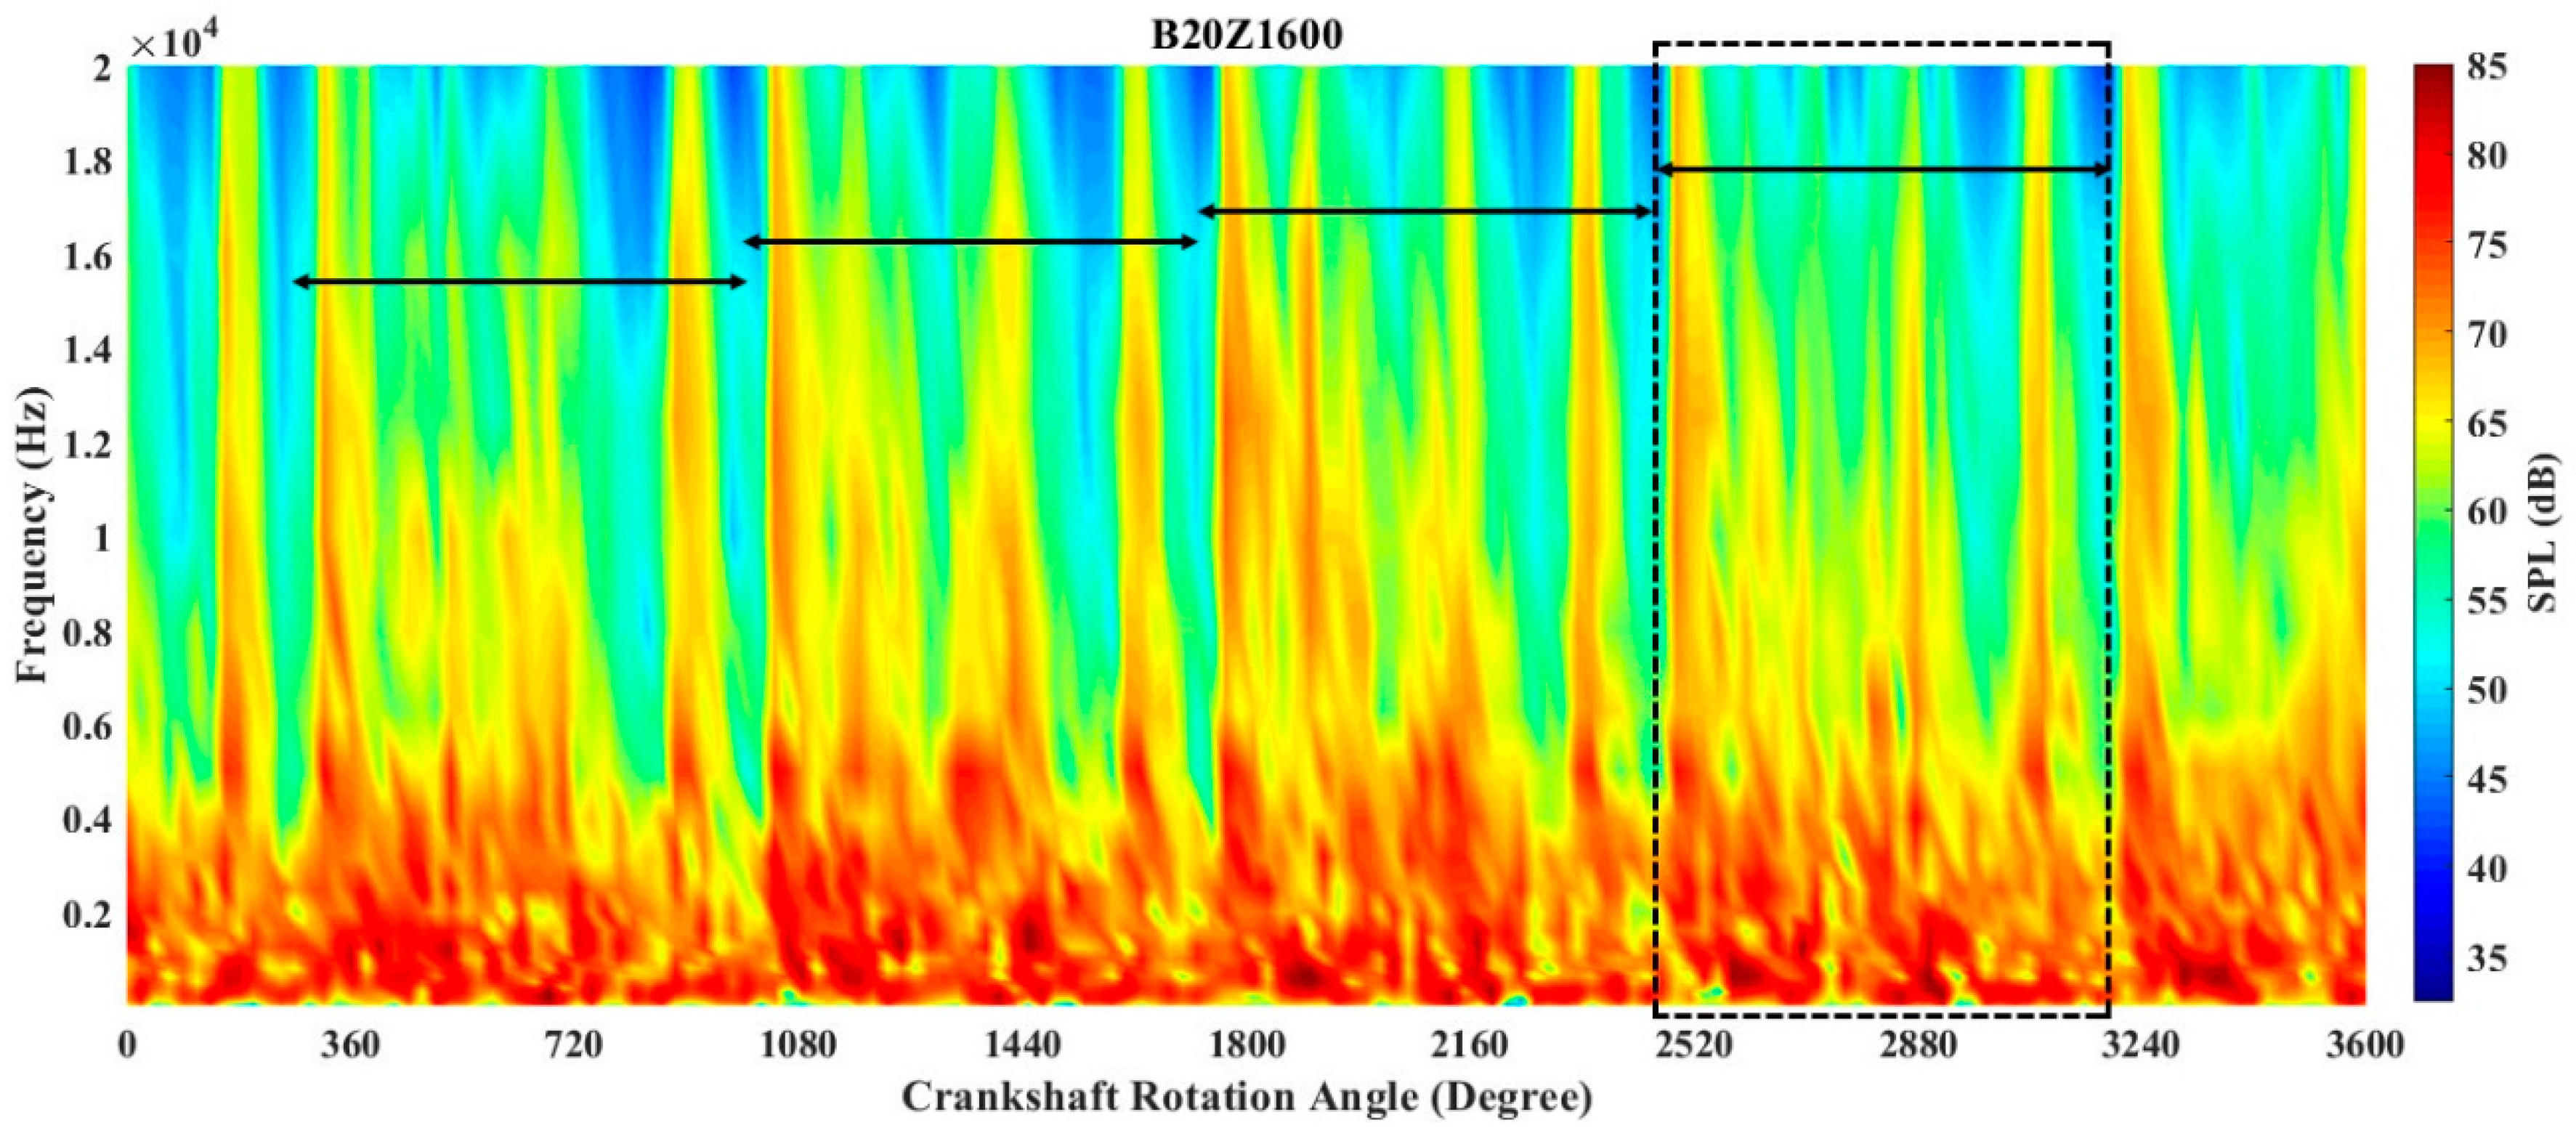
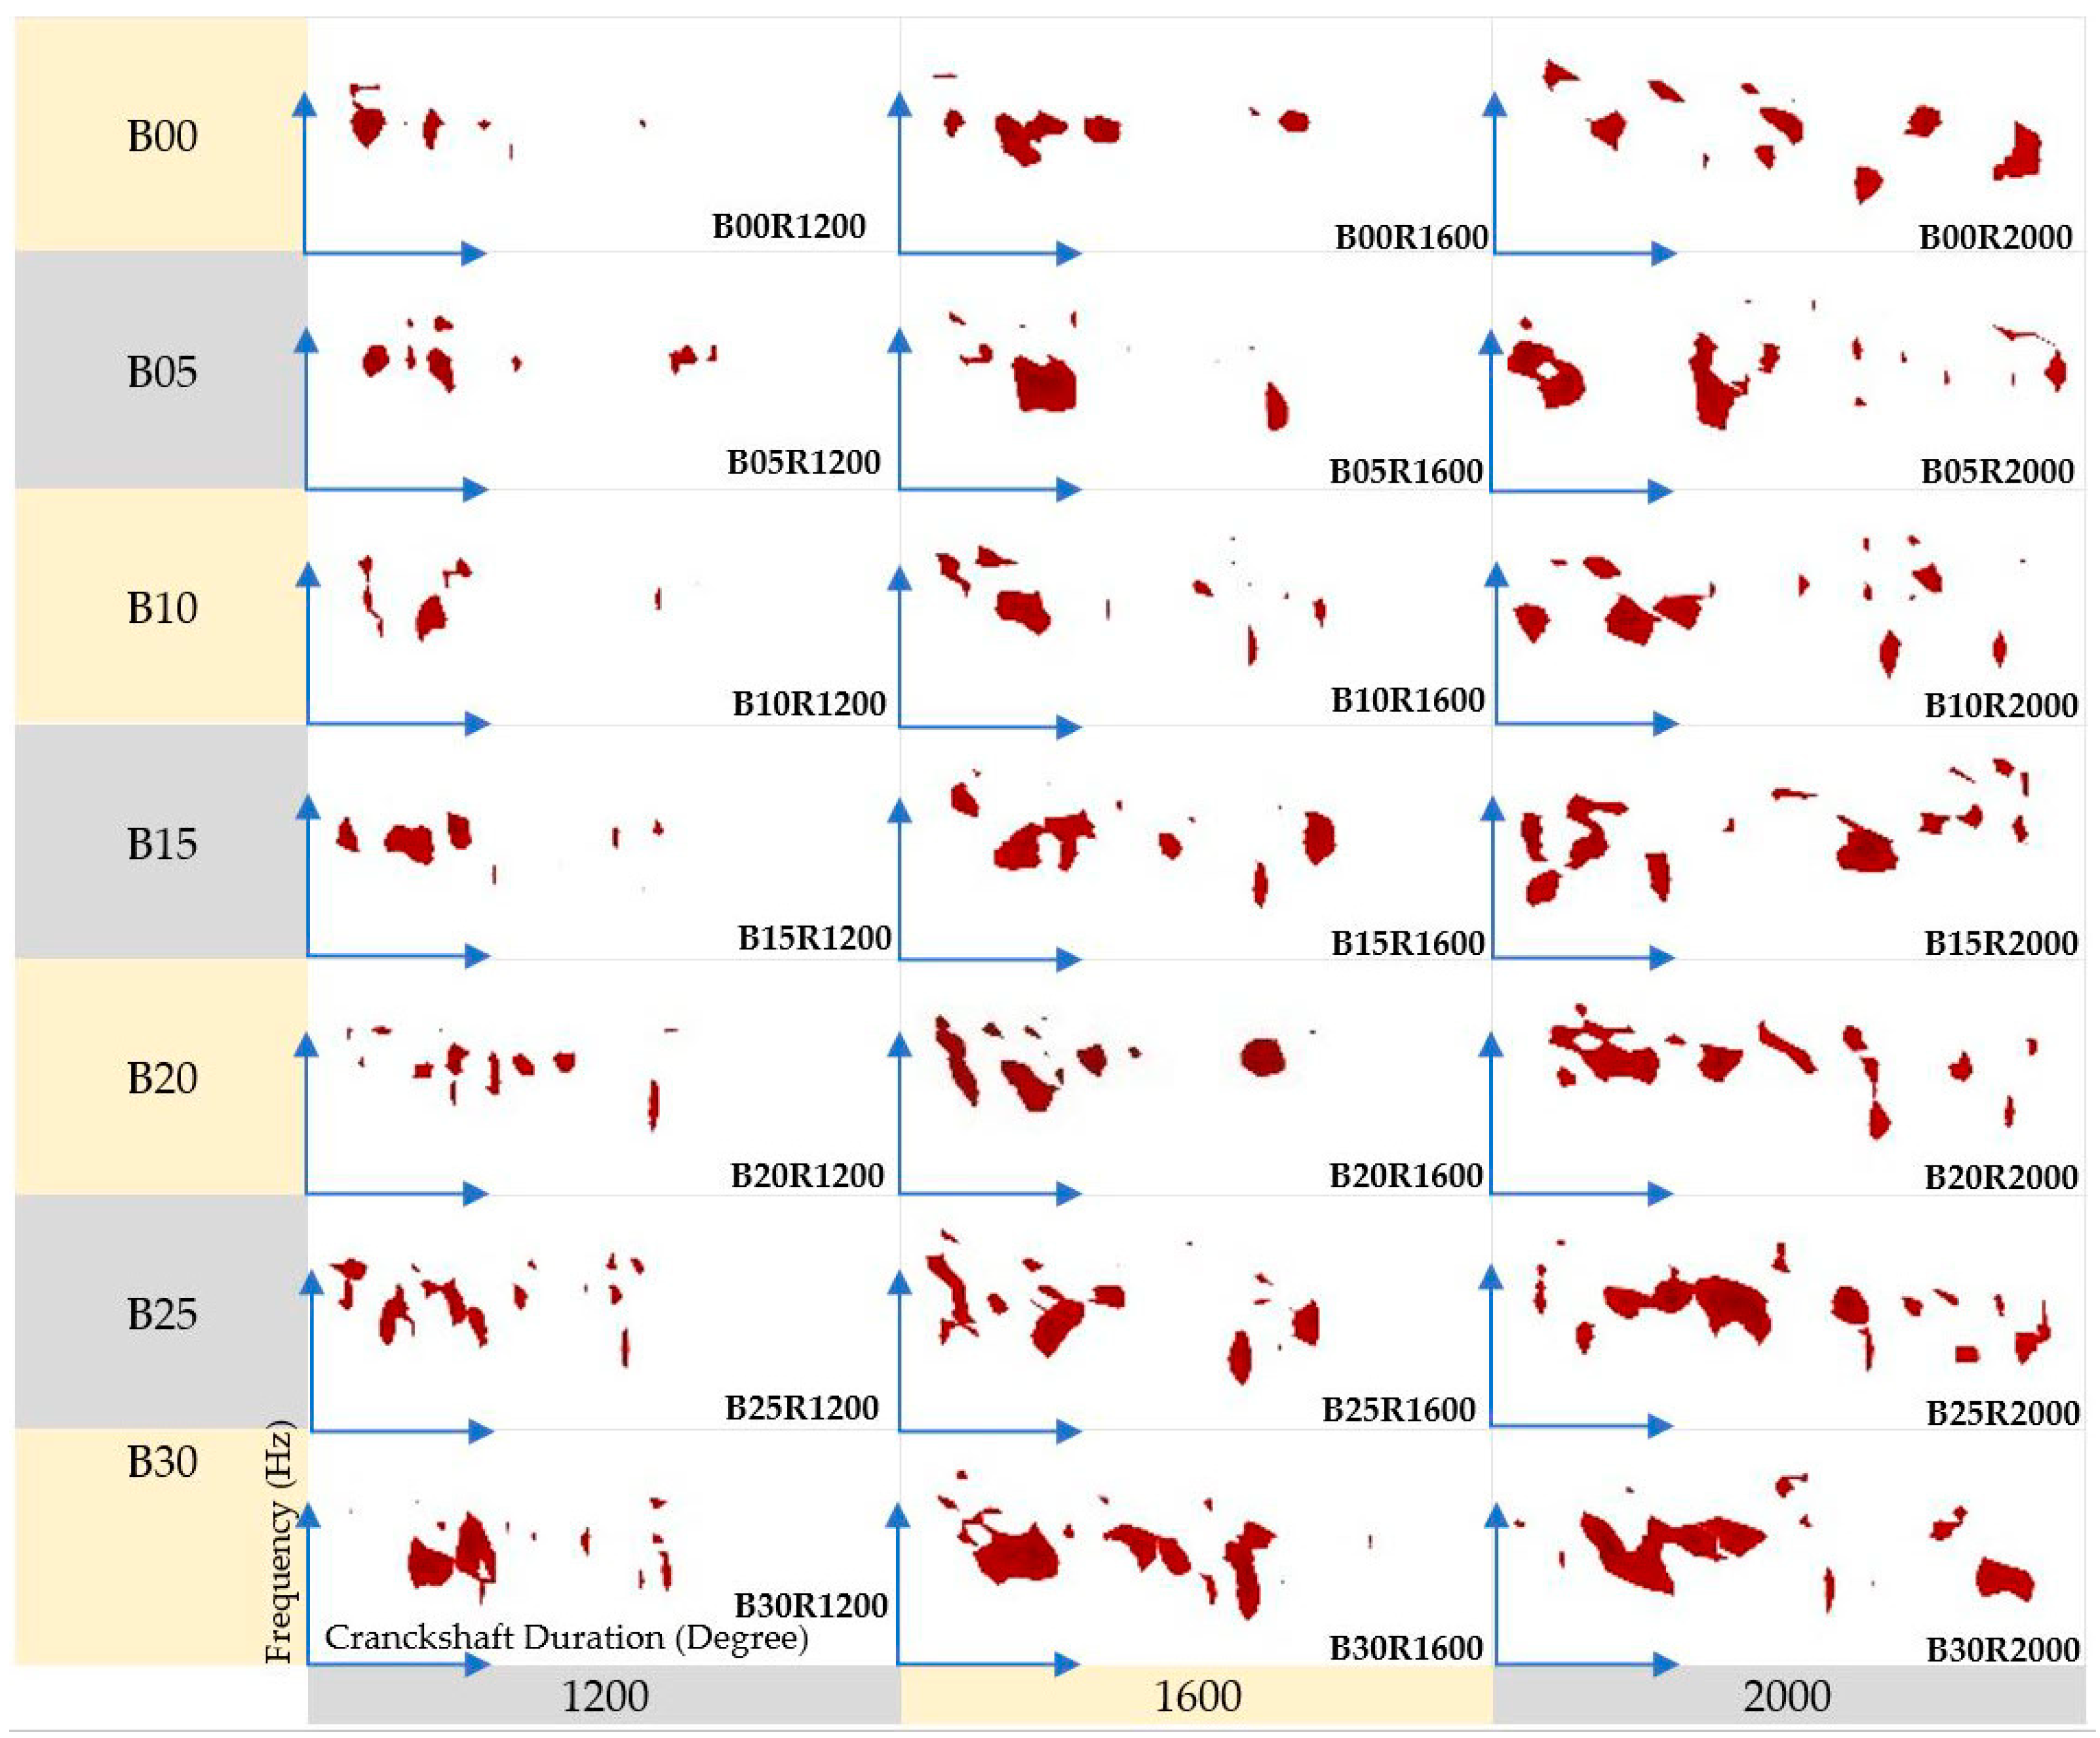
4.2. Signal STFT Result

Figure 7 illustrates a Z-weighted (linear) signal STFT for five complete thermodynamic cycles; for B20 at 1600 RPM. Recognizing a complete thermodynamic cycle in this figure is easy as shown by the arrows. In this figure, the intensity color map shows the sound level power (SLP) in dB; the redder, the higher SPL (notice the left side bar). The x-axis is crankshaft rotation angle in degree and also the y-axis demonstrates the engine radiated noise frequency content in 104Hz with linear scale. The left side of arrows in figure are the ignition starting point. In Figure 4, the method of reaching this color map result is demonstrated. The figure clearly indicates that the engine’s higher range of frequency is about 6 kHz.
Understanding the generated frequency range is essential for muffler design. There is a variety of muffler types that each one can significantly decrease the noise in a distinct frequency range. For example, reactive mufflers have the maximum insertion at 125–250 Hz’s, when it’s 1–2 kHz for absorptive ones. A properly designed exhaust (muffler, tailpipe, etc.) can reduce the radiated noise from 20 dB(A) for industrial grades through 60 dB(A) for super extreme grades [43].
The STFT result is used for two main goals in this study: Firstly, it was used to calculate the overall SPL and the next was to recognizing the main factors that control the noise pressure level. As a result, the signal was filtered for A-weighting, which is the human ear natural filter. And the second aim was concentrated to find out any event effect and mainly recognize the biodiesel effect on the combustion process.

4.2.1. A-Weighted Signal Analysis

In Figure 8 the A-weighted signals for some treatments are listed. As one of the objectives was to detect the signal associated with the human ear, so the most upper-hand 6 dBs were considered. It is due to when several sounds with different SPLs are getting to the human ear, it just can recognize the 6 most upper end dBs [44]. In Figure 8, the horizontal axis of each case is time (crank angle), which starts from the end of the compression stroke and continues for 720 degrees. The vertical axis is in logarithmic scale for frequency; from 100 Hz to 10 kHz. Outside of the selected domain, there was no considerable event.
Regarding Figure 8, at first glance, the most energetic zones are limited to 500–5000 Hz. This range of frequencies mainly belongs to mechanical noises [45]. It is a popular and expected result as the engine is single-cylinder. Combustion-based noise forms the upper layers of frequencies. The other effective noise exciter is the gas rush from the exhaust. According to the figure, in lower RPMs, the combustion delay for pure diesel fuel is more than combined fuels. This issue should be discussed considering two parameters; biofuels have upper oxygen content, so it makes the ignition more tempered and may have lower ignition delay. The other parameter is the fuel viscosity, which is higher for biodiesel fuel [24]. As a result, at the same injection pressure, a distinct delay is expected. Additionally, the sprayed fuel will have a bigger size that augments the delay. The result reveals that mainly biofuel blends have a longer combustion process; which the combustion is divided into some sections. As the oxygen content of biodiesel is higher, the exhaust gas will have a higher temperature, which increases the pressure and gas rush velocity. These all causes higher noise in the upper percent of bio-blends. But in an accurate consideration, there are some parameters that oscillates the result in limited values.
In this work, an innovative method was used to analyze the spectrums given in Figure 8, which in it, the RGB picture was converted to grey (using rgb2gray function) and finally to a binary picture (im2bw function). The percentage of scattered area to the base rectangle was calculated. The base rectangle length and width are constant for all treatment; length involves a complete thermodynamic cycle equal 720 degrees and width cover 100 Hz to 10 kHz. The result shows a highlighted trend, which Figure 9 illustrates it. An explicit comparative view can be cached from the figure. A sample graph of Figure 8 is copied inside Figure 9. The rectangle has the area equal to A = x . y , which is equal for all treatments. The in-red region, which have the upper 6 dB SPL, also occupies a distinct area; named B. the y-axis of Figure 9 represents C = 100 * B / A . It clearly determines the radiated noise spectrum; which blend causes lower and which one has the highest noise. It is obvious that in upper engine speed ranges, higher noise energy will be generated. As the trend is repeated in each rpm, so the result can be trusted for any fuel combination (in the examined domain). Regarding the figure, B00 and B10 have the lowest and B30 has the highest radiated acoustical energy. The bar chart in Figure 9 (right one) indicates that the engine noise has the least and most sensitivity in engine rotational speed at 1200 and 1600 RPMs respectively; using any blend of biodiesel and diesel fuels. Also, the lower chart of Figure 9 expresses that the engine noise has the highest and lowest alteration using B15 and B00 blend respectively in any speed of engine rotation. The bar length in figure lower and right are the maximum minus (-) minimum amount of any case in order to measure the sensitivity of them. For example, in right bar labeled 2000, the length of bar is the B30’s dB percent (vertical axis amount) at 2200 RPM minus the B00’s dB percent at the same RPM. It shows that in a same engine rotation what will be the total alteration. So, the engine has the highest sensitivity to its rotation at 1600 RPM using different blends of biodiesel. Additionally, an example for the lower bars, in lower bar labeled B15, the length of bar is the B15’s dB percent (vertical axis amount) at 2200 RPM minus its dB percent at 1200 RPM. As the B15 bar is the largest so the engine has the highest sensitivity using B15 at any angular speed.
Engine rotational speed should be considered in tow points of view; its effect on mechanical noise and its effect on combustion duration.
SPL of the engine significantly increases with engine speed as Kerimcan et al. reported [13]. But the SPL was increased for upper percent of biodiesel, whenever Kerimcan et al. claim that sunflower and canola-based biodiesel improve it. Chiatti et al. also indicated that B10 has the highest and B40 has the lowest SPL, where the frequency components mainly related to the combustion process [11]. This difference could mean that biodiesel fuel from different sources will have different combustion specifications.
In Figure 9, as a scale for absolute SPL, the B30,2200 and B10,1200 have highest and lowest values respectively, equal to 88.4 and 77.1 dB(A).
An overall view of the biodiesel percentage effect on some diesel engine parameters is listed in Figure 10. The x-axis shows the biodiesel percentage. Cetane number, ignition delay, and maximum cylinder pressure normalized values are scaled in figure right-hand y-axis. Exhaust gas temperature, fuel consumption, and heat release normalized values are demonstrated in y-axis left-hand scale. The amounts are normalized to show all the parameters in the same chart. In this work, the absolute number of the parameters is not considered, but the trends are used to discuss and justify the observations.
Exhaust gas temperature can be an important factor that impresses the radiated noise, as it controls the gas rush. Regarding Figure 10, for B25 and B30, it is expected that have some energetic frequency bands in the tail of the cycles in comparison to the others. And considering the ignition delay, the 4 last blends may have more departed combustion zones. Cylinder pressure also can be used to discuss the radiated noise alteration as it has a significant correlation with the engine body vibration [27].

4.2.2. Z-Weighted Signal Analysis

Figure 11 illustrates the Z-weighted time-frequency spectrum of all fuel blends in RPMs equal to 1600; as the engine has the maximum sensitivity to the biodiesel percentage alteration in this rotation speed (Figure 9). The x-axis of figures is the crankshaft rotation angel starting from fuel injection process at the left side and the y-axis is the engine noise frequency content (Hz) in a 10-based logarithmic scale.
In Figure 11, the big in-middle figure is the Z-weighted STFT for a complete thermodynamic cycle equal to 720 degrees of crankshaft rotation for B00 as the witness. In order to visualize the peak points, the spectrums are filtered to their top 10 dB’s. At the top of the graphs, there is a guide-chart that shows the stroke state. In the witness graph, all the main noise resources could be seen. Four different combustion points can be seen that their main center frequency is about 800 Hz. The three others are weaker in power but higher in center frequency equal to 1500 Hz. The first one can be recognized as unwanted combustion (knock phenomenon). Before the piston reaches BDC, the combustion process ends and the outlet valve opens. Thus, the high-temperature pressurized gas rushes to exit. So, an aerodynamic noise with about 1400 Hz produced, which takes long up to gas significant pressure reduction. The rapid impact of the combustion makes the piston has a sharp slap in the BDC. The slap has a wide frequency content from 50 through 500 Hz in this engine. The second piston slap has occurred before the TDC with the same frequency, but some wider as there is no such impact on it. Exhaust stroke finishes with its valve closing (OVC) 20 degrees after TDC. Outlet valve closing produces a strong noise with a center frequency of about 250 Hz, which its wide range is from 20 through 700 Hz. At the same time (12 degrees earlier) the air inlet valve opens. Air rush through the inlet pipeline produces a high frequency (frequency center about 1 kHz) noise, which its power significantly is lower than the gas rush as there is no force behind it except the piston-produced suction. However, the intake stroke continues for about 230 degrees. Before the piston reaches the BDC for the second time, the weakest piston slap occurs, as there is not considerable pressure on the piston. In the following, closing the inlet valve and last piston slap are the final resources of the noise. As the spectrum is filtered for its upper 10 dBs, some weaker noise sources like some piston slaps do not appeared in this figure.
In the upper paragraph, comprehensive detail of one thermodynamic cycle is discussed. Now it is clear that which spectrum colony with a specific frequency center is for what. Comparing the colonies will guide us to justify the alterations that different fuel blend causes. B05 has a concentrated strong combustion peak point. This peak is such strong that the gas rush and piston first slap are overshadowed. As the combustion-based frequency is nearer to 1 kHz, so it will have a lower impression under the A-weighting filter in comparison to mechanical noises. So, it can be expected that why B05 has higher SPL. The other noise sources are semi-similar to B00, except the OVC that seems some stronger with the same frequency range. B10 combustion frequency is more likely to B00 in shape but some weaker. The trend is the same but with smaller SPL. Gas rush signal is not clear for B10, that means the combustion temperature is low. Low-speed exhaust gas mainly influences the noise and structure vibration. Knock can be seen in B15, B20, B25, and B30 combustion. The B20 has three combustion phases, which are stronger and with some longer duration, and also B25 and B30 have the same trend. The piston slap is sharper using neat diesel fuel than biodiesel blends, which can be associated to its lower combustion noise.
Regarding the upper paragraph, there are three main sources in the engine: combustion, piston slap, and outlet valve closing, in which the mechanical sources will be damped by the human ear mechanism, as their dominant frequency is mainly much lower than 1 kHz. However, in single-cylinder engines, mechanical noise is outstanding as the engine is not balanced dynamically.
In upper percent of biodiesel (more than 20%), the mechanical noise exceeds the combustion noise; due to piston heavy slap (the second one in Figure 11). regarding the figure, biodiesel blends have lower SPL for combustion, but higher for piston slap. This can be resulted from higher average cylinder pressure with lower peak point. As we filter the upper 10 dB, the combustion noise has lower visibility.

5. Conclusions

In this study, a time-frequency analysis was utilized to study biodiesel effect on a diesel engine noise in A and Z weights. In order to investigate the different biodiesel percentage effect on SPL that the surrounding people hear, an innovative visual method is used that compares the overall SPL of any spectrum for one cycle, which is an average of 15 cycles. Using the technique, B10 (77.1 dBA) and B30 (88.4 dBA) are the quietest and loudest fuel blends, which the difference is not significant. In a distinct engine rotation, the difference between SPLs are not reaching 1 dB. In Z-weighted signal analysis, it has been revealed that biodiesel fuel has a longer combustion duration with some sharp impacts. It is also revealed that in a higher percentage of biodiesels, mechanical noise increases, which may be due to engine body vibration increment and piston slap. As the engine speed rises, the share of mechanical noise outweighs the sound caused by the combustion process. Likewise, this is valid for the noises induced by the burnt gas departure, and air entrance; as their velocities increase. Regarding biodiesel percentage, in some treatments, the gas rushing in/out makes their specific noise some quieter or louder. This study reveals that the relative frequency of distinct events differs from engine to engine. By this mean that for example, mechanical noise has a frequency domain as 50 through 5000 Hz, but in this work, it was just up to 1 kHz. So, it can be concluded that the frequency range alters from an engine to the other; but in a limited domain. Generally, it can be expressed that using the STFT in such way that is used in this work, can assist to recognize any event in engine acoustically; avoiding pressure signal measuring troubles and costs. Using the proposed method, a real-time electronic device can be developed to diagnose an engine family (a distinct seri of engines), which absolutely needs a comprehensive experimental data to utilize a machine learning method.

Author Contributions

N.K.S.: Design and performed experiment, data analysis, co-write the paper; G.N.: Data analysis, co-write the paper; S.R.H.-B.: Data analysis, co-write the paper; H.A.: Data analysis; B.G.: Performed experiment, co-write the paper; T.Y. and M.M.: Co-write the paper. All authors have read and agreed to the published version of the manuscript.

Funding

This research received no external funding.

Institutional Review Board Statement

Not applicable. This research article doesn’t describe a study involving humans so, should not contain this statement. This research is focusing on diesel engine noise by biodiesel fuel.

Informed Consent Statement

Not applicable. This research article doesn’t describe a study involving humans so, should not contain this statement. This research is focusing on diesel engine noise by biodiesel fuel.

Data Availability Statement

The data presented in this study is available on request from the corresponding author.

Acknowledgments

We thank our colleagues from TMU Renewable Energies Research Institute who provided insight and expertise that greatly assisted this research.

Conflicts of Interest

The authors declare no conflict of interest.

References

  1. Mollenhauer, K.; Tschöke, H.; Johnson, K.G. Handbook of Diesel Engines; Springer: Berlin/Heidelberg, Germany, 2010; Volume 1. [Google Scholar]
  2. McCormick, R.L.; Williams, A.; Ireland, J.; Hayes, R.R. Effects of Biodiesel Blends on Vehicle Emissions: Fiscal Year 2006 Annual Operating Plan Milestone 10.4; National Renewable Energy Lab. (NREL): Golden, CO, USA, 2006. [Google Scholar] [CrossRef] [Green Version]
  3. Seifi, M.R.; Desideri, U.; Ghorbani, Z.; Antonelli, M.; Frigo, S.; Hassan-Beygi, S.R.; Ghobadian, B. Statistical evaluation of the effect of water percentage in water-diesel emulsion on the engine performance and exhaust emission parameters. Energy 2019, 180, 797–806. [Google Scholar] [CrossRef]
  4. Yasin, M.M.; Yusaf, T.; Mamat, R.; Yusop, A.F. Characterization of a diesel engine operating with a small proportion of methanol as a fuel additive in biodiesel blend. Appl. Energy 2014, 114, 865–873. [Google Scholar] [CrossRef]
  5. Di Blasio, G.; Beatrice, C.; Ianniello, R.; Pesce, F.C.; Vassallo, A.; Belgiorno, G.; Avolio, G. Balancing Hydraulic Flow and Fuel Injection Parameters for Low-Emission and High-Efficiency Automotive Diesel Engines. SAE Tech. Pap. Ser. 2019, 2, 638–652. [Google Scholar] [CrossRef]
  6. Haddad, S.; Pullen, H. Piston slap as a source of noise and vibration in diesel engines. J. Sound Vib. 1974, 34, 249-IN2. [Google Scholar] [CrossRef]
  7. Pulkrabek, W.W. Engineering Fundamentals of the Internal Combustion Engine, 2nd ed.; Pearson: London, UK, 2004. [Google Scholar] [CrossRef] [Green Version]
  8. Rakopoulos, C.; Dimaratos, A.; Giakoumis, E.; Rakopoulos, D. Study of turbocharged diesel engine operation, pollutant emissions and combustion noise radiation during starting with bio-diesel or n-butanol diesel fuel blends. Appl. Energy 2011, 88, 3905–3916. [Google Scholar] [CrossRef]
  9. Bender, E.K.; Brammer, A.J. Internal-combustion engine intake and exhaust system noise. J. Acoust. Soc. Am. 1975, 58, 22–30. [Google Scholar] [CrossRef]
  10. Dal, H.; Emiroğlu, A.O.; Bilge, H.; Şen, M. Experimental investigation of the effects of chicken and turkey biodiesel blends on diesel engine noise emissions. Int. J. Environ. Sci. Technol. 2018, 16, 5147–5154. [Google Scholar] [CrossRef]
  11. Chiatti, G.; Chiavola, O.; Palmieri, F. Vibration and acoustic characteristics of a city-car engine fueled with biodiesel blends. Appl. Energy 2017, 185, 664–670. [Google Scholar] [CrossRef]
  12. Siavash, N.K.; Najafi, G.; Hasanbeigi, R.; Ghobadian, B. Acoustic Analysis of a Single Cylinder Diesel Engine Using Biodiesel Fuel Blends. Energy Procedia 2015, 75, 893–899. [Google Scholar] [CrossRef] [Green Version]
  13. Çelebi, K.; Uludamar, E.; Tosun, E.; Yıldızhan, Ş.; Aydın, K.; Özcanlı, M. Experimental and artificial neural network approach of noise and vibration characteristic of an unmodified diesel engine fuelled with conventional diesel, and biodiesel blends with natural gas addition. Fuel 2017, 197, 159–173. [Google Scholar] [CrossRef]
  14. Uludamar, E.; Tosun, E.; Aydın, K. Experimental and regression analysis of noise and vibration of a compression ignition engine fuelled with various biodiesels. Fuel 2016, 177, 326–333. [Google Scholar] [CrossRef]
  15. Lešnik, L.; Vajda, B.; Žunič, Z.; Škerget, L.; Kegl, B. The influence of biodiesel fuel on injection characteristics, diesel engine performance, and emission formation. Appl. Energy 2013, 111, 558–570. [Google Scholar] [CrossRef]
  16. An, H.; Yang, W.; Maghbouli, A.; Li, J.; Chou, S.; Chua, K. Performance, combustion and emission characteristics of biodiesel derived from waste cooking oils. Appl. Energy 2013, 112, 493–499. [Google Scholar] [CrossRef]
  17. Zhao, J.; Wang, J. Control-oriented multi-phase combustion model for biodiesel fueled engines. Appl. Energy 2013, 108, 92–99. [Google Scholar] [CrossRef]
  18. Kegl, B. Influence of biodiesel on engine combustion and emission characteristics. Appl. Energy 2011, 88, 1803–1812. [Google Scholar] [CrossRef]
  19. Park, S.H.; Cha, J.; Lee, C.S. Impact of biodiesel in bioethanol blended diesel on the engine performance and emissions characteristics in compression ignition engine. Appl. Energy 2012, 99, 334–343. [Google Scholar] [CrossRef]
  20. Patel, C.; Agarwal, A.K.; Tiwari, N.; Lee, S.; Lee, C.S.; Park, S. Combustion, noise, vibrations and spray characterization for Karanja biodiesel fuelled engine. Appl. Therm. Eng. 2016, 106, 506–517. [Google Scholar] [CrossRef]
  21. Patel, C.; Lee, S.; Tiwari, N.; Agarwal, A.K.; Lee, C.S.; Park, S. Spray characterization, combustion, noise and vibrations investigations of Jatropha biodiesel fuelled genset engine. Fuel 2016, 185, 410–420. [Google Scholar] [CrossRef]
  22. Sanjid, A.; Masjuki, H.; Kalam, M.; Rahman, S.A.; Abedin, M.; Palash, S. Production of palm and jatropha based biodiesel and investigation of palm-jatropha combined blend properties, performance, exhaust emission and noise in an unmodified diesel engine. J. Clean. Prod. 2014, 65, 295–303. [Google Scholar] [CrossRef]
  23. Sanjid, A.; Hassan, M.H.; Kalam, M.A.; Rahman, S.M.A.; Abedin, M.J.; Shahir, A. An experimental investigation of biodiesel production, characterization, engine performance, emission and noise of Brassica juncea methyl ester and its blends. J. Clean. Prod. 2014, 79, 74–81. [Google Scholar]
  24. Fattah, I.R.; Masjuki, H.; Liaquat, A.; Ramli, R.; Kalam, M.; Riazuddin, V. Impact of various biodiesel fuels obtained from edible and non-edible oils on engine exhaust gas and noise emissions. Renew. Sustain. Energy Rev. 2013, 18, 552–567. [Google Scholar] [CrossRef]
  25. Jaikumar, S.; Srinivas, V.; Satyanarayana, M.R.S.; Rajasekhar, M.; Teja, D.V.; Kamal, C.T. Artificial neural networks approach on vibration and noise parameters assessment of flaxseed oil biodiesel fuelled CI engine. Int. J. Environ. Sci. Technol. 2020, 1–12. [Google Scholar] [CrossRef]
  26. Jenkins, S. Analysis and treatment of diesel-engine noise. J. Sound Vib. 1975, 43, 293–304. [Google Scholar] [CrossRef]
  27. Taghizadeh-Alisaraei, A.; Ghobadian, B.; Tavakoli-Hashjin, T.; Mohtasebi, S.S.; Rezaei-asl, A.; Azadbakht, M. Characterization of engine’s combustion-vibration using diesel and biodiesel fuel blends by time-frequency methods: A case study. Renew. Energy 2016, 95, 422–432. [Google Scholar] [CrossRef]
  28. Singh, D.; Sharma, D.; Soni, S.; Sharma, S.; Sharma, P.K.; Jhalani, A. A review on feedstocks, production processes, and yield for different generations of biodiesel. Fuel 2020, 262, 116553. [Google Scholar] [CrossRef]
  29. Ağbulut, Ü.; Karagöz, M.; Sarıdemir, S.; Öztürk, A. Impact of various metal-oxide based nanoparticles and biodiesel blends on the combustion, performance, emission, vibration and noise characteristics of a CI engine. Fuel 2020, 270, 117521. [Google Scholar] [CrossRef]
  30. ISO. Tractors for Agriculture and Forestry—Measurement of Noise at the Operator’s Position—Survey Method (5131); 2015. Available online: https://www.iso.org/standard/66227.html (accessed on 21 March 2021).
  31. SAE. Operator Ear Sound Level Measurement Procedure for Small Engine Powered Equipment (J 1174); SAE International: Warrendale, PA, USA, 1985. [Google Scholar]
  32. Murthy, S. Combustion analysis and knock detection in single cylinder DI-diesel engine using vibration signature analysis. Int. J. Eng. Sci. Technol. 2011, 3, 10−16. [Google Scholar]
  33. Heidary, B.; Hassan-beygi, S.R.; Ghobadian, B.; Taghizadeh, A. Vibration analysis of a small diesel engine using diesel-biodiesel fuel blends. Agric. Eng. Int. CIGR J. 2013, 15, 117–126. [Google Scholar]
  34. Suh, I.-S. Application of Time-Frequency Representation Techniques to the Impact-Induced Noise and Vibration from Engines. SAE Tech. Pap. Ser. 2002, 111, 952–960. [Google Scholar]
  35. Chiollaz, M.; Favre, B. Engine noise characterisation with Wigner-Ville time-frequency analysis. Mech. Syst. Signal Process. 1993, 7, 375–400. [Google Scholar] [CrossRef]
  36. Ahmadian, H.; Najafi, G.; Ghobadian, B.; Hassan-Beygi, S.R.; Hoseini, S.S. Evaluation of the combustion-induced noise and vibration using coherence and wavelet coherence estimates in a diesel engine. Int. J. Engine Res. 2019. [CrossRef]
  37. Taghizadeh-Alisaraei, A.; Mahdavian, A. Fault detection of injectors in diesel engines using vibration time-frequency analysis. Appl. Acoust. 2019, 143, 48–58. [Google Scholar] [CrossRef]
  38. Bares, P.; Selmanaj, D.; Guardiola, C.; Onder, C. A new knock event definition for knock detection and control optimization. Appl. Therm. Eng. 2018, 131, 80–88. [Google Scholar] [CrossRef]
  39. Oppenheim, A.V.; Schafer, R.W. Discrete-Time Signal Processing; Pearson Education: London, UK, 2014. [Google Scholar]
  40. Adobe. Adobe Audition. 2020. Available online: www.com/products/audition (accessed on 1 January 2020).
  41. Payri, F.; Broatch, A.; Tormos, B.; Marant, V. New methodology for in-cylinder pressure analysis in direct injection diesel engines—application to combustion noise. Meas. Sci. Technol. 2005, 16, 540–547. [Google Scholar] [CrossRef]
  42. Serviere, C.; Lacoume, J.-L.; El Badaoui, M. Separation of combustion noise and piston-slap in diesel engine—Part II: Separation of combustion noise and piston-slap using blind source separation methods. Mech. Syst. Signal Process. 2005, 19, 1218–1229. [Google Scholar] [CrossRef]
  43. Ghorbani, Z.; Hassan-Beygi, S.R.; Ghobadian, B. The effect of using passive hybrid muffler on a small generator set noise fuelled by natural gas. Russ. Agric. Sci. 2017, 43, 75–83. [Google Scholar] [CrossRef]
  44. HASAN, B.B.S.; Ghobadian, B.; KAMALIAN, N. Prediction model of a power tiller noise Level at rural dirt road. J. Agric. Sci. 2004, 10, 47−58. [Google Scholar]
  45. Dolatabadi, N.; Theodossiades, S.; Rothberg, S. On the identification of piston slap events in internal combustion engines using tribodynamic analysis. Mech. Syst. Signal Process. 2015, 58–59, 308–324. [Google Scholar] [CrossRef] [Green Version]
  46. Neicharan, M.S.; Ghobadian, B. An Experimental Investigation of a Diesel Engine Ignition Delay using Biodiesel and Diesel Fuels. Fuel Combust. 2009, 2, 44–69. (In Persian) [Google Scholar]
Figure 1. Used biodiesel GC result.
Sustainability 13 03489 g001
Figure 2. experiment set-up.
Sustainability 13 03489 g002
Figure 3. Hamming window time and frequency domain for L = 128 .
Sustainability 13 03489 g003
Figure 4. The study producer.
Sustainability 13 03489 g004
Figure 5. Filtered and denoised signal (B00X1800).
Sustainability 13 03489 g005
Figure 6. Expected main acoustical-based noise sources in a diesel engine cycle. x-axis is crankshaft duration starting from fuel injection point for a complete thermodynamic cycle and the y-axis is expected normalized SPL of any distinct event inside an engine.
Sustainability 13 03489 g006
Figure 7. The STFT analysis of a one-cylinder diesel engine at 1600 RPM for B20 fuel (4 complete cycle).
Sustainability 13 03489 g007
Figure 8. STFT output for all treatments; normalized SPL for upper 6 dB- end in one complete thermodynamic; x-axis: cycle duration in degree and y-axis: frequency in Hz.
Sustainability 13 03489 g008
Figure 9. Spectrum occupied area percentage. x-axis is fuel different blends and y-axis is occupied area in a standard plain. The right and lower bars represent the noise SPL sensitivity regarding to fuel blends and crankshaft angular speed respectively.
Sustainability 13 03489 g009
Figure 10. Biodiesel effect on some engine working parameters (normalized numbers) [46].
Sustainability 13 03489 g010
Figure 11. STFT spectrum for all treatments at RPM=1600; the big subplot belongs to B00R1600 and is the witness- x-axis is crankshaft duration in degree starting from fuel injection point and the y-axis is engine noise frequency content in a 10-based logarithmic scale.
Sustainability 13 03489 g011
Table 1. Used diesel and biodiesel specification based on ASTM standards.
PropertiesASTMDieselBiodieselUnits
Flash PointD-9264.2187.2°C
Cloud PointD-25002−1°C
Pour PointD-97−2−4°C
Cetane NumberD061358.2262.45-
Kinematic ViscosityD04453.285.79mm2/s
Density-0.8390.870g/cm3
Water and SedimentD-22090.050.05Volume %
Free GlycerolD-65840.010.016Mass %
Oxygen content 013.44Mass %
Lower heating value 45.8239.9MJ/kg
Table 2. Overall Experiment Matric.
Biodiesel ratio00051015202530
Engine speed (RPM)120014001600180020002200
Publisher’s Note: MDPI stays neutral with regard to jurisdictional claims in published maps and institutional affiliations.

