Article

Vegetation Response to Goats Grazing Intensity in Semiarid Hilly Grassland of the Loess Plateau, Lanzhou, China

1
State Key Laboratory of Grassland Agro-Ecosystem, Institute of Arid Agroecology, and School of Life Sciences, Lanzhou University, Lanzhou 730000, China
2
College of Animal Science, Guizhou University, Guiyang 550025, China
3
College of Water Conservancy Science & Engineering, Zhengzhou University, Zhengzhou 450001, China
4
Yellow River Institute for Ecological Protection & Regional Coordinated Development, Zhengzhou 450001, China
*
Author to whom correspondence should be addressed.
Sustainability 2021, 13(6), 3569; https://doi.org/10.3390/su13063569
Submission received: 2 February 2021 / Revised: 14 March 2021 / Accepted: 19 March 2021 / Published: 23 March 2021
(This article belongs to the Special Issue Sustainable Livestock Production)

Abstract

:
Quantitatively estimating the grazing intensity (GI) effects on vegetation in semiarid hilly grassland of the Loess Plateau can help to develop safe utilization levels for natural grasslands, which is a necessity of maintaining livestock production and sustainable development of grasslands. Normalized difference vegetation index (NDVI), field vegetation data, and 181 days (one goat per day) of GPS tracking were combined to quantify the spatial pattern of GI, and its effects on the vegetation community structure. The spatial distribution of GI was uneven, with a mean value of 0.50 goats/ha, and 95% of the study area had less than 1.30 goats/ha. The areas with utilization rates of rangeland (July) lower than 45% and 20% made up about 95% and 60% of the study area, respectively. Grazing significantly reduced monthly aboveground biomass, but the grazing effects on plant growth rate were complex across the different plant growth stages. Grazing impaired plant growth in general, but the intermediate GI appeared to facilitate plant growth rate at the end of the growing seasons. Grazing had minimal relationship with vegetation community structure characteristics, though Importance Value of forbs increased with increasing GI. Flexibility in the number of goats and conservatively defining utilization rate, according to the inter-annual variation of utilization biomass, would be beneficial to achieve ecologically healthy and economically sustainable GI.

1. Introduction

Managed grazing covers more than 25% of the land surface of the world [1], and approximately 40% of China [2], making up the largest form of land use. Grazing has resulted in widespread degradation or destruction of lands and wetlands [3,4,5]. The semiarid hilly grassland in the Loess Plateau has been grazed for over a thousand years [6], and grazing activities are the main type of land use. The “Forage Livestock Balance” policy, balancing the relationship between forage productivity and grazing capacity of grasslands, has been implemented in this region since the year 2000 [7]. Quantitatively estimating the grazing effect on grasslands can help the government make a policy for proper grazing intensity (GI) of natural grasslands [4]. This is required to maintain livestock production and sustainable development of grasslands.
The effects of grazing on grassland community structure are complex and controversial [8,9,10], affected by environmental conditions [11,12,13,14], GI of each research site [15,16], research scale [17], and grazing history [18]. Classical ecological theory proposes that intermediate levels of grazing pressure have positive effects on grassland production through effects on compensatory growth [9,13] and species diversity [17,19], by stimulating positive response of plants by altering species resource allocation, increasing tillering or lateral bud growth and photosynthetic rates of new leaf area, and decreasing transpiration of leaf area [8,9]. However, many other studies found that grazing has a negative impact on plant diversity, production, and height [8,20,21,22,23] and inhibits preferred species [20,23,24,25], especially for degraded, nutrient poor, or low productivity ecosystems [26], where the ability to recover after grazing is low [22,27]. Proper GI can maintain desirable species composition and avoid rangeland deterioration in the long term [28,29,30].
Calculating and assessing GI are basic to study grazing effects and make adequate management decisions in natural grasslands [31,32]. Most studies about the effect of grazing on vegetation are based on grazed and ungrazed controlled or fenced experiments [12,16,21,33]. Controlled experiments usually lack the long evolutionary history of plant–livestock interactions, which changes the physiognomy of the grasslands [34] and leads to the grassland community adapted to and tolerant to grazing [18]. GI is difficult to obtain by direct observation on a landscape scale, because the spatial distribution of GI is uneven, affected by forage resource, topography, and thermal conditions [35,36,37,38,39]. GPS tracking of free-grazing animals [31,32], and remote sensing of vegetation [40], can help us to obtain multi-scale spatiotemporal data, and determine the spatial interaction between vegetation and grazing animals, and the influence long-term grazing on natural grasslands.
In this study, GI calculated from 181 days (one goat per day) of GPS tracking, aboveground biomass (AGB), based on time-series normalized difference vegetation index (NDVI), and field vegetation data were combined to quantitatively evaluate the spatial pattern of GI, the effects of grazing on the dynamic vegetation production, and community structure in semiarid grassland of the Loess Plateau. The novelty of this study is in using an uncontrolled experiment to assess the impacts of GI on vegetation in a location that has been grazed for over a thousand years [6]. The objectives of this study were to (1) describe and assess the spatial distribution of GI in the study area, and explore its spatial relationship with AGB and plant growth rate; (2) analyze the response of vegetation community structure to continuous GI level; and (3) explore the proper grazing management strategies in the semiarid hilly rangeland of the western Loess Plateau. We hypothesized that (1) the spatial distribution of GI in the mountain is uneven, and relatively high GIs are distributed in the areas that must be passed by goats every day; (2) grazing reduces AGB, but intermediate GI will facilitate plant growth rate; and (3) grazing has minimal relationship with vegetation community structure characteristics over the time period of study.

2. Materials and Methods

2.1. Study Area

This study was conducted on the semiarid hilly rangeland of the western Loess Plateau, near Lanzhou, China (36°1′–36°4′ N, 104°6′–104°9′ E, elevation 1666–1960 m) (Figure 1). The climate is temperate semiarid continental. Mean annual temperature is 7.2 °C. The average daily temperatures for the coldest (January) and warmest (July) months are −7.5 °C and 19.3 °C, respectively. The mean annual precipitation is 378.0 mm, with approximately 80% occurring from May to September. The mean annual pan evaporation is approximately 1300 mm (China Meteorological Data Center; http://data.cma.cn/ accessed on 15 March 2021). The soil is Loess soil (Haplic Calcisols, FAO 90 taxonomy) with about 41% sand, 38% silt, and 21% clay [41], underlaid by limestone and partially covered by biological crust and vegetation. The common slope gradient ranges approximately 30–45°. The study area is dominated by temperate typical steppe. Common species of study area include grasses of Enneapogon borealis (Griseb.) Honda and Stipa capillata L., forbs of Ajania achilloides Poljak. ex Grubov., Artemisia sacrorum Ledeb., Artemisia frigida Willd., Caragana tibetica Kom., Caragana roborovskyi Kom., Heteropappus altaicus Novopokr., Reaumuria songarica (Pall.) Maxim., and Salsola collina Pall. The dominant species are S. collina, S. capillata, A. achilloides, E. borealis, and R. songarica. The botanical nomenclature is in accordance with Global Biodiversity Information Facility (https://www.gbif.org/, accessed in 5 March 2021). The study area has been grazed for over a thousand years [6]. The herd used in this study is composed of 200–300 Zhongwei goats. Every shepherd has their own specific pasture. The shepherd drives his herd of goats into the fixed pasture in the morning and picks them up in the evening. The herd of goats are free-ranging with rare interference from the shepherd and other herds in the mountains, where no enclosure is set. No predation events have been reported in recent years. Goats are primarily grazed in the study area, and only kids are provided with supplemental feed in dens.

2.2. Data Compilation

2.2.1. GI Obtained from GPS Tracking of Goats

Each day, one GPS unit (HOLUX GPSport 245 weighting less than 0.16% goats’ body weight, with the accuracy of GPS about 10 m) was fitted to the stomach of a randomly selected adult goat in the morning at the den, and unloaded when the goat came back to the den in the evening. From 2013 to 2017, 181 days of GPS tracking data of goats from one herd were collected (Table 1). The battery for the GPS units can support up to 24 h of continuous data collection and was recharged every day (one fix every second). The study area was approximately 714.81 ha (Figure 1) based on the minimum convex polygon derived from the 181 GPS tracking trajectories. The partial study area with GI of zero was defined as ungrazed area. The ungrazed area accounted for 7.12% of the study area, and the grazed area accounted for 85.86% of the study area (Figure 2a).
GI, as defined by Holechek, et al. [42], is the cumulative effect of grazing animals on rangelands during a particular time period. The GI distribution (Figure 2) was calculated on the basis of the 181 sets of GPS tracking data using a grid cell method conducted in ArcGIS 10.2 software [43]. The study area was divided into 30 × 30 m grid cells, and the number of GPS points in each grid cell was counted. The GI during a specific period of time was calculated as follows [32]:
G I h e r d , i =   n i × N h e r d × R × D 1 × G P 1 × S 1 ,
where GIherd,i (goats/ha) is the GI in grid cell i; ni is the counts of GPS points within grid cell i; Nherd is the number of goats in the herd (300); R is the GPS recording interval (1 s); D is the number of grazing seconds in a day (8 h   ×   3600 s); GP is the grazing period of total days recorded (181 days); S is the area of the grid cell (0.09 ha).

2.2.2. Field Vegetation Sampling Data

Eight (August 2016) and twenty-four (August 2017) field vegetation sampling sites (Figure 1) were randomly selected to characterize the vegetation community structure characteristics during the peak of biomass period. At each sampling site, three 1 × 1 m plots were randomly laid out along the ridge line (approximately 30~60 m). For each plot, the number of individuals and heights were recorded for each species. The aboveground vegetation was collected, separated by species, and oven dried at 60 °C until constant weight to determine the AGB for each species. The Importance Value (IV) of grasses and forbs within a plot was calculated as follows:
IV (%) = (relative density + relative AGB + relative frequency)/3.
Species richness was expressed as the number of species within a plot, species diversity was expressed by Shannon–Weiner index (H), species evenness was expressed by Pielou index (J), and dominance was expressed by Simpson index (I).
H = i = 1 S ( P i ) l n ( P i ) ,
J   = H / l n S ,
I = 1 i = 1 S ( N i N i 1 / N N 1 ) ,
where P i is the relative density of species i in a plot; S is the number of species in a plot.   N i is the number of individuals of species i in a plot, and N is the total number of individuals of all species in a plot.

2.2.3. NDVI

Landsat 8 OLI/TIRS C1 Level-1 cloud-free datasets in August 2016 and 2017, corresponding to the field vegetation sampling date and covering the study area were downloaded (https://earthexplorer.usgs.gov/, accessed in 10 April 2020). The monthly Landsat 8 cloud-free datasets from January to December 2016 were also downloaded, but the Landsat 8 datasets in 2017 was not downloaded due to clouds in January, March, June, and July. Atmospheric correction of Landsat 8 images was conducted in Environment for Visualizing Images (ENVI) software [44]. The NDVI values were calculated in ArcMap 10.2 as follows:
N D V I =   N I R R E D / N I R + R E D ,
where NIR is the reflection value of near-infrared band; RED is the reflection value of red band.

2.3. Data Analysis

2.3.1. Estimated AGB Using NDVI

A 30 m circular buffer was created for each vegetation sampling site in ArcMap 10.2, due to the vegetation sampling location error and spatial resolution of GI. The unary regression equation between the mean NDVI of the 30 m circular buffer and its corresponding measured AGB was mapped by the package basicTrendline in R [45]. The summarized result of Akaike’s information criterion (AIC) [46] was used to choose the linear, quadratic, power, exponential, or log fitted model. Outliers were deleted by the standardized residuals of the predicted value greater than absolute value of 2. Based on the regression model, the monthly spatial distribution of AGB within the study area was calculated using NDVI in ArcMap 10.2.

2.3.2. Response of AGB and Growth Rate to Grazing

The spatial distribution of plant growth rate was calculated in terms of the spatial distribution of AGB in ArcMap 10.2 as follows:
g r o w t h   r a t e i ,   j   g / m 2 · d = ( A G B i A G B j ) / d ,
where AGBi and AGBj are the spatial distributions of AGB in months i and j, respectively, in the growing season from March to August; d is the time interval of days.
A total of 40,000 random points were created in the study area. The GI, AGB in each month, and plant growth rate were extracted to the random points in ArcMap 10.2. The number of random points was 35,034 in the grazed area and 2801 in the ungrazed area. Least Significant Difference multiple comparison was conducted in R to test the differences in monthly AGB using a significance level of p = 0.05. We sorted the random points from smallest to largest in terms of GI (larger than 0), averaged AGB, and averaged growth rate every 0.05 unit increment of GI. The unary regression functions were applied to analyze the relationships between GI and AGB in each month, GI and growth rate at different plant growth stages in the package basicTrendline in R, respectively. AIC was used to choose the best models of linear, quadratic, power, exponential, or log in R. The random points in the grazed area were randomly subsampled and reduced to 2801 points. AGB and growth rate of the grazed area were compared with that of ungrazed area using t.test in R, respectively.
The effects of grazing on grassland, interannual variability of utilization of biomass, and utilization rate [47] by goats were calculated as follows:
                    U t i l i z a t i o n   b i o m a s s i , j   g / m 2 =   A G B i   o f   u n g r a z e d   a r e a A G B i , j ,  
U t i l i z t i o n   r a t e i , j   % = U t i l i z a t i o n   b i o m a s s i , j × 100 % A n n u a l   p r o d u c t i o n   o f   r a n g e l a n d   u n g r a z e d   a r e a ,
where A G B i , j ,   u t i l i z a t i o n   b i o m a s s i , j and u t i l i z a t i o n   r a t e i , j are the AGB, utilization biomass, and utilization rate by goats in month i and GI j, respectively.

2.3.3. Response of Vegetation Community Structure to Grazing

We analyzed the unary relationship between the GI of 30 m circular buffer of 32 vegetation sampling sites and AGB, density, height, richness, diversity, evenness, dominance, IV of grasses and forbs in the package basicTrendline in R, respectively. AIC was used to choose the best models of linear, quadratic, power, exponential, or log in R.

3. Results

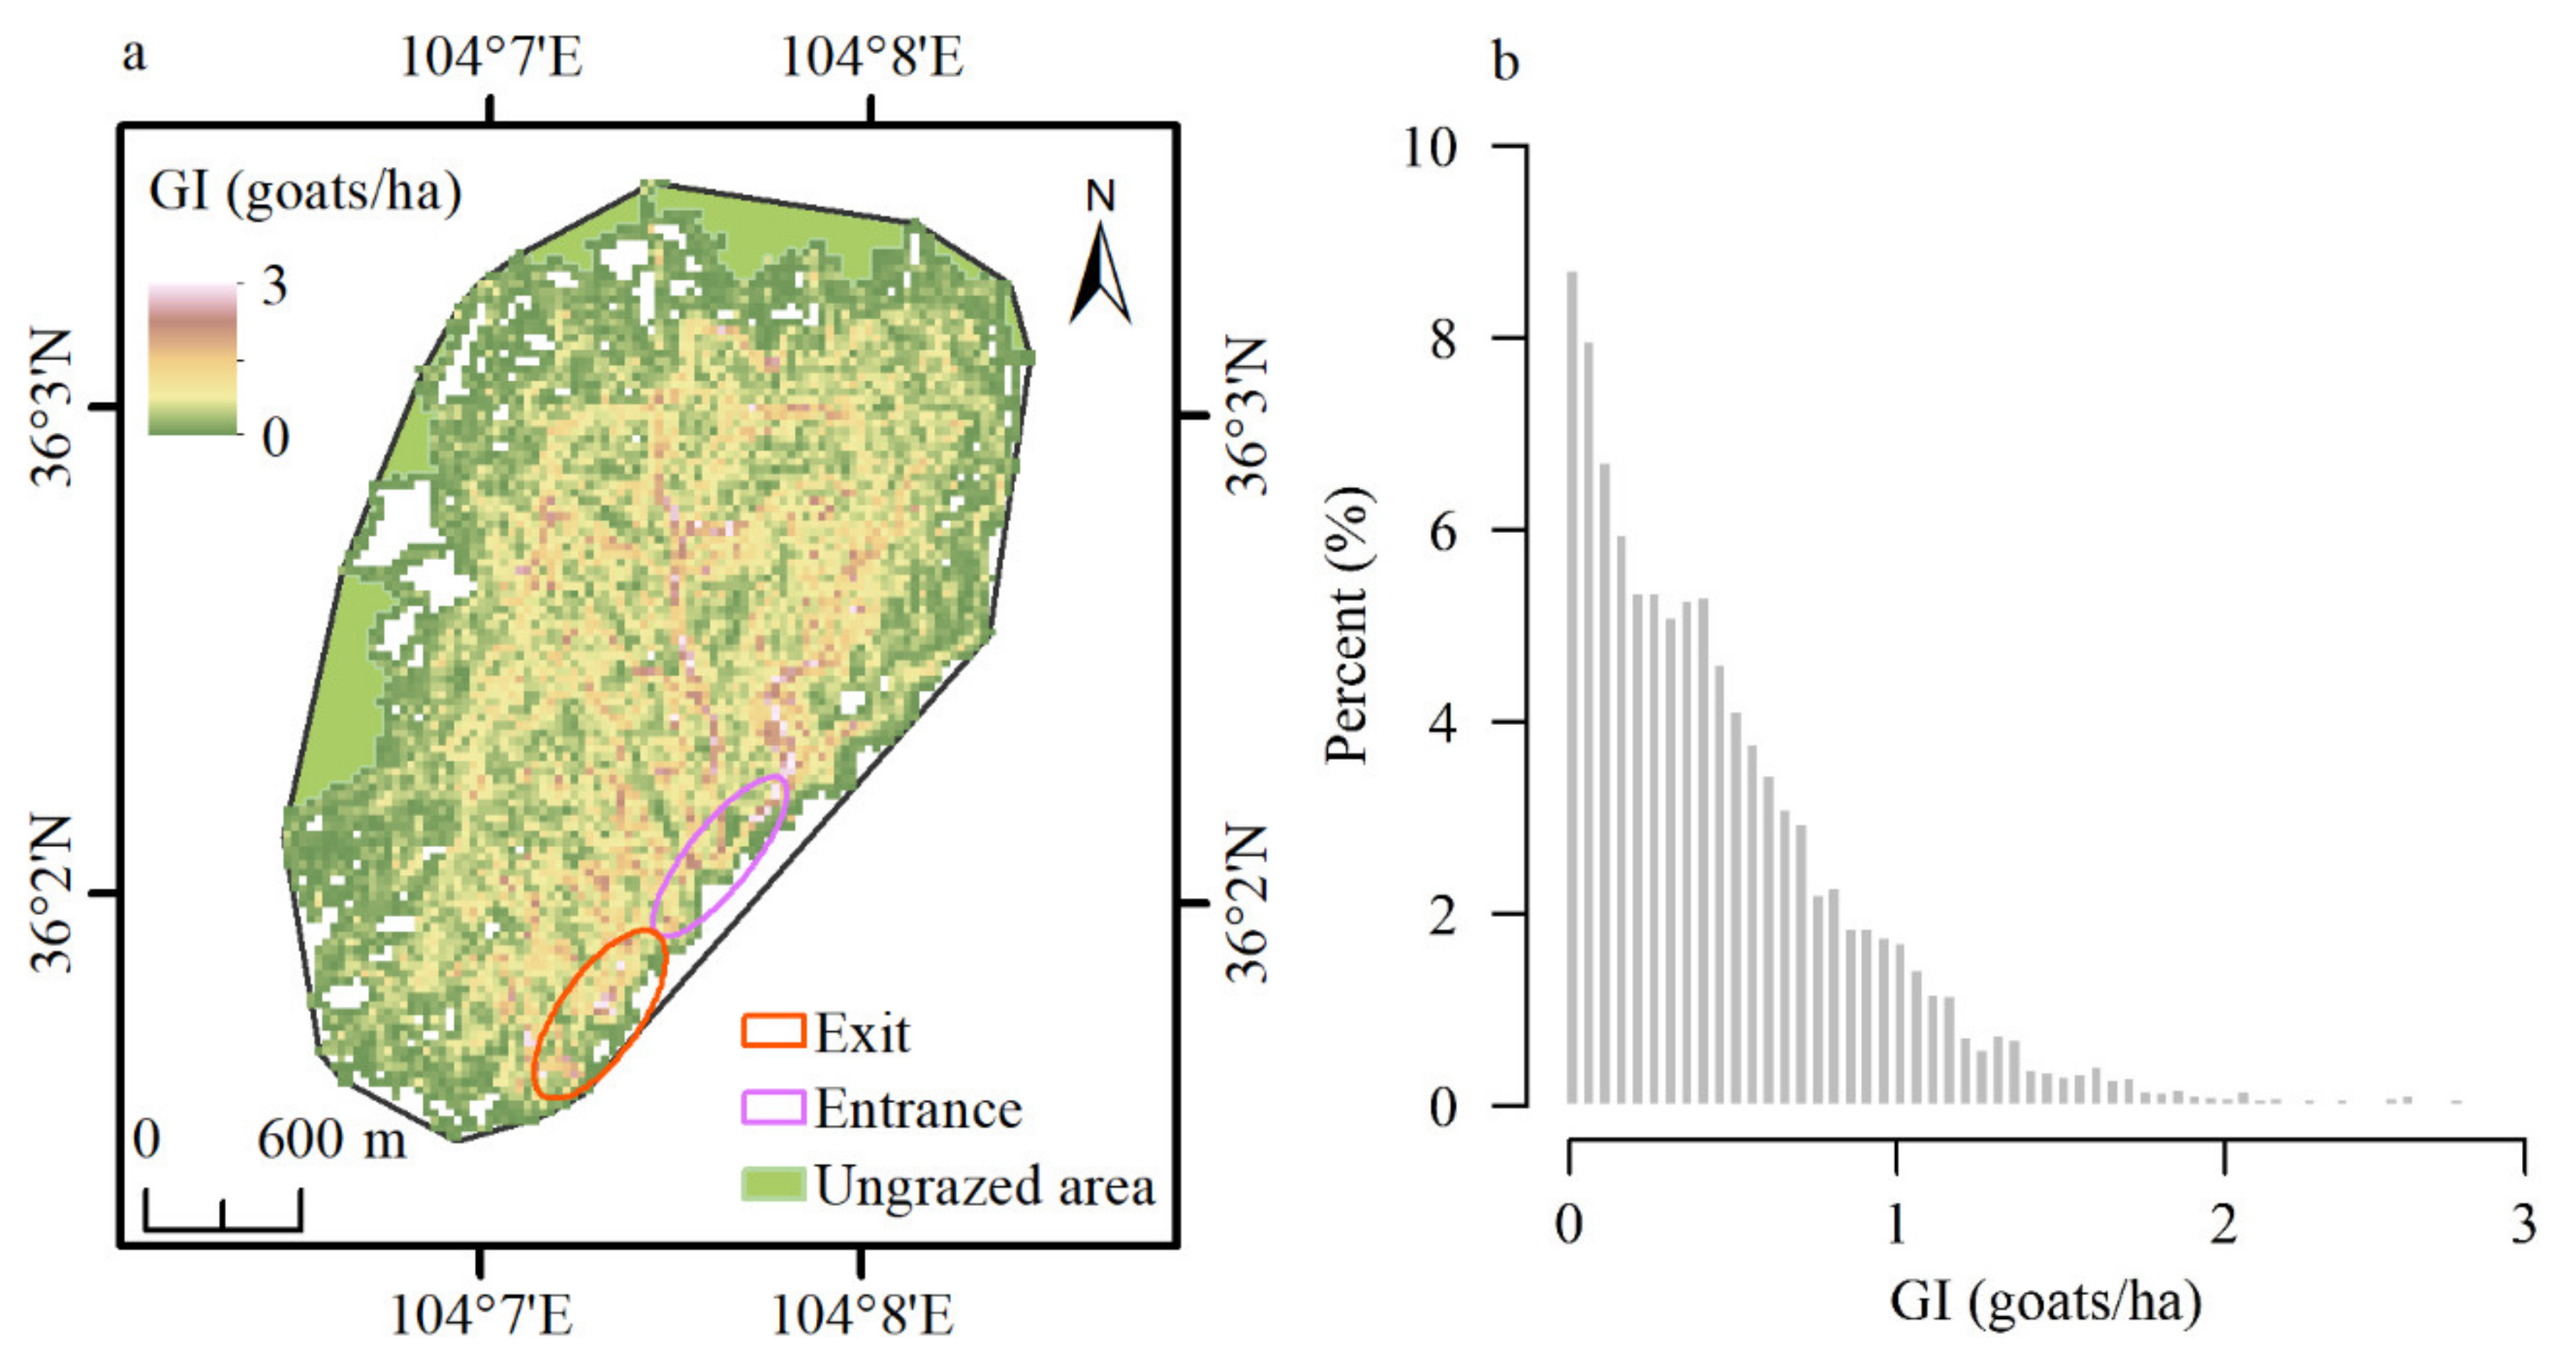
3.1. Grazing Intensity (GI)

The mean GI was 0.50 ± 0.44 goats/ha (means + std), ranging from 0 goats/ha to 3 goats/ha (Figure 2a). The frequency distribution of GI showed a decreasing trend (Figure 2b); 95% of the study area had GI less than 1.30 goats/ha and 99% less than 2.00 goats/ha (Figure 2b). The spatial distribution of GI in the mountain was uneven, and relatively heavy GI was mainly distributed in the entrance pass, exit pass, and valley (Figure 2a).

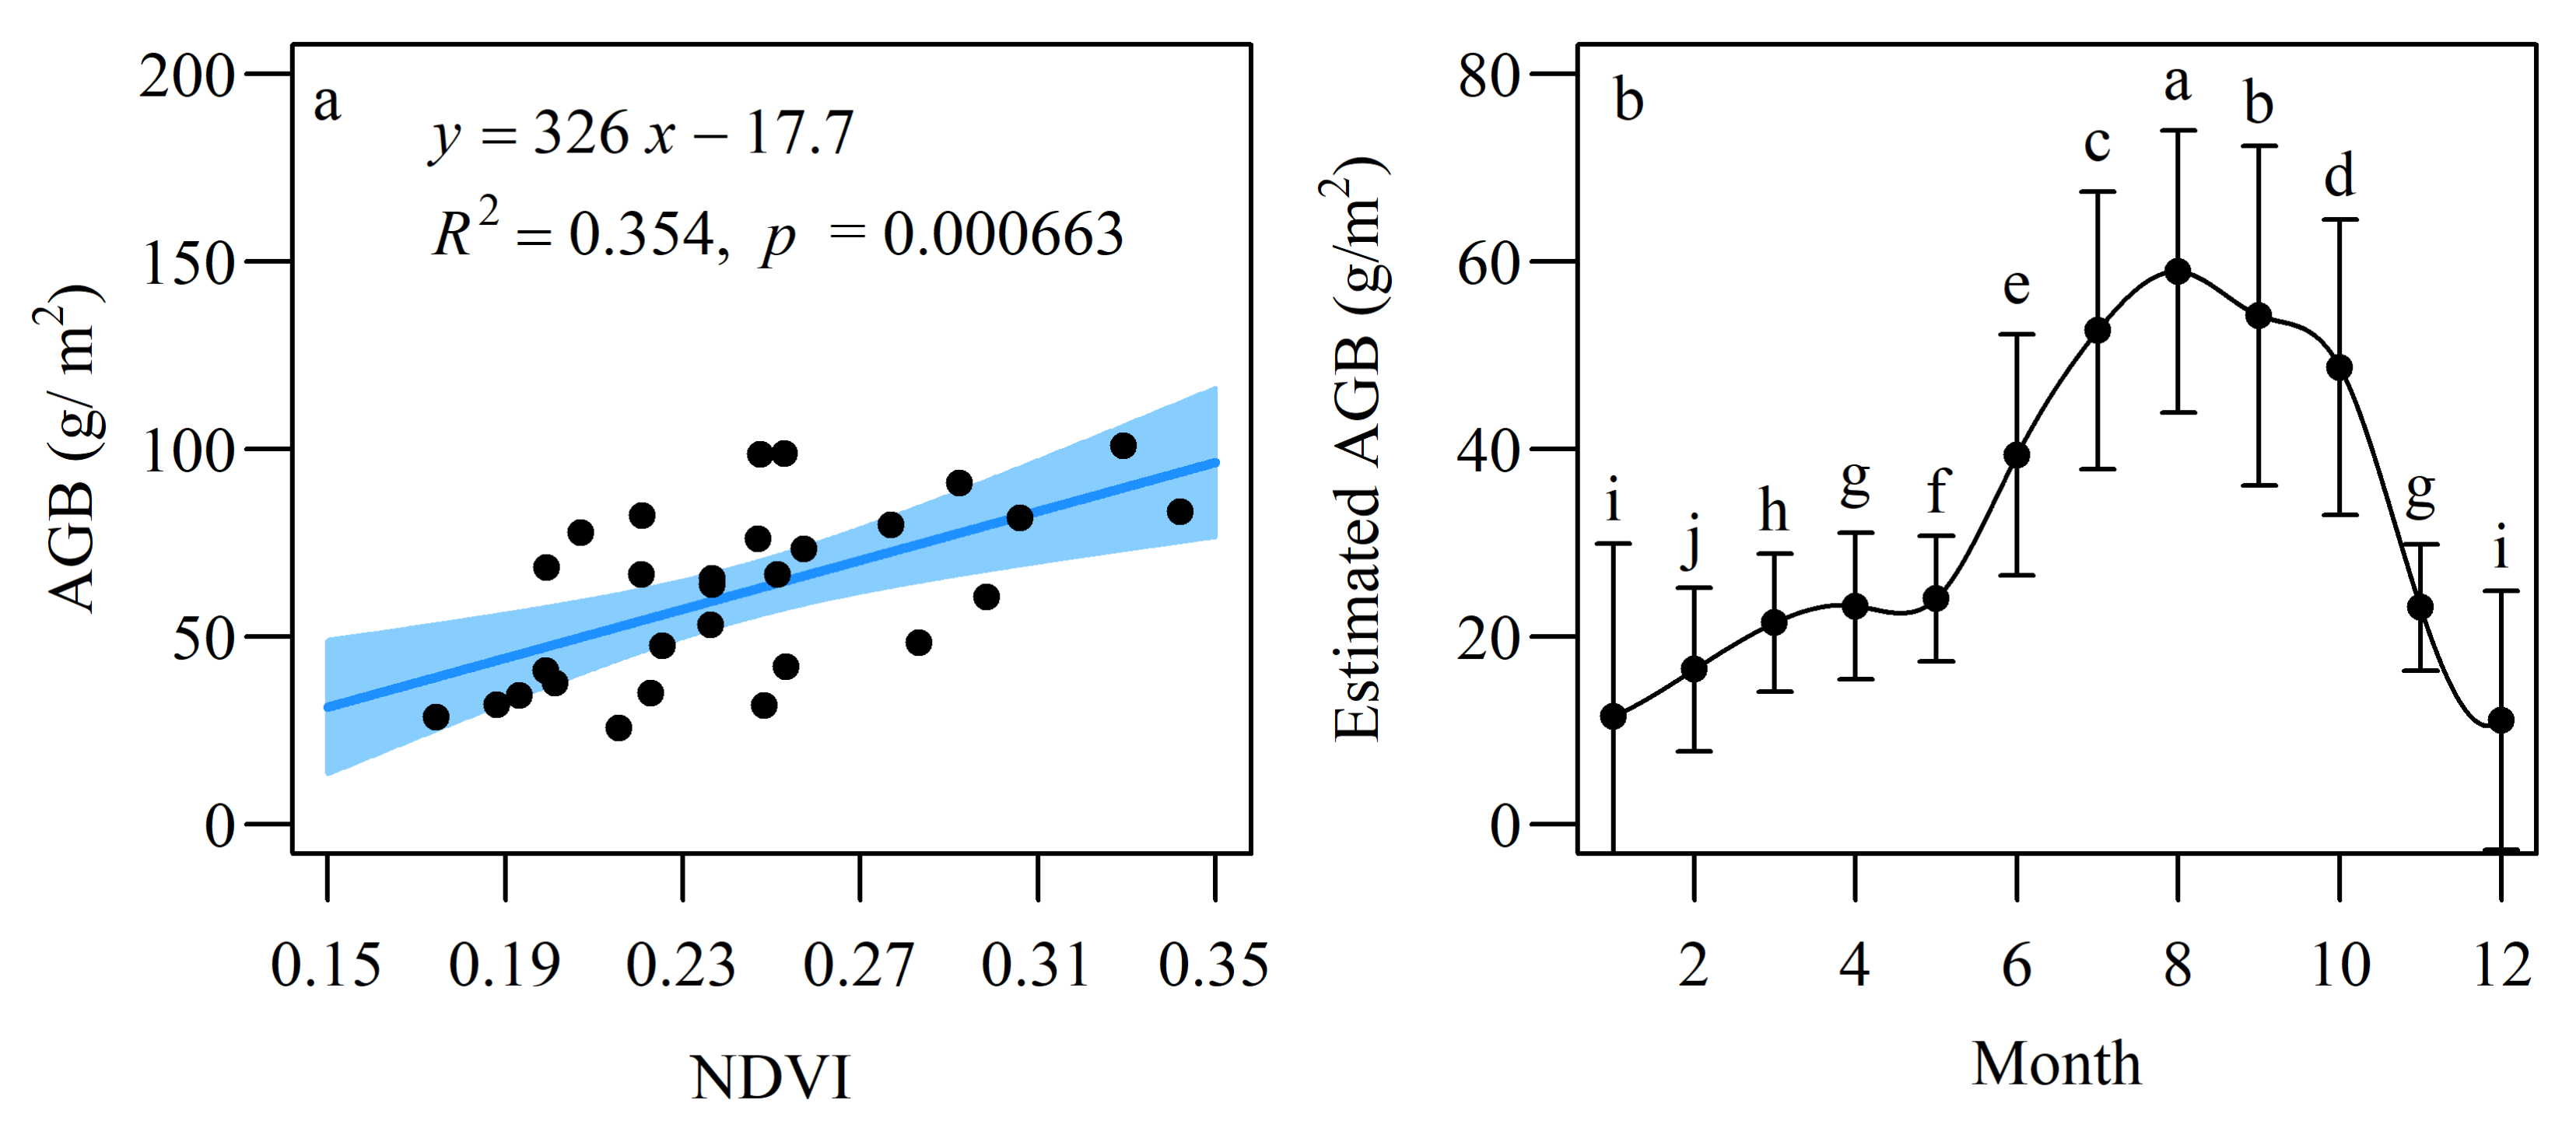
3.2. Estimated AGB Using NDVI

The relationship between AGB and NDVI had a significantly positive linear correlation for the vegetation sampling sites (R2 = 0.35, p < 0.01) (Figure 3a). The spatial distribution of AGB in each month in 2016 was estimated using the time-series NDVI data based on their regression function. The mean AGB in each month, ranging from 11.05 to 58.92 g/m2, showed a trend of increasing from February to August and decreasing from August to December (Figure 3b).

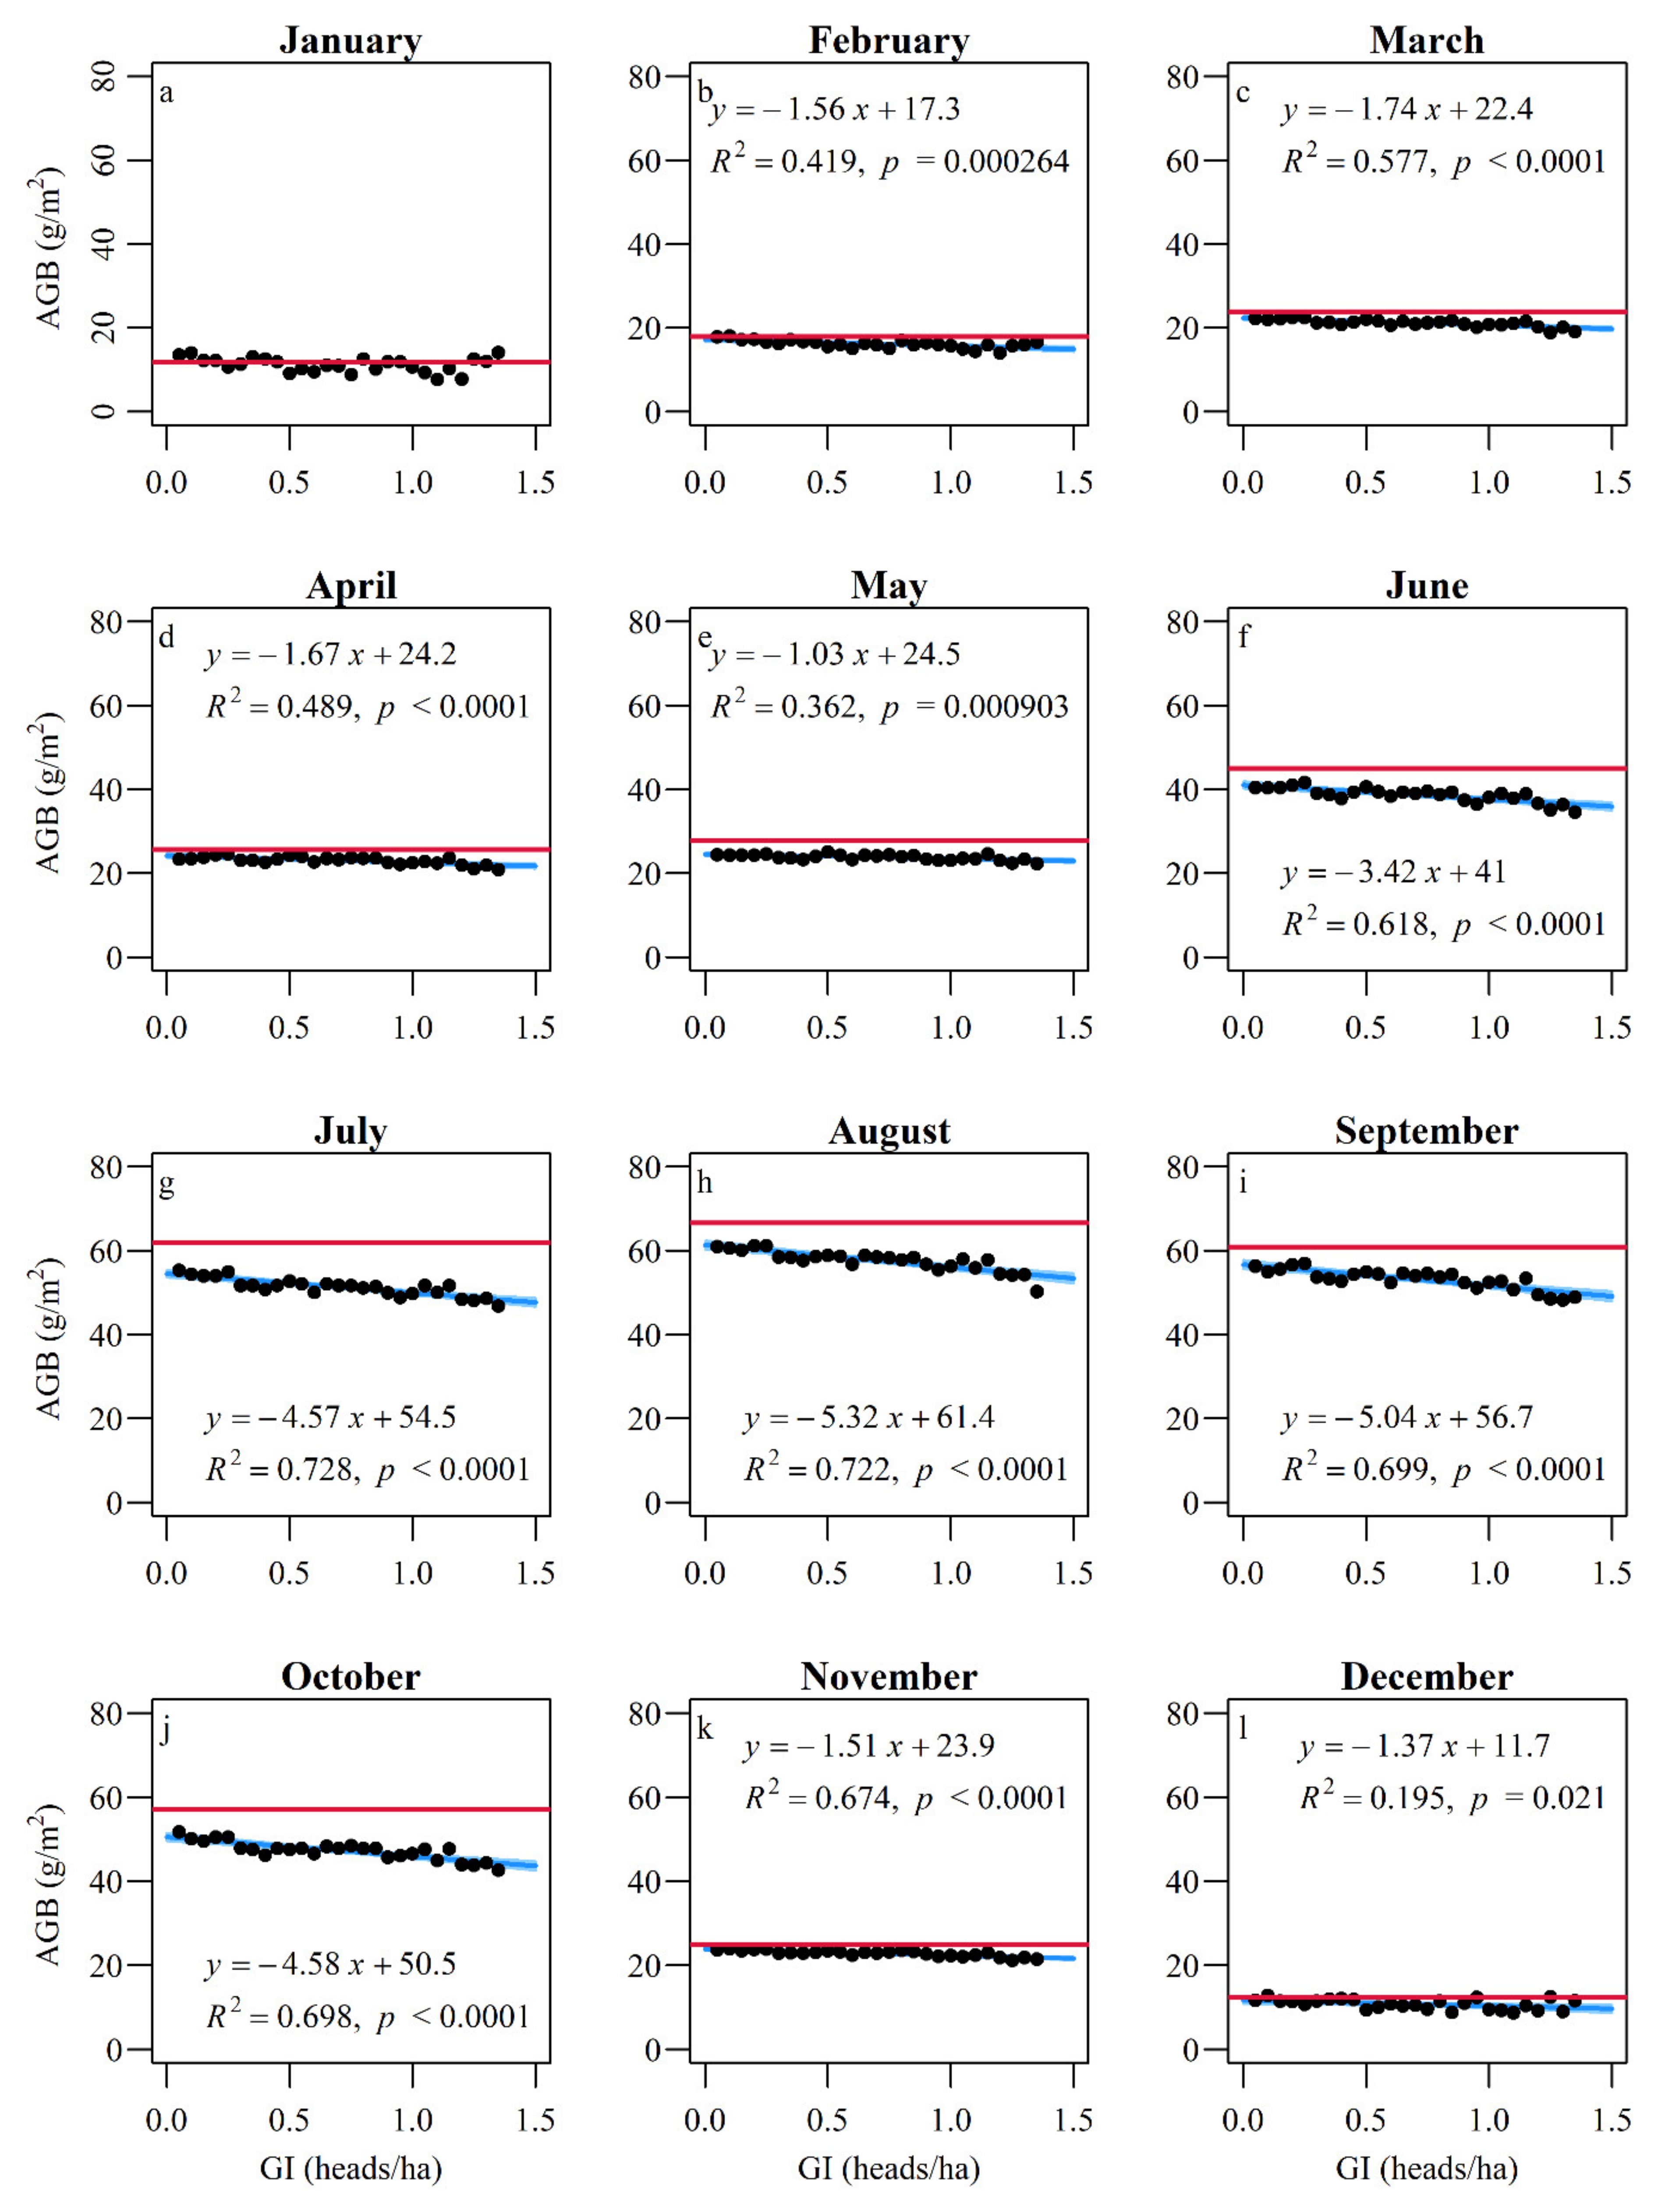
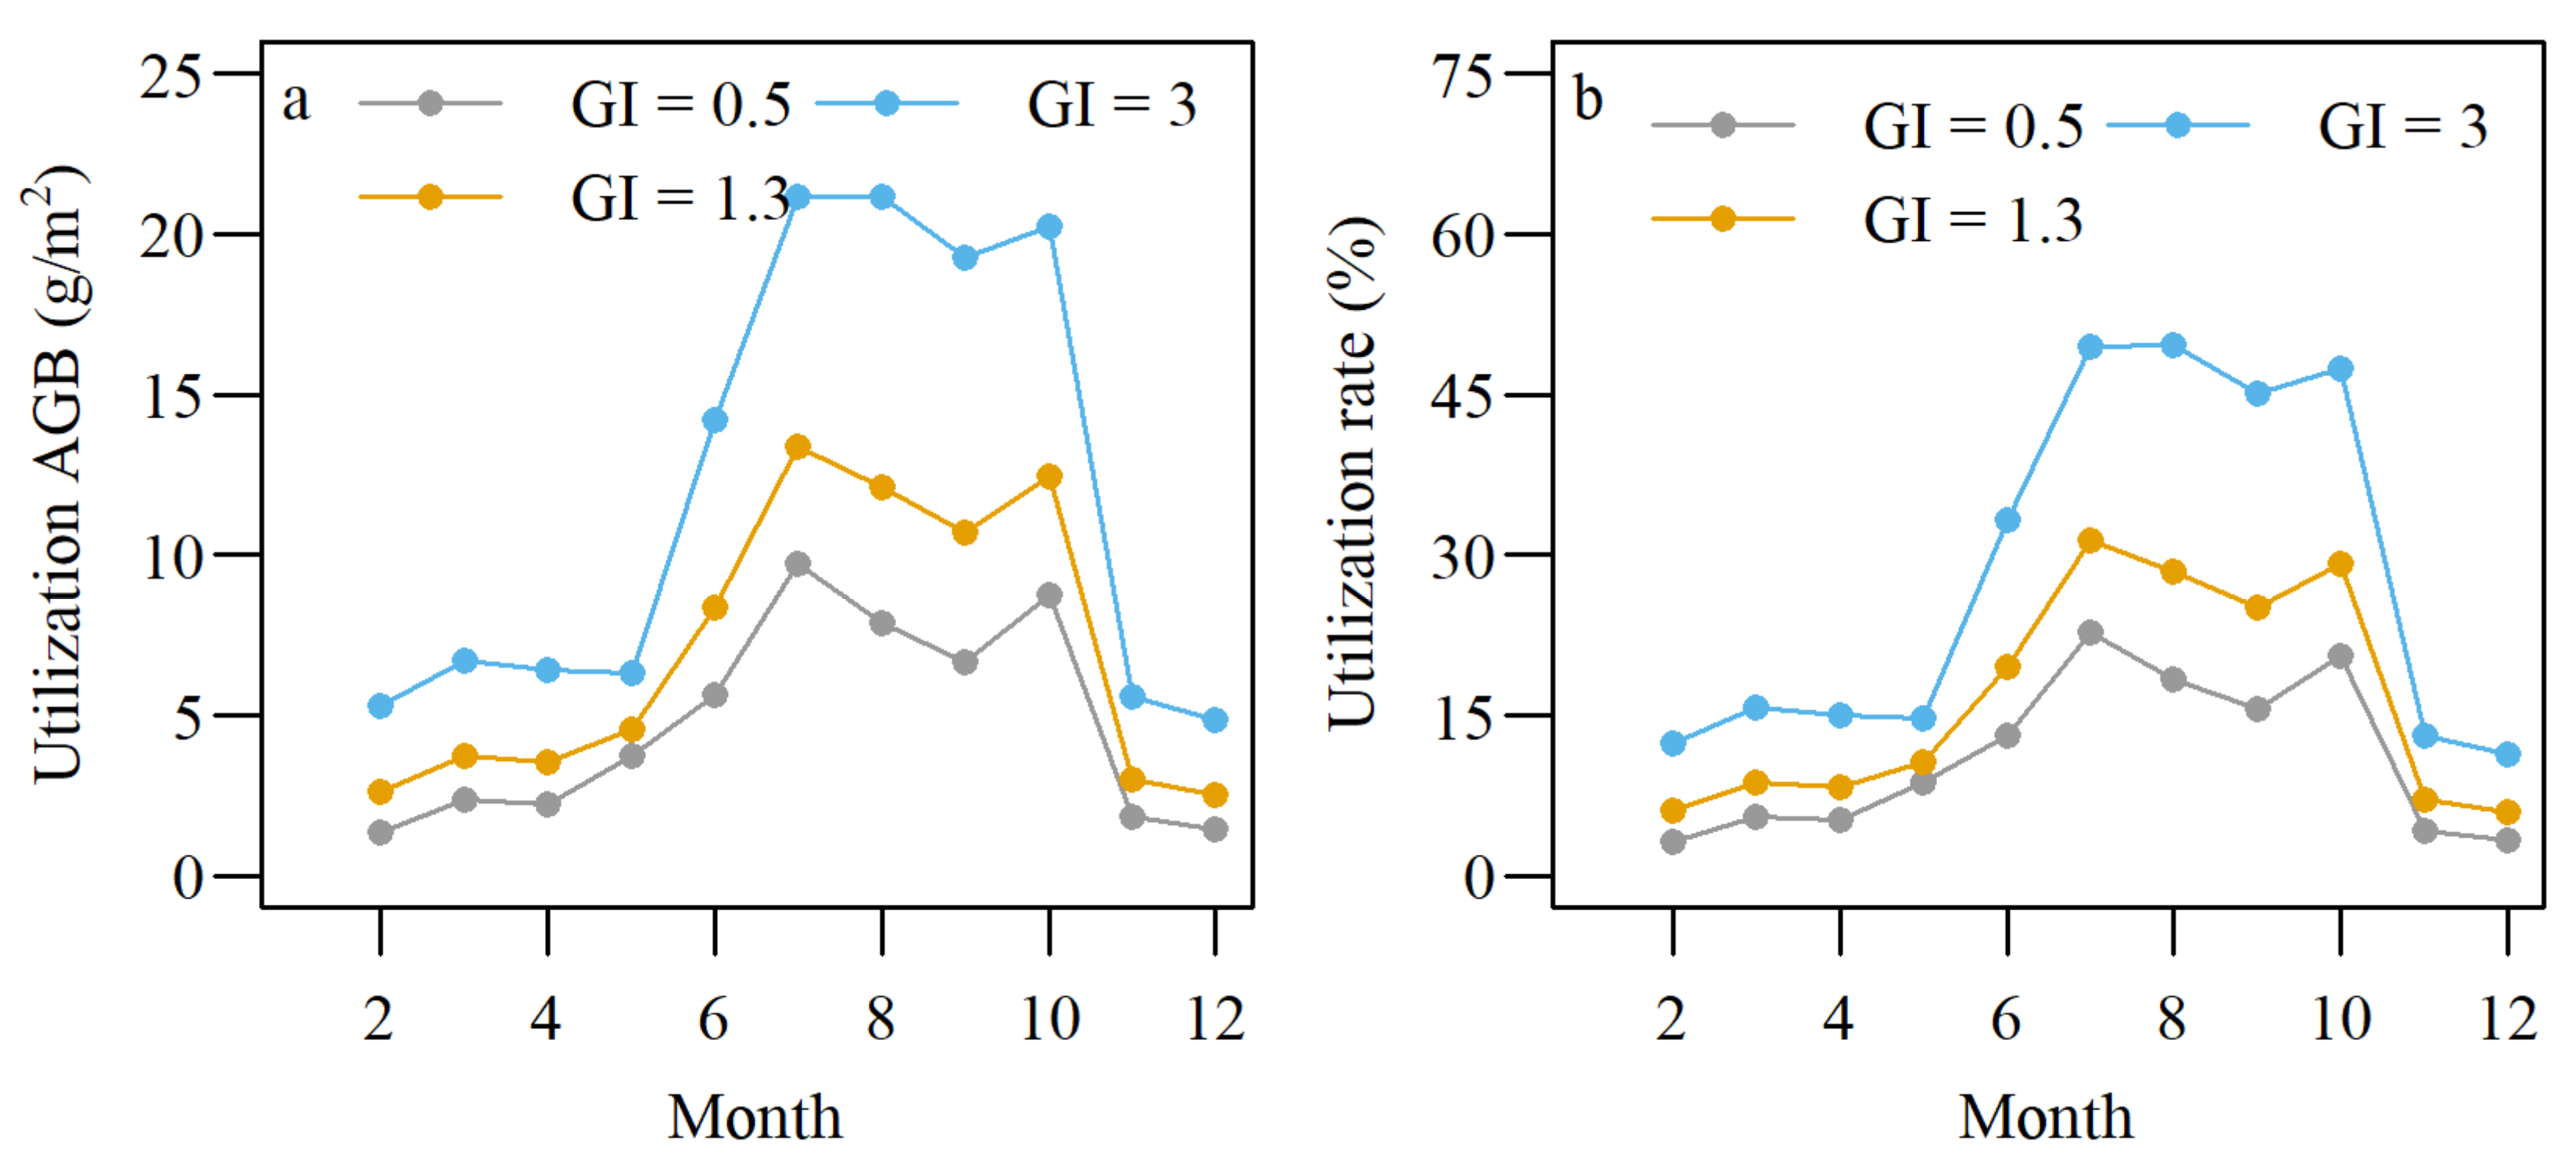
3.3. Response of AGB and Growth Rate to Grazing

The relationship between GI and AGB showed a significantly negative linear relation from February to December 2016, respectively (p < 0.05) (Figure 4b–l). The relationship between monthly AGB and GI was insignificant in January (p > 0.05) (Figure 4a), maybe due to snow cover. The AGB of ungrazed areas was not significantly different to grazed area in January (p > 0.05), and higher than grazed areas from February to December (p < 0.01) (Figure 4).
The relationships between plant growth rate and GI level varied, showing unimodal curve, linear decrease, opposite unimodal curve, and logarithmic decrease at different plant growth stages (Figure 5). During the whole growing season (March–August) and May–July, the growth rate significantly decreased with the increase in GI (p < 0.0001) (Figure 5a,d,e). In March–April and July–August, the unimodal curves best described the relationships between the growth rate and GI level (p < 0.01), and the growth rate peaked at a GI of 0.73 and 0.59 goats/ha, respectively (Figure 5b,f). In April–May, opposite unimodal curves best described the relationships between the growth rate and GI level (p < 0.0001), and the growth rate was lowest at a GI of 0.43 goats/ha (Figure 5c). The growth rate of grazed areas had no significant differences with the ungrazed areas in March–April (p < 0.01) (Figure 5b). The growth rate of grazed areas exceeded the ungrazed areas in July–August (p < 0.01) (Figure 5f). In other times, the growth rate of grazed areas were lower than that of ungrazed areas (p < 0.01) (Figure 5a,c–e).
The monthly utilization of biomass and rate changed over different months, and generally peaked at the periods of high biomass (Figure 6). The monthly utilization biomass ranged from 1.37 to 9.73, 2.54 to 13.38, and 4.87 to 21.16 g/m2, with mean monthly values of 4.70, 7.01, and 11.93 g/m2 at a GI of 0.50, 1.30, and 3.00 goats/ha, respectively (Figure 6a). The monthly utilization rates ranged from 3.23% to 22.78%, 5.94% to 31.34%, and 11.39% to 49.56%, with mean monthly values of 11.00%, 16.41%, and 27.93%, at a GI of 0.50, 1.30, and 3.00 goats/ha, respectively (Figure 6b).

3.4. Response of Vegetation Community Structure to Grazing

The responses of vegetation AGB, density, height, species richness, diversity, evenness, and dominance to GI of 0–1.6 goats/ha were insignificant (p > 0.05) on the basis of vegetation sampling data (Figure 7a–g). There were eight species of grasses and 27 species of forbs in the study area (Supplementary File S1). The IV of species of grasses and forbs made up 22.31% and 77.69% of the total species, respectively (Supplementary File S1). The relationship between GI and the IV of grasses at each site was insignificant (p > 0.05), but the IV of forbs at each site increased with the increase in GI (p < 0.001) (Figure 7h,i).

4. Discussion

4.1. Relationship between AGB and NDVI

The relationship between AGB and NDVI had a significantly positive linear correlation for the vegetation sampling sites (R2 = 0.35, p < 0.01) (Figure 3a). NDVI is consistent correlation with vegetation AGB [25,48,49] and NDVI acquired from TM data was the most important predictive factor for AGB in the Loess Plateau [49]. The explained coefficient (R2) between the NDVI and AGB was 0.45 in semiarid grassland [31] and 0.57 in typical steppe region [50] of China. The explained coefficient (R2 = 0.35) between NDVI and AGB found in this study was lower than other studies in grasslands. The explained coefficients of this study need further improvement by increasing vegetation sampling points, improving GPS accuracy, extending study region, or adding other vegetation indices. The monthly spatial distribution of AGB within the study area was calculated using NDVI, and then the utilization measurement and growth rate were calculated based on the estimated AGB.

4.2. Assessing the GI

The spatial distribution of GI in the mountain was uneven (Figure 2). The relatively high GIs were mainly distributed in the entrance pass, exit pass, and valley, and GI decreased with greater distance from these areas (Figure 2). GI varied in accordance with the movements of livestock and the spatial distribution of available forage resource, topography, and thermal conditions [35,36,37,38,39]. High GIs are often found around the water points or surrounding of settlements, resulting in overgrazing and degeneration of grasslands [32,51]. Bare soil patches appeared around the entrance pass, exit pass, and valley (relatively flat) due to heavy grazing pressure and trampling. The grazing distributions of these goats and cattle in semiarid rangelands of North America both showed preference for flat and lowland areas [39].
In this study, the mean GI was approximately 0.50 goats/ha, ranging from 0 to 3 goats/ha, and 95% of the study area had less than 1.30 goats/ha (Figure 2). The mean GI in our study is lower than other regions with similar annual precipitation grasslands [33,52]. The carrying capacity in a mountainous area ranged from 0.63 to 0.92 goats/ha in south-eastern Spain with mean annual precipitation of 324 mm [52]. A GI of 2–3 sheep/ha was sustainable in the Horqin sandy grassland in Inner Mongolia with annual mean precipitation of 370 mm [33]. However, only relying on the GI of animals to evaluate the effect on vegetation is difficult, because the effect varies with grazing animal, climatic condition, and grassland type.
The utilization rates of rangeland can be used as a management tool to achieve a GI that is ecologically healthy and economically sustainable [28,29,30]. The monthly utilization rates ranged from 3.23% to 22.78%, 5.94% to 31.34%, and 11.39% to 49.56%, with mean monthly values of 11.00%, 16.41%, and 27.93%, at GI of 0.50, 1.30, and 3.00 goats/ha, respectively (Figure 6b). Thus, the highest utilization rate (July) in at least 95% of the study area was lower than the agricultural standard of proper utilization rate of temperate typical steppe of 45% [47]. The utilization rate of approximately 20% was taken as moderate grazing pressure in the typical steppe of China, and moderate grazing pressure was used for ecosystem services and livestock production [53]. Johnston, et al. [30] proposed that the long-term safe utilization rate by domestic livestock is 15–20% in south-west Queensland, Australia. In approximately 60% of the study area, the highest utilization rate (July) was lower than 20%. Conclusively, the GI of most study areas were light or moderate in terms of the utilization rate.
The monthly utilization of biomass and rate generally peaked at the periods of high biomass (Figure 6), when conservative livestock numbers should be adjusted to maintain a safe utilization rate and grassland condition over a long-term period. Hunt [28] suggested that managing utilization is the priority during the growing seasons, when grazing has detrimental effects on plant survival, regrowth, and productivity [54]. The goats cannot obtain sufficient forage in low biomass periods (for example, the utilization biomass by goats in February was only 14.18% of that in July at a GI of 0.5 goats/ha). This effect was accentuated by high GI. Supplementary forage grass or reducing the number of goats at the end of the growing season can achieve the best compromise between livestock production and rangeland sustainability [28].

4.3. Response of AGB to Grazing

The monthly AGB (from February to December) exhibited a significant decreasing trend with an increase in GI from the spatial analysis of the study area (p < 0.05) (Figure 4), though an insignificant relationship was found from the vegetation sampling data (p > 0.05) (Figure 7a). Yan, et al. [16] found that light GI reduces AGB, but the effects were insignificant from a meta-analysis. AGB exhibited a significant decreasing trend with an increase in GI in most grassland regions of northern China [16,23,55,56,57] and the world [10]. The percentage reduction of AGB in our study area (13.24% in July at a GI of 0.5 goats/ha) was lower than the proportional reduction 47.86% from other site of Loess Plateau [25,58], 42.77% from 251 data sets in China [16], and 23% from 236 data sets around the world [10].
The relationship between GI and AGB showed a significantly negative linear rela-tion (Figure 4), indicating that the AGB did not exhibit the phenomenon of plant compensatory growth, and plant growth rates failed to compensate for the tissue lost to grazers. During most of the growing periods, the plant growth rates of grazed areas were lower than ungrazed areas (Figure 5), indicating that grazing impairs the plant growth rate. At the beginning (March–April) and end (July–August) of growing seasons, the plant growth rates of grazed areas were higher than ungrazed areas (Figure 5b,f). During the above two periods, the plant growth rates showed unimodal curves correlation with GI, peaking at intermediate GI (Figure 5b,f). Liu, et al. [59] found that intermediate GI level can promote plant growth rate in meadow steppe. The fast transition of the grazing effect on plant growth rate and the complex and various relationships between plant growth rate and GI level at different plant growth stages (Figure 5) were possibly related to local climatic factors [11] and species regrowth ability at different growth stages [60]. Exploring the influence factors about the grazing effect on plant growth rate can help us to explain the controversy of compensatory growth.

4.4. Response of Species Diversity and Composition to Grazing

Our results indicated that grazing had minimal relationship with vegetation community structure characteristics on the basis of field sampling data (Figure 7). The responses of plant AGB, density, height, species richness, diversity, evenness, and dominance were insignificant (p > 0.05) (Figure 7a–g). Mackey, et al. [61] concluded from a meta-analysis that nonsignificant relationships between grazing disturbance and diversity, richness, and evenness are common. From the meta-analyses of Wang, et al. [62], the plant diversity significantly increases after grazing, but the change of species richness and diversity affected by grazing is smaller from a world-wide meta-analysis [21].
Species diversity did not peak at intermediate GI (Figure 7e). Yuan, et al. [17] believed that many studies miss the species diversity peak at intermediate disturbance, because the disturbance levels are either extremely small or extremely large. The spatial scale in this study area was less than Yuan, et al. [17]. Many other studies found that grazing has a negative impact on plant diversity and height, especially for degraded, nutrient poor, or low productivity ecosystems [20,21,22,24], where the ability to recover after grazing is low [22,27]. The long evolutionary history of plant–livestock interactions changed the physiognomy of grasslands [34] and led to the grassland community adapted to and tolerant to grazing [18], which may partially explain why no significant correlation was found between GI and vegetation diversity.
There was no significant response in the IV of high forage quality grass species in 2016 and 2017 to GI (p > 0.05) (Figure 7h). The dominant grass species of S. capillata and E. borealis exhibited relatively high grazing tolerance and regrowth ability [60,63]. Desirable species composition of grasses can be maintained at proper GI [28,29,30]. However, the IV of forb species in 2016 and 2017, relatively low forage quality, increased with the increase in GI from the vegetation sampling analysis in 2016 and 2017 (p < 0.01) (Figure 7i). Extending multiple years of analysis on the effects of grazing to species composition would be helpful to verify these results. Grazing increased the forbs component of vegetation in the temperate grassland on the Mongolian Plateau, and grazing removal increased the dominance of grasses [3]. Livestock prefer species of high forage quality [64]. Changes in vegetation composition from palatable grass species to less preferred forb species resulting from heavy grazing have been reported in many ecosystems [20,23,24,25]. In the fire-grazing system, the preference of herbivores for recently burned areas rather than greater time, since fire resulted from herbivores selecting for high forage quality [65]. The effect of grazing on species composition was determined by livestock preference and the different strategies of plants to compete and compensate for herbage removal under grazing [60,66,67].

5. Conclusions

The spatial distribution of GI in the mountain was uneven, with a mean GI of 0.50 goats/ha, and 95% of the study area had less than 1.30 goats/ha. The monthly utilization of biomass and rate changed over different months, and generally peaked at the periods of high biomass. Utilization rates (July) lower than 45% and 20% made up approximately 95% and 60% of the study area, respectively. This finding indicated that most study areas belong to light or moderate GI. The spatial relationship between GI and monthly AGB showed a significantly negative linear relation. However, the grazing effect on the plant growth rate was complex, and various relationships were developed at different plant growth stages. At the end (July–August) of growing season, the plant growth rates of grazed areas were higher than ungrazed areas. During this period, the plant growth rates showed unimodal curve correlation with GI, peaking at intermediate GI. Further exploring the grazing effect on plant growth rate can help us to explain the phenomenon of compensatory growth. On the basis of field sampling vegetation data, the GI had minimal relationship with vegetation community structure characteristics, such as AGB, density and height, diversity, evenness, dominance, and IV of grasses, though IV of forbs increased with the increase in GI.
In order to achieve ecologically healthy and economically sustainable GI, utilization rate should be adjusted in the high biomass period and forage grass should be supplemented or the number of goats should be reduced at the end of the growing season. In addition, we should prohibit over exploitation of the areas of entrance pass and exit pass by periodically changing these places though human intervention. Balancing of GPS tracking data and field sampling should be addressed, and integrating vegetation dynamics with spatial movements of livestock and abiotic environmental factors would be helpful to make adequate management decisions for grasslands.

Supplementary Materials

The following are available online at https://www.mdpi.com/2071-1050/13/6/3569/s1. The plant functional groups and species composition of the study area.

Author Contributions

Conceptualization: H.C., B.J., and G.S.; data curation: H.C.; formal analysis: H.C. and B.J.; funding acquisition: B.J.; investigation: H.C., K.L., J.P., X.Z., Y.Z., and J.T.; methodology: H.C. and J.P.; project administration: H.C. and B.J.; resources: G.S.; software: H.C.; supervision: B.J. and G.S.; validation: H.C.; visualization: H.C.; writing—original draft: H.C.; writing—review and editing: H.C., B.J., and Q.Y. All authors have read and agreed to the published version of the manuscript.

Funding

This work was funded by grants to Baocheng Jin from the National Natural Science Foundation of China (31700390), Department of Science and Technology of Guizhou Province (2017-5788), and the project of State Key Laboratory of Grassland Agro-ecosystems (SKLGAE201703).

Institutional Review Board Statement

Ethical review and approval were waived for this study. All the procedures involving goats capturing and GPS installing were performed by the local shepherd under the current ethical guidelines. No drug injections are involved in this study.

Informed Consent Statement

Not applicable.

Data Availability Statement

Data used in the current study is available from the lead author on reasonable request.

Acknowledgments

We thank the local shepherd Jielong Jin for helping us to collect GPS tracking data with his goat herd and sharing his knowledge with us. We thank Xulong Zhang and Jianzhou Wei for their assistance in the field work. We aslo thank Jianzhou Wei for his assistance in statistical analysis.

Conflicts of Interest

The authors declare no conflict of interest.

References

  1. Asner, G.P.; Elmore, A.J.; Olander, L.P.; Martin, R.E.; Harris, A.T. Grazing systems, ecosystem responses, and global change. Annu. Rev. Environ. Resour. 2004, 29, 261–299. [Google Scholar] [CrossRef]
  2. Kang, L.; Han, X.; Zhang, Z.; Sun, O.J. Grassland ecosystems in China: Review of current knowledge and research advancement. Philos. Trans. R. Soc. B 2007, 362, 997–1008. [Google Scholar] [CrossRef] [PubMed]
  3. Liu, Y.; Pan, Q.; Liu, H.; Bai, Y.; Simmons, M.; Dittert, K.; Han, X. Plant responses following grazing removal at different stocking rates in an Inner Mongolia grassland ecosystem. Plant Soil 2011, 340, 199–213. [Google Scholar] [CrossRef]
  4. Perrino, E.V.; Musarella, C.M.; Magazzini, P. Management of grazing Italian river buffalo to preserve habitats defined by Directive 92/43/EEC in a protected wetland area on the Mediterranean coast: Palude Frattarolo, Apulia, Italy. Euro Mediterr. J. Environ. Integr. 2021, 6, 32. [Google Scholar] [CrossRef]
  5. Silva, V.; Pinto-Cruz, C.; Espírito-Santo, M.D. Temporary ponds and hygrophilous grasslands plant communities in Monfurado site of community importance. Lazaroa 2009, 30, 81–88. [Google Scholar]
  6. Wang, X.; Zhang, W.; Sun, Y.; Han, G. Yuzhong County Annals; GanSu People’s Publishing House: Lanzhou, China, 2001; pp. 3–4. [Google Scholar]
  7. Hu, Z.; Zhao, Z.; Zhang, Y.; Jing, H.; Gao, S.; Fang, J. Does ‘Forage-Livestock Balance’ policy impact ecological efficiency of grasslands in China? J. Clean. Prod. 2019, 207, 343–349. [Google Scholar] [CrossRef]
  8. Belsky, A.J. Does herbivory benefit plants? A review of the evidence. Am. Nat. 1986, 127, 870–892. [Google Scholar] [CrossRef]
  9. McNaughton, S. Compensatory plant growth as a response to herbivory. Oikos 1983, 40, 329–336. [Google Scholar] [CrossRef]
  10. Milchunas, D.G.; Lauenroth, W.K. Quantitative effects of grazing on vegetation and soils over a global range of environments. Ecol. Monogr. 1993, 63, 327–366. [Google Scholar] [CrossRef]
  11. Ren, H.; Schönbach, P.; Wan, H.; Gierus, M.; Taube, F. Effects of grazing intensity and environmental factors on species composition and diversity in typical steppe of Inner Mongolia, China. PLoS ONE 2012, 7, e52180. [Google Scholar] [CrossRef] [Green Version]
  12. Schönbach, P.; Wan, H.; Gierus, M.; Bai, Y.; Müller, K.; Lin, L.; Susenbeth, A.; Taube, F. Grassland responses to grazing: Effects of grazing intensity and management system in an Inner Mongolian steppe ecosystem. Plant Soil 2011, 340, 103–115. [Google Scholar] [CrossRef]
  13. Raynor, E.J.; Derner, J.D.; Baldwin, T.; Ritten, J.P.; Augustine, D.J. Multidecadal directional shift in shortgrass stocking rates. Rangel. Ecol. Manag. 2021, 74, 72–80. [Google Scholar] [CrossRef]
  14. Stephenson, M.B.; Volesky, J.D.; Schacht, W.H.; Lawrence, N.C.; Soper, J.; Milby, J. Influence of precipitation on plant production at different topographic positions in the nebraska sandhills. Rangel. Ecol. Manag. 2019, 72, 103–111. [Google Scholar] [CrossRef]
  15. Ma, H.; Xie, Y. Plant compensatory growth under different grazing intensities in desert steppe. Sci. Agric. Sin. 2008, 41, 3645–3650. [Google Scholar]
  16. Yan, L.; Zhou, G.; Zhang, F. Effects of different grazing intensities on grassland production in China: A meta-analysis. PLoS ONE 2013, 8, e81466. [Google Scholar] [CrossRef]
  17. Yuan, Z.Y.; Jiao, F.; Li, Y.H.; Kallenbach, R.L. Anthropogenic disturbances are key to maintaining the biodiversity of grasslands. Sci. Rep. 2016, 6, 22132. [Google Scholar] [CrossRef] [PubMed] [Green Version]
  18. Milchunas, D.G.; Sala, O.E.; Lauenroth, W.K. A generalized model of the effects of grazing by large herbivores on grassland community structure. Am. Nat. 1988, 132, 87–106. [Google Scholar] [CrossRef]
  19. Connell, J.H. Diversity in tropical rain forests and coral reefs. Science 1978, 199, 1302–1310. [Google Scholar] [CrossRef] [Green Version]
  20. Sun, D.; Wesche, K.; Chen, D.; Zhang, S.; Wu, G.; Du, G.; Comerford, N. Grazing depresses soil carbon storage through changing plant biomass and composition in a Tibetan alpine meadow. Plant Soil Environ. 2011, 57, 271–278. [Google Scholar] [CrossRef] [Green Version]
  21. Herrero-Jáuregui, C.; Oesterheld, M. Effects of grazing intensity on plant richness and diversity: A meta-analysis. Oikos 2018, 127, 757–766. [Google Scholar] [CrossRef]
  22. Proulx, M.; Mazumder, A. Reversal of grazing impact on plant species richness in nutrient-poor vs. nutrient-rich ecosystems. Ecology 1998, 79, 2581–2592. [Google Scholar] [CrossRef]
  23. Zhu, G.; Tang, Z.; Chen, L.; ShangGuan, Z.; Deng, L. Overgrazing depresses soil carbon stock through changing plant diversity in temperate grassland of the Loess Plateau. Plant Soil Environ. 2018, 64, 1–6. [Google Scholar]
  24. Deng, L.; Sweeney, S.; Shangguan, Z.P. Grassland responses to grazing disturbance: Plant diversity changes with grazing intensity in a desert steppe. Grass Forage Sci. 2014, 69, 524–533. [Google Scholar] [CrossRef]
  25. Zainelabdeen, Y.M.; Yan, R.; Xin, X.; Yan, Y.; Ahmed, A.I.; Hou, L.; Zhang, Y. The impact of grazing on the grass composition in temperate grassland. Agronomy 2020, 10, 1230. [Google Scholar] [CrossRef]
  26. Zhou, Z.C.; Shangguan, Z.P.; Zhao, D. Modeling vegetation coverage and soil erosion in the Loess Plateau Area of China. Ecol. Model. 2006, 198, 263–268. [Google Scholar] [CrossRef]
  27. Simons, L.; Allsopp, N. Rehabilitation of rangelands in Paulshoek, Namaqualand: Understanding vegetation change using biophysical manipulations. J. Arid Environ. 2007, 70, 755–766. [Google Scholar] [CrossRef]
  28. Hunt, L.P. Safe pasture utilisation rates as a grazing management tool in extensively grazed tropical savannas of Northern Australia. Rangel. J. 2008, 30, 305–315. [Google Scholar] [CrossRef]
  29. Cowley, R.; McCosker, K.; MacDonald, R.; Hearnden, M. Optimal pasture utilisation rates for sustainable cattle production with a commercial Brahman herd in the Victoria River Downs region of the Northern Territory. In Proceedings of the Northern Beef Research Update Conference’, Townsville, Australia, 1 January 2007; pp. 34–44. [Google Scholar]
  30. Johnston, P.; McKeon, G.; Day, K. Objective ’safe’ grazing capacities for south-west Queensland Australia: Development of a model for individual properties. Rangel. J. 1996, 18, 244–258. [Google Scholar] [CrossRef]
  31. Kawamura, K.; Akiyama, T.; Yokota, H.-o.; Tsutsumi, M.; Yasuda, T.; Watanabe, O.; Wang, S. Quantifying grazing intensities using geographic information systems and satellite remote sensing in the Xilingol steppe region, Inner Mongolia, China. Agric. Ecosyst. Environ. 2005, 107, 83–93. [Google Scholar] [CrossRef]
  32. Akasbi, Z.; Oldeland, J.; Dengler, J.; Finckh, M. Analysis of GPS trajectories to assess goat grazing pattern and intensity in Southern Morocco. Rangel. J. 2012, 34, 415–427. [Google Scholar] [CrossRef]
  33. Zhang, T.H.; Zhao, H.L.; Li, S.G.; Zhou, R.L. Grassland changes under grazing stress in Horqin sandy grassland in Inner Mongolia, China. N. Z. J. Agric. Res. 2004, 47, 307–312. [Google Scholar] [CrossRef] [Green Version]
  34. Mack, R.N.; Thompson, J.N. Evolution in steppe with few large, hooved mammals. Am. Nat. 1982, 119, 757–773. [Google Scholar] [CrossRef]
  35. Fortin, D.; Fryxell, J.M.; Pilote, R. The temporal scale of foraging decisions in bison. Ecology 2002, 83, 970–982. [Google Scholar] [CrossRef]
  36. van Beest, F.M.; Mysterud, A.; Loe, L.E.; Milner, J.M. Forage quantity, quality and depletion as scale-dependent mechanisms driving habitat selection of a large browsing herbivore. J. Anim. Ecol. 2010, 79, 910–922. [Google Scholar] [CrossRef] [PubMed]
  37. Owen-Smith, N. Effects of temporal variability in resources on foraging behaviour. Res. Ecol. 2008, 23, 159–181. [Google Scholar]
  38. Huang, Y.; Wang, L.; Wang, D.; Zeng, D.-H.; Li, Y.; Liu, J.; Wang, Y. Foraging responses of sheep to plant spatial micro-patterns can cause diverse associational effects of focal plant at individual and population levels. J. Anim. Ecol. 2018, 87, 863–873. [Google Scholar] [CrossRef]
  39. Raynor, E.J.; Gersie, S.P.; Stephenson, M.B.; Clark, P.E.; Spiegal, S.A.; Boughton, R.K.; Bailey, D.W.; Cibils, A.; Smith, B.W.; Derner, J.D.; et al. Cattle grazing distribution patterns related to topography across diverse rangeland ecosystems of North America. Rangel. Ecol. Manag. 2021, 75, 91–103. [Google Scholar] [CrossRef]
  40. Junges, A.H.; Bremm, C.; Fontana, D.C.; Oliveira, C.A.O.d.; Schaparini, L.P.; Carvalho, P.C.d.F. Temporal profiles of vegetation indices for characterizing grazing intensity on natural grasslands in Pampa biome. Sci. Agric. 2016, 73, 332–337. [Google Scholar] [CrossRef] [Green Version]
  41. Food and Agriculture Organization of the United Nations (FAO); The International Institute for Applied Systems Analysis (IIASA); International Soil Reference and Information Centre (ISRIC); Institute of Soil Science—Chinese Academy of Sciences (ISSCAS); Joint Research Centre of the European Commission (JRC). Harmonized World Soil Database (version 1.2); FAO; IIASA: Italy, Rome; Laxenburg, Austria, 2012. [Google Scholar]
  42. Holechek, J.L.; Gomes, H.D.S.; Molinar, F.; Galt, D. Grazing intensity: Critique and approach. Rangelands 1998, 20, 15–18. [Google Scholar]
  43. ESRI. ArcGIS; 10.2; Environmental Systems Research Institute: Redlands, CA, USA, 2013. [Google Scholar]
  44. ENVI. Environment for Visualizing Images; 5.0; Exelis Visual Information Solutions: Boulder, CO, USA, 2013. [Google Scholar]
  45. R Core Team, R. A Language and Environment for Statistical Computing; R Foundation for Statistical Computing: Vienna, Austria, 2016. [Google Scholar]
  46. Akaike, H. Information theory and an extension of the maximum likelihood principle. In Selected Papers of Hirotugu Akaike; Springer: New York, NY, USA, 1998; pp. 199–213. [Google Scholar] [CrossRef]
  47. The Ministry of Agriculture of the People’s Republic of China. Agriculture Industry Standard of the People’s Republic of China: Calculation of Rangeland Carrying Capacity; China Meteorological Press: Beijing, China, 2015; pp. 1–6. [Google Scholar]
  48. Pettorelli, N.; Vik, J.O.; Mysterud, A.; Gaillard, J.-M.; Tucker, C.J.; Stenseth, N.C. Using the satellite-derived NDVI to assess ecological responses to environmental change. Trends Ecol. Evol. 2005, 20, 503–510. [Google Scholar] [CrossRef]
  49. Wang, Y.; Wu, G.; Deng, L.; Tang, Z.; Wang, K.; Sun, W.; Shangguan, Z. Prediction of aboveground grassland biomass on the Loess Plateau, China, using a random forest algorithm. Sci. Rep. 2017, 7, 6940. [Google Scholar] [CrossRef] [Green Version]
  50. Jin, Y.; Yang, X.; Qiu, J.; Li, J.; Gao, T.; Wu, Q.; Zhao, F.; Ma, H.; Yu, H.; Xu, B. Remote sensing-based biomass estimation and its spatio-temporal variations in temperate grassland, Northern China. Remote Sens. 2014, 6, 1496–1513. [Google Scholar] [CrossRef] [Green Version]
  51. Adler, P.B.; Hall, S.A. The development of forage production and utilization gradients around livestock watering points. Landsc. Ecol. 2005, 20, 319–333. [Google Scholar] [CrossRef]
  52. Robles, A.B.; Passera, C.B. Native forage shrub species in south-eastern Spain: Forage species, forage phytomass, nutritive value and carrying capacity. J. Arid Environ. 1995, 30, 191–196. [Google Scholar] [CrossRef]
  53. Zhang, Y.; Huang, D.; Badgery, W.B.; Kemp, D.R.; Chen, W.; Wang, X.; Liu, N. Reduced grazing pressure delivers production and environmental benefits for the typical steppe of north China. Sci. Rep. 2015, 5, 16434. [Google Scholar] [CrossRef] [Green Version]
  54. Ash, A.; McIvor, J.; Mott, J.; Andrew, M. Building grass castles: Integrating ecology and management of Australia’s tropical tallgrass rangelands. Rangel. J. 1997, 19, 123–144. [Google Scholar] [CrossRef]
  55. Wang, Z.; Johnson, D.; Rong, Y.; Wang, K. Grazing effects on soil characteristics and vegetation of grassland in northern China. Solid Earth 2016, 7, 55–65. [Google Scholar] [CrossRef] [Green Version]
  56. Ma, Q.; Chai, L.; Hou, F.; Chang, S.; Ma, Y.; Tsunekawa, A.; Cheng, Y. Quantifying grazing intensity using remote sensing in alpine meadows on Qinghai-Tibetan plateau. Sustainability 2019, 11, 417. [Google Scholar] [CrossRef] [Green Version]
  57. Glindemann, T.; Wang, C.; Tas, B.M.; Schiborra, A.; Gierus, M.; Taube, F.; Susenbeth, A. Impact of grazing intensity on herbage intake, composition, and digestibility and on live weight gain of sheep on the Inner Mongolian steppe. Livest. Sci. 2009, 124, 142–147. [Google Scholar] [CrossRef]
  58. Ren, G.; Wang, C.; Dong, K.; Zhu, H.; Wang, Y.; Zhao, X. Effects of grazing exclusion on soil–vegetation relationships in a semiarid grassland on the Loess Plateau, China. Land Degrad. Dev. 2018, 29, 4071–4079. [Google Scholar] [CrossRef]
  59. Liu, Y.; Wang, D.; Han, S.; Wang, X. Effect of grazing intensity on the regrowth capability in Leymus chinensis grassland. Acta Pratac. Sci. 2004, 13, 39–44. [Google Scholar]
  60. Fanselow, N.; Schönbach, P.; Gong, X.Y.; Lin, S.; Taube, F.; Loges, R.; Pan, Q.; Dittert, K. Short-term regrowth responses of four steppe grassland species to grazing intensity, water and nitrogen in Inner Mongolia. Plant Soil 2011, 340, 279–289. [Google Scholar] [CrossRef]
  61. Mackey, R.L.; Currie, D.J. The diversity–disturbance relationship: Is it generally strong and peaked? Ecology 2001, 82, 3479–3492. [Google Scholar]
  62. Wang, C.; Tang, Y. A global meta-analyses of the response of multi-taxa diversity to grazing intensity in grasslands. Environ. Res. Lett. 2019, 14, 114003. [Google Scholar] [CrossRef] [Green Version]
  63. Jia, S. Forage Floras of China; Agriculture Press: Beijing, China, 1987; Volume 1, pp. 191–193. [Google Scholar]
  64. Dumont, B.; Carrère, P.; D’Hour, P. Foraging in patchy grasslands: Diet selection by sheep and cattle is affected by the abundance and spatial distribution of preferred species. Anim. Res. 2002, 51, 367–381. [Google Scholar] [CrossRef] [Green Version]
  65. Allred, B.W.; Fuhlendorf, S.D.; Engle, D.M.; Elmore, R.D. Ungulate preference for burned patches reveals strength of fire–grazing interaction. Ecol. Evol. 2011, 1, 132–144. [Google Scholar] [CrossRef] [PubMed]
  66. Tahmasebi Kohyani, P.; Bossuyt, B.; Bonte, D.; Hoffmann, M. Differential herbivory tolerance of dominant and subordinate plant species along gradients of nutrient availability and competition. Plant Ecol. 2008, 201, 247–255. [Google Scholar]
  67. Augustine, D.J.; McNaughton, S.J. Ungulate effects on the functional species composition of plant communities: Herbivore selectivity and plant tolerance. J. Wildlife Manag. 1998, 62, 1165–1183. [Google Scholar] [CrossRef]
Figure 1. The vegetation field sampling sites, one exemplary GPS tracking data of goats and general mountain grassland landscape in the study area.
Sustainability 13 03569 g001
Figure 2. Spatial distribution (a) and frequency distribution (b) of grazing intensity (GI).
Sustainability 13 03569 g002
Figure 3. (a) Relationship between normalized difference vegetation index (NDVI) and aboveground biomass (AGB) in August. The relationship is best described by linear regression (dark blue line). Blue shade refers to 95% confidence interval of the fitted curves. Significant regression at p < 0.05 is represented. (b) Monthly AGB (means + std) variation of the study area in 2016. Significant letters at p < 0.05 is represented.
Sustainability 13 03569 g003
Figure 4. Relationships between GI and monthly estimated AGB in January (a), February (b), March (c), April (d), May (e), June (f), July (g), August (h), September (i), October (j), November (k), and December (l) 2016. The relationships are best described by linear regression (dark blue lines). Blue shades refer to 95% confidence interval of the fitted curves. Red lines refer to the AGB of ungrazed areas. Significant regression at p < 0.05 is represented.
Sustainability 13 03569 g004
Figure 5. Relationships between GI and plant growth rate from March to August (a), from March to April (b), from April to May (c), from May to June (d), from June to July (e), and from July to August (f) in 2016. The relationships are best described by dark blue lines. Blue shades refer to 95% confidence interval of the fitted curves. Red lines refer to the plant growth rate of ungrazed areas. Orange dotted lines denote the GI for the highest or lowest growth rate in the quadratic function. Significant regression at p < 0.05 is represented.
Sustainability 13 03569 g005
Figure 6. Monthly utilization biomass (a) and rate (b) by the goats at different Gis.
Sustainability 13 03569 g006
Figure 7. Relationships between GI and AGB (a), density (b), height (c), richness (d), diversity (e), evenness (f), dominance (g), and Importance Value (IV) of grasses (h) and forbs (i). The relationships are best described by dark blue lines. Blue shades refer to 95% confidence interval of the fitted curves. Significant regression at p < 0.05 is represented.
Sustainability 13 03569 g007
Table 1. The number of GPS tracking data of goats over different years and months.
MonthYear
20132014201520162017Total
1 1515
2 11
3 66
4 171624
5 13518
6 2 2
7 1 18 19
812 5 8
9 7 13 20
1029 15 26
11 6 0 6
12423 9 36
Total74818243181
Publisher’s Note: MDPI stays neutral with regard to jurisdictional claims in published maps and institutional affiliations.

