
Econometrics of Anthropogenic Emissions, Green Energy-Based Innovations, and Energy Intensity across OECD Countries

 ,
,  and
and
Abstract
:1. Introduction
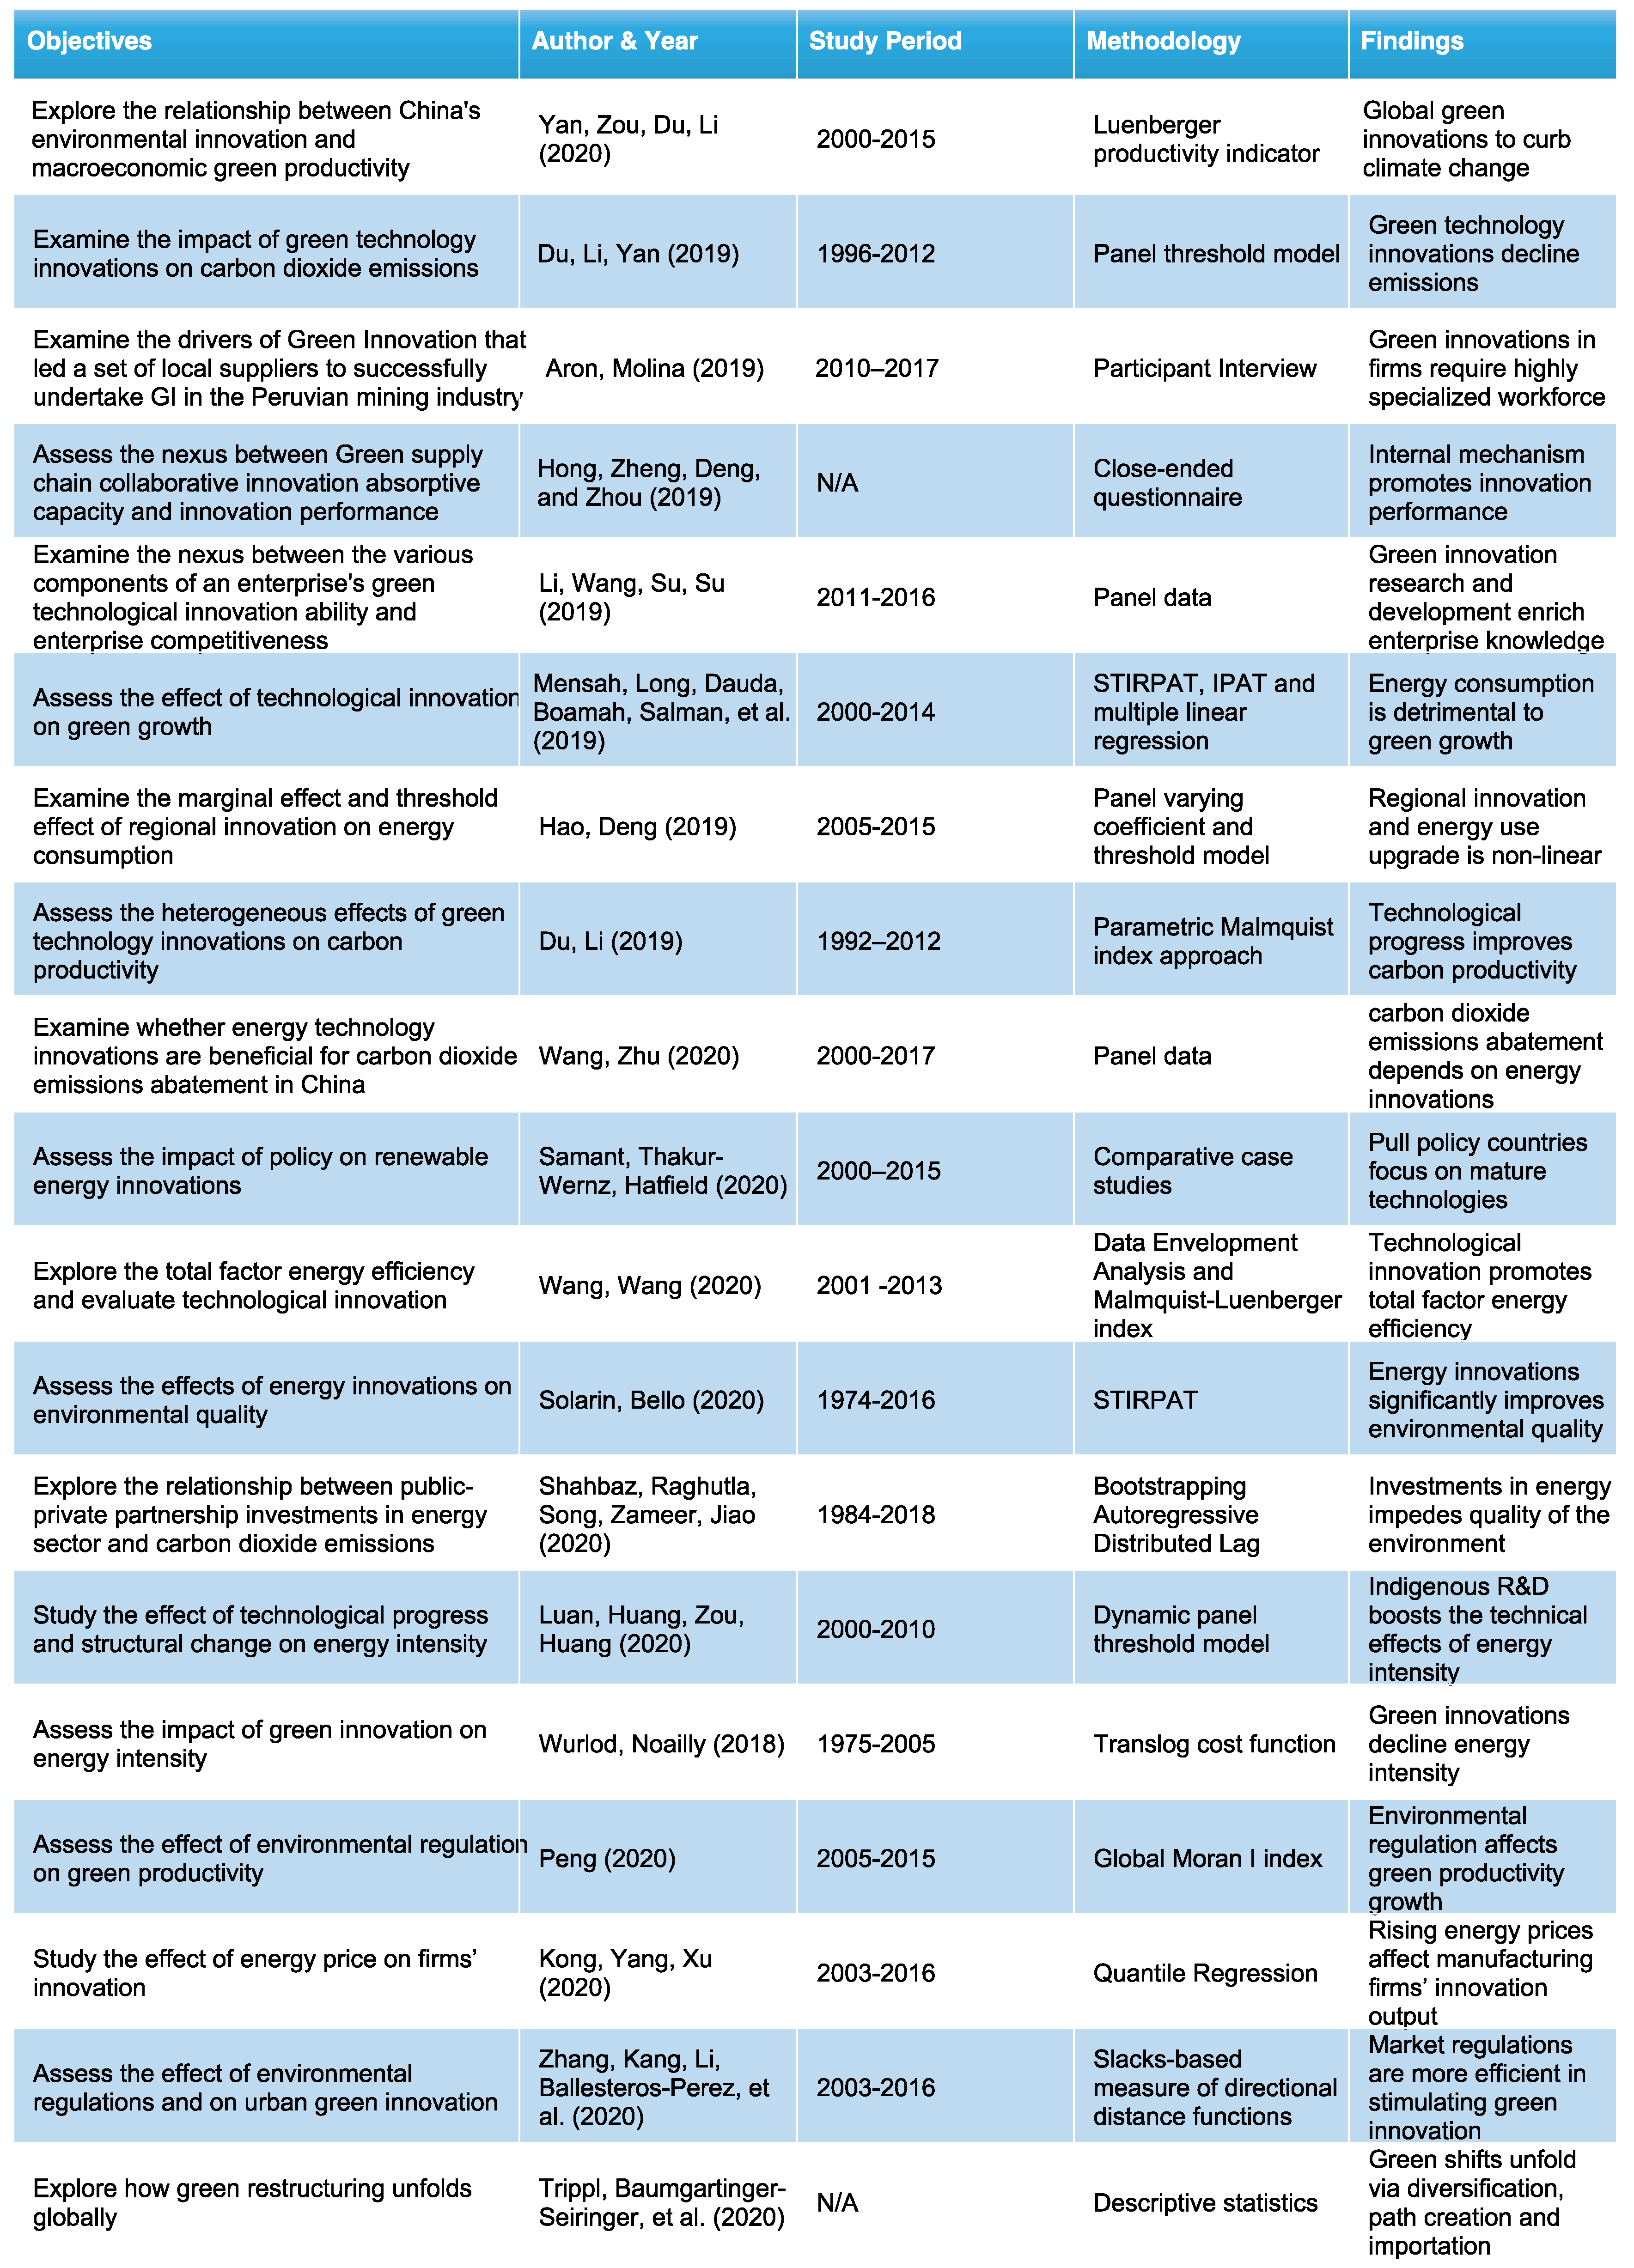
2. Review of Literature
2.1. Energy Research & Development vs. Green Energy Innovation
2.2. Industrial Structure vs. Green Energy Innovation
2.3. Energy Intensity vs. Green Energy Innovation
3. Methods
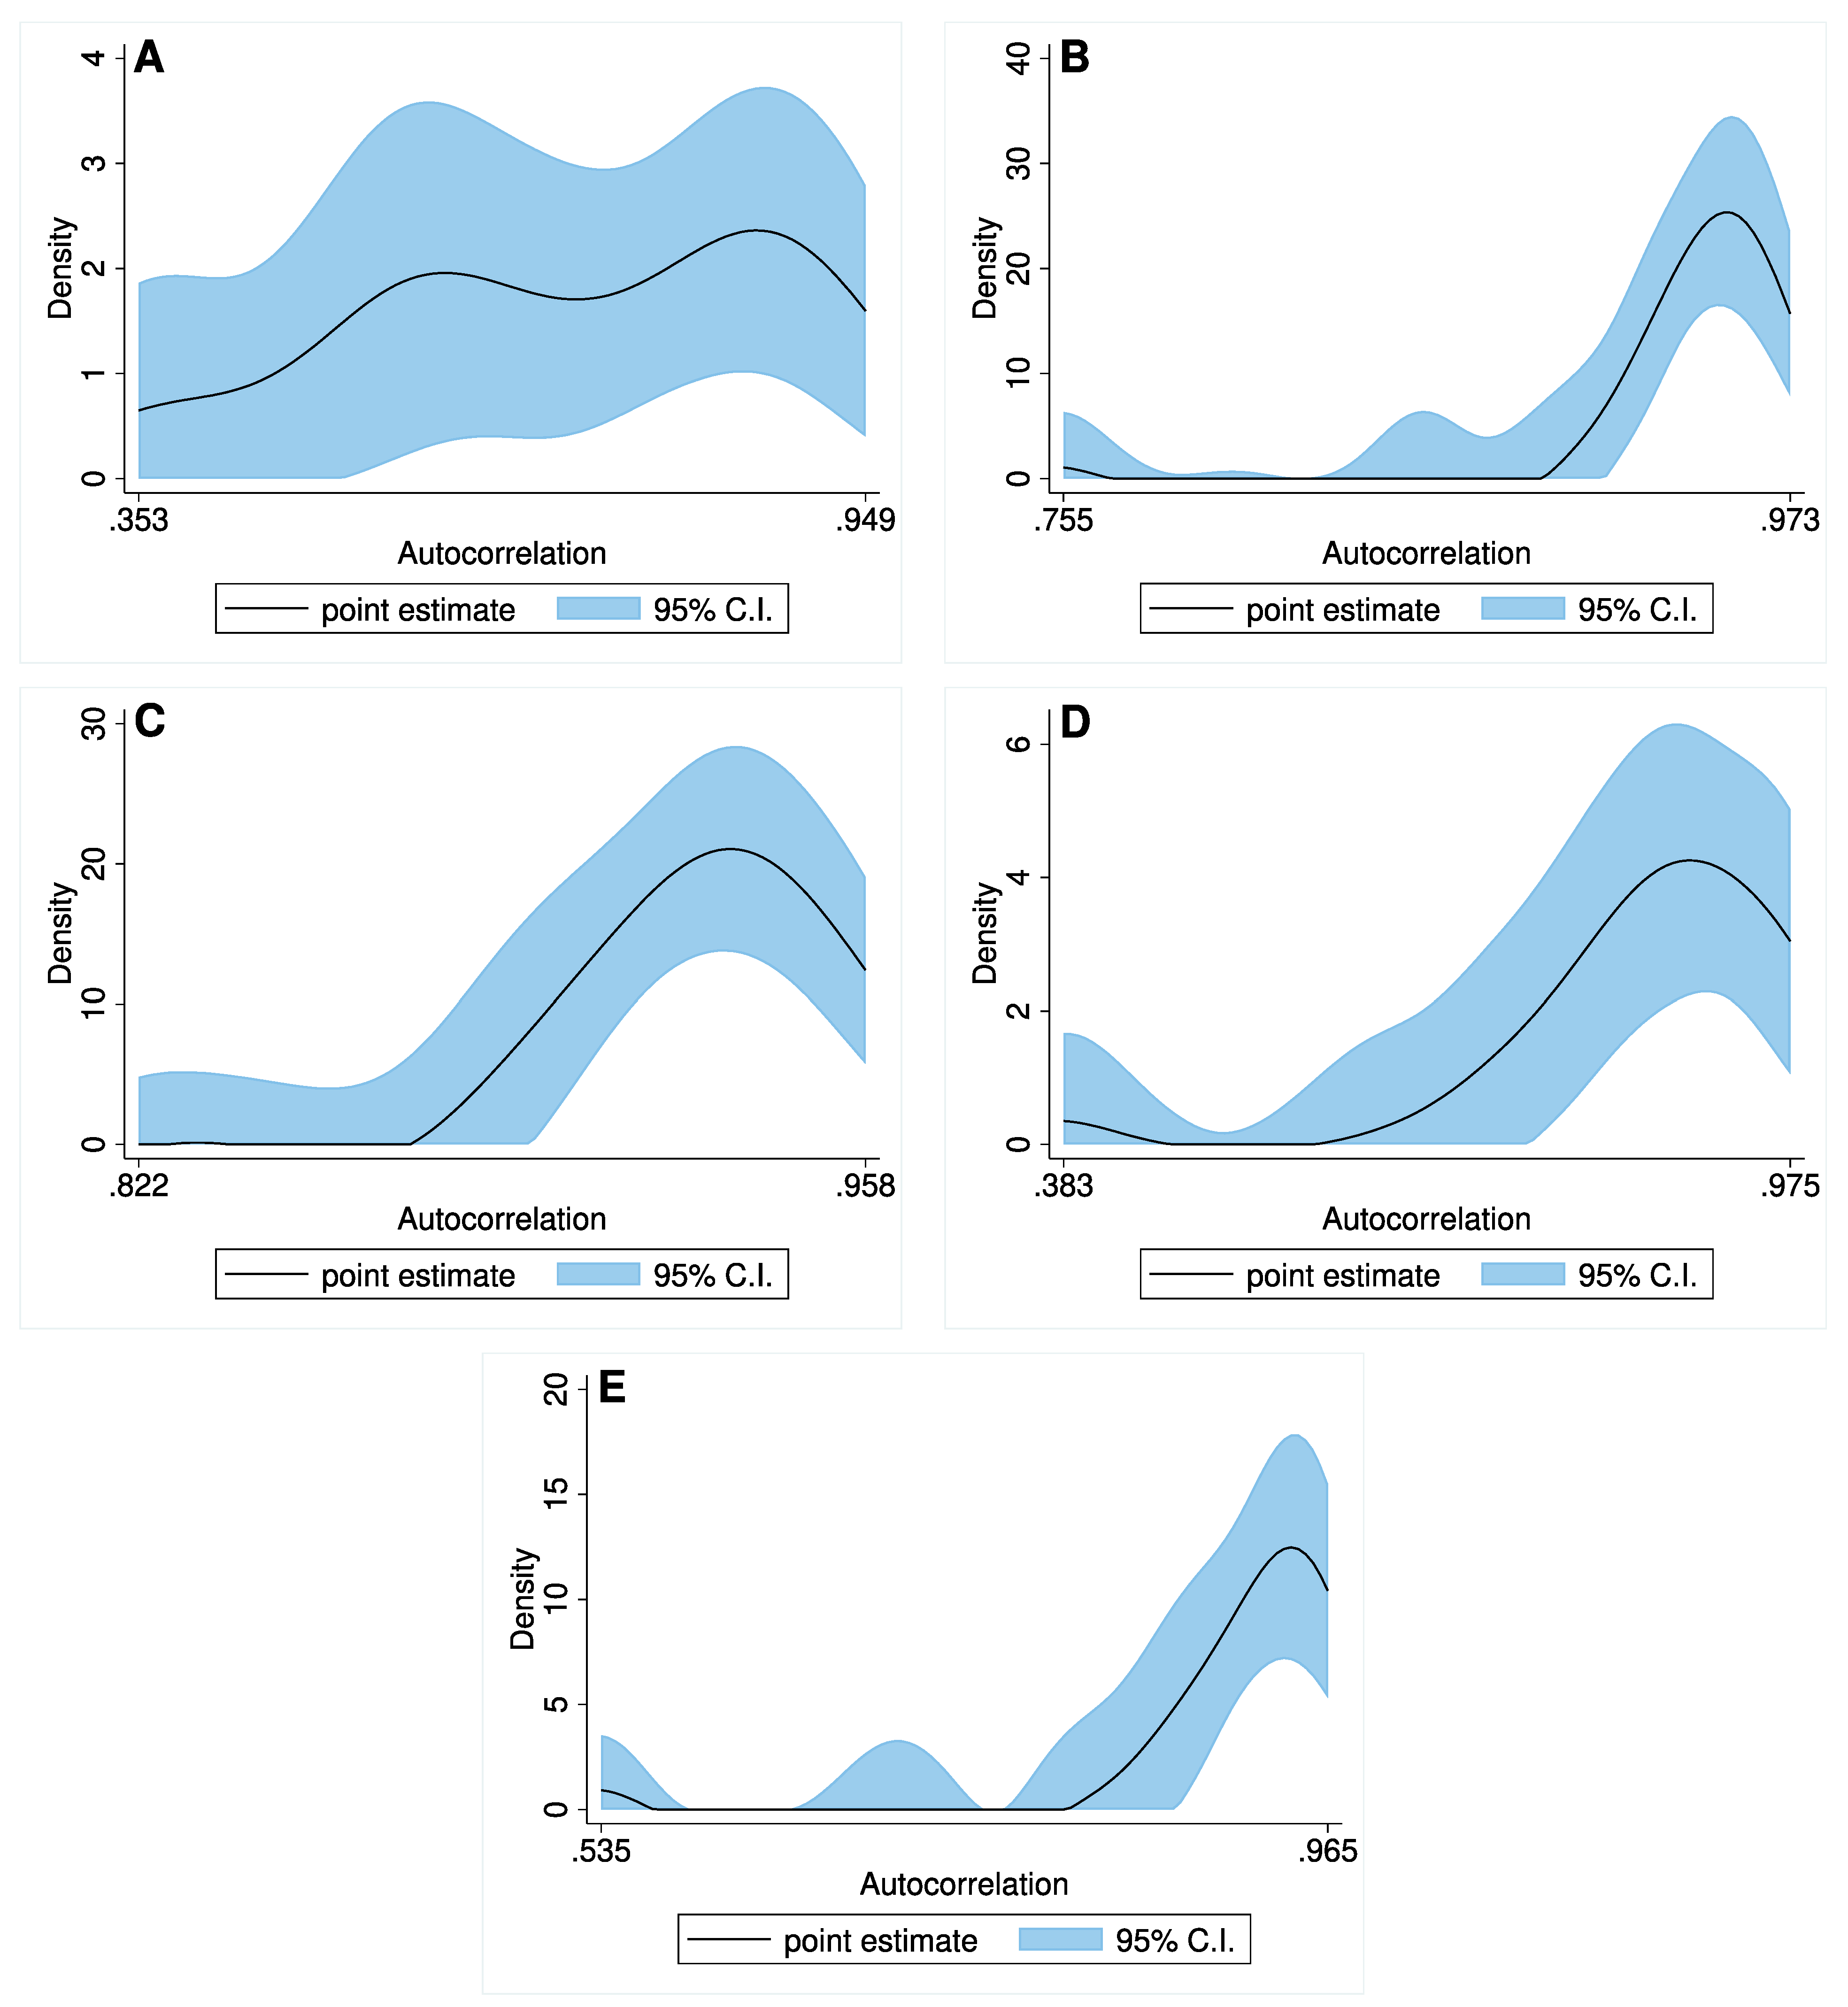
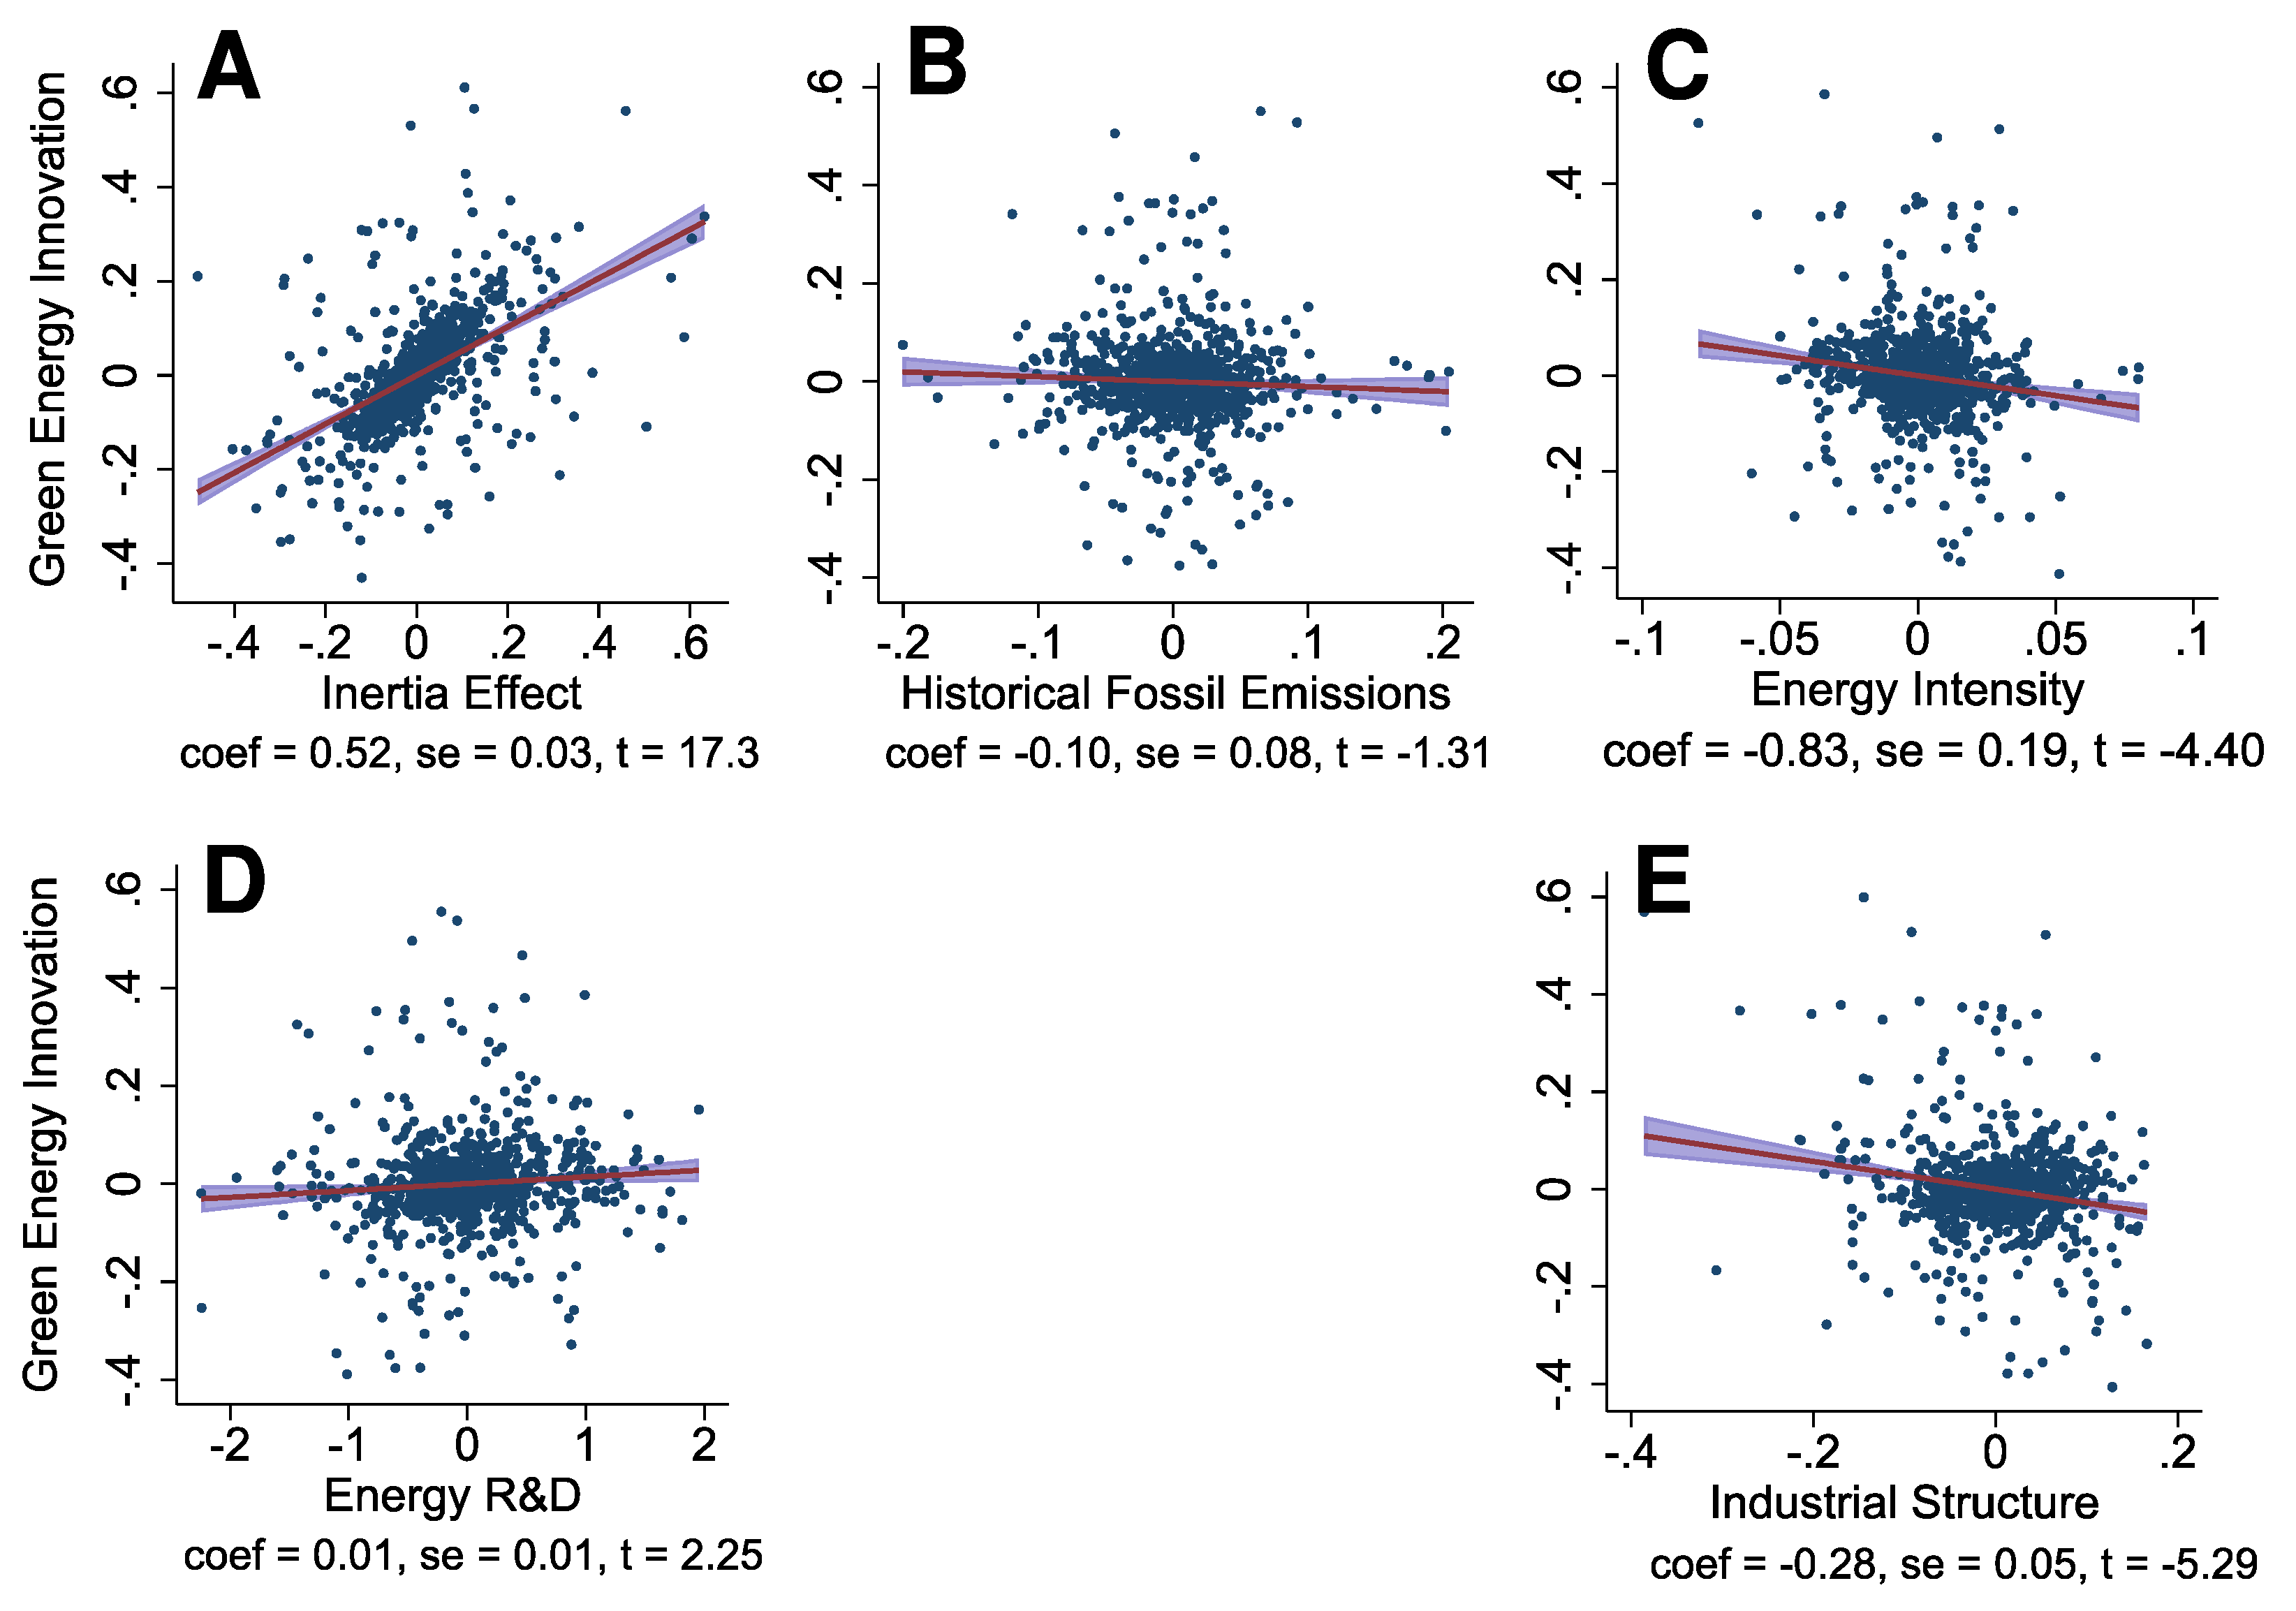
4. Results
5. Discussion and Conclusions
Author Contributions
Funding
Data Availability Statement
Conflicts of Interest
References
- Shahbaz, M.; Raghutla, C.; Song, M.; Zameer, H.; Jiao, Z. Public-private partnerships investment in energy as new determinant of CO2 emissions: The role of technological innovations in China. Energy Econ. 2020, 86, 104664. [Google Scholar] [CrossRef] [Green Version]
- Sarkodie, S.A.; Strezov, V. Economic, social and governance adaptation readiness for mitigation of climate change vulnerability: Evidence from 192 countries. Sci. Total Environ. 2019, 656, 150–164. [Google Scholar] [CrossRef]
- Wurlod, J.-D.; Noailly, J. The impact of green innovation on energy intensity: An empirical analysis for 14 industrial sectors in OECD countries. Energy Econ. 2018, 71, 47–61. [Google Scholar] [CrossRef] [Green Version]
- Owusu, P.; Asumadu, S.S. A Review of Renewable Energy Sources, Sustainability Issues and Climate Change Mitigation. Cogent Eng. 2016, 3, 1167990. [Google Scholar] [CrossRef]
- Trippl, M.; Baumgartinger-Seiringer, S.; Frangenheim, A.; Isaksen, A.; Rypestøl, J.O. Unravelling green regional industrial path development: Regional preconditions, asset modification and agency. Geoforum 2020, 111, 189–197. [Google Scholar] [CrossRef]
- Zhang, J.; Kang, L.; Li, H.; Ballesteros-Pérez, P.; Skitmore, M.; Zuo, J. The impact of environmental regulations on urban Green innovation efficiency: The case of Xi’an. Sustain. Cities Soc. 2020, 57, 102123. [Google Scholar] [CrossRef]
- Luan, B.; Huang, J.; Zou, H.; Huang, C. Determining the factors driving China’s industrial energy intensity: Evidence from technological innovation sources and structural change. Sci. Total Environ. 2020, 737, 139767. [Google Scholar] [CrossRef]
- Kong, D.; Yang, X.; Xu, J. Energy price and cost induced innovation: Evidence from China. Energy 2020, 192, 116586. [Google Scholar] [CrossRef]
- Zhang, J.; Zhang, W.; Song, Q.; Li, X.; Ye, X.; Liu, Y.; Xue, Y. Can energy saving policies drive firm innovation behaviors?—Evidence from China. Technol. Forecast. Soc. Chang. 2020, 154, 119953. [Google Scholar] [CrossRef]
- Yang, Z.; Lin, Y. The effects of supply chain collaboration on green innovation performance: An interpretive structural modeling analysis. Sustain. Prod. Consum. 2020, 23, 1–10. [Google Scholar] [CrossRef]
- Peng, B.; Zheng, C.; Wei, G.; Elahi, E. The cultivation mechanism of green technology innovation in manufacturing industry: From the perspective of ecological niche. J. Clean. Prod. 2020, 252, 119711. [Google Scholar] [CrossRef]
- Wang, R.; Mirza, N.; Vasbieva, D.G.; Abbas, Q.; Xiong, D. The nexus of carbon emissions, financial development, renewable energy consumption, and technological innovation: What should be the priorities in light of COP 21 Agreements? J. Environ. Manag. 2020, 271, 111027. [Google Scholar] [CrossRef]
- Liu, Z.; Li, X.; Peng, X.; Lee, S. Green or nongreen innovation? Different strategic preferences among subsidized enterprises with different ownership types. J. Clean. Prod. 2020, 245, 118786. [Google Scholar] [CrossRef]
- Du, K.; Li, J. Towards a green world: How do green technology innovations affect total-factor carbon productivity. Energy Policy 2019, 131, 240–250. [Google Scholar] [CrossRef]
- Aron, A.S.; Molina, O. Green innovation in natural resource industries: The case of local suppliers in the Peruvian mining industry. Extr. Ind. Soc. 2020, 7, 353–365. [Google Scholar] [CrossRef] [Green Version]
- Zhou, M.; Govindan, K.; Xie, X. How fairness perceptions, embeddedness, and knowledge sharing drive green innovation in sustainable supply chains: An equity theory and network perspective to achieve sustainable development goals. J. Clean. Prod. 2020, 260, 120950. [Google Scholar] [CrossRef]
- Solarin, S.A.; Bello, M.O. Energy innovations and environmental sustainability in the US: The roles of immigration and economic expansion using a maximum likelihood method. Sci. Total Environ. 2020, 712, 135594. [Google Scholar] [CrossRef]
- Hille, E.; Lambernd, B. The role of innovation in reducing South Korea’s energy intensity: Regional-data evidence on various energy carriers. J. Environ. Manag. 2020, 262, 110293. [Google Scholar] [CrossRef] [PubMed]
- Jin, W.; Zhang, H.-Q.; Liu, S.-S.; Zhang, H.-B. Technological innovation, environmental regulation, and green total factor efficiency of industrial water resources. J. Clean. Prod. 2019, 211, 61–69. [Google Scholar] [CrossRef]
- Chakraborty, S.K.; Mazzanti, M. Energy intensity and green energy innovation: Checking heterogeneous country effects in the OECD. Struct. Chang. Econ. Dyn. 2020, 52, 328–343. [Google Scholar] [CrossRef]
- Shi, S.; Phillips, P.C.; Hurn, S. Change detection and the causal impact of the yield curve. J. Time Ser. Anal. 2018, 39, 966–987. [Google Scholar] [CrossRef] [Green Version]
- Shi, S.; Hurn, S.; Phillips, P.C. Causal change detection in possibly integrated systems: Revisiting the money–income relationship. J. Financ. Econom. 2020, 18, 158–180. [Google Scholar] [CrossRef] [Green Version]
- Toda, H.Y.; Yamamoto, T. Statistical inference in vector autoregressions with possibly integrated processes. J. Econom. 1995, 66, 225–250. [Google Scholar] [CrossRef]
- Dolado, J.J.; Lütkepohl, H. Making Wald tests work for cointegrated VAR systems. Econom. Rev. 1996, 15, 369–386. [Google Scholar] [CrossRef]
- Phillips, P.C.; Shi, S.; Yu, J. Testing for multiple bubbles: Historical episodes of exuberance and collapse in the S&P 500. Int. Econ. Rev. 2015, 56, 1043–1078. [Google Scholar]
- Phillips, P.C.; Shi, S.; Yu, J. Testing for multiple bubbles: Limit theory of real-time detectors. Int. Econ. Rev. 2015, 56, 1079–1134. [Google Scholar] [CrossRef] [Green Version]
- Chudik, A.; Pesaran, M.H. Large Panel Data Models with Cross-Sectional Dependence: A Survey. CAFE Research Paper. 2013. Available online: https://www.dallasfed.org/~/media/documents/institute/wpapers/2013/0153.pdf (accessed on 20 December 2020).
- Kripfganz, S.; Sarafidis, V. Instrumental Variable Estimation of Large Panel Data Models with Common Factors. 2020. Available online: https://papers.ssrn.com/sol3/papers.cfm?abstract_id=3668588 (accessed on 20 December 2020).
- Westerlund, J.; Urbain, J.-P. Cross-sectional averages versus principal components. J. Econom. 2015, 185, 372–377. [Google Scholar] [CrossRef]
- Driscoll, J.C.; Kraay, A.C. Consistent covariance matrix estimation with spatially dependent panel data. Rev. Econ. Stat. 1998, 80, 549–560. [Google Scholar] [CrossRef]
- Dechamps, P.; Pilavachi, P. Research and development actions to reduce CO2 emissions within the European Union. Oil Gas Sci. Technol. 2004, 59, 323–330. [Google Scholar] [CrossRef]
- Sarkodie, S.A.; Owusu, P.A.; Leirvik, T. Global effect of urban sprawl, industrialization, trade and economic development on carbon dioxide emissions. Environ. Res. Lett. 2020, 15, 034049. [Google Scholar] [CrossRef]
- Davis, S.J.; Lewis, N.S.; Shaner, M.; Aggarwal, S.; Arent, D.; Azevedo, I.L.; Benson, S.M.; Bradley, T.; Brouwer, J.; Chiang, Y.-M.; et al. Net-zero emissions energy systems. Science 2018, 360, eaas9793. [Google Scholar] [CrossRef] [Green Version]
- Jordaan, S.M.; Romo-Rabago, E.; McLeary, R.; Reidy, L.; Nazari, J.; Herremans, I.M. The role of energy technology innovation in reducing greenhouse gas emissions: A case study of Canada. Renew. Sustain. Energy Rev. 2017, 78, 1397–1409. [Google Scholar] [CrossRef]
- Wang, Q.; Wang, S. Decoupling economic growth from carbon emissions growth in the United States: The role of research and development. J. Clean. Prod. 2019, 234, 702–713. [Google Scholar] [CrossRef]
- Schneider, S.H.; Goulder, L.H. Achieving low-cost emissions targets. Nature 1997, 389, 13–14. [Google Scholar] [CrossRef]
- Raupach, M.R.; Marland, G.; Ciais, P.; Le Quéré, C.; Canadell, J.G.; Klepper, G.; Field, C.B. Global and regional drivers of accelerating CO2 emissions. Proc. Natl. Acad. Sci. USA 2007, 104, 10288–10293. [Google Scholar] [CrossRef] [PubMed] [Green Version]


| Country | GEI | ENI | ERD | INS | Max Order of Integration (d) | |||||
|---|---|---|---|---|---|---|---|---|---|---|
| Level | 1st Diff | 2nd Diff | Level | 1st Diff | Level | 1st Diff | Level | 1st Diff | ||
| Australia | 0.5389 | 0.0001 a | - | 0.0205 b | - | 0.1752 | 0.0940 c | 0.9375 | 0.0001 a | 1 |
| Austria | 0.4168 | 0.0000 a | - | 0.0570 c | - | 0.9117 | 0.0000 a | 0.4181 | 0.0018 a | 1 |
| Belgium | 0.2268 | 0.0000 a | - | 0.4808 | 0.0002 a | 0.8835 | 0.0009 a | 0.0418 b | - | 1 |
| Canada | 0.5808 | 0.0000 a | - | 0.5482 | 0.0003 a | 0.0805 c | - | 0.3881 | 0.0001 a | 1 |
| Denmark | 0.0206 b | - | - | 0.2199 | 0.0000 a | 0.1341 | 0.0011 a | 0.1419 | 0.0000 | 1 |
| Finland | 0.0005 a | - | - | 0.0558 a | - | 0.4434 a | 0.0000 a | 0.4388 | 0.0014 a | 1 |
| France | 0.8941 | 0.0000 a | - | 0.1336 | 0.0001 a | 0.5734 | 0.0000 a | 0.9660 | 0.0000 a | 1 |
| Germany | 0.2848 | 0.0000 a | - | 0.8084 | 0.0003 a | 0.9937 | 0.0000 a | 0.9909 | 0.0000 a | 1 |
| Greece | 0.0032 a | - | - | 0.8923 | 0.0000 a | 0.2407 | 0.0010 a | 0.6742 | 0.0002 a | 1 |
| Ireland | 0.0127 b | - | - | 0.1308 | 0.0000 a | 0.7849 | 0.0001 a | 0.2217 | 0.0001 a | 1 |
| Italy | 0.7240 | 0.0022 a | - | 0.5021 | 0.0000 a | 0.8593 | 0.0002 a | 0.9567 | 0.0000 a | 1 |
| Japan | 0.5737 | 0.0001 a | - | 0.3695 | 0.0002 a | 0.2000 | 0.0021 a | 0.2320 | 0.0000 a | 1 |
| Netherlands | 0.6747 | 0.0001 a | - | 0.1782 | 0.0000 a | 0.0006 a | - | 0.6840 | 0.0000 | 1 |
| New Zealand | 0.0495 b | - | - | 0.0652 c | - | 0.5587 | 0.0206 b | 0.7244 | 0.0000 a | 1 |
| Norway | 0.0008 a | - | - | 0.0319 b | - | 0.2930 | 0.0004 a | 0.3717 | 0.0000 a | 1 |
| Portugal | 0.6715 | 0.0000 a | - | 0.9628 | 0.0000 a | 0.8283 | 0.0000 a | 0.4278 | 0.0000 a | 1 |
| Spain | 0.3100 | 0.0000 a | - | 0.9485 | 0.0000 a | 0.2599 | 0.0001 a | 0.1234 | 0.0859 c | 1 |
| Sweden | 0.0169 b | - | - | 0.1529 | 0.0050 a | 0.8207 | 0.0000 a | 0.0978 c | - | 1 |
| Switzerland | 0.6379 | 0.0001 a | - | 0.4429 | 0.0001 a | 0.0002 a | - | 0.9455 | 0.0006 a | 1 |
| United Kingdom | 0.5625 | 0.0004 a | - | 0.2865 | 0.0000 a | 0.9892 | 0.0010 a | 0.8518 | 0.0003 a | 1 |
| United States | 0.4685 | 0.3029 | 0.0000 a | 0.9235 | 0.0002 a | 0.8873 | 0.0000 a | 0.9533 | 0.0002 a | 2 |
| Country | ENI to GEI | GEI to ENI | ERD to GEI | GEI to ERD | INS to GEI | GEI to INS |
|---|---|---|---|---|---|---|
| Australia | 1993–2014 | 1995–2014 | 1995–2014 | 1995–2014 | 1996–2014 | 1995–2014 |
| Austria | 2009–2014 | 2002–2004 2006–2008 2011–2012 | 1990/1997/ 1999 2002–2005 2010 2013–2014 | 1996–2014 | 2002–2003 2005 2007–2014 | - |
| Belgium | 1989 1991–2014 | 1991 1995–2014 | 1995–2014 | 1993 1995–2014 | 1990 1995–2014 | 1995–2014 |
| Canada | 2006 2008–2014 | 1992–2014 | 2000/2003/ 2005/2010/ 2014 | 1992–2014 | 1996–1998 2000 2002–2014 | 1992–2014 |
| Denmark | 1990–1991 1993–2014 | 1992 1995–2014 | 1995–2014 | 1995–2014 | 1989 1994 1996–2014 | 1995–2014 |
| Finland | 1995–1996 1998–2014 | 1988–1995 1997–2014 | 1990 1998 2000–2014 | 1988–2014 | 1991 1996 1998 2000–2014 | 1988–2014 |
| France | 1990–1991 1993 1995–2014 | 1994–2014 | 1990 1995–2014 | 1995–2014 | 1995–2014 | 1995–2014 |
| Germany | 1990–2014 | 1990–2014 | 1990–2014 | 1990–2014 | 1990–2014 | 1989–2014 |
| Greece | 2008–2009 2011–2014 | 1997–2014 | 1996 2008 2010–2012 2014 | 2007 2013–2014 | 1999–2001 2003–2014 | 1998 2002 2009 2014 |
| Ireland | 2014 | 1997 2013 | 1991–1992 1997–2001 2003–2004 2006 2008–2014 | 2006–2007 2009–2010 2013–2014 | 2000–2014 | 2006 2010 |
| Italy | 1997–2014 | 1992–1994 1997–2014 | 1999 2001–2014 | 1994 1997 2000–2014 | 1993 1996–2014 | 1993–1999 2001–2014 |
| Japan | 2008–2014 | 1993–1994 1996–2014 | 2010–2011 2013–2014 | 2014 | 1996–2014 | 1994–2014 |
| Netherlands | 1992 1994–2014 | 1996–2014 | 1995–2014 | 1991 1996–2014 | 1990 1992–1993 1996–2014 | 1992 1996–2014 |
| New Zealand | 2008–2014 | 1987–2014 | 1992 2009 2013–2014 | 1987–1988 1990–1992 1994–1996 1998–2014 | 2004–2006 2008 2010 2012–2014 | 1987–2014 |
| Norway | 1997–1998 2000–14 | 1992–1994 1997–1998 2000–2014 | 1999–2014 | 1992 1994 1997–2014 | 1991 1995 1997–1998 2000–2014 | 1992 1994 2000–2014 |
| Portugal | 2013–2014 | 1992–2014 | 2002 2009–2010 2012 2014 | 1992–2014 | 2001–2003 2005–2007 2009–2014 | 1992–2014 |
| Spain | 1992–2014 | 1993 1995–2014 | 1988 1995–2014 | 1993 1995–2014 | 1988 1990–2014 | 1995–2014 |
| Sweden | 1997–2014 | 1991–1994 1996–2014 | 2001–2014 | 1989 1994 1997–2014 | 1989 1992 1994 2000–2014 | 1996–1997 1999–2014 |
| Switzerland | 1995–2014 | 1999–2014 | 2000–2014 | 1999–2014 | 1990 1993 1999–2014 | 2001–2014 |
| United Kingdom | 1995–1996 1998–2014 | 1999–2014 | 1985 1996 1999–2014 | 1991 2000–2014 | 1997 2001–2014 | 1995–1997 1999–2014 |
| United States | 1999–2014 | 1990–2014 | 2005–2014 | 1990–2014 | 1998–2001 2005–2014 | 1990–2014 |
| Emission Parameters | IV—2SLS | IV—1st-Step Estimator | IV—2nd-Step Estimator | IV—MG | Green Energy Parameters | D/K—FE |
|---|---|---|---|---|---|---|
| Emissionst−1 | 0.554 *** (0.093) | −0.002 (0.129) | 0.015 (0.069) | 0.646 *** (0.072) | Green Energyt−1 | 0.517 *** (0.084) |
| Green Energy | −0.126 *** (0.046) | −0.025 (0.051) | −0.032 *** (0.011) | −0.041 (0.035) | Historical Emissions | −0.100 * (0.055) |
| Energy Intensity | 1.654 *** (0.618) | 2.731 *** (0.804) | 1.897 *** (0.602) | 2.573 *** (0.636) | Energy Intensity | −0.834 *** (0.134) |
| Energy R&D | 0.024 *** (0.009) | 0.024 ** (0.010) | 0.022 *** (0.005) | 0.008 (0.006) | Energy R&D | 0.014 ** (0.006) |
| Industrial Structure | 0.236 (0.177) | 0.157 (0.282) | 0.100 (0.172) | −0.298 *** (0.140) | Industrial Structure | −0.284 ** (0.121) |
| Constant | — | 3.922 *** (1.302) | 4.200 *** (1.092) | 2.519 *** (0.676) | Constant | 1.304 ** (0.533) |
| Observations | 798 | 798 | 798 | 798 | Observations | 819 |
| Wald chi2(62) | 688.040 | 15.5725 | 13.2672 | — | Prob > F | 0.000 *** |
| Prob > chi2 | 0.000 *** | 0.0293 | 0.0659 | — | within R-squared | 0.395 |
| R-squared | 0.998 | — | — | — | R-squared | — |
| Root MSE | 0.056 | — | — | — | Root MSE | — |
| Year Fixed-effects | Yes | Yes | Yes | Yes | Year Fixed-effects | No |
| Country Fixed-effects | Yes | Yes | Yes | Yes | Country Fixed-effects | No |
| Δ | 37.275 *** | 37.275 *** | 37.275 *** | 37.275 *** | Δ | 16.978 *** |
| Δ(adj) | 40.430 *** | 40.430 *** | 40.430 *** | 40.430 *** | Δ(adj) | 18.458 *** |
| Hansen Test | — | 15.573 †† | 13.267 † | — | — | — |
Publisher’s Note: MDPI stays neutral with regard to jurisdictional claims in published maps and institutional affiliations. |
© 2021 by the authors. Licensee MDPI, Basel, Switzerland. This article is an open access article distributed under the terms and conditions of the Creative Commons Attribution (CC BY) license (https://creativecommons.org/licenses/by/4.0/).
Share and Cite
Sarkodie, S.A.; Ajmi, A.N.; Adedoyin, F.F.; Owusu, P.A. Econometrics of Anthropogenic Emissions, Green Energy-Based Innovations, and Energy Intensity across OECD Countries. Sustainability 2021, 13, 4118. https://doi.org/10.3390/su13084118
Sarkodie SA, Ajmi AN, Adedoyin FF, Owusu PA. Econometrics of Anthropogenic Emissions, Green Energy-Based Innovations, and Energy Intensity across OECD Countries. Sustainability. 2021; 13(8):4118. https://doi.org/10.3390/su13084118
Chicago/Turabian StyleSarkodie, Samuel Asumadu, Ahdi Noomen Ajmi, Festus Fatai Adedoyin, and Phebe Asantewaa Owusu. 2021. "Econometrics of Anthropogenic Emissions, Green Energy-Based Innovations, and Energy Intensity across OECD Countries" Sustainability 13, no. 8: 4118. https://doi.org/10.3390/su13084118