
Establishment of a Sustainability Assessment System for Bridges


1
New Asia Construction and Development Corporation, Taipei 10567, Taiwan
2
Department of Civil Engineering, National Taiwan University, Taipei 10617, Taiwan
*
Author to whom correspondence should be addressed.
Sustainability 2021, 13(9), 4795; https://doi.org/10.3390/su13094795
Submission received: 26 March 2021
/
Revised: 14 April 2021
/
Accepted: 22 April 2021
/
Published: 24 April 2021
Abstract
:In this paper, with the motivation of “green” and “sustainability” for bridge projects, ten key indicators were selected to establish a reliable and applicable sustainability assessment system. It is also expecting the civil infrastructure to be developed more ecologically, environmentally, and friendly by applying the proposed assessment system. The data collection method in this research is questionnaire-based expert interviews. The questionnaire results were well analyzed and calculated for the key indicators’ weights by adopting the top two boxes theory (TTBT) and multiple attribute value theory (MAVT). Consequently, the sustainability assessment system for green civil infrastructure (SASGCI) was established to evaluate infrastructure projects’ sustainability achievements. In this study, the authors conclude the weights of ten key indicators for bridges as follows: risk mitigation and reliability: 15.3%, durability: 15.1%, landscape: 11.5%, ecology: 10.6%, benefit and function: 9.7%, environmental protection and carbon emissions reduction: 9.5%, waste reduction: 8.5%, energy-saving: 7.1%, creativity: 7.0%, and humanities and culture reservation: 5.6%. An example of a scenic bridge in Taiwan is presented to demonstrate the applicability of the established SASGCI for sustainability evaluation. The result indicates that the evaluation system is successful.
1. Introduction
In recent years, owing to global warming, sustainability issues have been wildly concerned and discussed in all fields of engineering projects. The “sustainable” and “green” considerations may include environment protection, carbon emission reduction, energy-saving, green materials, safety assurance, risk mitigation, reliability, ecology, waste reduction, durability, benefit, landscape, humanities, culture preservation, and creativity. In the past, specific sustainability indicators for infrastructures have been proposed [1,2]. Key assessment indicators have been established to evaluate sustainability issues in engineering fields [3,4,5,6]. The primary purpose of performing sustainability research is to prevent harmful impacts on the environment during the project life cycle. The harmful impacts include global warming caused by the increase of CO2 emission, depletion of resources, and adverse effects on the environment and ecology due to construction. Sustainable development meets the needs of the present without compromising the ability of future generations to meet their own needs [7]. Green civil infrastructure is a civil engineering system or facility environmentally friendly and is least damaging to the environment and society in the project life cycle [8]. Some infrastructure projects performed sustainability practices during the development and the life cycle [9,10,11]. Efforts in sustainability draw attention and public support for infrastructures such as residential houses, roads, highways, bridges, tunnels, water supply, sewers, electrical grids, and telecommunications, just to name a few. Specifically, sustainable and green infrastructures are being emphasized through designs and constructions that support long-term sustainability [9]. Sustainable and green civil infrastructure, including bridges, may contain the following criteria [12,13,14,15]:
- Maintain safety management, risk mitigation, and reliability during the life cycle.
- Minimize the CO2 emission during the life cycle and harmful impacts on the environment and ecology.
- Optimize the landscape for the project developed zone.
- Maximize the benefit/function of project development.
- Reduce the waste production and try to possibly recycle the wastes during the life cycle.
- Save energy during the life cycle.
- Extend the durability of the project.
- Preserve the local culture and maintain the social conscience.
- Encourage creativity.
- Keep a reasonable cost during the life cycle.
The authors aim to establish an assessment system to evaluate civil infrastructure to achieve the above sustainable criteria [16,17,18]. The establishment of this assessment system is hoped to provide a functional and reliable tool to help engineers determine civil infrastructure development. It is also expecting the civil infrastructure could be developed more ecologically, environmentally, and friendly. This assessment system, “sustainability assessment system for green civil infrastructure (SASGCI)” [19], is developed through expert interviews and quantitative study by adopting the multiple attribute value theory (MAVT) [20] and top two boxes theory (TTBT) [21,22,23,24] methods. This study aims to determine the weight of importance of each key indicator and to form an evaluation system to assess the bridge projects.
In this research, with in-depth discussions with some experts, the author selects ten key indicators, which will be described in detail in Section 3, for the assessment of sustainability for infrastructures. The selection of these ten key indicators is based on the importance of these indicators in sustainable civil infrastructures, as shown in Figure 1. Some issues in green buildings, such as health, sewage and waste disposal facility improvement, indoor environment, and so on, are not significant concerns and, therefore, are not included in key indicators of assessment for green sustainable civil infrastructures.
2. Methodology
2.1. Questionnaire-Based Expert Interview
In this paper, the researchers propose sustainability key indicators for the assessment system of bridges. In addition to the reference of the published documents, the expert interview is the central part of this research. The experts were chosen from consulting engineers, construction engineers, professors, and government officials in Taiwan. The background of experts covers structures, bridges, geotechnical engineering, construction management, slopes, ecology, environment, transportation, pavement, safe/risk management, energy, and so on. The average seniority of these experts is 27 years. The authors executed the interviews with a detailed explanation of the questionnaire. The questionnaire contains the ten key indicators and the 48 related evaluation items and covers four essential elements of civil infrastructures, i.e., bridge, tunnel, slope, and building. It also covers the project’s life cycle, including design, construction, operation, and demolition. Figure 2 shows the ecology part of the questionnaire.
In addition to bridges, tunnel, and slopes, buildings are also included in the questionnaire for comparison purposes. After the researchers provided a detailed description, the experts can select from the five selections of the Likert scale form to represent the importance of each evaluation item in each stage. Selection of (4) points represents the highest importance, and (0) points represents the lowest importance. Some “black-out” parts are presented because they are not related to the evaluation item in the corresponding stage. The expert is not requested to answer in these parts. The authors establish the sustainability assessment system for bridges, tunnels, slopes, and buildings with the analysis of the questionnaire results gathered from 47 experts. In this paper, only the results of “bridges” will be presented.
2.2. Analysis of Questionnaire Data
In recent years, a couple of techniques have been adopted to determine the conclusion for the results of the questionnaire from expert review [23], such as the top two boxes theory (TTBT) [21,22,23,24] and multiple attribute value theory (MAVT) [20]. In this paper, a combination of the TTBT and MAVT is applied to calculate and analyze the questionnaire results.
2.2.1. Top Two Boxes Theory (TTBT)
The “top box” means the highest score of the questionnaire’s selections, and the “top-two box” means the highest and second scores of the questionnaire choices. The “box” is the selection of the questionnaire by the participants. For example, when the scores of the questionnaire range from 5 points to 1 point, the top two boxes mean 5 points and 4 points. The top two boxes score means that the score is calculated with the percentage of 5 points and 4 points in the sampling population. Reporting the top two boxes score has the advantage of providing more variation in the data. Thus, it is easier to identify and emphasize the actual results of the selections among the multiple attributes. The top two box score is often relatively high, such that it sometimes leads to higher accuracy because its high value seems to indicate that respondents are very satisfied [21,22,23,24].
2.2.2. Multiple Attribute Value Theory (MAVT)
Multiple attributes determination aims to calculate the weights from the evaluation items of multiple attributes at different levels [25]. According to Buede and Maxwell [26], MAVT addresses the relative weights of obtaining a specific level of performance [20].
MAVT, in order to serve as a multiple criteria decision-making technique, aims to provide support for the determination of multiple attributes at different levels by developing a scoring system [27,28]. The technique has three steps: (1) determine the relative weight of each attribute; (2) calculate the importance wright of each attribute; and (3) integrate the weights for the key attributes in the first level with the weights obtained from the sub-levels. The final weights distribution for crucial attributes in the first level is calculated for the summation of 1.0 as well.
Basically, analytic hierarchy process (AHP) is a popular technique for the questionnaire analysis. It is proposed to adopt MAVT and TTVT owing to the inefficiency of pairwise comparisons in the AHP analysis. By adopting the MAVT and TTBT techniques and related formulas, the researchers performed the statistical analyses and calculated each key indicator and evaluation item’s rates and weights.
The “formula, f(x)” function provided by Microsoft Excel is a powerful tool for calculation of the rates and weights. Key in the correct equations to the specified cell concerning other corresponding cells, and the calculation results are obtained immediately. Furthermore, the statistics chart can be created directly along with equations [29,30,31].
2.2.3. Definition of Each Level’s Weight
Using the statistical data obtained from the questionnaire and MAVT as tools of analysis processes, some specified equations, which are introduced in the following sections, are applied to calculate the rates and weights in each level of the SASGCI. The authors divided the weight calculation processes into three levels, i.e., the ten key indicators for level 1, the evaluation items for level 2, and the four stages of life cycle for level 3. The subscripts of level 1 are presented by “i”, level 2 by “j”, and level 3 by “k”. Wijk denotes the weight of the stage “k” of the evaluation item “j” for the key indicator “i”. For example, W143 means the weight of the third stage (operation stage) of the fourth evaluation item (avoiding geologically sensitive areas) for the first key indicator (risk mitigation and reliability). To simulate the weights of the SASGCI as a 3D matrix, the Wijk is located in the corresponding location of this matrix. Figure 3 shows the 3D diagram of the Wijk, and point A denotes the location of W243.
3. Development of Assessment System for Green Civil Infrastructure Projects
3.1. Development of Key Indicators for Bridges
Some important issues are taken into consideration as the “key indicators” of the sustainability assessment system for green civil infrastructure (SASGCI). It is the first level of the assessment system. Each indicator should contain some related evaluation items as the second level of the assessment system. For consideration of a project’s entire life cycle, it is necessary to cover four stages, which include design, construction, operation, and demolition, to be level three of the system [19]. Figure 4 and Figure 5 show the development and structure of the SASGCI, respectively.
By performing an in-depth discussion with experts, the researchers propose ten sustainable key indicators for bridges as follows:
- Risk mitigation and reliability
- Ecology
- Environmental protection and carbon emissions reduction (ER and CER)
- Energy saving
- Waste reduction
- Durability
- Benefit and function
- Landscape
- Humanities and culture preservation (H&C)
- Creativity
Table 1 illustrates the evaluation items for each key indicator. Figure 6 shows the research framework of SASGCI [19].
The key sustainability indicators of SASGCI contain two major parts as follows:
- Weight determination for each key indicator.
- Project evaluation for sustainability achievement.
The following sections describe the detailed processes for establishing the assessment system.
3.2. Questionnaire Results Analysis
3.2.1. Expertise and Education of the Experts
3.2.2. Weights for Level 3: Stages of Project Life Cycle
In general, the life cycle of an engineering project can be divided into four stages, i.e., design, construction, operation and maintenance, and demolition. In the questionnaire, each expert was requested to determine the relative weight ratio, Rak, i.e., the relative importance among the four stages of the life cycle. The mean (average) of the Rak provided by all the experts is represented as Rk (k = 1 to 4). Higher Rk denotes the higher importance of any of the stages of sustainability performance. The rate Rk of the four stages is calculated using Equation (1).
where n indicates the total number of experts that participated. k ranges from 1 to 4, indicating the design, construction, operation, and demolition stages, respectively.
Besides, by adopting the TTBT, the authors propose Equation (2) for the calculation of the ratio of the top two selection (4 and 3 points) T2k as follows:
- “j” varies from 4 to 9, depending on the number of evaluation items in each key indicator;
- “i” ranges from 1 to 10, indicating the ten key indicators;
- “nx” (x = 4 and 3) shows the number of experts who give x points (x = 4 and 0) of the importance rate of level 3;
- “n” indicates the total number of experts who participated.
After the determination of the weight (Rk) of importance and ratio (T2k) of the top two boxes value, the experts are requested to assign the importance rate points (from 4 to 0) for each evaluation item. Each item is separated into four different project stages, i.e., design, construction, operation, and demolition stages. The experts are requested to assign from 4 points (most important) to 0 points (least significant) for each stage. The importance weights of each stage for level 3, Wijk, are calculated using Equation (3).
3.2.3. Weight for Level 2: Evaluation Items
In level 2, the researchers simplify the Wijk by calculating the weights of four stages to that of each evaluation item, Wij, as shown in Equation (4). The subscripts of level 1 are presented by “i” and level 2 by “j”. Wij denotes the weight of the evaluation item “j” for the key indicator “i”. For example, W14 means the weight of the fourth evaluation item (avoiding geologically sensitive areas) for the first key indicator (risk mitigation and reliability).
The mean of Wij for each key indicator, denoted as Si, can be calculated using Equation (5).
where “z” varies from 4 to 9, depending on the number of evaluation items in each key indicator.
3.2.4. Weight for Level 1: Key Indicators
In level 1, the researchers calculate the relative weight among all sustainability key indicators. The researchers add the Si of all the key indicators to get the Stotal, as shown in Equation (6).
where i ranges from 1 to 10, denoting the number of key indicators.
Following the calculation results of Si and Stotal, it can reach the weight Wi of level 1. The subscript of level 1 is presented by “i”. Wi denotes the weight of key indicator “i”. For example, W1 means the weight of the first key indicator (risk mitigation and reliability). It is the final result of the assessment system. The calculation of Wi is shown as Equation (7).
Based on the questionnaire results gathered from the experts’ interview, this research analyzes these reliable data by adopting the Equations (1)–(7) to calculate the weights of sustainability key indicators for bridges, tunnel, and slopes, which are described in the following sections.
3.3. Calculation for Weights of Sustainability Key Indicators for Bridges
This section presents an example with the detailed step-by-step calculation for weights of three levels of the key indicators. The “ecology indicator” is chosen for this demonstration. The other key indicators follow the same steps to calculate the weights and are not duplicated for simplicity.
3.3.1. Relative Weight of the Four Stages
As mentioned in Section 3.2.2, the relative importance among the four stages of the life cycle might be evaluated. The mean (average) of the Rak provided by all the experts is represented as Rk (k = 1 to 4). The weight of importance, Rk, is calculated by adopting Equation (1).
From the questionnaire result on this part, a total of 47 experts expressed their determination for the relative weight of the four stages.
The “Rk” of the four stages for “bridges” is calculated by adopting Equation (1) as the mean of the expert questionnaire results and is shown in Table 2.
Table 2 shows that the relative importance from the design, construction, operation, to demolition stages gradually reduced. It indicates the design stage R1 is the most important one, which leads to the sustainability achievements of a newly developed bridge project from the beginning.
By basic statistics data of questionnaire results, the authors note the number of nk for four stages of each evaluation item of the “ecology” indicator, as shown in Table 3.
3.3.2. The Detailed Calculation Steps for the Weight of Level 3—Four Stages: Wijk
The first evaluation item of indicator “ecology” is the “ecological environment investigation, data collection, and impact assessment”, as shown in Table 1 and Table 3. The “design” stage gathers the questionnaire results for the determinations are n4 (4 points): 28 selected, n3 (3 points): 13 selected, n2 (2 points): 4 selected, n1 (1 point): 2 selected, and n0 (0 points): 0 selected.
By adopting Equation (3), the mean (average) of this stage is listed as follows:
- Mean = (28 × 4 + 13 × 3 + 4 × 2 + 2 × 1 + 0 + 0)/47 = 3.4
By adopting Equation (2), the top two boxes ratio of this stage is listed as follows:
- T211 = (28 + 13)/47 = 87.23%
By adopting Equation (3), the importance weights of each stage for level 3, Wijk, are calculated as follows:
- W211 = 3.4 × 38.68% × 87.23% = 1.16 (W211 denotes second the key indicator, first evaluation item, and first stage)
Followed the same calculation steps, the “construction” stage of the first evaluation item of indicator “ecology”, which is the “ecological environment investigation, data collection, and impact assessment”, is calculated and listed as follows:
- Mean = 2.8, T212 = 63.83%, W212 = 0.55
By adopting the same calculation processes, the authors obtain the “design” stage of the second evaluation item of indicator “ecology”, which is the “site preservation and indicative trees protection”, which is calculated and listed as follows:
- Mean = 3.0, T221 = 76.60%, W222 = 0.89
Furthermore, by adopting the same calculation processes, the researchers obtain the “construction” stage of the second evaluation item of indicator “ecology”, which is the “site preservation and indicative trees protection”, which is calculated and listed as follows:
- Mean = 2.7, T222 = 63.83%, W222 = 0.53
Furthermore, by adopting the same calculation processes, the authors obtain the “operation” stage of the second evaluation item of indicator “ecology”, which is the “site preservation and indicative trees protection”, which is calculated and listed as follows:
- Mean = 2.1, T223 = 38.30%, W223 = 0.16
The “demolition” stage is not related to the evaluation item of “site preservation and indicative trees protection”. The evaluations of these two stages are kept blank, and the W224 is not taken into calculation.
The calculation results of the four stages for all evaluation items of the “ecology” indicator are shown in Table 4.
3.3.3. The Detailed Calculation Steps for the Weights of Level 2—Evaluation Items: Wij
Following the above steps, the calculation for the weight of level 2 Wij is done by adopting of Equation (4). The level 3 weights W211 and W212 of the first evaluation item, which is “ecological environment investigation, data collection, and impact assessment” of the key indicator “ecology”, were calculated in the above steps. They are 1.16 and 0.55, respectively. From Equation (4), the researchers obtained the level 2 weight of the first evaluation item W21 as follows:
- W21 = (1.16 + 0.55)/2 = 0.85
Moreover, the level 3 weights W221, W222, and W223 of the second evaluation item, which is “site preservation and indicative trees protection” of the key indicator “ecology”, were calculated. They are 0.89, 0.53, and 0.16, respectively. From Equation (4), the researchers obtained the level 2 weight of the second evaluation item W22 as follows:
- W22 = (0.89 + 0.53 + 0.16)/3 = 0.52
Besides, the level 3 weights W231, W232, and W233 of the third evaluation item, which is “ecological environment monitoring” of the key indicator “ecology”, were calculated. They are 0.72, 0.75, and 0.32, respectively. From Equation (4), the researchers obtained the level 2 weight of the third evaluation item W23 as follows:
- W23 = (0.72 + 0.75 + 0.32)/3 = 0.59
Furthermore, the level 3 weights W241, W242, and W243 of the fourth evaluation item, which is “selection of low impact construction methods and preservation of biodiversity, animal habitat integrity, and the establishment of safety facilities for animals”, were calculated. They are 1.04, 0.94, and 0.26, respectively. From Equation (4), the researchers obtained the level 2 weight of the fourth evaluation item W24 as follows:
- W24 = (1.04 + 0.94 + 0.26)/3 = 0.75
Now, the researchers obtain the summation of Wij as Si by adopting Equation (5) as follows:
- S2 = (0.85 + 0.52 + 0.59 + 0.75)/4 = 0.679
The calculation results for weights Wij and its mean of summary Si of the second level for the key indicator “ecology” are listed in Table 5.
3.3.4. The Detailed Calculation Steps for the Weights of Level 1—Key Indicators: Wi
By adopting Equations (1)–(4), the researchers obtain the weights Wij, which is the mean of summary Si of the second level for all sustainability key indicators and is listed in Table 6.
After this step, the researchers obtain Si for ten sustainability key indicators. By adopting Equation (6), the researchers calculate Stotal as follows:
- Stotal = S1 + S2 + ………… + S10 = 0.985 + 0.679 + 0.608 + 0.458 + 0.546 + 0.968 + 0.623 + 0.740 + 0.358 + 0.452 = 6.418
Following the above calculation steps, the researchers adopt Equation (7) to calculate the importance weights of ten key indicators for level 1, Wi.
- Wi = Si/Stotal
The obtained Wi is the final result, “weight”, of the sustainability key indicators for “bridges”. Table 7 lists the calculated weights of level 3 (Wijk: four stages), level 2 (Wij: evaluation items), and level 1 (Wi: ten key indicators) for “bridges”. Figure 10 shows the statistics chart for the weight of each key sustainability indicators for bridges.
The authors divide the experts into different groups based on the occupation of the experts for the comparison of different results among these groups. There are four groups distinguished as the construction industry, consulting industry, government, and university. The relative weights Rk by different groups of experts are shown in Figure 11.
Furthermore, the weights of the ten indicators for this research obtained from the interview results from different groups of experts are analyzed to understand the different occupational engineers’ opinions on these civil and building projects’ sustainability issues. Figure 12 shows the charts of weights by different groups of experts’ interviews for bridge projects.
4. Sustainability Evaluation for Bridges Using the SASGCI
4.1. Calculation for the Evaluation
The central part of the evaluation system for sustainability achievement is the scoring sheet. Figure 13 shows the example of a scoring sheet for the key indicator, “ecology”.
The scoring sheet includes all the evaluation items of the key indicators with the design, construction, operation, and demolition stages. There are five categories: very good, good, not applicable (or average), bad, and very bad, in each scoring cell to evaluate each stage of each evaluation item’s performance. The evaluation team, who should be qualified or experienced experts, can choose one of the five selections to be his/her determination for the performance of the evaluation in each stage. Selection between the five options listed in the score sheet represents points as follows:
- Very good: 2 points.
- Good: 1 point.
- Not applicable (or average): 0 points.
- Bad: minus 1 point.
- Very bad: minus 2 points.
Considering that it might create a harmful effect on the sustainability issues during the life cycle of a bridge project, the authors propose the minus point to be the evaluator’s option.
If the evaluation is performed for a new bridge project, a detailed design is necessary for evaluation processes. If the evaluation is performed for a bridge that is under construction or in service, the achievement of sustainability can be evaluated directly based on its actual performance.
The obtained point Pijk from the selection will multiply with the level 3 weight Wijk to calculate each stage’s score for the evaluation items of ten key indicators. The score of each key indicator Pi can be calculated by Equations (8) and (9).
The final score (FS) of sustainability achievement is calculated after the summation of Pi. An adjust factor (AF) is defined to normalize the calculated score to the standard 0–100 scaling system. It is feasible to distinguish different grades of sustainability achievement. The FS can be calculated by Equation (10).
4.2. Evaluation Results
The following criteria are proposed to determine the grade certified from SASGCI:
The rating of the new project based on the SASGCI should meet each category’s score requirements as listed below. The following scores are tentatively assigned by the authors and can be modified later after the accumulation of more cases.
- Certified grade: the final score must be higher than 50 points.
- Bronze grade: the final score must be higher than 60 points.
- Silver grade: the final score must be higher than 70 points.
- Gold grade: the final score must be higher than 80 points.
- Diamond grade: the final score must be higher than 90 points.
To demonstrate the applicability of using the established SASGCI for the evaluation of sustainability, the authors present a case of a scenic bridge in Taiwan.
5. Case Study for Bridge Evaluation Using the SASGCI
In recent years, some bridge projects that developed in sustainable consideration are under construction in Taiwan. The researchers adopt the SASCGI for bridges established in this research to verify one bridge project under construction, Baimi Scenic Bridge (BSB) of Suhua Highway, in which the first author is in charge of construction management [9]. The researchers discuss the sustainability achievements by adopting SASGCI to realize the applicability of SASGCI for this individual case.
5.1. Baimi Scenic Bridge (BSB) of Suhua Highway
The Suhua Highway Improvement Project (SHIP) is located in eastern Taiwan, running in a north–south direction and connecting Suao (north end) and Hualien (south end). The SHIP design started in 2008, and associated construction work commenced in 2013. It has served for transportation on 6 January 2020. The SHIP includes eight tunnels (a total of 24.5 km), thirteen bridges (8.5 km), and embankments/cuts (5.8 km), with a total length of 38.8 km. Some sustainability issues, including ecology, landscape, carbon reduction, and cultural preservation, have been taken into consideration for the life cycle of SHIP. The highway design incorporates local culture into the bridge architecture as well. It makes a pleasant addition to the landscape [9,17,32].
The authors highlight some primary sustainability practices and achievements of BSB as follows:
- Carbon footprint inventory [33,34]: A carbon footprint study indicates that improvements in material manufacturing processes and machinery operation can reduce carbon emission effectively during construction. In the BSB project, engineers focused on two portions: modifying the concrete mixture and improving the operation efficiency of equipment and machines.
- Concrete mixture for carbon reduction [35]: During the construction of BSB, the average carbon emission during cement production is 0.58 kgCO2 e/kg. The concrete mixture was modified by substituting cement with recyclable materials such as coal fly ash (CFA) and ground-granulated blast-furnace slag (GGBFS), which was estimated in the design stage to reduce carbon emissions by 13–18% compared with the average value. In the completion of BSB, the carbon emission was found to be reduced by up to 34–43% from the original estimate.
- Research on specified species [36]: Construction activities can severely impact the habitats of local animal species. In the BSB construction, the biologists developed a research program to monitor changes in species’ population and health during the construction process. A severe variety of the quantity of the local species has caused the suspension of construction work to seek the reasons and resolve the ecology impact.
- Ecological conservation: The highway alignment was adjusted to avoid cutting or removing trees. The electrical control room for the tunnel was built underground to minimize any impact on the aboveground environment. Furthermore, efforts in design have been made to prevent animals from roadkill. Unique shading boards and light-cutting devices have been installed along the road edges to protect insects and other small flying species in the evening.
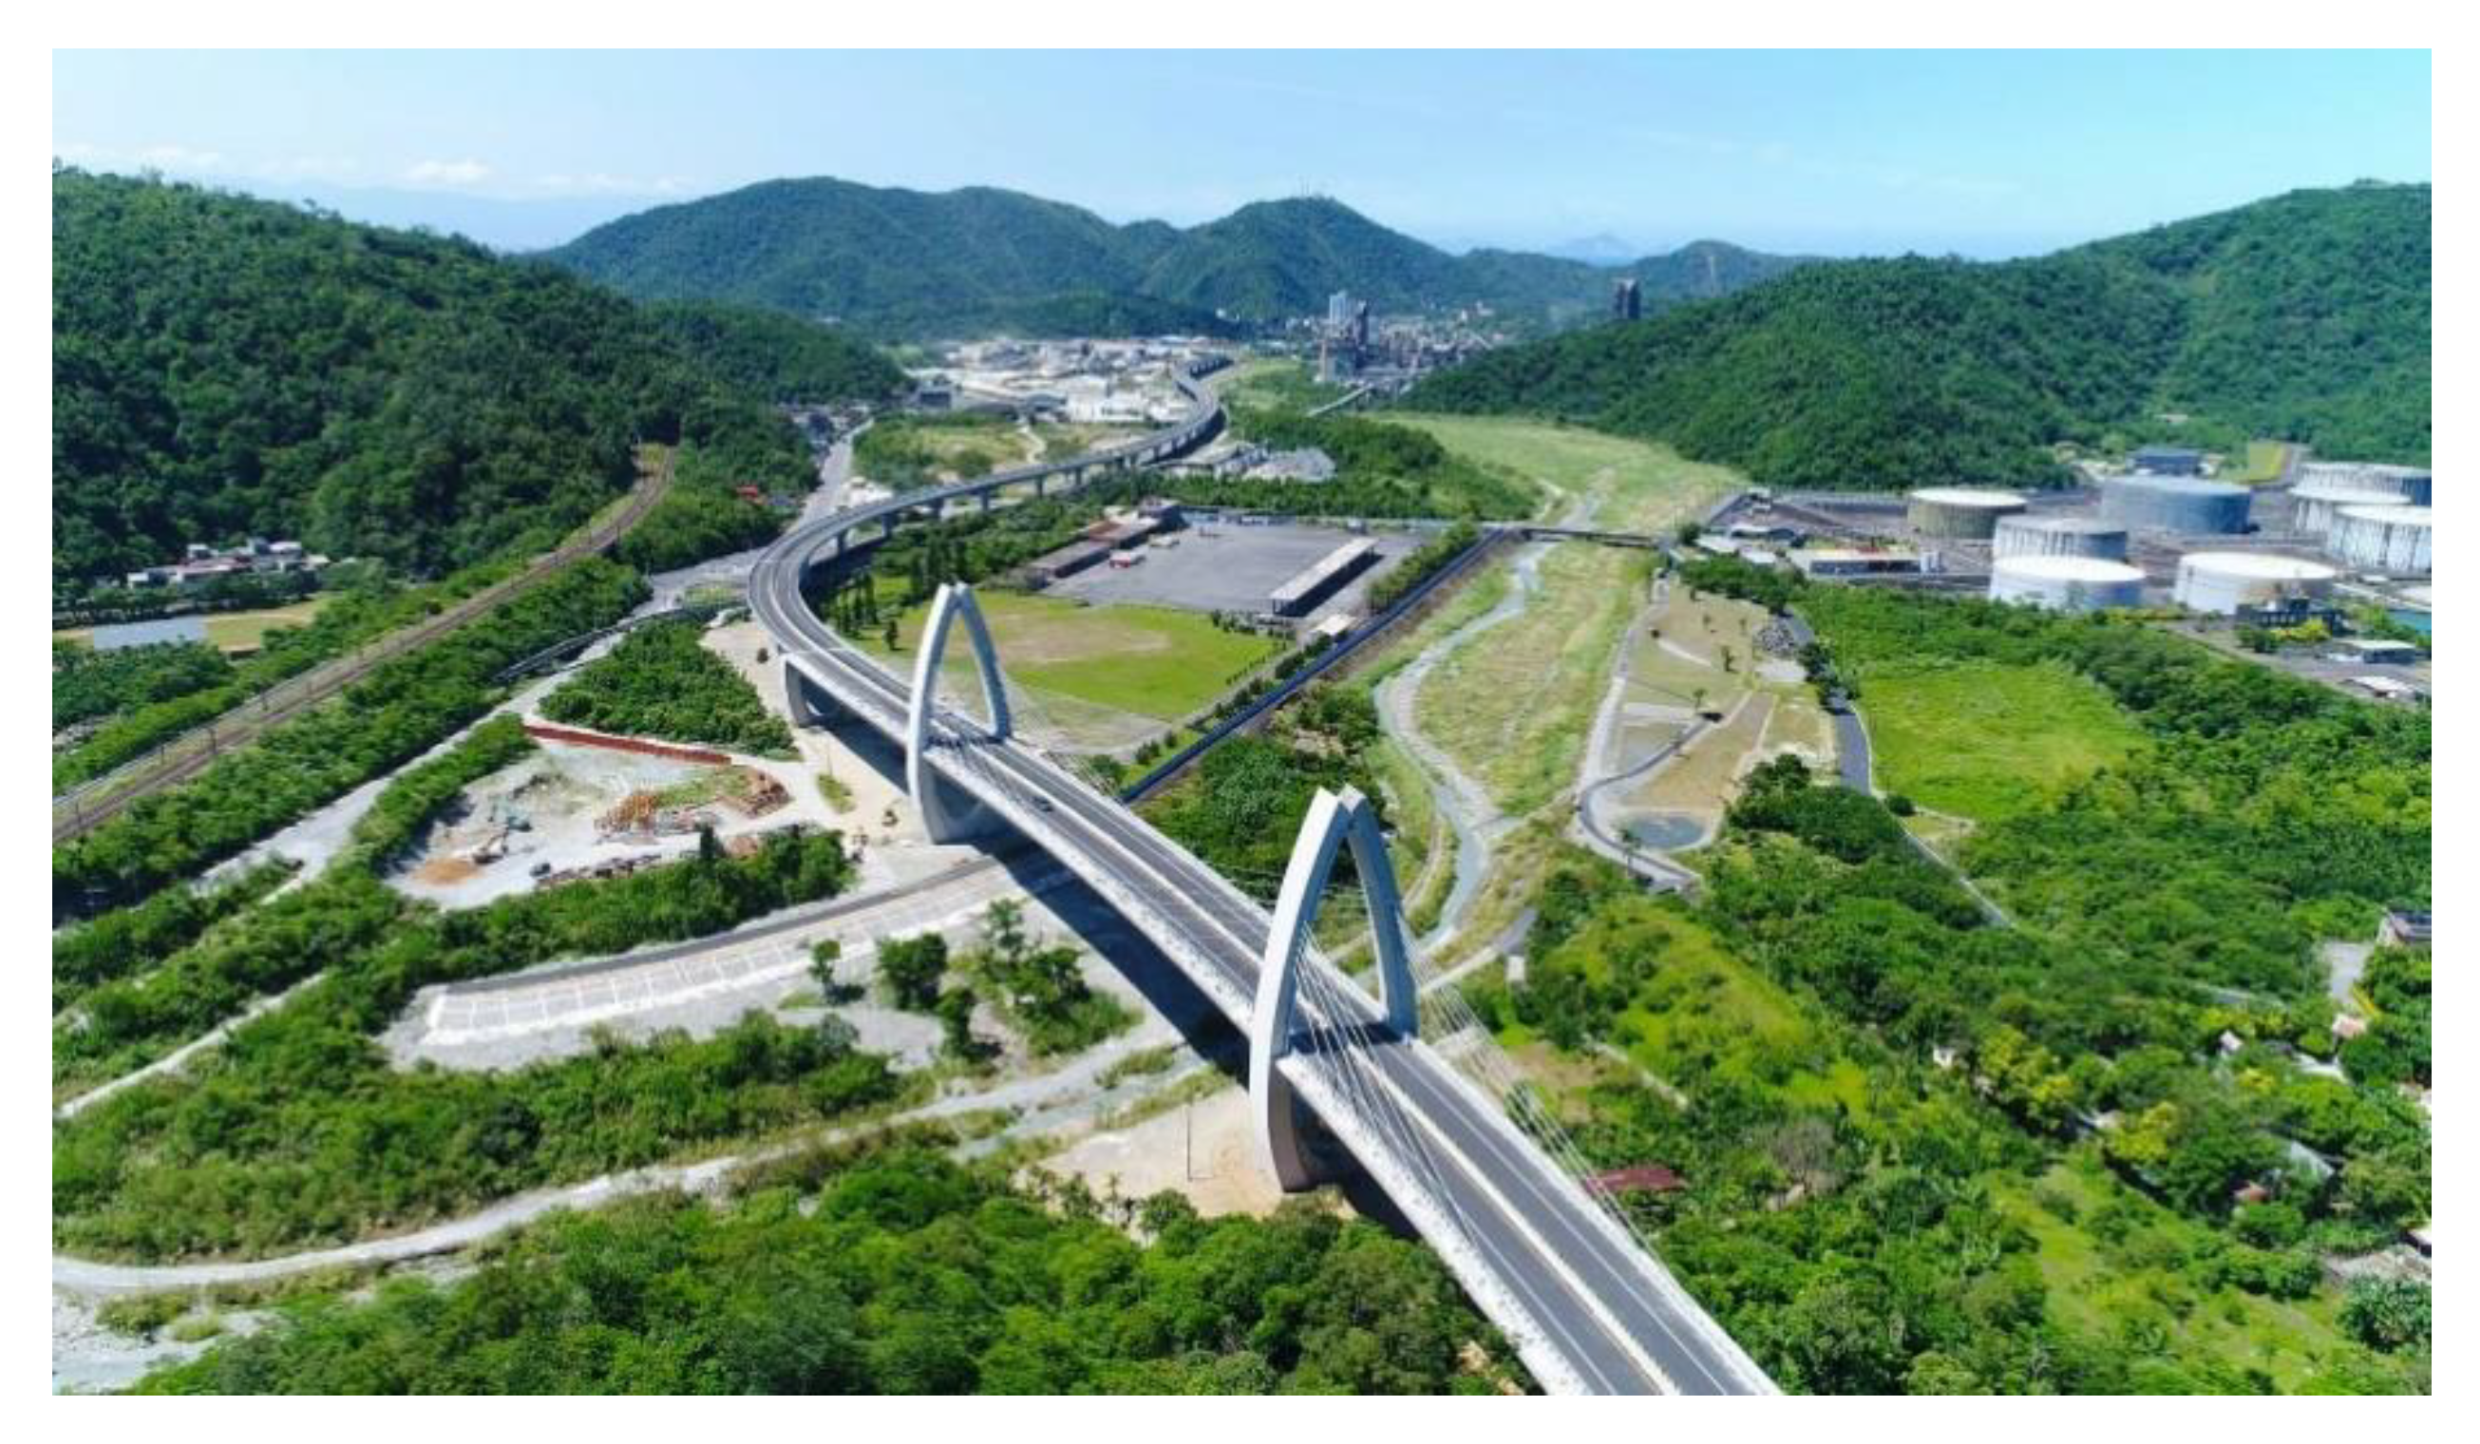
- Landscape: The highway passes by Baimimal Community, a village located between Suao and the Dongao tunnel. In Chinese, “Baimi” is the pronunciation of “rice”. The structure of Baimi Scenic Bridge is an extradosed bridge with a total length of 340 M. The engineers designed the pylon of the bridge to have a shape like a rice grain. This design incorporates local characteristics into the bridge architecture, making it a pleasant addition to the landscape. Figure 14 show on-site pictures of the BSB [19].
- Cultural preservation: During the excavation of the bridge foundation located near Hanbern, the engineers discovered ancient human ruins, including old tools and goods. This “Hanbern Historic Remains” is the relics of a Neolithic culture that was prevalent in this area 1100–1800 years ago. Because of the archeological significance, the owner asked the bridge construction to stop for several years, until the archaeologist finished their on-site study.
5.2. The Detailed Calculation Steps for Evaluation of BSB of Suhua Highway
By applying the SASGCI, the constructed BSB was taken as an example to evaluate the sustainability achievements. The evaluation committee members were selected from the Ministry of Transportation and Communication of the Republic of China (ROC) experts. Some professors who are specialized in bridge and transportation engineering were also invited to the evaluation committee. After a detailed discussion among the evaluation committee members, the points of each stage for ten indicators are listed in Table 8.
The above blank cells (N/A) are not related to the execution of each evaluation item. The evaluation members are not requested to evaluate these stages during the evaluation work.
The next step to calculate the evaluation scores is to pick the determination of Pijk in the scoring sheet, as shown in Figure 11. The authors organize the SHIP director and some selected engineers to be the evaluation team members to determine the points Pijk of each stage (design, construction, operation, and demolition) for all evaluation items. In this bridge case, the authors take the “ecology” indicator to illustrate how the FS of bridges is calculated.
By adopting Equation (8), “ecology” is the second sustainability key indicator, so that the Pij could be showed as P2j. Moreover, there are four evaluation items contained in this indicator, so that the j could be shown as the number of 1 to 4 for representation of the four items. By adopting Equation (8), the P2j is calculated as follows:
- P21 = 2.0 × 1.16 + 2.0 × 0.55 = 3.40
- P22 = 2.0 × 0.89 + 2.0 × 0.53 + 0.0 × 0.16 = 2.83
- P23 = 2.0 × 0.72 + 2.0 × 0.75 + 0.0 × 0.32 = 2.93
- P24 = 2.0 × 1.04 + 2.0 × 0.94 + 2.0 × 0.26 = 4.49
- P2j = 3.07 + 2.84 + 3.22 + 4.03 = 13.65
By adopting Equation (9), the P2 = Pij × Wi (W2 = 10.6% for bridges as listed in Table 7) is calculated as follows:
- P2 = 13.65 × 10.6% = 1.44
The same steps could be applied to the other indicators and then P1 to P10 are listed as follows:
- P1 = 3.12, P2 = 1.44, P3 = 1.43, P4 = 0.64, P5 = 1.15, P6 = 2.76, P7 = 1.40, P8 = 1.02, P9 = 0.24, P10 = 0.43
The summation of P1 to P10 is 3.12 + 1.44 + 1.43 + 0.64 + 1.15 + 2.76 + 1.40+ 1.02 + 0.24 + 0.43 = 13.65
The authors obtained the adjust factor (AF) for bridges, which is 6.192. By adopting Equation (10), the FS for BSB is calculated to be 84.50. Table 10 lists the evaluation results for the BSB.
As shown in Table 10, the final score (FS) that Baimi Scenic Bridge (BSB)) obtained is 84.50 points. This means that the BSB can be certified as “gold grade” on sustainability achievement, as mentioned in Section 4.2.
6. Conclusions
In this research, the researchers propose an applicable and reliable assessment system to cover most of the “sustainability” issues for the life cycle of infrastructures. Under this motivation, the sustainability assessment system for green civil infrastructures (SASGCI) was established to be an assessment tool for green civil infrastructures, including bridges. By performing face-to-face interviews with 47 experts, the authors gathered the data to determine the weight. The multiple attribute value theory (MAVT) and top two boxes theory (TTBT) were adopted for the analysis of the questionnaire results. The research contains the life cycle for the development of infrastructures, including design, construction, operation and maintenance, and demolition stages. In this study, the authors conclude the weights of ten key indicators for bridges as follows: risk mitigation and reliability: 15.3%, durability: 15.1%, landscape: 11.5%, ecology: 10.6%, benefit and function: 9.7%, environmental protection and carbon emissions reduction: 9.5%, waste reduction: 8.5%, energy-saving: 7.1%, creativity: 7.0%, and humanities and culture reservation: 5.6%. The authors select the Baimi Scenic Bridge (BSB) as the case study to verify the applicability of SASGCI. The evaluation results of the BSB indicate that the SASGCI is a practical and functional tool to determine the sustainability achievement of civil infrastructures.
Author Contributions
Conceptualization, T.-Y.L. and N.N.S.C.; methodology, G.-T.L., P.-H.C., and S.-P.H.; software, T.-Y.L.; validation, P.-H.C.; formal analysis, T.-Y.L. and G.-T.L.; investigation, T.-Y.L.; resources, T.-Y.L.; data curation, T.-Y.L.; writing—original draft preparation, T.-Y.L. and G.-T.L.; writing—review and editing, P.-H.C., N.N.S.C., and S.-P.H.; supervision, P.-H.C., N.N.S.C., and S.-P.H.; project administration, T.-Y.L., P.-H.C., and N.N.S.C.; All authors have read and agreed to the published version of the manuscript.
Funding
This research received no external funding.
Institutional Review Board Statement
Not applicable.
Informed Consent Statement
Not applicable.
Data Availability Statement
All data, models, and code generated or used during the study appear in the submitted article.
Acknowledgments
The authors would like to express a special appreciation to the 47 participated experts for their professional information provided during the interviews, which have contributed to the central database for the establishment of the sustainability assessment system. In addition, we would like to give a special thanks to Suhua Highway Improvement Office for their instruction and supervision on contractors’ construction work of Suhua Highway Improvement Project. Furthermore, we would like to express special appreciation to New Asia Construction and Development Corporation for their help on this research.
Conflicts of Interest
On behalf of all authors, the corresponding author states that there is no conflict of interest.
References
- World Bank. World Development Report 1994: Infrastructure for Development; Oxford University Press: Oxford, UK, 1994; pp. 1–12. [Google Scholar]
- World Bank. Infrastructure at the Crossroads: Lessons from 20 Years of World Bank Experience; The World Bank: Washington, DC, USA, 2006. [Google Scholar]
- Shen, L.; Wu, Y.; Zhang, X. Key Assessment Indicators for the Sustainability of Infrastructure Projects. J. Constr. Eng. Manag. 2011, 137, 441–451. [Google Scholar] [CrossRef] [Green Version]
- Lopez, F.R.; Sanchez, G.F. Challenges for Sustainability Assessment by Indicators. Leadersh. Manag. Eng. 2011, 11, 321–325. [Google Scholar] [CrossRef]
- Amano, K.; Ebihara, M. Eco-intensity analysis as sustainability indicators related to energy and material flow. Manag. Environ. Qual. 2005, 16, 160–166. [Google Scholar] [CrossRef] [Green Version]
- Huang, R.Y.; Lin, W.H.; Chou, N.N.S.; Liaw, T.T.; Tsai, H.N. Research on Establishment of Sustainability Key Indicator System for Public Infrastructure Projects; Public Construction Committee (PCC) of Executive Yuan, R.O.C.: Taipei, Taiwan, 2008; p. 0970300. (In Chinese) [Google Scholar]
- World Commission on Environment and Development (WCED). Brundtland Report: Our Common Future; Brundtland Commission: Rio de Janeiro, Brazil, 1987. [Google Scholar]
- Liu, T.Y.; Chen, P.H.; Chou, N.N.S. Comparison of Assessment Systems for Green Building and Green Civil Infrastructure. Sustainability 2019, 11, 2117. [Google Scholar] [CrossRef] [Green Version]
- Shau, H.J.; Liu, T.Y.; Chen, P.H.; Chou, N.N.S. Sustainability Practices for the Suhua Highway Improvement Project in Taiwan. Int. J. Civ. Eng. 2019, 17, 1631–1641. [Google Scholar] [CrossRef]
- Liu, T.Y.; Chen, P.H.; Chou, N.S. Sustainability-based Construction of the restoration projects for the Guguan hydropower station. In Proceedings of the 5th International Conference on Environmental Science and Civil Engineering (ESCE2019), Nanchang, China, 13–14 April 2019. [Google Scholar]
- Liu, T.Y.; Chen, P.H.; Chou, N.N.; Chou, M.Y.; Lin, J.J.; Lo, H.T. Environmental Sustainability Approaches Adopted for Construction of Anhsin Bridge of Ankeng Metro System in New Taipei City. E3s Web Conf. 2019, 117, 00013. [Google Scholar] [CrossRef]
- Yates, J.K. Design and Construction for Sustainable Industrial Construction. J. Constr. Eng. Manag. 2014, 140, B4014005. [Google Scholar] [CrossRef]
- Chisholm, D.; Reddy, K.; Beiler, M.R.O. Sustainable Project Rating Systems, Including Envision. In Engineering for Sustainable Communities: Principles and Practices; ASCE: Reston, VA, USA, 2017; Chapter 20. [Google Scholar]
- Chou, N.N.S. The Achievements of Mechanically Stabilized Earth (MSE) Walls on Green/Sustainable Features and Benefits—Safety, Economy, Ecology, and Carbon Emission Reduction. J. Prof. Eng. 2019, 86, 20–26. (In Chinese) [Google Scholar]
- Chou, N.N.S.; Liu, T.Y.; Chen, Y.S.; Cheng, H.C. Comparison of Various Types of MSE Wall Facings. In Proceedings of the 11th International Geosynthetics Conference, Seoul, Korea, 16–21 September 2018. [Google Scholar]
- Huang, R.Y.; Yeh, C.H.; Hsu, W.T. Development of an Appraisal System for Green Highway Construction. J. Technol. 2006, 21, 19–30. (In Chinese) [Google Scholar]
- Greenroads Foundation. Greenroads Rating System Version 2; Greenroads Foundation: Bellingham, WA, USA, 2018. [Google Scholar]
- Ghali, A.; Gayed, R.B.; Kroman, J. Sustainability of Concrete Infrastructures. J. Bridge Eng. 2016, 21, 04016033. [Google Scholar] [CrossRef]
- Liu, T.Y. Establishment of Sustainability Key Indicators for Civil Engineering and Their Applications in Green Infrastructure Projects. Ph.D. Thesis, Department of Civil Engineering, College of Engineering, National Taiwan University, Taipei, Taiwan, 2020. [Google Scholar] [CrossRef]
- Zhong, Y.; Ling, F.Y.Y.; Wu, P. Using Multiple Attribute Value Theory for the Selection of Structural Frame Material to Achieve Sustainability and Constructability. J. Constr. Eng. Manag. 2016, 143, 04016098. [Google Scholar] [CrossRef]
- Patel, R.; Raval, G.; Valiveti, S. Analysis of Energy Consumption in SET TOP BOX: A survey and Opportunities for Energy Saving. Int. J. Comput. Sci. Commun. 2016, 7, 228–235. [Google Scholar]
- Ali, T. What is a Top 2 Box Score? DISPLAYR Blog 2018. Available online: https://www.displayr.com/what-is-a-top-2-box-score/ (accessed on 26 March 2021).
- Xia, B.; Chan, A.P.C. Measuring complexity for building projects: A Delphi study. In Engineering, Construction and Architectural Management; Emerald Group Publishing: Bingley, UK, 2012; Volume 19, pp. 7–24. [Google Scholar]
- Survey-Monkey, “Top Two Boxes Scores”. Survey-Monkey Official Website. 2020. Available online: https://www.surveymonkey.com/mp/top-2-box-scores/ (accessed on 1 July 2020).
- Sambandam, R.; Hausser, G. An Alternative Method of Reporting Customer Satisfaction Scores. Quirk’s Marketing Research Review. October 1998. Available online: https://www.trchome.com/docs/2-alternative-method-of-reporting-scores/file (accessed on 1 July 2020).
- Buede, D.M.; Maxwell, D.T. Rank disagreement: A comparison of multi-criteria methodologies. J. Multi Criteria Decis. Anal. 1995, 4, 1–21. [Google Scholar] [CrossRef]
- Chankong, V.; Haimes, Y.Y. Multi-Objective Decision Making—Theory and Methodology; Dover Publications, Inc.: Mineola, NY, USA, 1983. [Google Scholar]
- Belton, V.; Stewart, T. Multiple Criteria Decision Analysis: An Integrated Approach; Kluwer Academic Publishers: Dordrecht, Germany, 2002. [Google Scholar]
- Leahy, J. Using Excel for Analyzing Survey Questionnaires; University of Wisconsin-Extension: Madison, WI, USA, 2004; G3658-14. [Google Scholar]
- Paul, C. Accessing and Analyzing Data with Microsoft® Excel; Microsoft Press: Redmond, WA, USA, 2003. [Google Scholar]
- Nagel, S.S. Evaluation Analysis with Microcomputers. Public Product. Rev. 1987, 10, 67–80. [Google Scholar] [CrossRef]
- Shau, H.J. Suhua Highway Improvement Project Official Website. 2018. Available online: https://Suhua.thb.gov.tw/ (accessed on 1 July 2020).
- Chou, S.L. Research Report of Carbon Footprint Inventory for Suhua Highway Improvement Project; Suhua Highway Improvement Project Seminar Report; Suhua Highway Improvement Project Office: Taiwan, China, 2014. (In Chinese) [Google Scholar]
- Hsu, P.J. 2013 Annual Progress Report of Carbon Footprint Inventory for Suhua Highway Improvement Project; Suhua Highway Improvement Project Seminar Report; Suhua Highway Improvement Project Office: Taiwan, China, 2013. (In Chinese) [Google Scholar]
- Sinotech Engineering Consultants, Ltd. 2013 Annual Report for Suhua Highway Improvement Project; Suhua Highway Improvement Project, Carbon Footprint Inventory Report; Sinotech Engineering Consultants, Ltd.: Taipei, Taiwan, 2013. (In Chinese) [Google Scholar]
- Shau, H.J. 2012–2016 Annual Research Report on Indicative Species for Suhua Highway Improvement Project; Suhua Highway Improvement Project Annual Report; Suhua Highway Improvement Annual Project: Taiwan, China, 2012–2016. (In Chinese) [Google Scholar]
Figure 1.
Key indicators of “green buildings” and “sustainable civil infrastructures”.
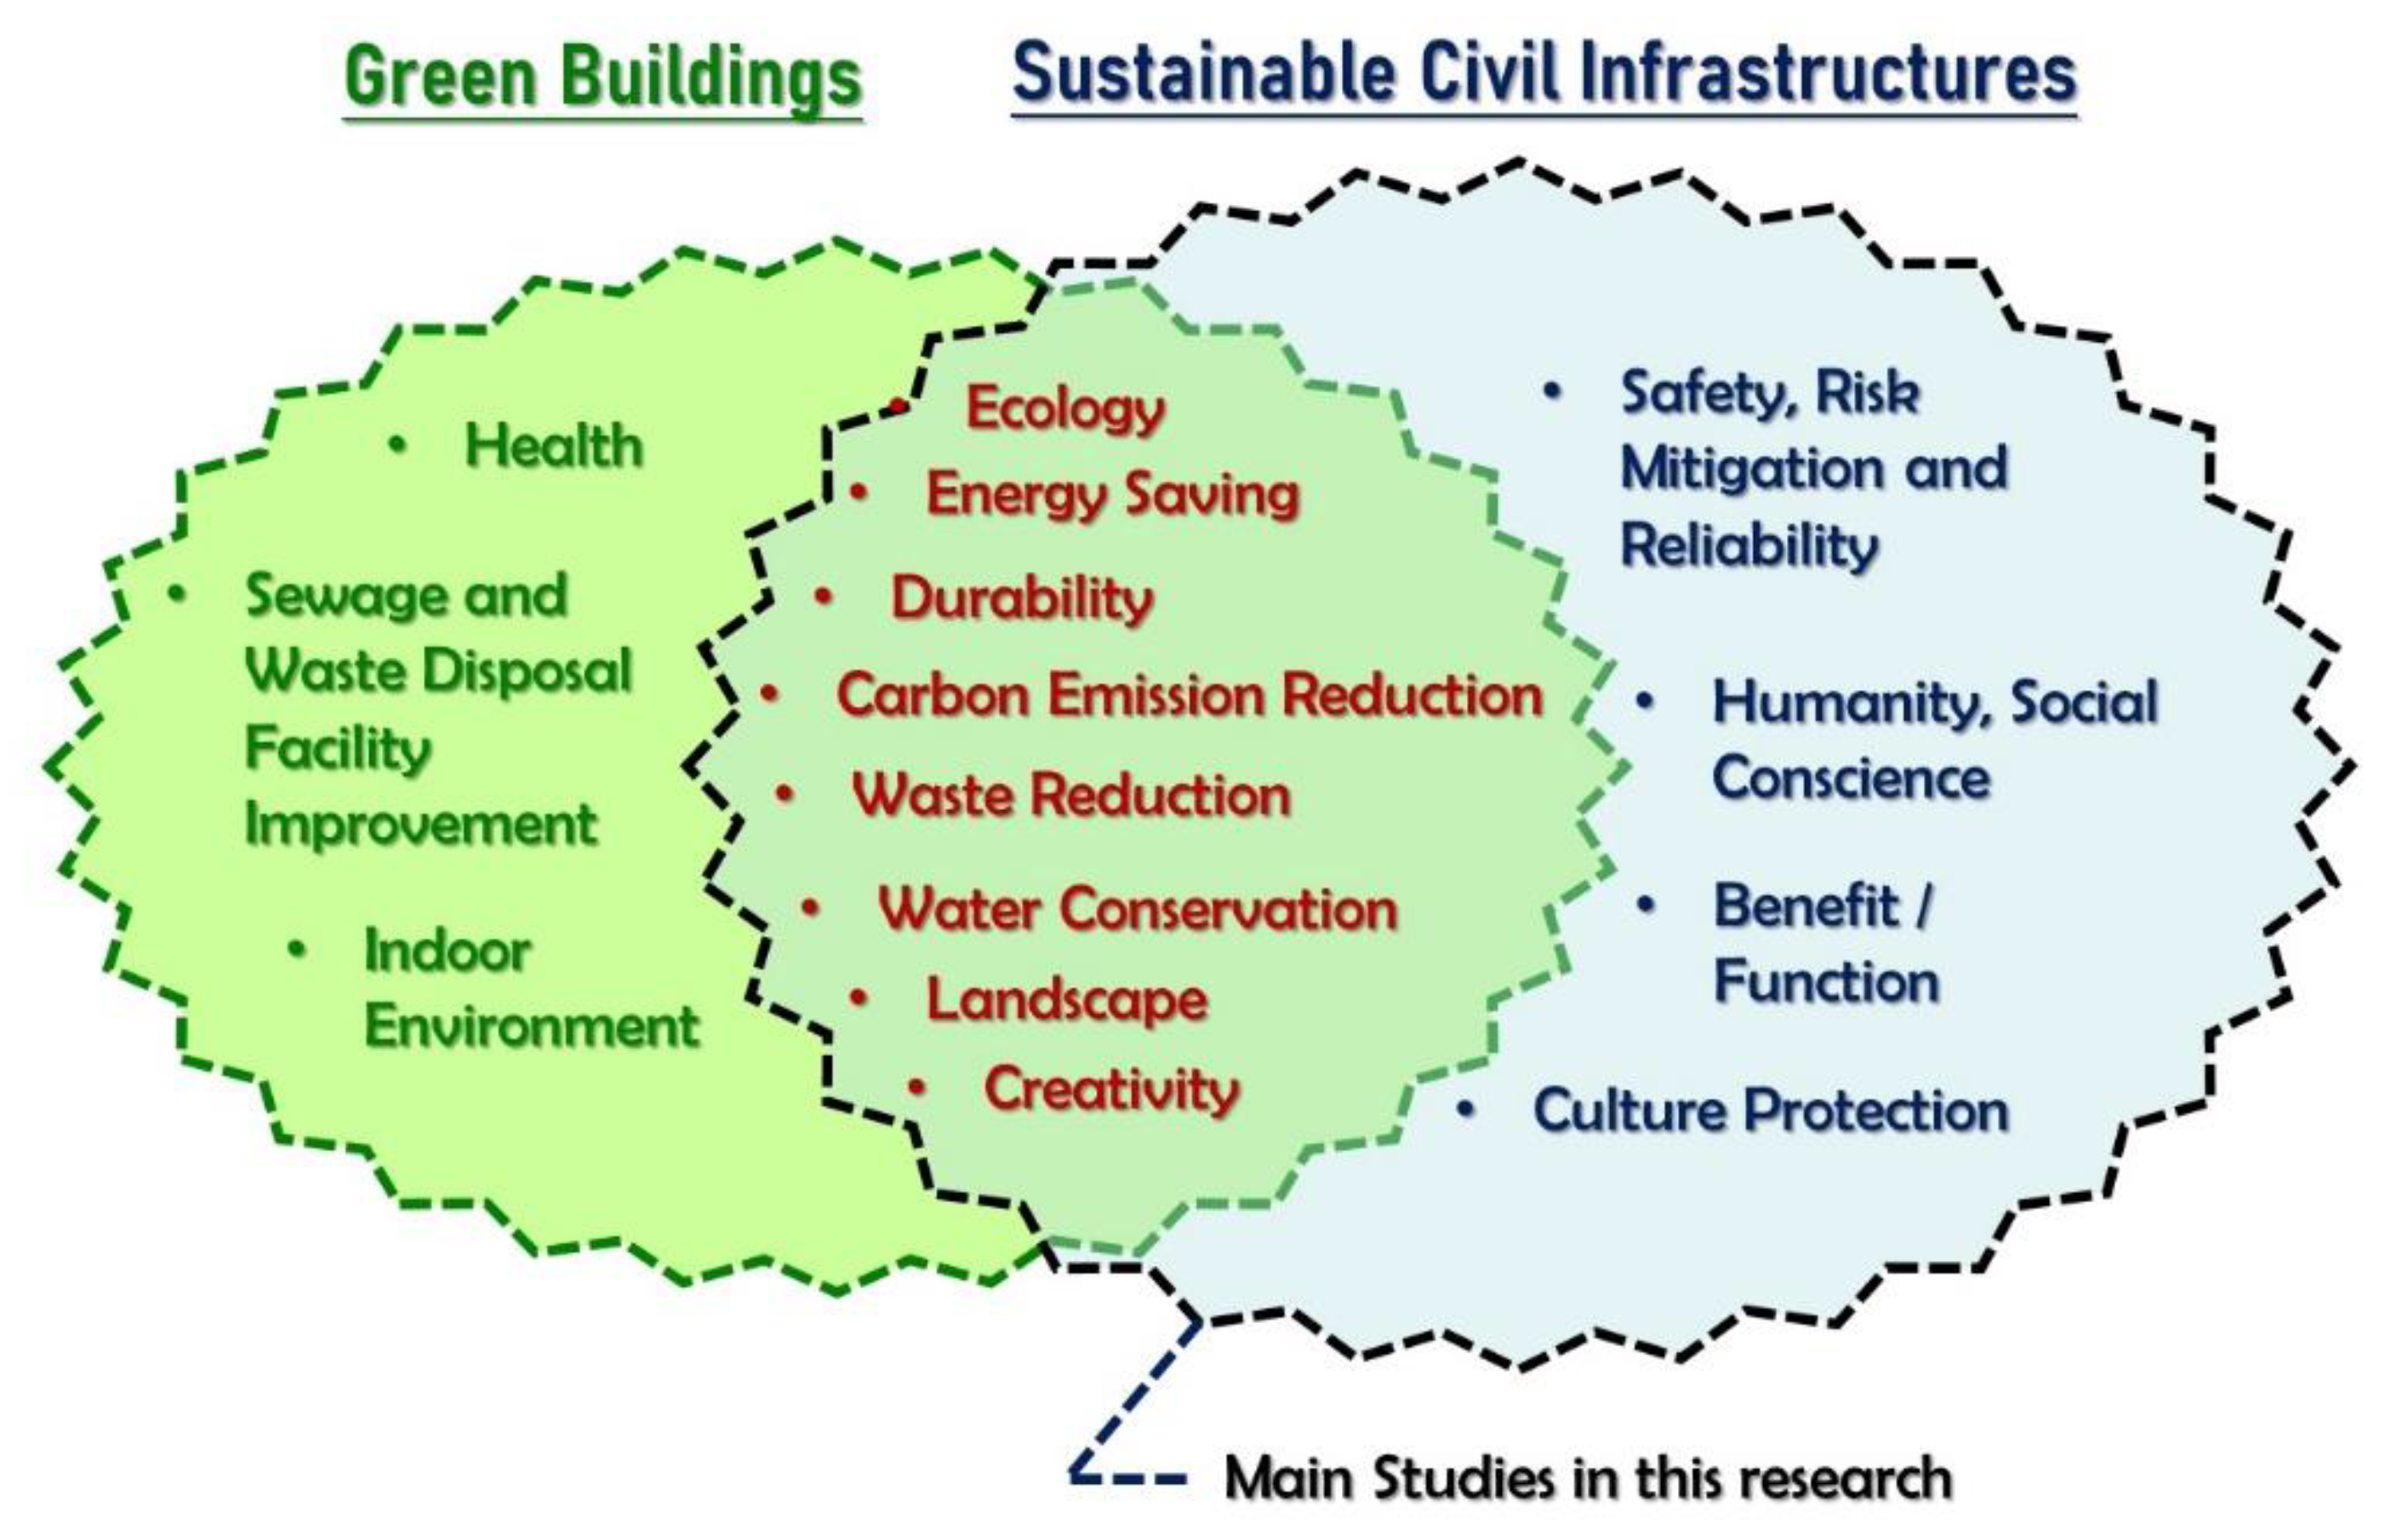
Figure 2.
A part of the questionnaire (ecology part only; the rest are included in Table 1).
Figure 2.
A part of the questionnaire (ecology part only; the rest are included in Table 1).
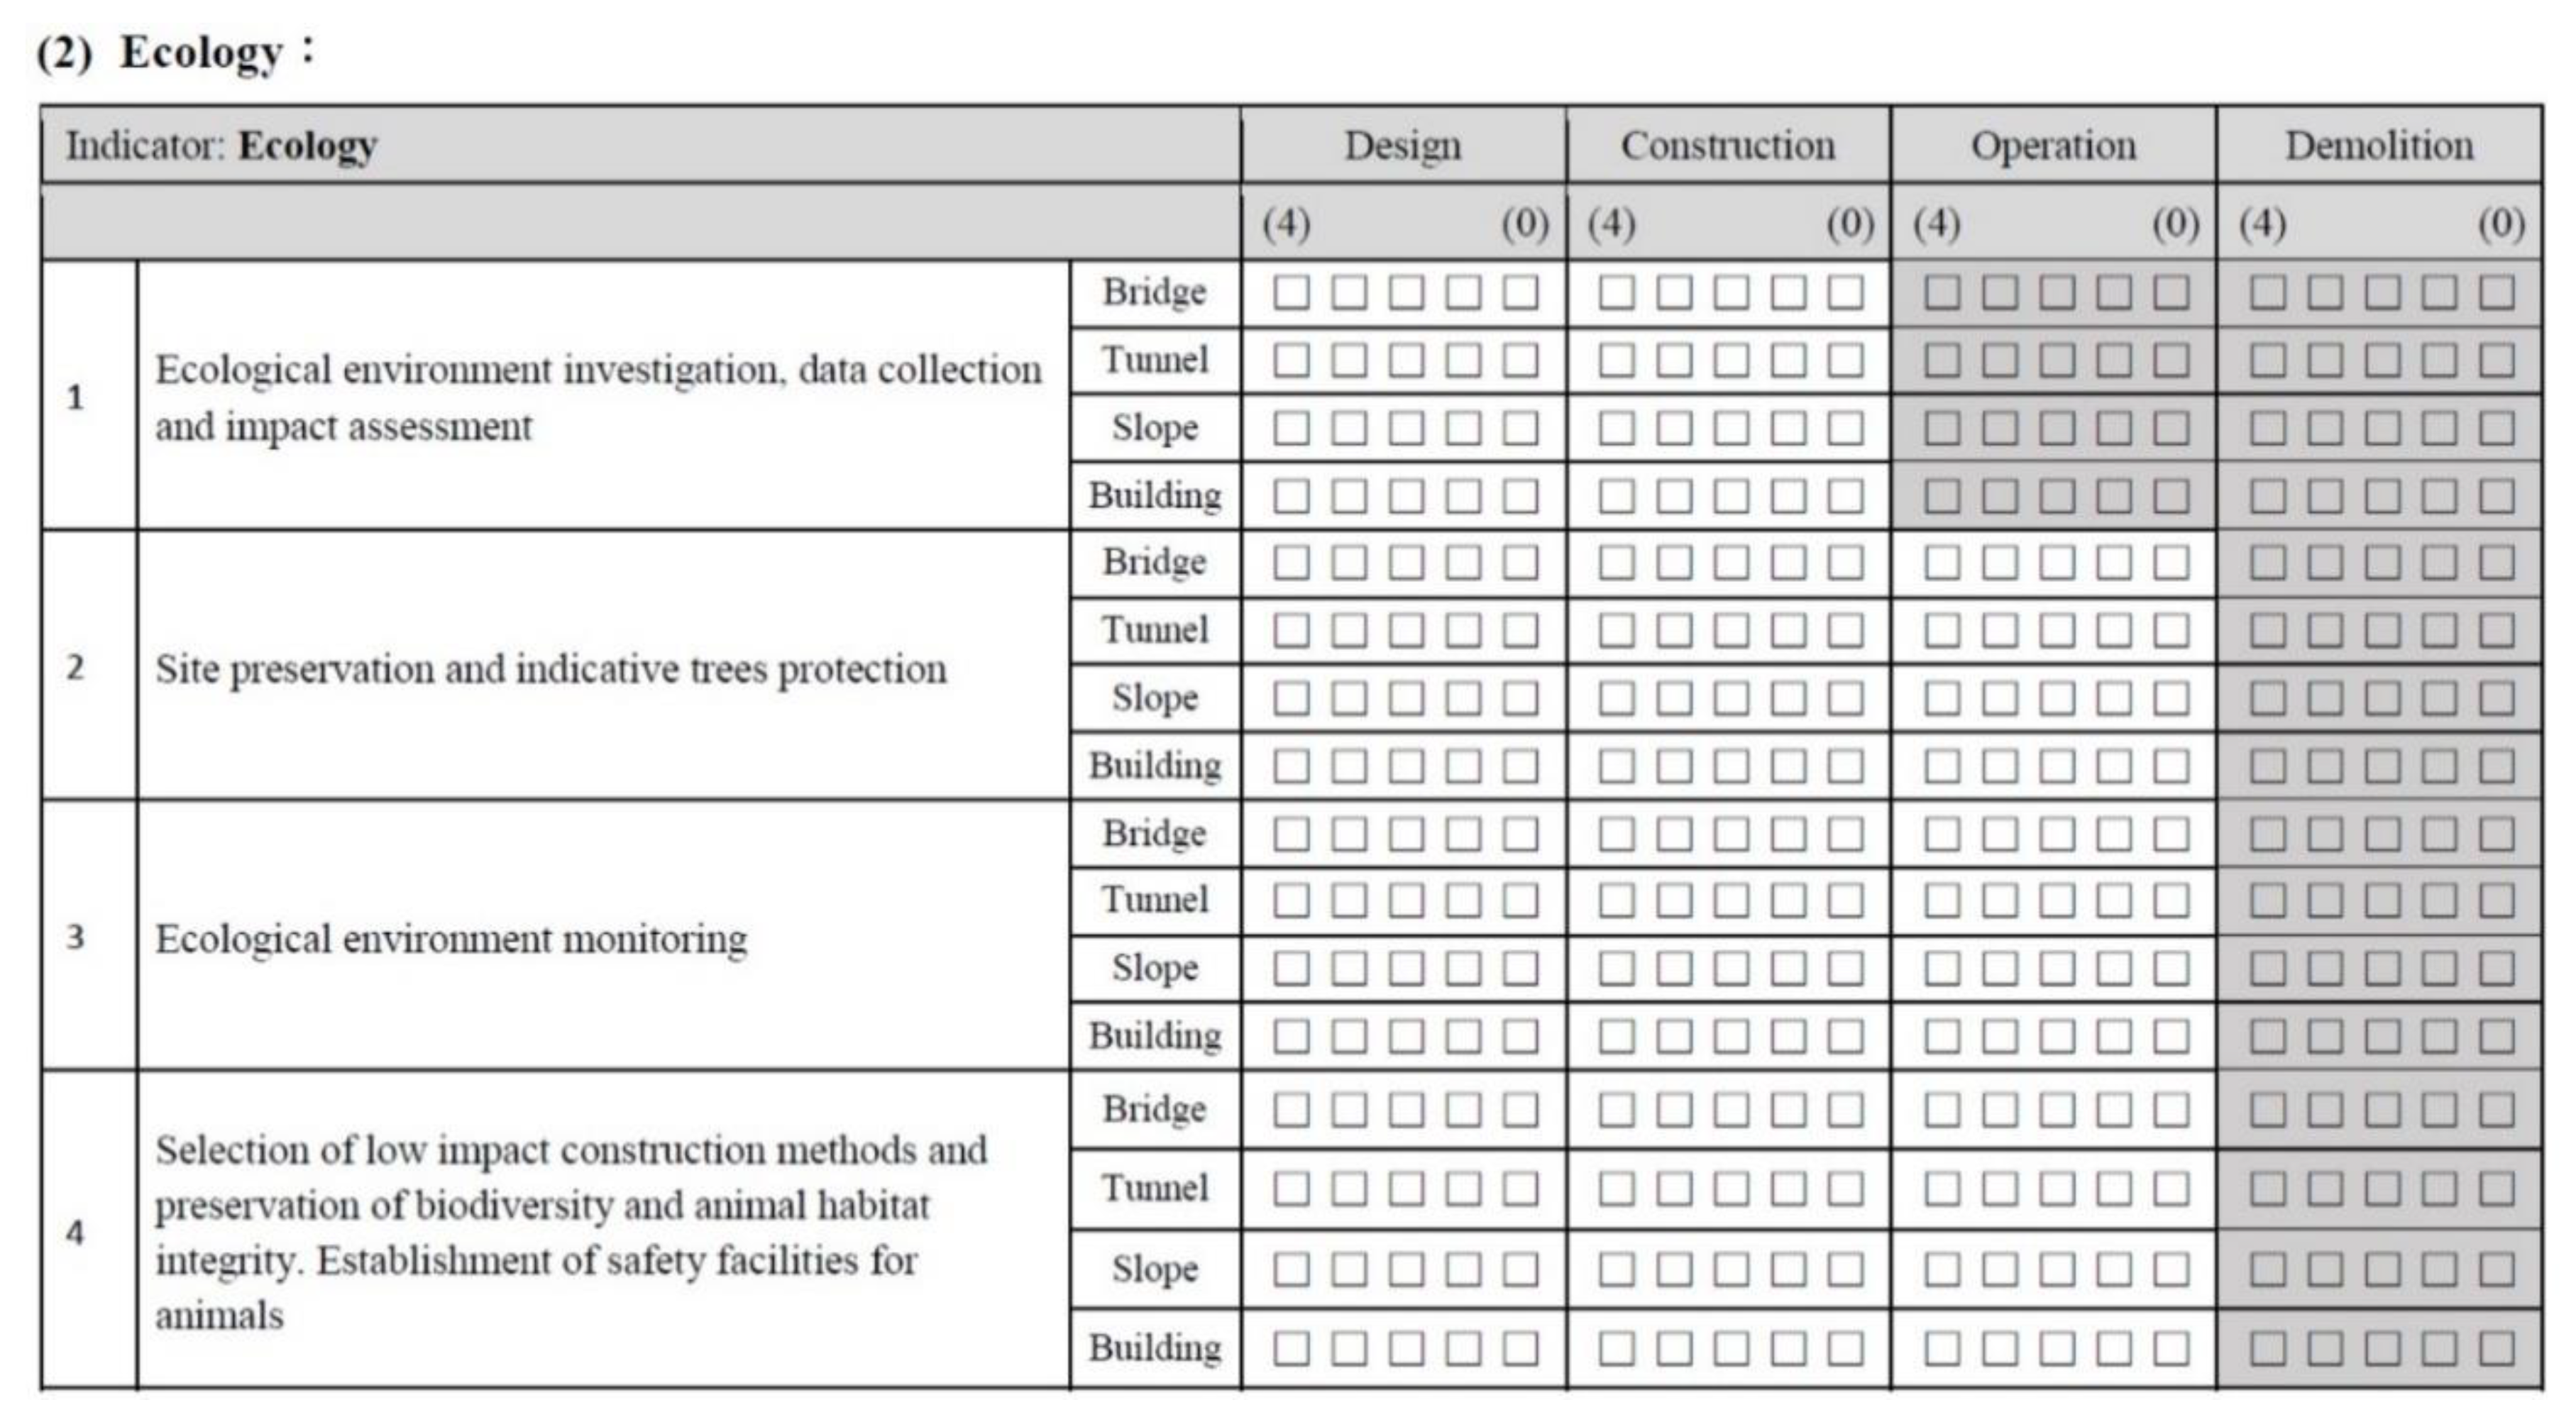
Figure 3.
3D diagram of the Wijk (point A denotes the location of W243).

Figure 4.
Development of the assessment system [19].
Figure 4.
Development of the assessment system [19].


Figure 6.
Research framework of the assessment system [19].
Figure 6.
Research framework of the assessment system [19].
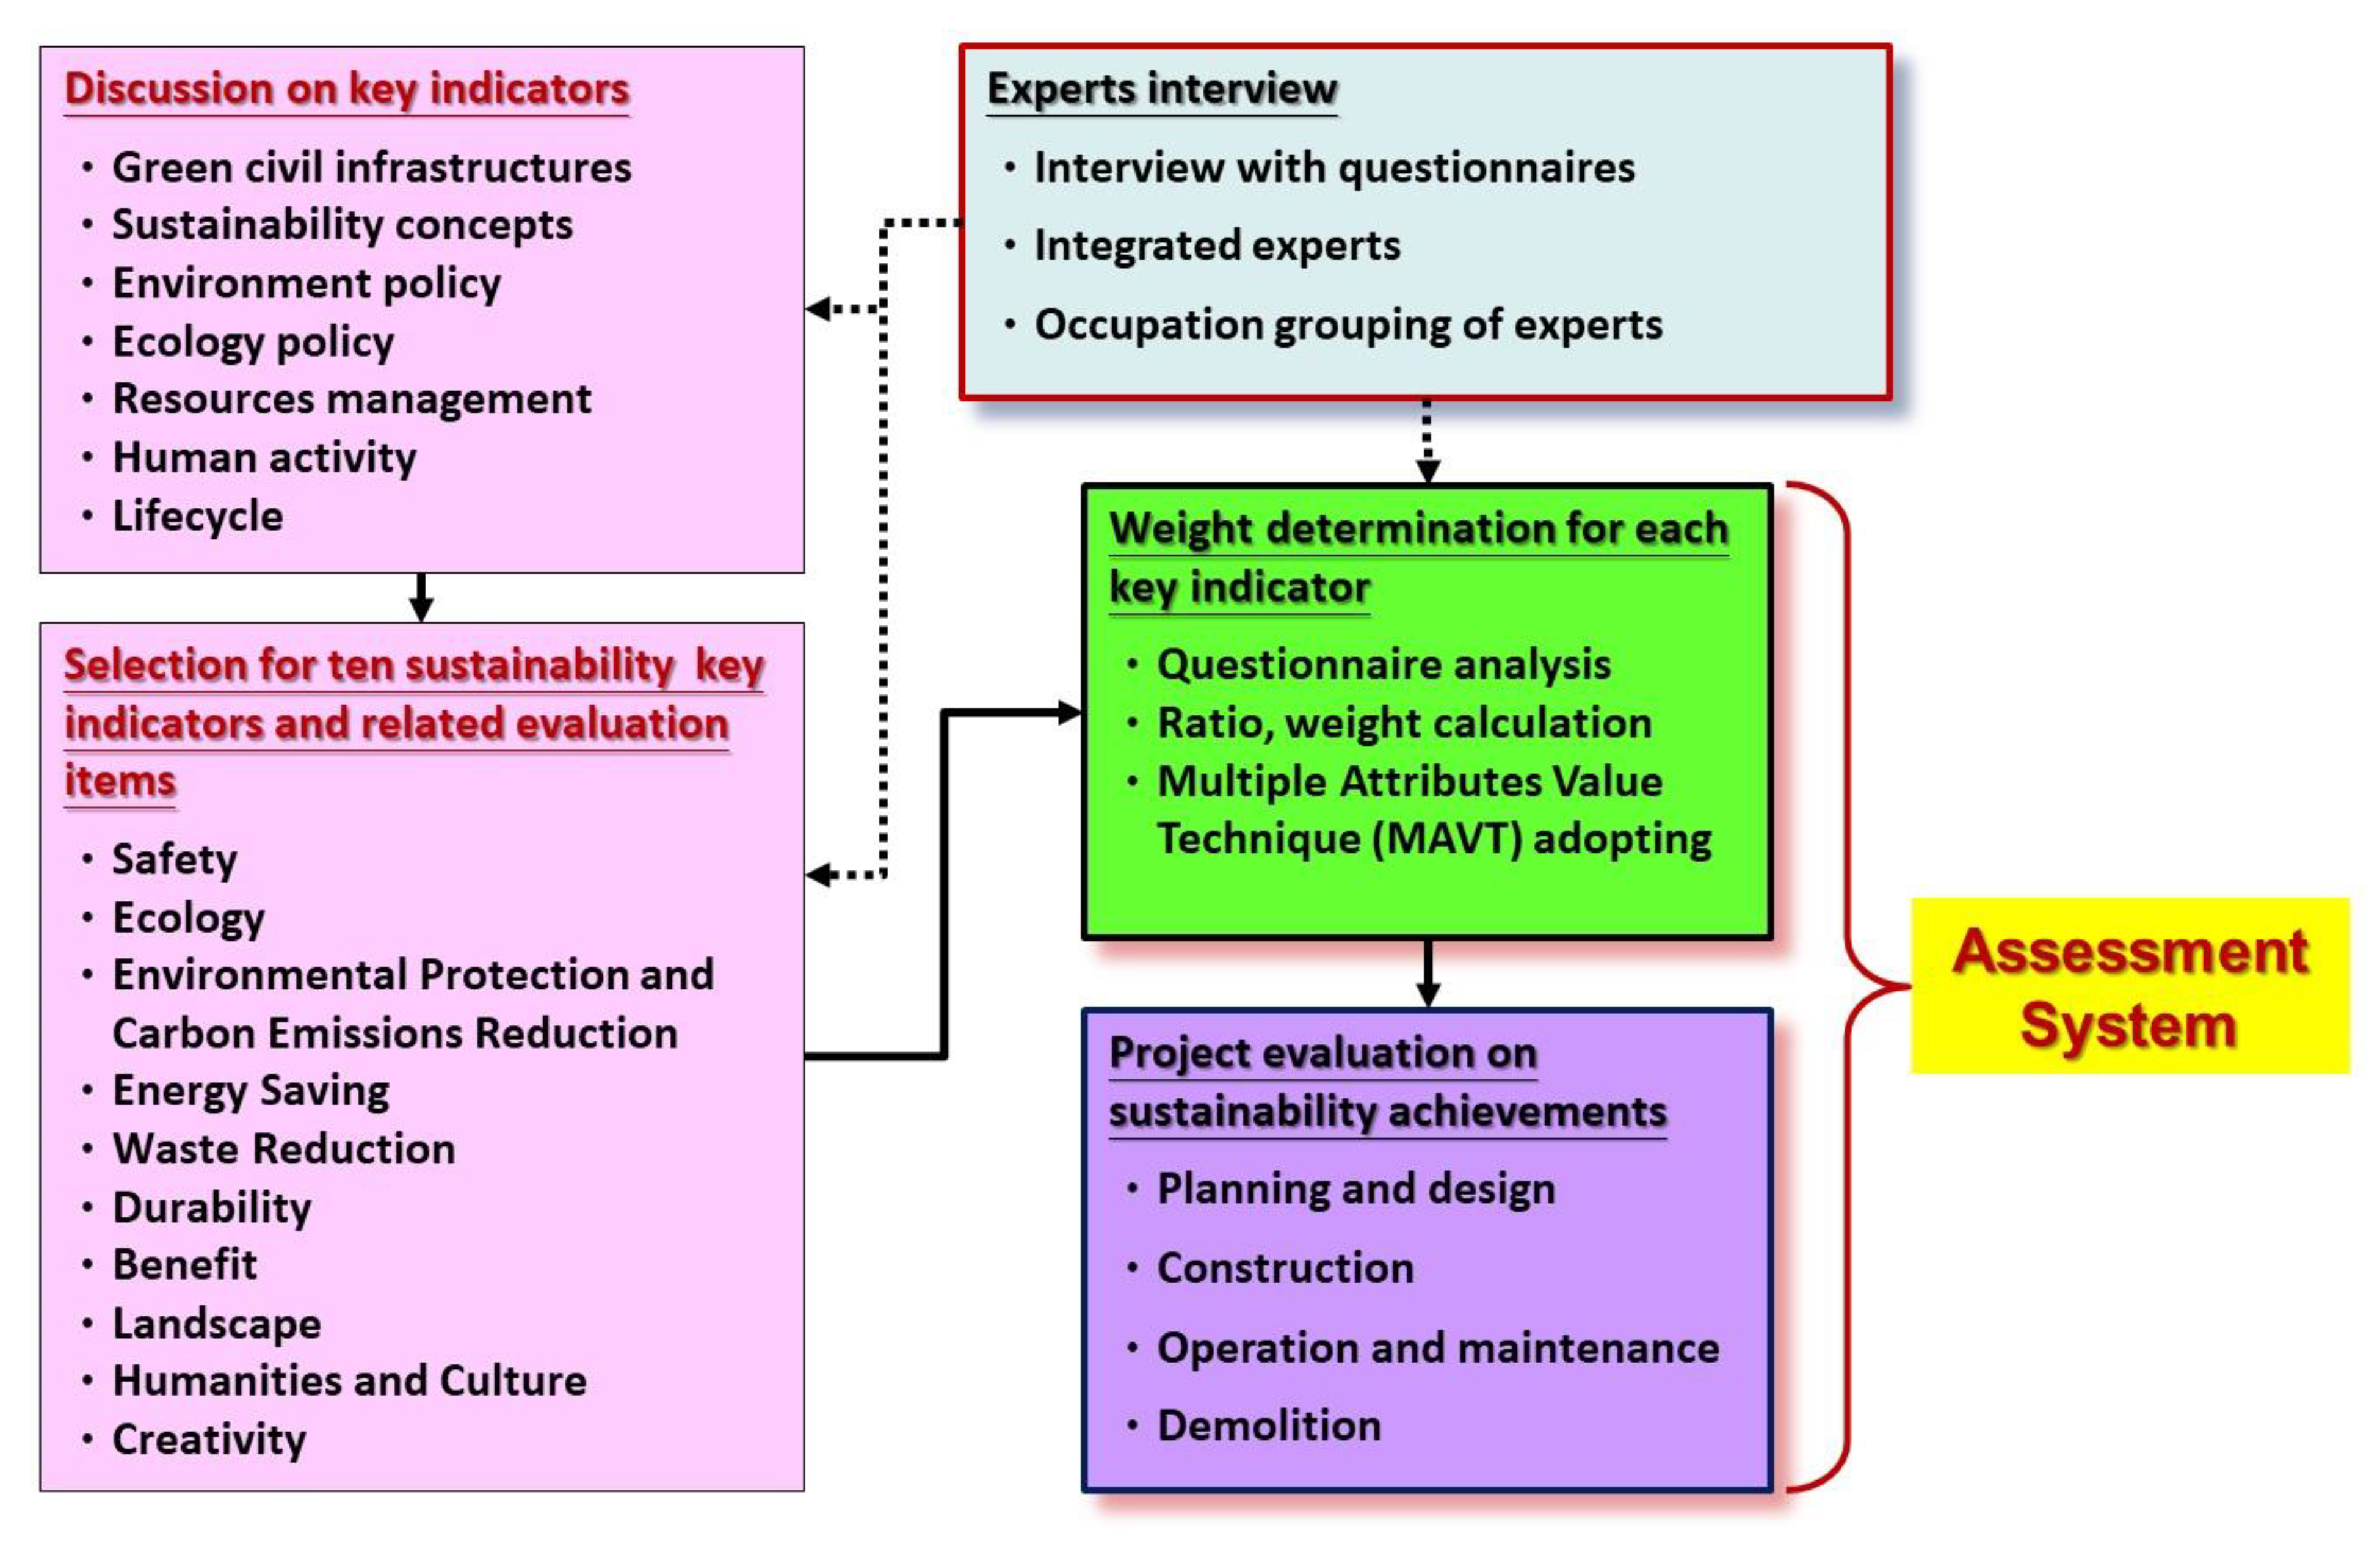
Figure 7.
Diagram of experts’ disciplines (note: CM denotes construction management).

Figure 8.
Distribution of experts’ occupations.
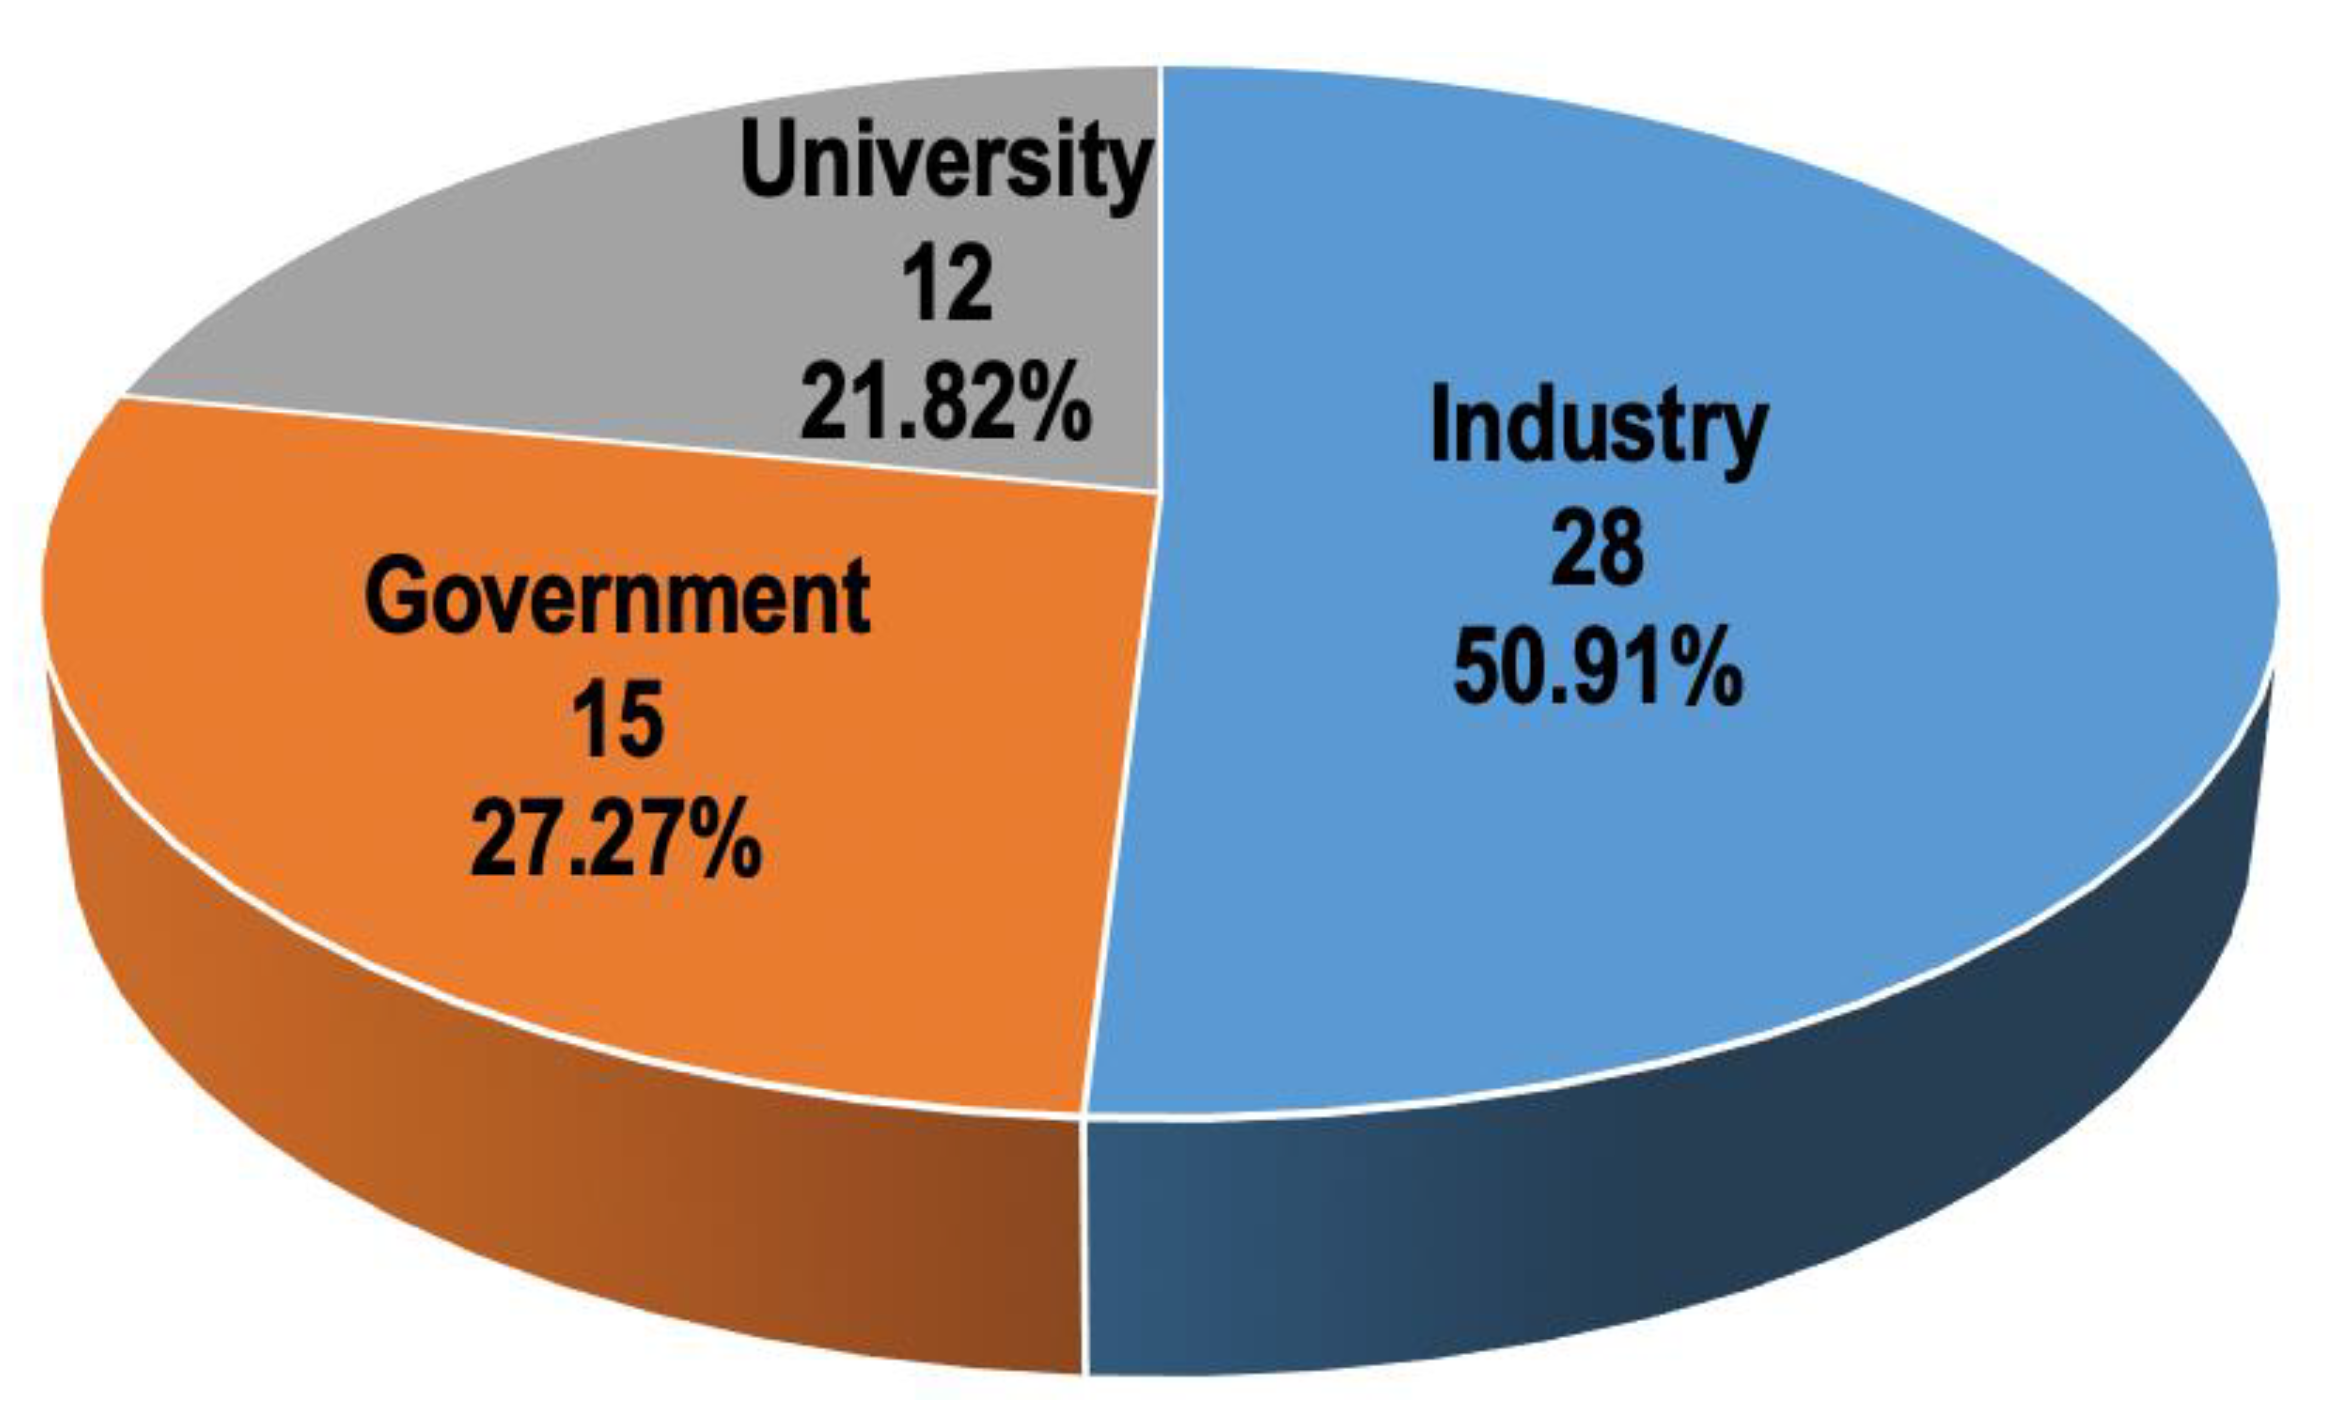
Figure 9.
Education levels of experts.

Figure 10.
Statistics chart for the weight of each key sustainability indicator for bridges.
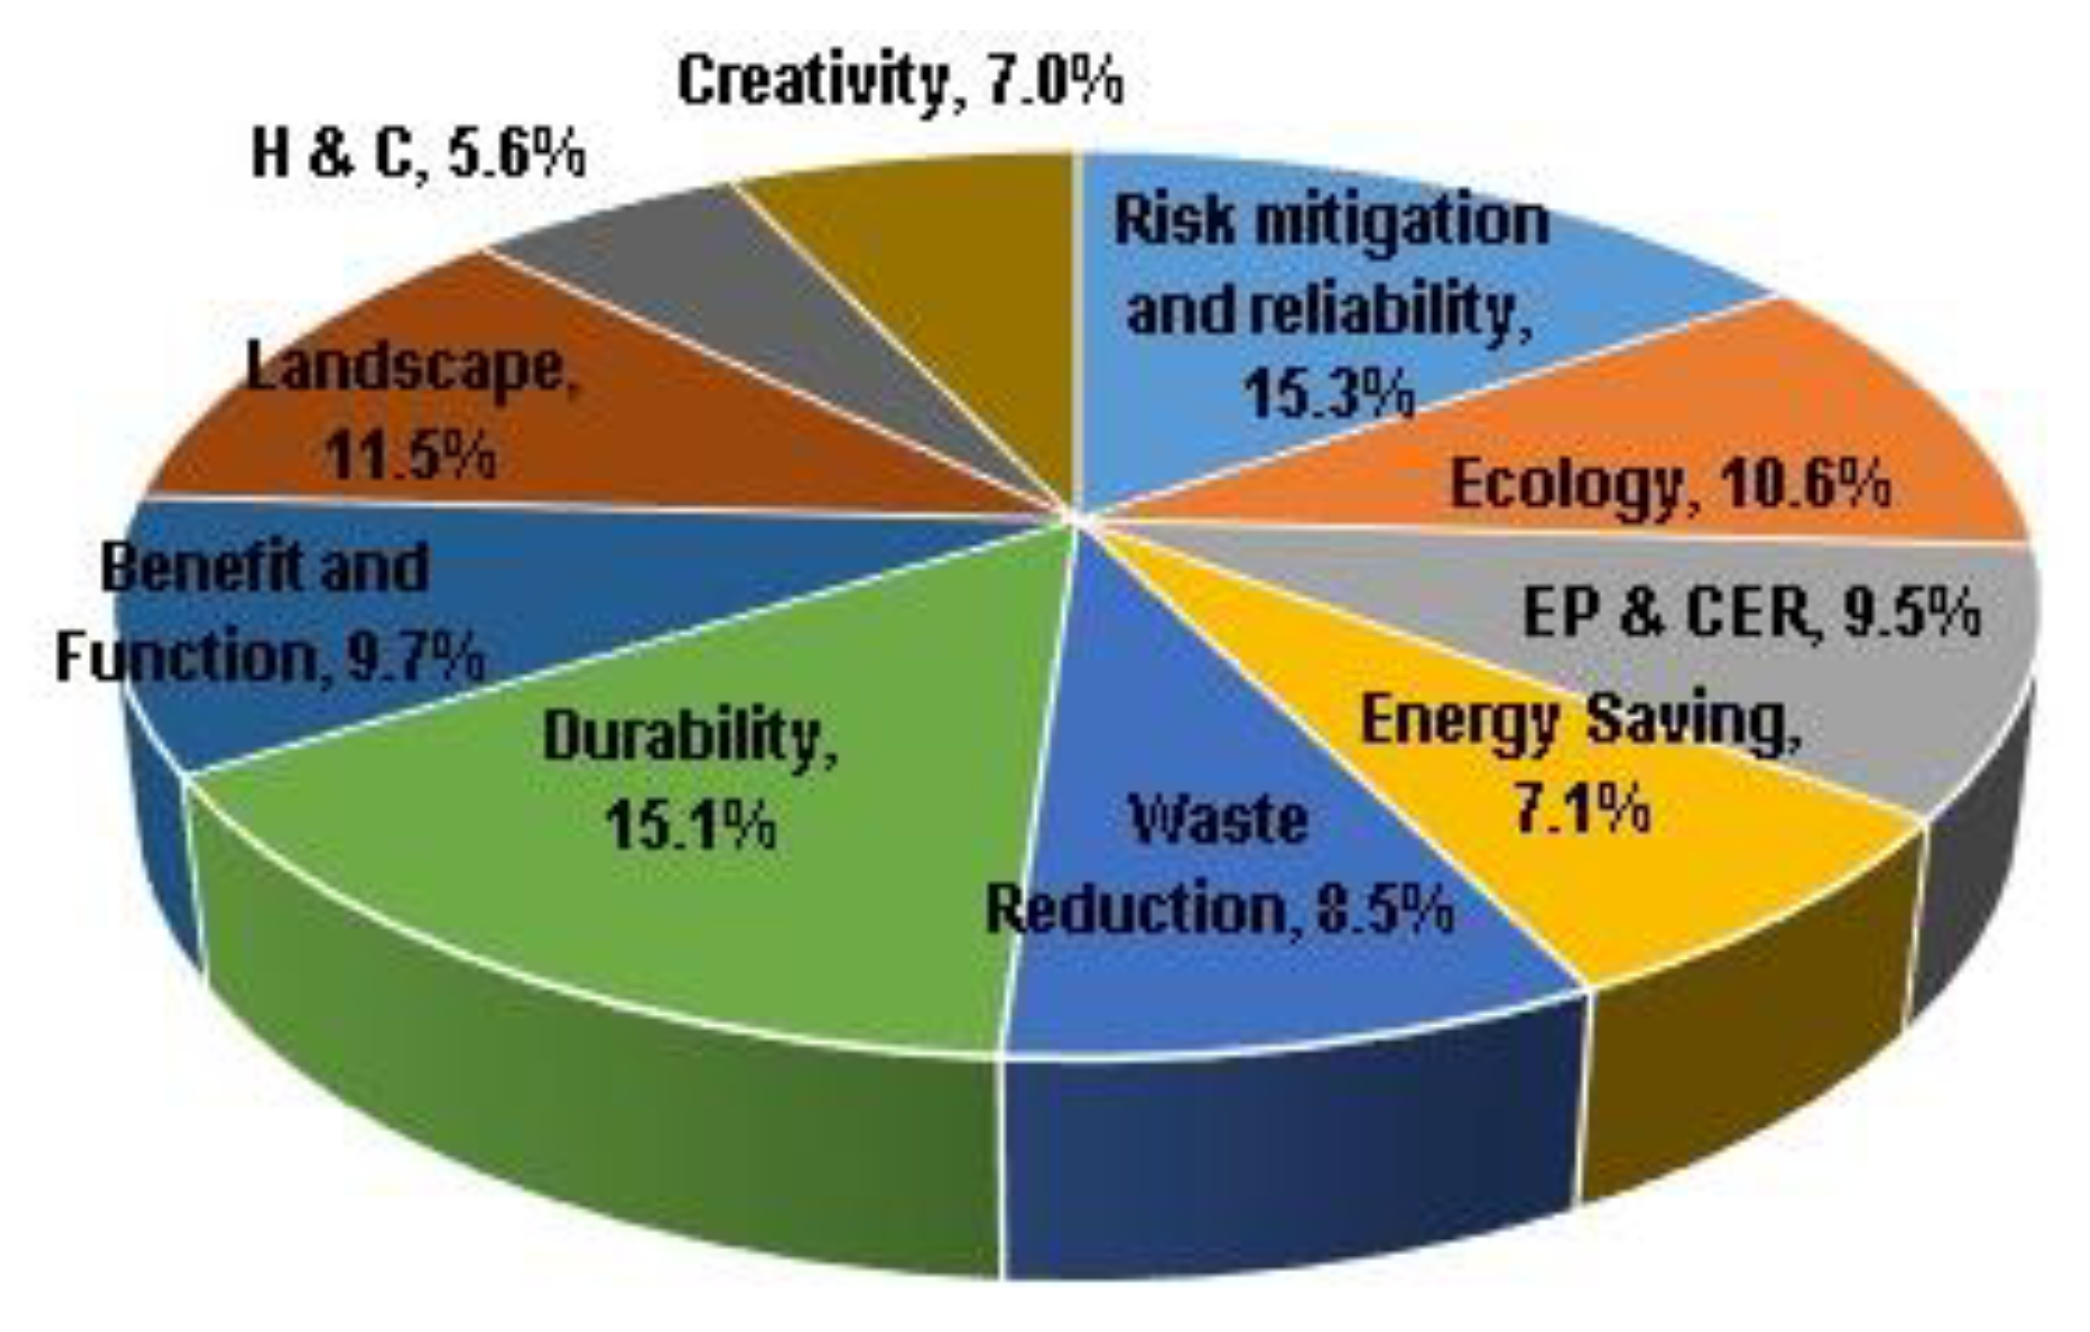
Figure 11.
Relative weights for bridges are determined by different groups of experts.
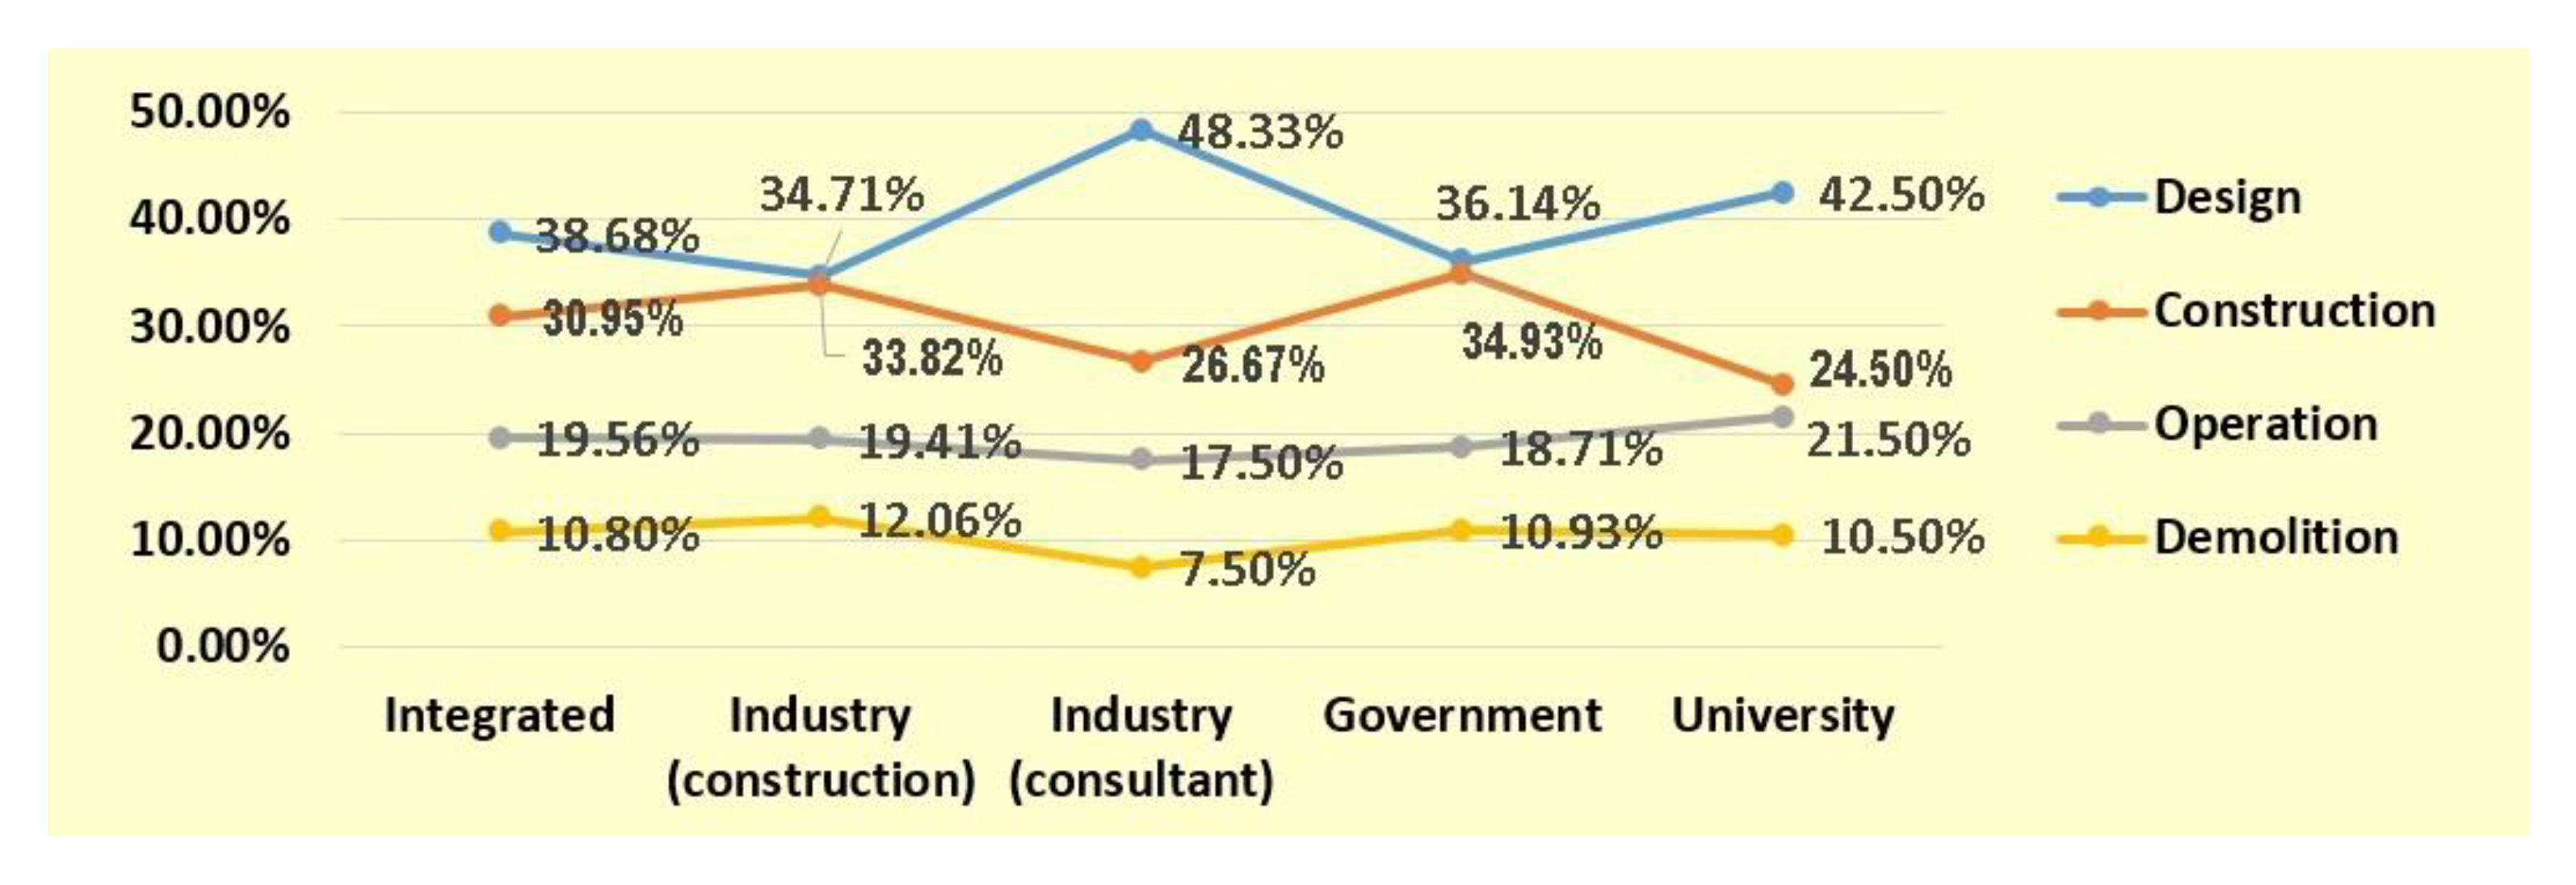
Figure 12.
Charts of weights by different groups of experts’ interview for bridges.
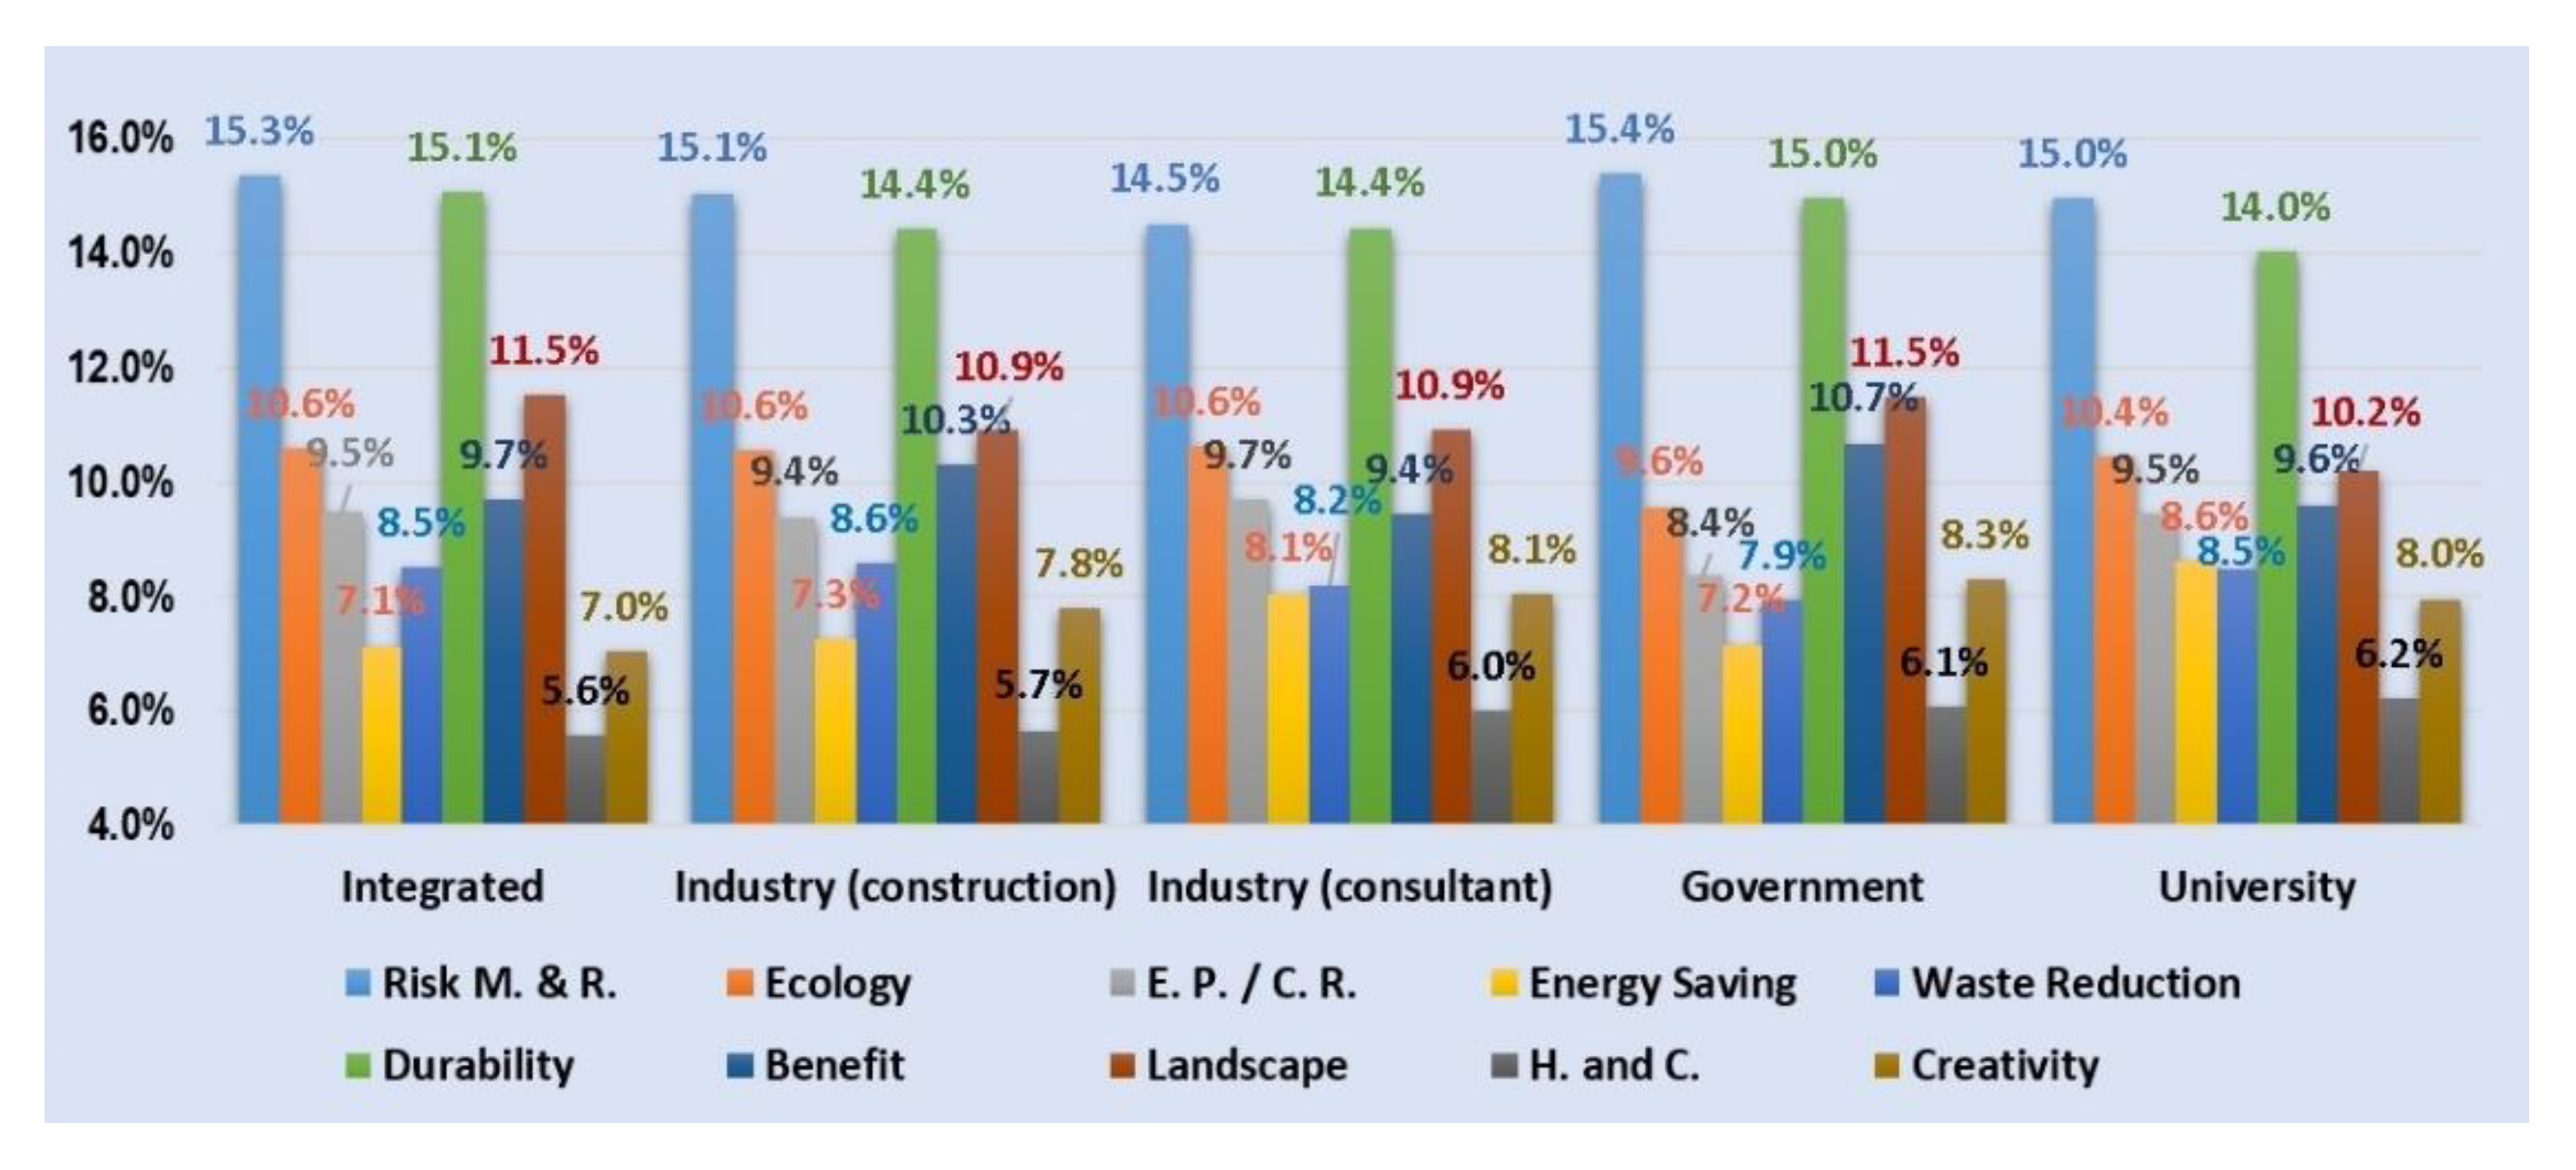
Figure 13.
Example of the scoring sheet (ecology).
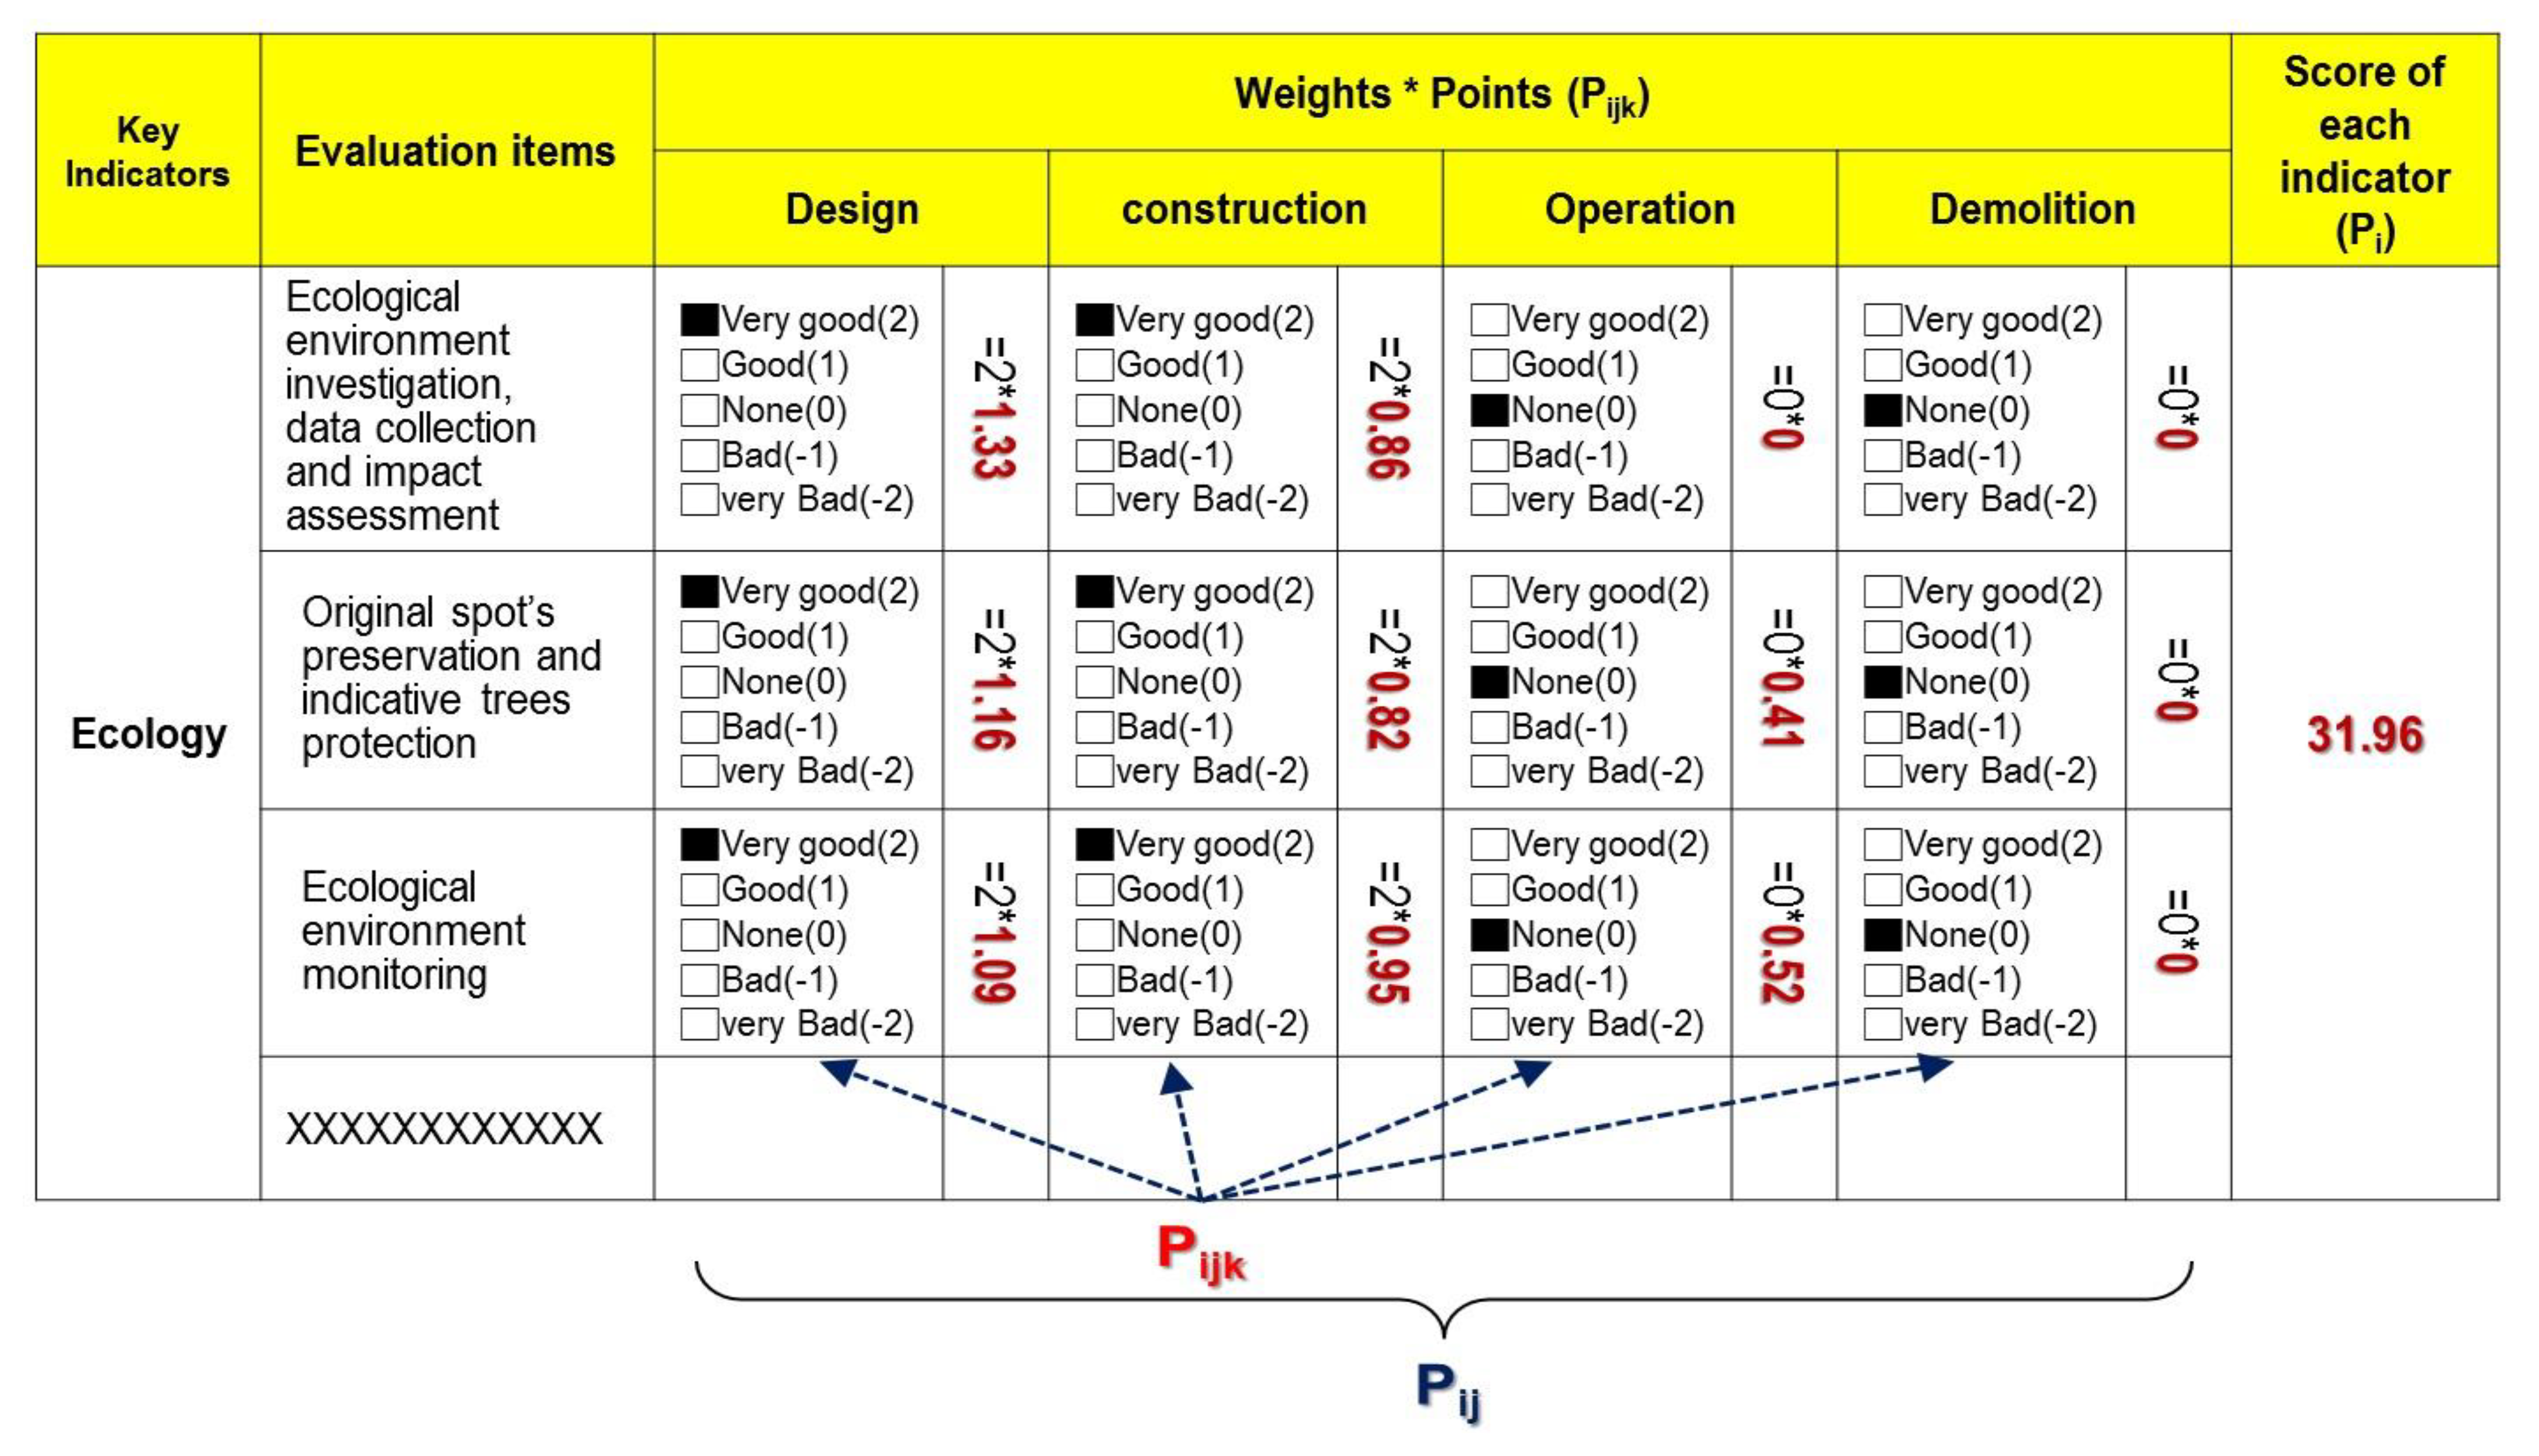
Figure 14.
Photos of the Baimi Scenic Bridge (BSB) [19].
Figure 14.
Photos of the Baimi Scenic Bridge (BSB) [19].

Table 1.
Evaluation items for ten key indicators [19].
Table 1.
Evaluation items for ten key indicators [19].
| Key Indicators | Evaluation Items |
|---|---|
| Risk Mitigation and Reliability |
|
| Ecology |
|
| Environmental Protection and Carbon Emissions Reduction(ER and CER) |
|
| Energy Saving |
|
| Waste Reduction |
|
| Durability |
|
| Benefit and function |
|
| Landscape |
|
| Humanities and Culture Preservation (H and C) |
|
| Creativity |
|
Table 2.
Weight of importance of the four stages for bridges.
| Equation | Design | Construction | Operation | Demolition |
|---|---|---|---|---|
| Rk = (1/n) × ∑ Rak | 38.68% | 30.95% | 19.56% | 10.80% |
Table 3.
Number of nk for four stages of each evaluation items of the “ecology” indicator.
| Evaluation Items | Stages | n4 | n3 | n2 | n1 | n0 | Mean |
|---|---|---|---|---|---|---|---|
| Ecological environment investigation, data collection, and impact assessment | Design | 28 | 13 | 4 | 2 | 0 | 3.4 |
| Construction | 15 | 15 | 8 | 9 | 0 | 2.8 | |
| Operation | |||||||
| Demolition | |||||||
| Site preservation and indicative trees protection | Design | 17 | 19 | 5 | 6 | 0 | 3.0 |
| Construction | 10 | 20 | 11 | 3 | 3 | 2.7 | |
| Operation | 6 | 12 | 15 | 9 | 5 | 2.1 | |
| Demolition | |||||||
| Ecological environment monitoring | Design | 15 | 16 | 10 | 4 | 2 | 2.8 |
| Construction | 18 | 19 | 5 | 5 | 0 | 3.1 | |
| Operation | 14 | 15 | 9 | 6 | 3 | 2.7 | |
| Demolition | |||||||
| Selection of low impact construction methods and preservation of biodiversity and animal habitat integrity. Establishment of safety facilities for animals | Design | 27 | 11 | 7 | 2 | 0 | 3.3 |
| Construction | 26 | 16 | 3 | 6 | 0 | 3.4 | |
| Operation | 13 | 11 | 15 | 6 | 2 | 2.6 | |
| Demolition |
Table 4.
Calculation results of the four stages for all evaluation items of the “ecology” indicator.
Table 4.
Calculation results of the four stages for all evaluation items of the “ecology” indicator.
| Evaluation Items | Stages | Mean | Top Two Ratio | W2jk |
|---|---|---|---|---|
| Ecological environment investigation, data collection, and impact assessment | Design | 3.4 | 87.23% | 1.16 |
| Construction | 2.8 | 63.83% | 0.55 | |
| Operation | ||||
| Demolition | ||||
| Site preservation and indicative trees protection | Design | 3.0 | 76.60% | 0.89 |
| Construction | 2.7 | 63.83% | 0.53 | |
| Operation | 2.1 | 38.30% | 0.16 | |
| Demolition | ||||
| Ecological environment monitoring | Design | 2.8 | 65.96% | 0.72 |
| Construction | 3.1 | 78.72% | 0.75 | |
| Operation | 2.7 | 61.70% | 0.32 | |
| Demolition | ||||
| Selection of low impact construction methods and preservation of biodiversity and animal habitat integrity. Establishment of safety facilities for animals | Design | 3.3 | 80.85% | 1.04 |
| Construction | 3.4 | 89.36% | 0.94 | |
| Operation | 2.6 | 51.06% | 0.26 | |
| Demolition |
Table 5.
Calculation results for weights Wij and its mean of summary Si of the second level for the “ecology” indicator.
Table 5.
Calculation results for weights Wij and its mean of summary Si of the second level for the “ecology” indicator.
| Evaluation Items | Stages | W2jk | W2j | S2 |
|---|---|---|---|---|
| Ecological environment investigation, data collection, and impact assessment | Design | 1.16 | 0.85 | 0.679 |
| Construction | 0.55 | |||
| Operation | ||||
| Demolition | ||||
| Site preservation and indicative trees protection | Design | 0.89 | 0.52 | |
| Construction | 0.53 | |||
| Operation | 0.16 | |||
| Demolition | ||||
| Ecological environment monitoring | Design | 0.72 | 0.59 | |
| Construction | 0.75 | |||
| Operation | 0.32 | |||
| Demolition | ||||
| Selection of low impact construction methods and preservation of biodiversity and animal habitat integrity. Establishment of safety facilities for animals | Design | 1.04 | 0.75 | |
| Construction | 0.94 | |||
| Operation | 0.26 | |||
| Demolition |
Table 6.
Weights Wij and the mean of summary Si of the second level for all sustainability key indicators.
Table 6.
Weights Wij and the mean of summary Si of the second level for all sustainability key indicators.
| Sustainability Key Indicators | Evaluation Items | Wij | Si |
|---|---|---|---|
| Risk Mitigation and Reliability | Providing large enough safety factor in the design | 1.36 | 0.985 |
| Considering a second disaster prevention mechanism for the life cycle of the facility | 0.75 | ||
| External review/approval mechanism for design results | 0.79 | ||
| Avoiding geologically sensitive areas | 1.27 | ||
| Design and construction documents approved by certified professional engineers | 1.14 | ||
| Establishment of risk mitigation mechanism | 0.81 | ||
| Minimization of the interference to the flooding and disaster protection | 0.83 | ||
| Establishment of feasible operations management system to ensure user safety | 0.92 | ||
| Periodical disaster prevention drill in the life cycle | |||
| Ecology | Ecological environment investigation, data collection, and impact assessment | 0.85 | 0.679 |
| Site preservation and indicative trees protection | 0.52 | ||
| Ecological environment monitoring | 0.59 | ||
| Selection of low impact construction methods and preservation of biodiversity and animal habitat integrity. Establishment of safety facilities for animals | 0.75 | ||
| Environmental Protection and Carbon Emissions Reduction | Environmental impact assessment | 0.58 | 0.608 |
| Monitoring of carbon emission in the life cycle | 0.48 | ||
| Selection of low carbon emission materials | 0.73 | ||
| Construction methods and procedures with low air pollution Reduce the carbon emission in the life cycle and select the construction methods with low-carbon emissions | 0.61 | ||
| Adoption of permeable pavement to preserve water | 0.64 | ||
| Energy Saving | Adoption of green energy (e.g., solar energy, wind energy) | 0.23 | 0.458 |
| Selection of energy-saving materials and construction methods | 0.50 | ||
| Use of local materials to save energy and to reduce carbon emission | 0.60 | ||
| Use of energy-saving machinery to reduce energy consumption | 0.45 | ||
| Design and selection of energy-saving electrical and mechanical equipment | 0.47 | ||
| Periodic maintenance for equipment in the life cycle | 0.50 | ||
| Waste Reduction | Use of recyclable and environmentally friendly materials | 0.53 | 0.546 |
| Adoption of waste reduction construction methods (e.g., precast, modularization) | 0.74 | ||
| Use of industrial or construction by-product (e.g., fly ash, ground-granulated blast-furnace slag, reservoir silt) | 0.80 | ||
| Water resource recycling | 0.07 | ||
| Adoption of the public soil exchange mechanism | 0.54 | ||
| Balance of cut and fill at the same site | 0.59 | ||
| Durability | Durable structure design. | 1.01 | 0.968 |
| Use of durable materials. | 0.95 | ||
| Establishment of quality assurance measures to increase the life expectancy of the structures | 0.88 | ||
| Adoption of design that facilitates easy maintenance. | 1.03 | ||
| Benefit and Function | The satisfaction of the design function | 0.81 | 0.623 |
| Boost of the local economy and increase of the job market | 0.36 | ||
| Enhancement of the design/construction/operation quality and ability | 0.68 | ||
| Shortening of construction duration to maximize the benefit | 0.77 | ||
| Cost down in the life cycle | 0.48 | ||
| Landscape | Consideration of local culture in the structure design | 0.65 | 0.740 |
| Beautification of structure and landscape. Design of structure for landscape fusion | 0.83 | ||
| Humanities and Culture Preservation | Provision of participation and communication to the public | 0.31 | 0.358 |
| Safeguarding of social justice and care for minorities | 0.20 | ||
| Protection of historical sites and cultural relics | 0.57 | ||
| Creativity | Introduction of new materials, new construction methods, new technologies, and so on | 0.46 | 0.452 |
| Innovation in engineering project design | 0.44 | ||
| Establishment of incentives mechanism to encourage innovation | 0.52 | ||
| Application of value engineering | 0.39 |
Table 7.
Calculated weights of level 3, level 2, and level 1 for bridges.
| Key Indicators | Evaluation Items | Wijk | Wij | Wi | |||
|---|---|---|---|---|---|---|---|
| Risk Mitigation and Reliability | Item 1 | 1.36 | 1.36 | 15.3% | |||
| Item 2 | 1.25 | 0.55 | 0.47 | 0.75 | |||
| Item 3 | 0.79 | 0.79 | |||||
| Item 4 | 1.27 | 1.27 | |||||
| Item 5 | 1.33 | 0.96 | 1.14 | ||||
| Item 6 | 1.11 | 1.08 | 0.23 | 0.81 | |||
| Item 7 | 1.29 | 0.99 | 0.19 | 0.83 | |||
| Item 8 | 1.20 | 0.65 | 0.92 | ||||
| Item 9 | |||||||
| Ecology | Item 1 | 1.16 | 0.55 | 0.85 | 10.6% | ||
| Item 2 | 0.89 | 0.53 | 0.16 | 0.52 | |||
| Item 3 | 0.72 | 0.75 | 0.32 | 0.59 | |||
| Item 4 | 1.04 | 0.94 | 0.26 | 0.75 | |||
| Environmental Protection and Carbon Emissions Reduction (EP and CER) | Item 1 | 1.28 | 0.61 | 0.28 | 0.17 | 0.58 | 9.5% |
| Item 2 | 0.72 | 0.72 | 0.36 | 0.12 | 0.48 | ||
| Item 3 | 1.21 | 0.65 | 0.33 | 0.73 | |||
| Item 4 | 1.10 | 0.96 | 0.19 | 0.18 | 0.61 | ||
| Item 5 | 0.95 | 0.69 | 0.28 | 0.64 | |||
| Energy Saving | Item 1 | 0.26 | 0.17 | 0.27 | 0.23 | 7.1% | |
| Item 2 | 0.97 | 0.30 | 0.22 | 0.50 | |||
| Item 3 | 0.60 | 0.00 | 0.60 | ||||
| Item 4 | 0.68 | 0.21 | 0.45 | ||||
| Item 5 | 0.68 | 0.32 | 0.40 | 0.47 | |||
| Item 6 | 0.69 | 0.32 | 0.49 | 0.50 | |||
| Waste Reduction | Item 1 | 0.87 | 0.43 | 0.29 | 0.53 | 8.5% | |
| Item 2 | 1.21 | 0.91 | 0.12 | 0.74 | |||
| Item 3 | 0.93 | 0.66 | 0.80 | ||||
| Item 4 | 0.07 | 0.07 | |||||
| Item 5 | 0.80 | 0.67 | 0.15 | 0.54 | |||
| Item 6 | 0.98 | 0.71 | 0.10 | 0.59 | |||
| Durability | Item 1 | 1.51 | 0.51 | 1.01 | 15.1% | ||
| Item 2 | 1.43 | 0.84 | 0.57 | 0.95 | |||
| Item 3 | 1.06 | 0.98 | 0.60 | 0.88 | |||
| Item 4 | 1.41 | 0.66 | 1.03 | ||||
| Benefit and Function | Item 1 | 1.11 | 0.52 | 0.81 | 9.7% | ||
| Item 2 | 0.57 | 0.45 | 0.06 | 0.36 | |||
| Item 3 | 1.02 | 0.65 | 0.37 | 0.68 | |||
| Item 4 | 0.85 | 0.70 | 0.77 | ||||
| Item 5 | 0.94 | 0.41 | 0.10 | 0.48 | |||
| Landscape | Item 1 | 1.23 | 0.44 | 0.30 | 0.65 | 11.5% | |
| Item 2 | 1.43 | 0.71 | 0.33 | 0.83 | |||
| Humanities and Culture (H and C) | Item 3 | 0.61 | 0.31 | 0.23 | 0.08 | 0.31 | 5.6% |
| Item 4 | 0.33 | 0.19 | 0.07 | 0.20 | |||
| Item 5 | 0.83 | 0.58 | 0.30 | 0.57 | |||
| Creativity | Item 1 | 0.82 | 0.50 | 0.06 | 0.46 | 7.0% | |
| Item 2 | 0.80 | 0.43 | 0.08 | 0.44 | |||
| Item 3 | 0.84 | 0.62 | 0.12 | 0.52 | |||
| Item 4 | 0.64 | 0.13 | 0.39 | ||||
Table 8.
Sustainability evaluation sheet for Baimi Scenic Bridge (BSB).
| Design | Construction | Operation | Demolition | |
|---|---|---|---|---|
| Risk Mitigation and Reliability | ||||
| Providing large enough safety factor in the design | 2 | N/A | N/A | N/A |
| Considering a second disaster prevention mechanism for the life cycle of the facility | 0 | 0 | 0 | N/A |
| External review/approval mechanism for design results | 0 | N/A | N/A | N/A |
| Avoiding geologically sensitive areas | 0 | 0 | 0 | N/A |
| Design and construction documents approved by certified professional engineers | 2 | 2 | N/A | N/A |
| Establishment of risk mitigation mechanism | 2 | 2 | N/A | 0 |
| Minimization of the interference to the flooding and disaster protection | 2 | 2 | 2 | N/A |
| Establishment of feasible operations management system to ensure user safety | 2 | N/A | 2 | N/A |
| Periodical disaster prevention drill in the life cycle | 0 | 0 | 2 | N/A |
| Ecology | ||||
| Ecological environment investigation, data collection, and impact assessment | 2 | 2 | N/A | N/A |
| Site preservation and indicative trees protection | 2 | 2 | 0 | N/A |
| Ecological environment monitoring | 2 | 2 | 0 | N/A |
| Selection of low impact construction methods and preservation of biodiversity and animal habitat integrity. Establishment of safety facilities for animals | 2 | 2 | 2 | N/A |
| Environmental Protection and Carbon Emissions Reduction (ER and CER) | ||||
| Environmental impact assessment | 2 | 2 | 0 | 0 |
| Monitoring of carbon emission in the life cycle | 2 | 2 | 1 | 0 |
| Selection of low carbon emission materials | 2 | 0 | 1 | N/A |
| Construction methods and procedures with low air pollution. Reduce the carbon emission in the life cycle and select the construction methods with low-carbon emissions | 2 | 2 | 0 | 0 |
| Adoption of permeable pavement to preserve water | 1 | 1 | 1 | N/A |
| Energy Saving | ||||
| Adoption of green energy (e.g., solar energy, wind energy) | 0 | 0 | 0 | N/A |
| Selection of energy-saving materials and construction methods | 2 | 2 | 0 | N/A |
| Use of local materials to save energy and to reduce carbon emission | 2 | 2 | 0 | N/A |
| Use of energy-saving machinery to reduce energy consumption | N/A | 2 | N/A | 0 |
| Design and selection of energy-saving electrical and mechanical equipment | 1 | 1 | 2 | N/A |
| Periodic maintenance for equipment in the life cycle | 1 | 2 | 2 | 0 |
| Waste Reduction | ||||
| Use of recyclable and environmentally friendly materials | 2 | 2 | 2 | N/A |
| Adoption of waste reduction construction methods (e.g., precast, modularization) | 0 | 1 | N/A | 0 |
| Use of industrial or construction by-product (e.g., fly ash, ground-granulated blast-furnace slag, reservoir silt) | 2 | 2 | N/A | N/A |
| Water resource recycling | 0 | 1 | 0 | 0 |
| Adoption of the public soil exchange mechanism | 2 | 2 | N/A | 0 |
| Balance of cut and fill at the same site | 2 | 2 | N/A | 0 |
| Durability | ||||
| Durable structure design | 2 | N/A | 2 | N/A |
| Use of durable materials | 2 | 1 | 2 | N/A |
| Establishment of quality assurance measures to increase the life expectancy of the structures | 2 | 2 | 2 | N/A |
| Adoption of design that facilitates easy maintenance | 2 | N/A | 2 | N/A |
| Benefit and Function | ||||
| The satisfaction of the design function | 2 | N/A | 2 | N/A |
| Boost of the local economy and increase of the job market | 2 | 2 | 0 | 0 |
| Enhancement of the design/construction/operation quality and ability | 2 | 2 | 1 | N/A |
| Shortening of construction duration to maximize the benefit | 2 | 2 | N/A | N/A |
| Cost down in the life cycle | 2 | 2 | 1 | 0 |
| Landscape | ||||
| Consideration of local culture in the structure design | 2 | 2 | 2 | N/A |
| Beautification of structure and landscape. Design of structure for landscape fusion | 2 | 2 | 2 | N/A |
| Humanities and Culture Preservation (H and C) | ||||
| Provision of participation and communication to the public | 0 | 2 | 1 | 0 |
| Safeguarding of social justice and care for minorities | 1 | 1 | 2 | 0 |
| Protection of historical sites and cultural relics | 2 | 2 | 0 | N/A |
| Creativity | ||||
| Introduction of new materials, new construction methods, new technologies, and so on | 2 | 2 | 0 | 0 |
| Innovation in engineering project design | 2 | 1 | N/A | 0 |
| Establishment of incentives mechanism to encourage innovation | 1 | 1 | 0 | 0 |
| Application of value engineering | 0 | 0 | N/A | N/A |
Table 9.
Wijk for the “ecology” indicator of BSB.
| Ecology | Design | Construction | Operation | Demolition |
|---|---|---|---|---|
| Ecological environment investigation, data collection, and impact assessment | 1.16 | 0.55 | ||
| Site preservation and indicative trees protection | 0.89 | 0.53 | 0.16 | |
| Ecological environment monitoring | 0.72 | 0.75 | 0.32 | |
| Selection of low impact construction methods and preservation of biodiversity and animal habitat integrity. Establishment of safety facilities for animals | 1.04 | 0.94 | 0.26 |
Table 10.
Evaluation results for the BSB. AF, adjust factor; FS, final score.
| Key Indicators | Evaluation Items | Pijk × Wijk | Pi | AF | FS | |||
|---|---|---|---|---|---|---|---|---|
| Risk mitigation and reliability | Item 1 | 2.73 | 3.12 | 6.192 | 84.50 | |||
| Item 2 | 0.00 | 0.00 | 0.00 | |||||
| Item 3 | 0.00 | |||||||
| Item 4 | 0.00 | 0.00 | 0.00 | |||||
| Item 5 | 2.65 | 1.92 | ||||||
| Item 6 | 2.23 | 2.17 | ||||||
| Item 7 | 2.59 | 1.99 | 0.39 | |||||
| Item 8 | 2.39 | 1.29 | ||||||
| Item 9 | 0.00 | 0.00 | ||||||
| Ecology | Item 1 | 2.31 | 1.09 | 1.44 | ||||
| Item 2 | 1.78 | 1.05 | 0.00 | |||||
| Item 3 | 1.43 | 1.49 | 0.00 | |||||
| Item 4 | 2.09 | 1.88 | 0.51 | |||||
| Environmental Protection and Carbon Emissions Reduction | Item 1 | 2.56 | 1.23 | 0.00 | 0.00 | 1.43 | ||
| Item 2 | 1.44 | 1.43 | 0.36 | 0.00 | ||||
| Item 3 | 2.41 | 0.00 | 0.33 | |||||
| Item 4 | 2.20 | 1.92 | 0.00 | 0.00 | ||||
| Item 5 | 0.95 | 0.00 | 0.28 | |||||
| Energy Saving | Item 1 | 0.00 | 0.00 | 0.00 | 0.64 | |||
| Item 2 | 1.94 | 0.61 | 0.00 | |||||
| Item 3 | 0.00 | 1.20 | 0.00 | |||||
| Item 4 | 1.37 | 0.00 | ||||||
| Item 5 | 0.68 | 0.00 | 0.80 | |||||
| Item 6 | 0.69 | 0.63 | 0.99 | 0.00 | ||||
| Waste Reduction | Item 1 | 1.74 | 0.85 | 0.58 | 1.15 | |||
| Item 2 | 0.00 | 0.91 | 0.00 | |||||
| Item 3 | 1.86 | 1.32 | ||||||
| Item 4 | 0.00 | 0.00 | 0.00 | 0.00 | ||||
| Item 5 | 1.59 | 1.34 | 0.00 | |||||
| Item 6 | 1.96 | 1.41 | 0.00 | |||||
| Durability | Item 1 | 3.03 | 1.02 | 2.76 | ||||
| Item 2 | 2.87 | 0.84 | 1.14 | |||||
| Item 3 | 2.13 | 1.95 | 1.20 | |||||
| Item 4 | 2.82 | 1.32 | ||||||
| Benefit and Function | Item 1 | 2.21 | 1.04 | 1.40 | ||||
| Item 2 | 1.14 | 0.90 | 0.00 | 0.00 | ||||
| Item 3 | 2.03 | 1.31 | 0.37 | |||||
| Item 4 | 1.70 | 1.39 | ||||||
| Item 5 | 1.88 | 0.00 | 0.41 | 0.00 | ||||
| Landscape | Item 1 | 2.46 | 0.87 | 0.60 | 1.02 | |||
| Item 2 | 2.87 | 1.42 | 0.67 | |||||
| Humanities and Culture | Item 1 | 0.00 | 0.62 | 0.23 | 0.00 | 0.24 | ||
| Item 2 | 0.33 | 0.00 | 0.37 | 0.00 | ||||
| Item 3 | 1.66 | 1.16 | 0.00 | |||||
| Creativity | Item 1 | 1.65 | 0.99 | 0.00 | 0.00 | 0.43 | ||
| Item 2 | 1.60 | 0.43 | 0.00 | |||||
| Item 3 | 0.84 | 0.62 | 0.00 | 0.00 | ||||
| Item 4 | 0.00 | 0.00 | 0.00 | 0.00 | ||||
Publisher’s Note: MDPI stays neutral with regard to jurisdictional claims in published maps and institutional affiliations. |
© 2021 by the authors. Licensee MDPI, Basel, Switzerland. This article is an open access article distributed under the terms and conditions of the Creative Commons Attribution (CC BY) license (https://creativecommons.org/licenses/by/4.0/).
Share and Cite
MDPI and ACS Style
Liu, T.-Y.; Liu, G.-T.; Chen, P.-H.; Chou, N.N.S.; Ho, S.-P. Establishment of a Sustainability Assessment System for Bridges. Sustainability 2021, 13, 4795. https://doi.org/10.3390/su13094795
AMA Style
Liu T-Y, Liu G-T, Chen P-H, Chou NNS, Ho S-P. Establishment of a Sustainability Assessment System for Bridges. Sustainability. 2021; 13(9):4795. https://doi.org/10.3390/su13094795
Chicago/Turabian StyleLiu, Tai-Yi, Guan-Ting Liu, Po-Han Chen, Nelson N. S. Chou, and Shih-Ping Ho. 2021. "Establishment of a Sustainability Assessment System for Bridges" Sustainability 13, no. 9: 4795. https://doi.org/10.3390/su13094795
Note that from the first issue of 2016, this journal uses article numbers instead of page numbers. See further details here.