
Impact Assessments of Typhoon Lekima on Forest Damages in Subtropical China Using Machine Learning Methods and Landsat 8 OLI Imagery

 ,
,
Abstract
:1. Introduction
2. Methods
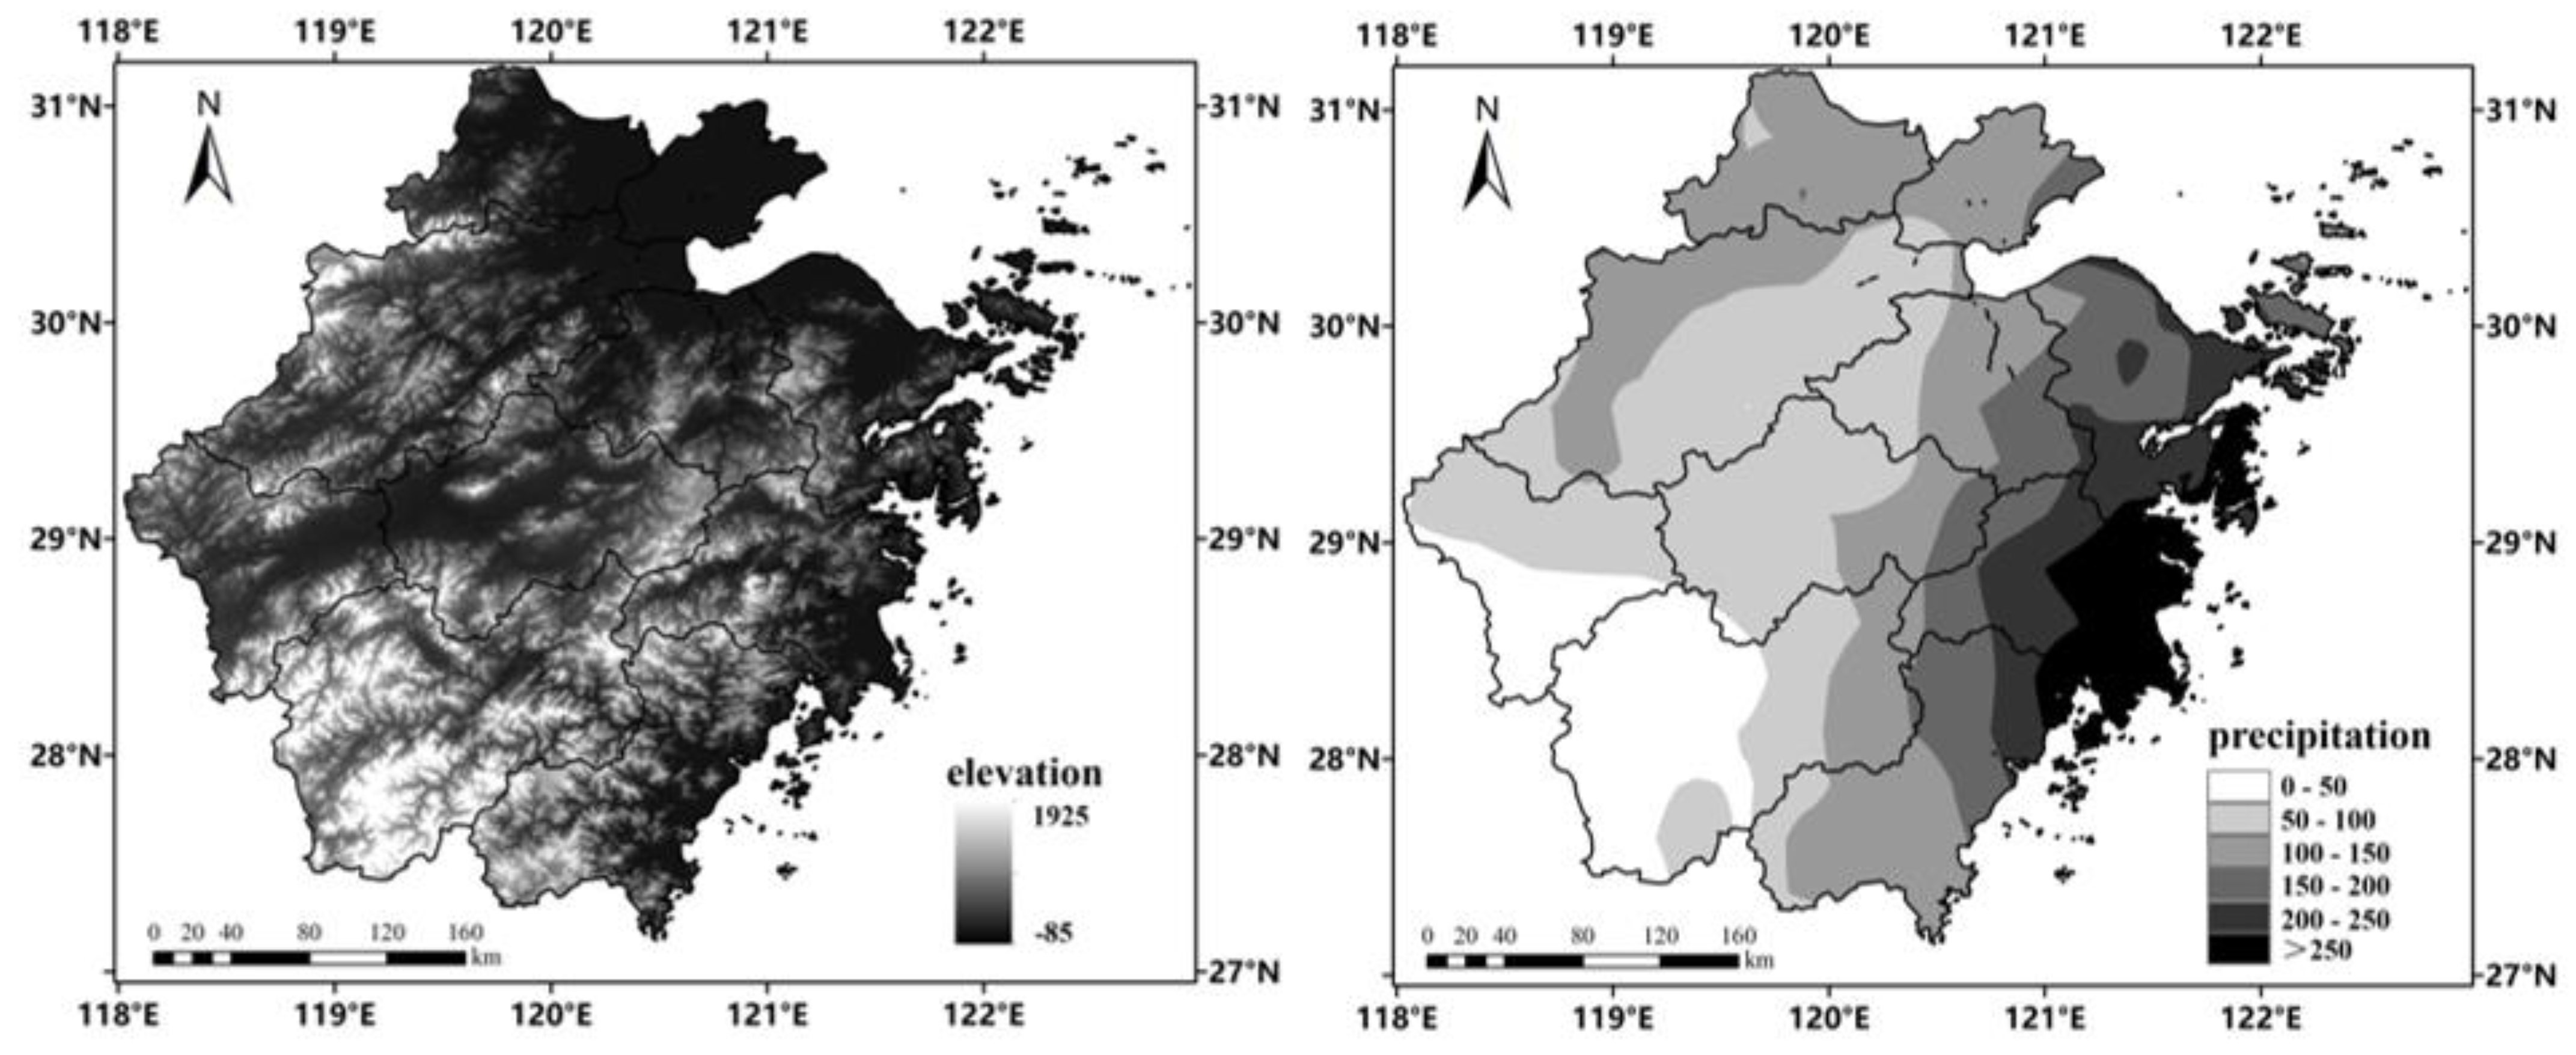
2.1. Study Region
2.2. Typhoon Lekima
2.3. The Work Flows
2.4. Data Sources
2.4.1. Landsat 8 OLI Images
2.4.2. Training and Validation Sample Data
2.4.3. Topographic and Climatic Data
2.5. Mask of Forest Areas
2.6. The Calculations of VIs and Other Input Variables
2.7. Mapping Forest Damage Using Univariate Image Differencing of VIs
2.8. Mapping Affected and Damaged Forest Area Using RF Classifier/Regressor Algorithms
2.9. Accuracy Assessment
3. Results
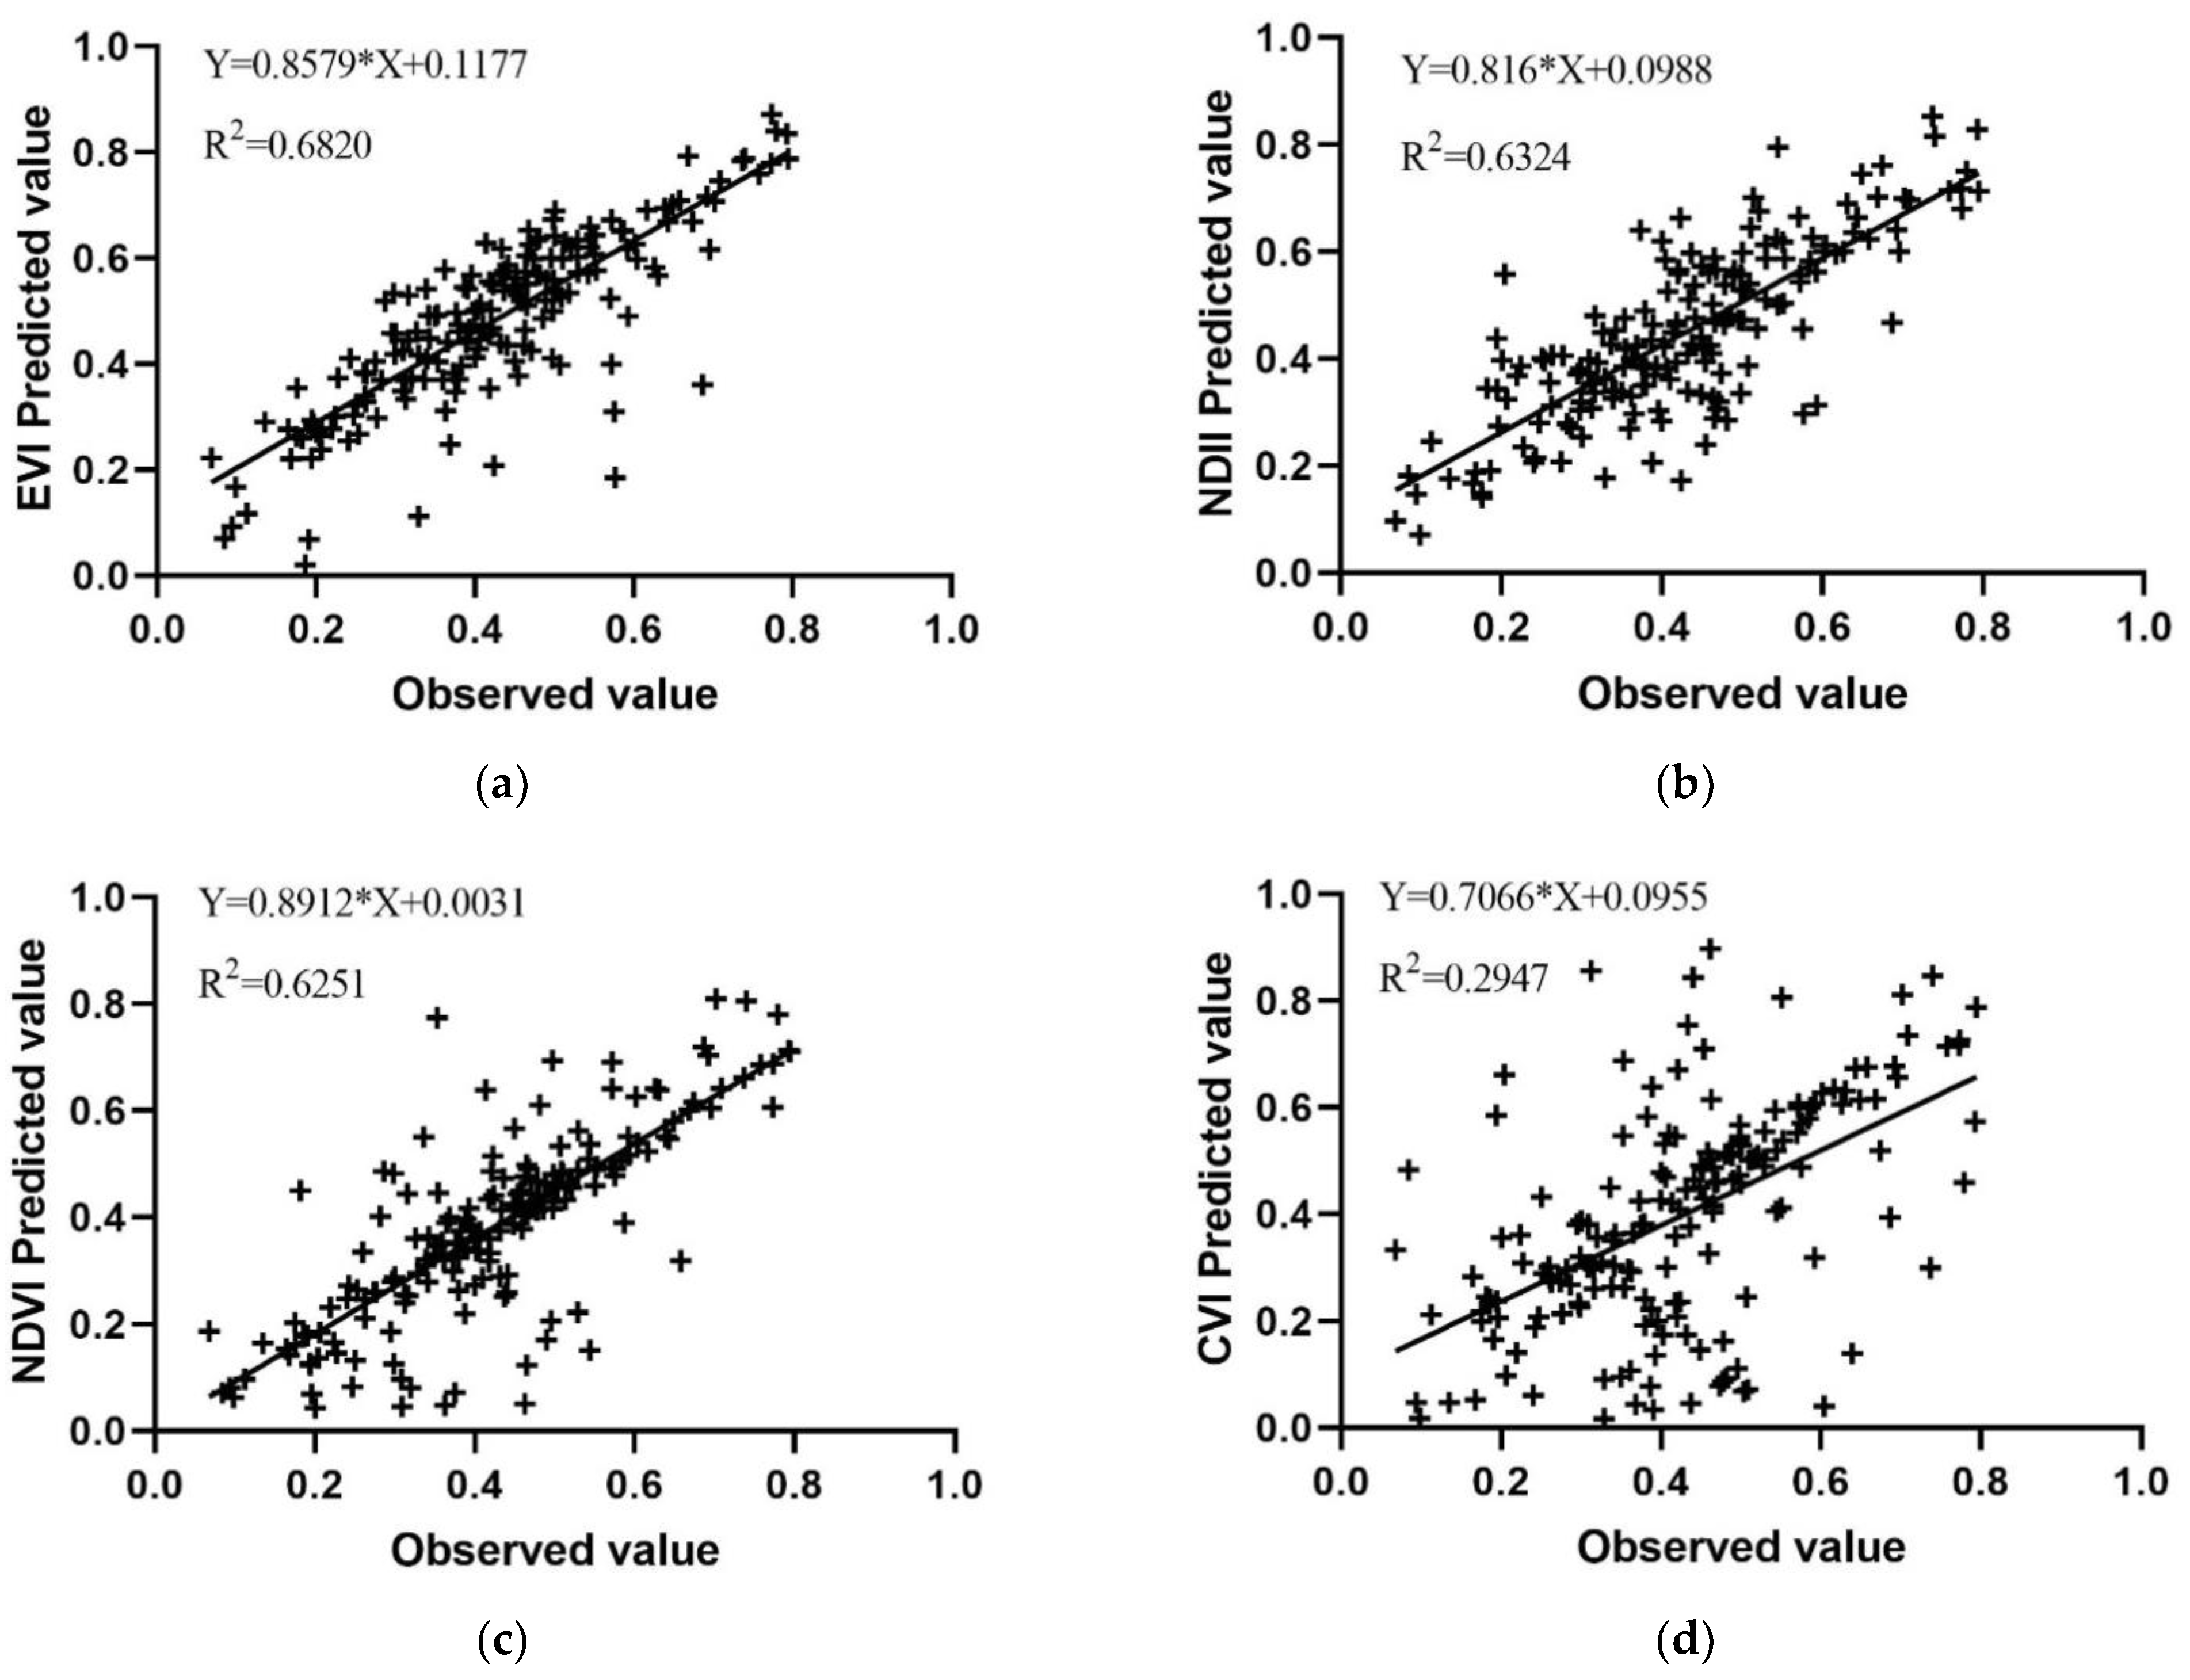
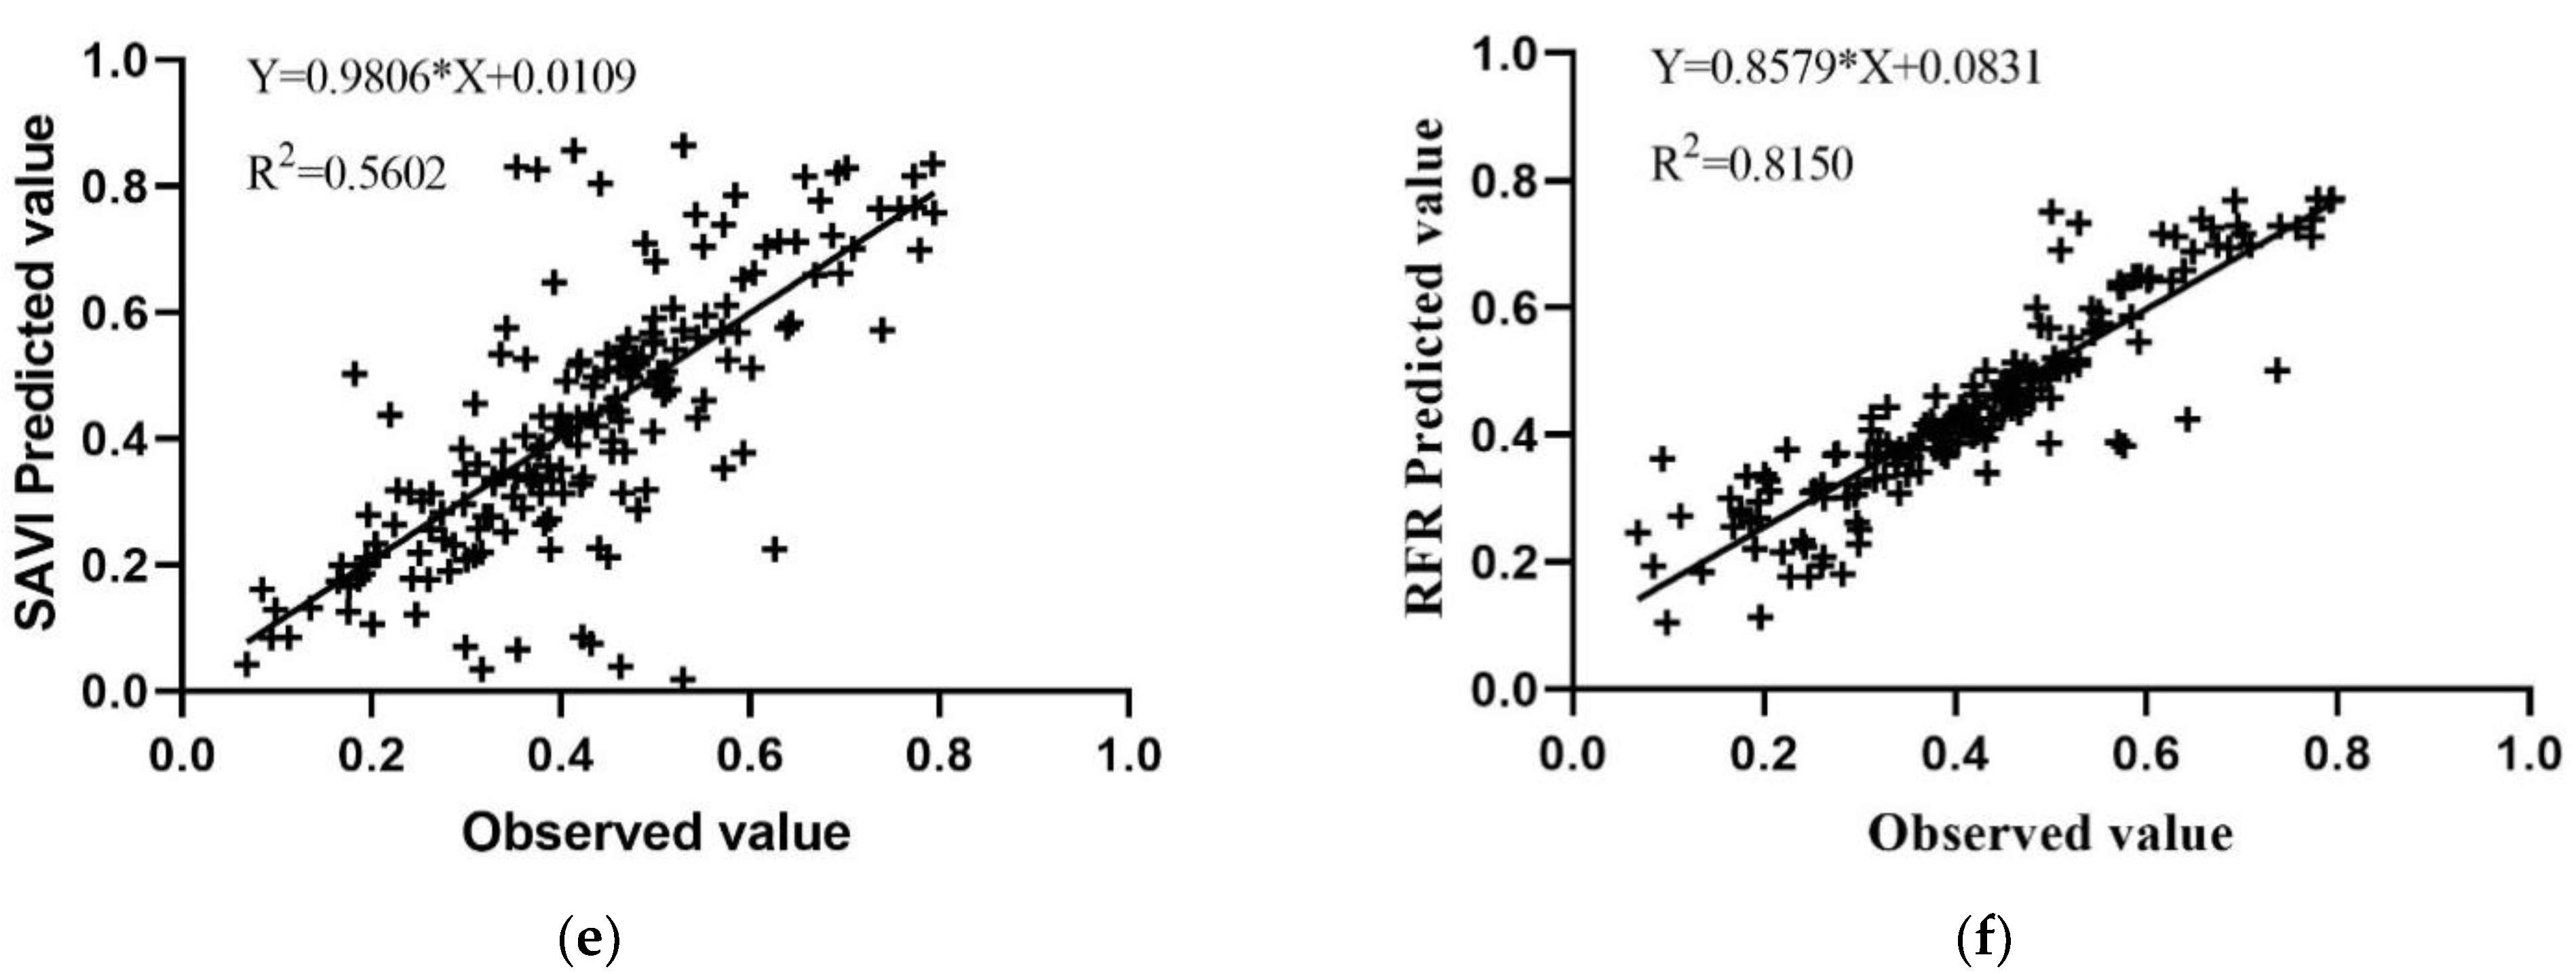
3.1. Accurancy Assessment
3.2. Spatial and Regional Patterns of Affected Forest Area
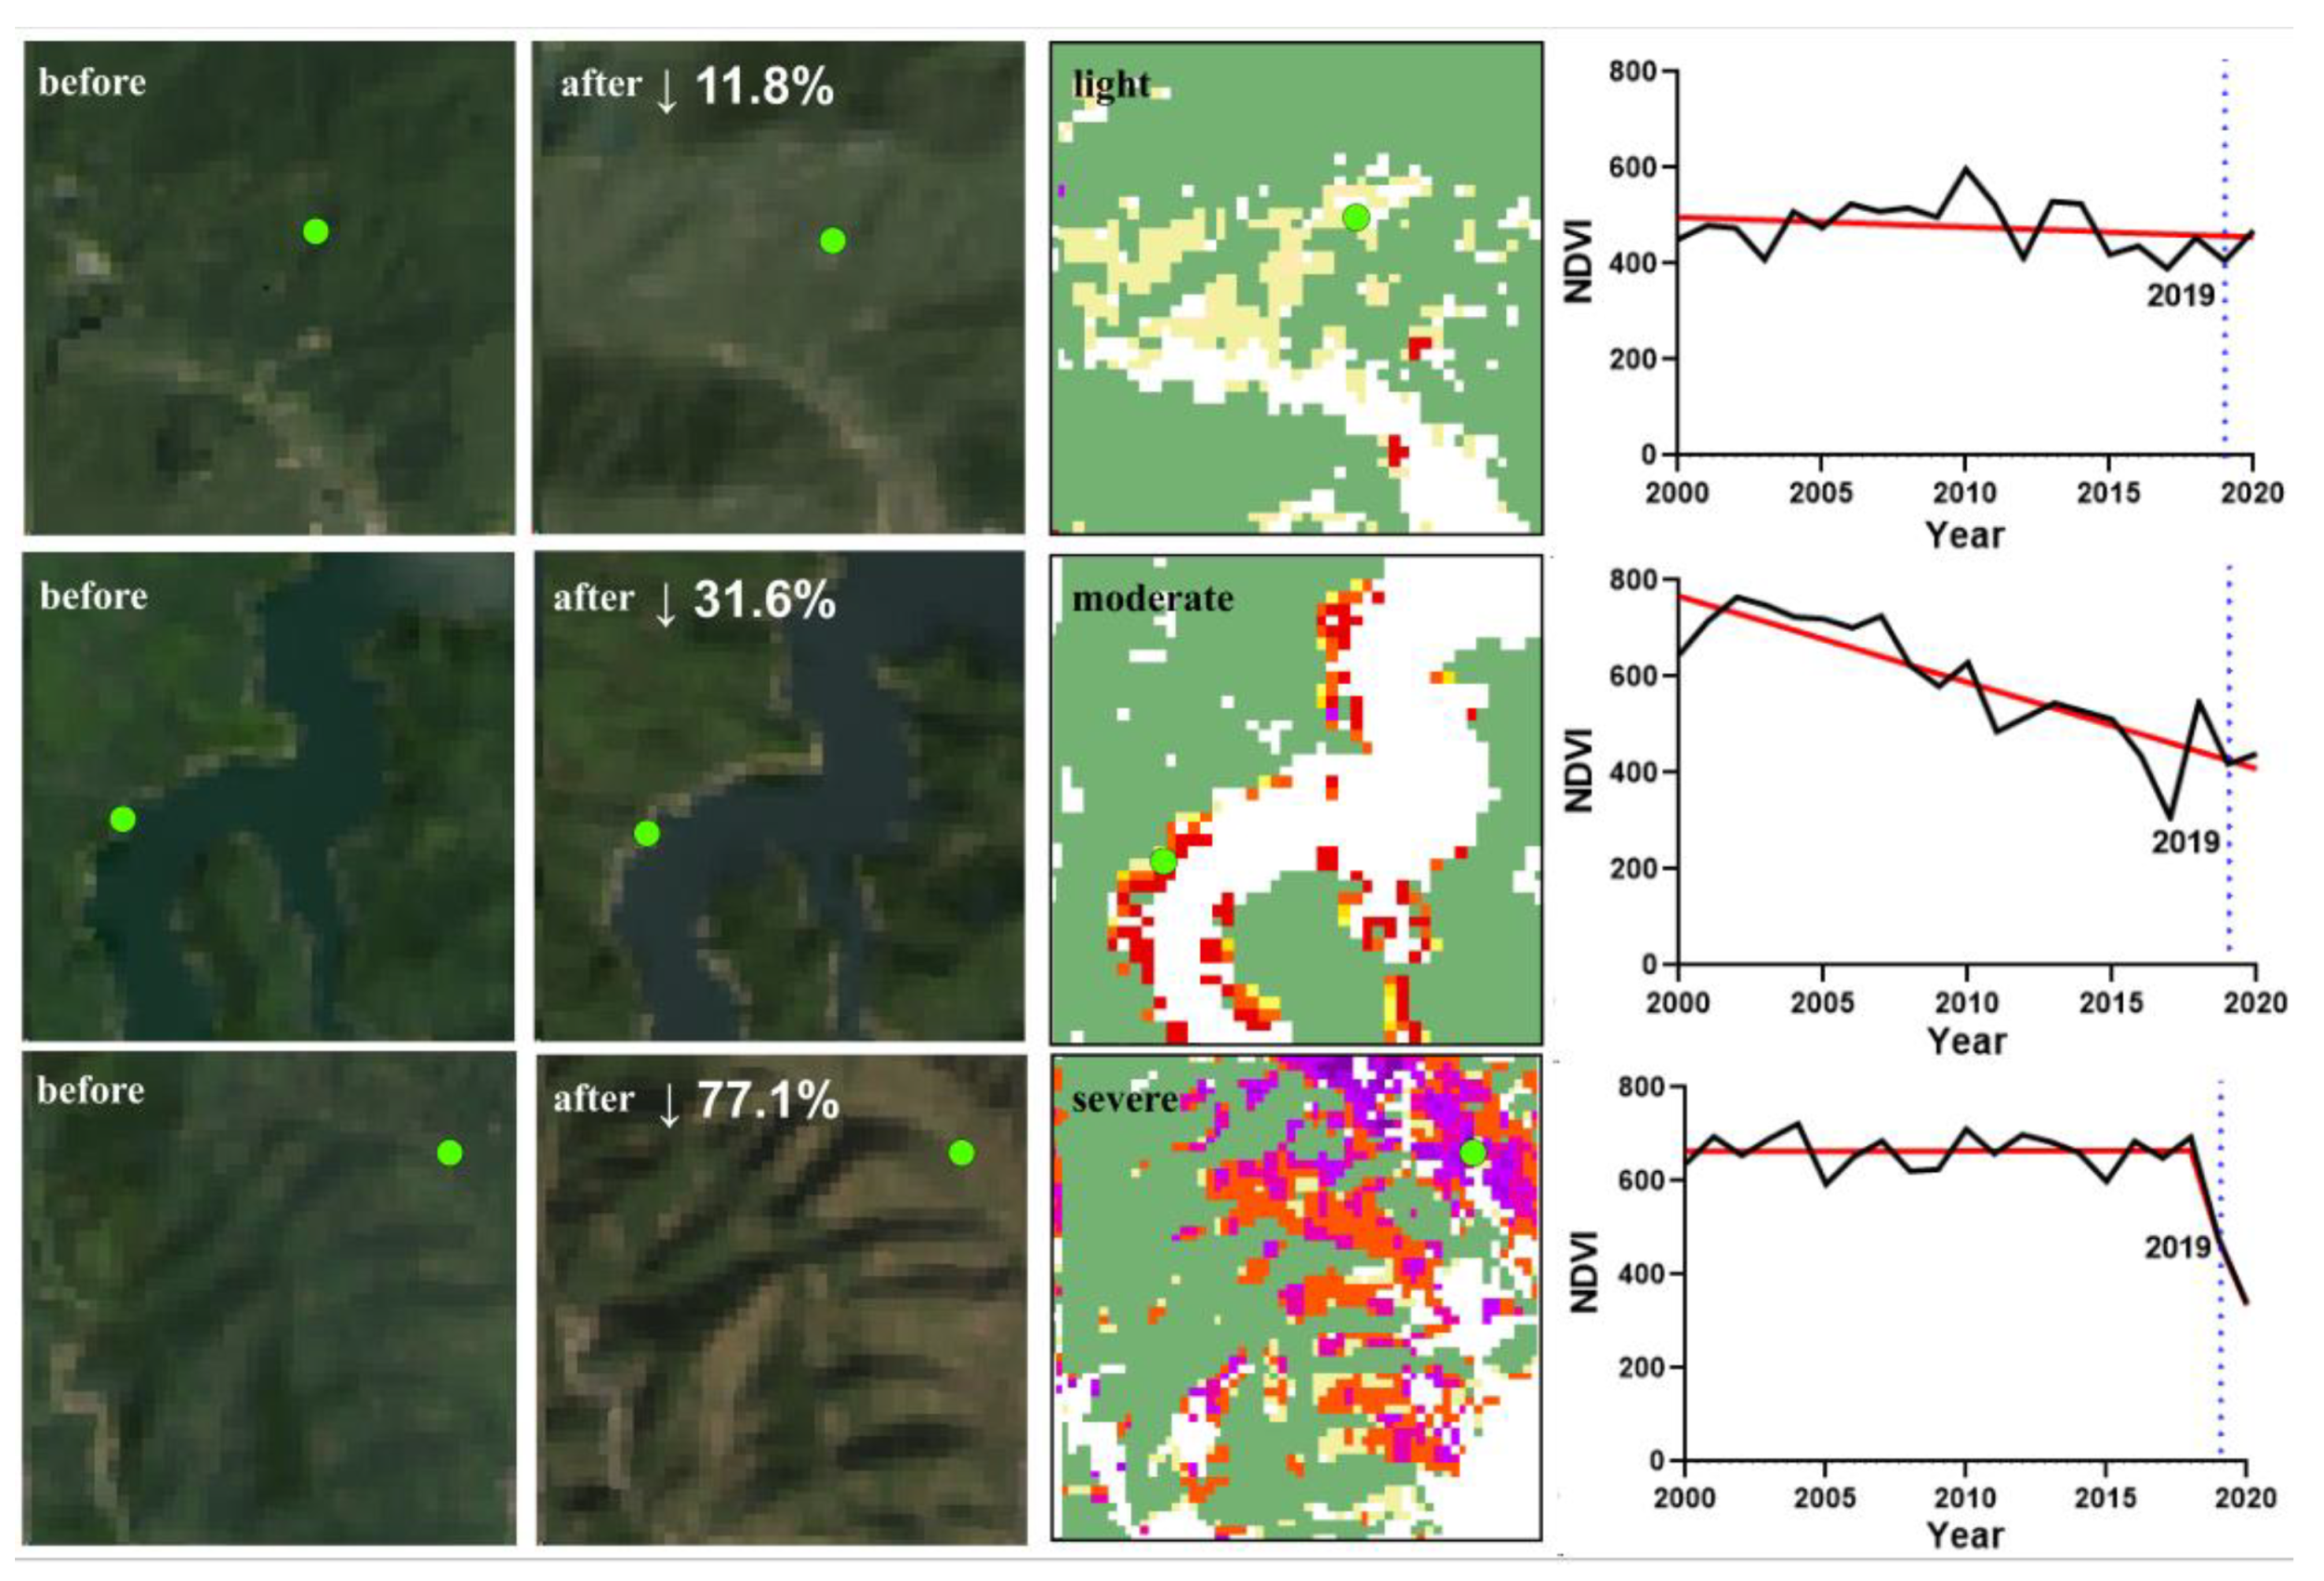
3.3. Spatial and Regional Patterns of Forest Damage Severity
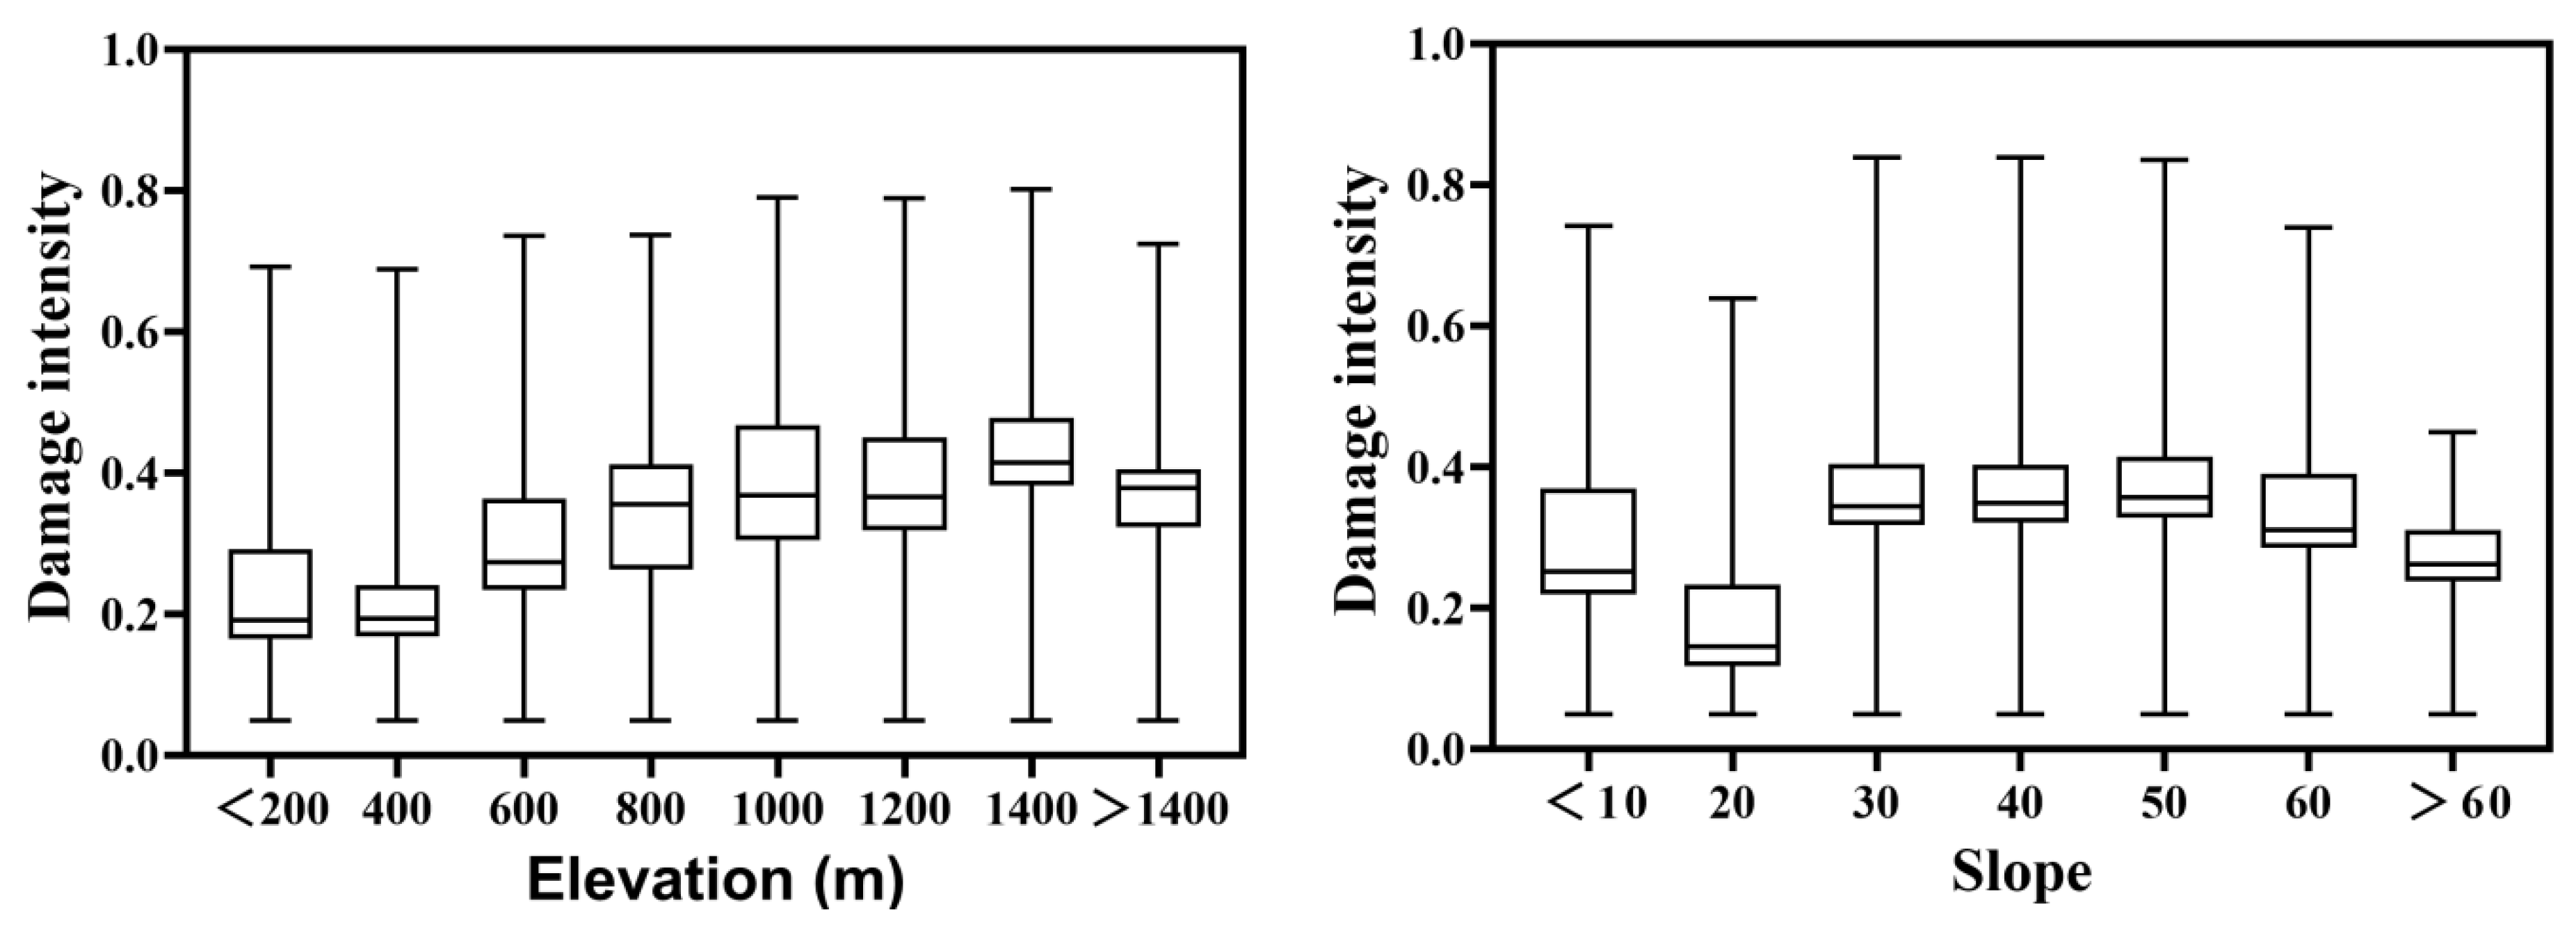
3.4. The Impact Factors on Forest Damage Caused by Lekima
3.5. The Uncertainty of Affected Forest Area and Damage Severity
4. Discussion
4.1. Impact Factors on Typhoon-Caused Forest Damages
4.2. Uncertainties, Implications, and Outlooks
5. Conclusions
Author Contributions
Funding
Institutional Review Board Statement
Informed Consent Statement
Data Availability Statement
Acknowledgments
Conflicts of Interest
References
- Abbas, S.; Nichol, J.E.; Fischer, G.A.; Wong, M.S.; Irteza, S.M. Impact assessment of a super-typhoon on Hong Kong’s secondary vegetation and recommendations for restoration of resilience in the forest succession. Agric. For. Meteorol. 2020, 280. [Google Scholar] [CrossRef]
- Weinkle, J.; Landsea, C.; Collins, D.; Musulin, R.; Crompton, R.P.; Klotzbach, P.J.; Pielke, R. Normalized hurricane damage in the continental United States 1900–2017. Nat. Sustain. 2018, 1, 808–813. [Google Scholar] [CrossRef]
- Zhao, H.; Duan, X.; Raga, G.B.; Klotzbach, P.J. Changes in Characteristics of Rapidly Intensifying Western North Pacific Tropical Cyclones Related to Climate Regime Shifts. J. Clim. 2018, 31, 8163–8179. [Google Scholar] [CrossRef]
- Chambers, J.Q.; Fisher, J.I.; Zeng, H.; Chapman, E.L.; Baker, D.B.; Hurtt, G.C. Hurricane Katrina’s Carbon Footprint on U.S. Gulf Coast Forests. Science 2007, 318, 1107. [Google Scholar] [CrossRef] [PubMed] [Green Version]
- McNulty, S.G. Hurricane impacts on US forest carbon sequestration. Environ. Pollut. 2002, 116, S17–S24. [Google Scholar] [CrossRef]
- Gang, C.; Pan, S.; Tian, H.; Wang, Z.; Shi, H. Satellite observations of forest resilience to hurricanes along the northern Gulf of Mexico. For. Ecol. Manag. 2020, 472, 118243. [Google Scholar] [CrossRef]
- Feng, Y.; Negrón-Juárez, R.I.; Chambers, J.Q. Remote sensing and statistical analysis of the effects of hurricane María on the forests of Puerto Rico. Remote Sens. Environ. 2020, 247, 111940. [Google Scholar] [CrossRef]
- Aosier, B.; Kaneko, M.; Takada, M. Evaluation of the Forest Damage by Typhoon Using Remote Sensing Technique. In Proceedings of the 2007 IEEE International Geoscience and Remote Sensing Symposium, Barcelona, Spain, 23–27 July 2007; pp. 3022–3026. [Google Scholar]
- Cortés-Ramos, J.; Luis, M.; Herrera-Cervantes, H. Assessment of tropical cyclone damage on dry forests using multispectral remote sensing: The case of Baja California Sur, Mexico. J. Arid Environ. 2020, 178, 104171. [Google Scholar] [CrossRef]
- Zhang, C.; Durgan, S.D.; Lagomasino, D. Modeling risk of mangroves to tropical cyclones: A case study of Hurricane Irma. Estuar. Coast. Shelf Sci. 2019, 224, 108–116. [Google Scholar] [CrossRef]
- St Peter, J.; Anderson, C.; Drake, J.; Medley, P. Spatially quantifying forest loss at landscape-scale following a major storm event. Remote Sens. 2020, 12, 1138. [Google Scholar] [CrossRef] [Green Version]
- Ramsey, E.W.; Chappell, D.K.; Jacobs, D.M.; Sapkota, S.K.; Baldwin, D.G. Resource Management of Forested Wetlands: Hurricane Impact and Recovery Mapped by Combining Landsat TM and NOAA AVHRR Data. Photogramm. Eng. Remote Sens. 1998, 64, 733–738. [Google Scholar]
- Wang, F.; Xu, Y.J. Comparison of remote sensing change detection techniques for assessing hurricane damage to forests. Environ. Monit. Assess. 2010, 162, 311–326. [Google Scholar] [CrossRef]
- Cohen, W.; Yang, Z.; Healey, S.; Kennedy, R.; Gorelick, N. A LandTrendr multispectral ensemble for forest disturbance detection. Remote Sens. Environ. 2018, 205, 131–140. [Google Scholar] [CrossRef]
- Huang, C.; Goward, S.; Masek, J.; Thomas, N.; Zhu, Z.; Vogelmann, J. An automated approach for reconstructing recent forest disturbance history using dense Landsat time series stacks. Remote Sens. Environ. 2010, 114, 183–198. [Google Scholar] [CrossRef]
- Verbesselt, J.; Hyndman, R.; Newnham, G.; Culvenor, D. Detecting trend and seasonal changes in satellite image time series. Remote Sens. Environ. 2010, 114, 106–115. [Google Scholar] [CrossRef]
- Ramsey, E.W.; Chappell, D.K.; Baldwin, D.G. AVHRR lmagery Used to Identify Hurricane Damage in a Forested Wetland of Louisiana. Photogramm. Eng. Remote Sens. 1997, 63, 293–297. [Google Scholar]
- Ramsey, E.W.; Hodgson, M.E.; Sapkota, S.K.; Nelson, G.A. Forest impact estimated with NOAA AVHRR and Landsat TM data related to an empirical hurricane wind-field distribution. Remote Sens. Environ. 2001, 77, 279–292. [Google Scholar] [CrossRef] [Green Version]
- Ayala-Silva, T.; Twumasi, Y.A. Hurricane Georges and vegetation change in Puerto Rico using AVHRR satellite data. Int. J. Remote Sens. 2004, 25, 1629–1640. [Google Scholar] [CrossRef]
- Long, J.; Giri, C.; Primavera, J.; Trivedi, M. Damage and recovery assessment of the Philippines’ mangroves following Super Typhoon Haiyan. Mar. Pollut. Bull. 2016, 109, 734–743. [Google Scholar] [CrossRef]
- Rossi, E.; Rogan, J.; Schneider, L. Mapping forest damage in northern Nicaragua after Hurricane Felix (2007) using MODIS enhanced vegetation index data. GIScience Remote Sens. 2013, 50, 385–399. [Google Scholar] [CrossRef]
- Rogan, J.; Schneider, L.; Christman, Z.; Millones, M.; Lawrence, D.; Schmook, B. Hurricane disturbance mapping using MODIS EVI data in the southeastern Yucatán, Mexico. Remote Sens. Lett. 2011, 2, 259–267. [Google Scholar] [CrossRef]
- Wang, W.; Qu, J.J.; Hao, X.; Liu, Y.; Stanturf, J.A. Post-hurricane forest damage assessment using satellite remote sensing. Agric. For. Meteorol. 2010, 150, 122–132. [Google Scholar] [CrossRef]
- Schultz, M.; Clevers, J.G.P.W.; Carter, S.; Verbesselt, J.; Avitabile, V.; Quang, H.V.; Herold, M. Performance of vegetation indices from Landsat time series in deforestation monitoring. Int. J. Appl. Earth Obs. Geoinf. 2016, 52, 318–327. [Google Scholar] [CrossRef]
- Einzmann, K.; Immitzer, M.; Bock, S.; Bauer, O.; Schmitt, A.; Atzberger, C. Windthrow Detection in European Forests with Very High-Resolution Optical Data. Forests 2017, 8, 21. [Google Scholar] [CrossRef] [Green Version]
- Cohen, W.; Healey, S.; Yang, Z.; Zhu, Z.; Gorelick, N. Diversity of Algorithm and Spectral Band Inputs Improves Landsat Monitoring of Forest Disturbance. Remote Sens. 2020, 12, 1673. [Google Scholar] [CrossRef]
- Jeong, J.H.; Resop, J.P.; Mueller, N.D.; Fleisher, D.H.; Yun, K.; Butler, E.E.; Timlin, D.J.; Shim, K.M.; Gerber, J.S.; Reddy, V.R.; et al. Random Forests for Global and Regional Crop Yield Predictions. PLoS ONE 2016, 11, e0156571. [Google Scholar] [CrossRef] [PubMed]
- Lin, Y.; Chen, X. Research on Typhoon Disaster and Its Chain Effects-Taking Typhoon “Lekima” as an Example. J. Jilin Inst. Chem. Technol. 2020, 37, 81–86. [Google Scholar]
- Cong, C.; Han, J.; Jiao, J.; Feng, W.; Ma, C.; Xie, M.; Liu, Y.; He, Z.; Ge, W.; Li, L.; et al. Investigation on Soil Erosion from Typhoon Lekima Rainstorm. Bull. Soil Water Conserv. 2019, 39, 337–344. [Google Scholar]
- Qi, X.; Gao, L. Analysis on typhoon disaster chain under different terrain conditions: A case study of typhoon Lekima in 2019. J. Fujian Norm. Univ. (Nat. Sci. Ed.) 2020, 36, 74–81. [Google Scholar]
- Lou, X.; Ma, H.; Huang, X.; LIu, H.; Peng, X. Analysis on the causes of extreme precipitation by Typhoon Lekima (1909) in Zhejiang Province. J. Meteorol. Sci. 2020, 40, 78–88. [Google Scholar]
- Weng, Z.; Ben, H.; Gao, L.; Wang, K. Analysis on the variation characteristics of rainbelt intensity and structure of Typhoon “Lekima” before and after its landing. J. Meteorol. Sci. 2020, 40, 325–332. [Google Scholar]
- Mao, F.; Du, H.; Zhou, G.; Li, X.; Xu, X.; Li, P.; Sun, S. Coupled LAI assimilation and BEPS model for analyzing the spatiotemporal pattern and heterogeneity of carbon fluxes of the bamboo forest in Zhejiang Province, China. Agric. For. Meteorol. 2017, 242, 96–108. [Google Scholar] [CrossRef]
- Li, C.; Wang, J.; Hu, L.; Yu, L.; Clinton, N.; Huang, H.; Yang, J.; Gong, P. A Circa 2010 Thirty Meter Resolution Forest Map for China. Remote Sens. 2014, 6, 5325–5343. [Google Scholar] [CrossRef] [Green Version]
- Wen, S.; Zhai, J.; Thomas, F.; Su, B.; Jiang, T.; Wang, Y. Variation of normalized economic losses from influential tropical cyclones in China for 1984–2014. J. Trop. Meteorol. 2017, 33, 478–487. [Google Scholar]
- Foga, S.; Scaramuzza, P.L.; Guo, S.; Zhu, Z.; Dilley, R.D.; Beckmann, T.; Schmidt, G.L.; Dwyer, J.L.; Joseph Hughes, M.; Laue, B. Cloud detection algorithm comparison and validation for operational landsat data products. Remote Sens. Environ. 2017, 194, 379–390. [Google Scholar] [CrossRef] [Green Version]
- Furukawa, F.; Morimoto, J.; Yoshimura, N.; Kaneko, M. Comparison of conventional change detection methodologies using high-resolution imagery to find forest damage caused by typhoons. Remote Sens. 2020, 12, 3242. [Google Scholar] [CrossRef]
- Zimmerman, J.K.; Covich, A.P. Damage and recovery of riparian Sierra palms after Hurricane Georges: Influence of topography and biotic characteristics. Biotropica 2007, 39, 43–49. [Google Scholar] [CrossRef]
- Wang, F.; Xu, Y.J. Hurricane Katrina-induced forest damage in relation to ecological factors at landscape scale. Environ. Monit. Assess. 2009, 156, 491–507. [Google Scholar] [CrossRef]
- Rhyma, P.P.; Norizah, K.; Hamdan, O.; Faridah-Hanum, I.; Zulfa, A.W. Integration of normalised different vegetation index and Soil-Adjusted Vegetation Index for mangrove vegetation delineation. Remote Sens. Appl. Soc. Environ. 2020, 17, 100280. [Google Scholar] [CrossRef]
- Kennedy, R.; Yang, Z.; Cohen, W. Detecting trends in forest disturbance and recovery using yearly Landsat time series: 1. LandTrendr—Temporal segmentation algorithms. Remote Sens. Environ. 2010, 114, 2897–2910. [Google Scholar] [CrossRef]
- Kennedy, R.; Yang, Z.; Braaten, J.; Copass, C.; Antonova, N.; Jordan, C.; Nelson, P. Attribution of disturbance change agent from Landsat time-series in support of habitat monitoring in the Puget Sound region, USA. Remote Sens. Environ. 2015, 166, 271–285. [Google Scholar] [CrossRef]
- Story, M.; Congalton, R.G. Accuracy assessment: A user’s perspective. Photogramm. Eng. Remote Sens. 1986, 52, 397–399. [Google Scholar]
- Martin, T.J.; Ogden, J. Wind damage and response in New Zealand forests: A review. N. Z. J. Ecol. 2006, 30, 295–310. [Google Scholar]
- Boose, E.R.; Serrano, M.I.; Foster, D.R. Landscape and regional impacts of hurricanes in Puerto Rico. Ecol. Monogr. 2004, 74, 335–352. [Google Scholar] [CrossRef]
- Hua, J.; Chen, G.; Yu, L.; Ye, Q.; Jiao, H.; Luo, X. Improved Mapping of Long-Term Forest Disturbanceand Recovery Dynamics in the Subtropical ChinaUsing All Available Landsat Time-Series Imagery onGoogle Earth Engine Platform. IEEE J. Sel. Top. Appl. Earth Obs. Remote Sens. 2021, 14, 2754–2768. [Google Scholar] [CrossRef]


| Vegetation Indices | Formulas |
|---|---|
| NDVI | |
| EVI | |
| NDII | |
| NDMI | |
| SAVI | |
| NDWI | |
| NDBI | |
| CVI |
| Factors | Importance | Rank |
|---|---|---|
| ΔNDVI | 11.55 | 1 |
| ΔB4 | 11.47 | 2 |
| ΔB2 | 9.50 | 3 |
| ΔSAVI | 9.12 | 4 |
| ΔEVI | 8.76 | 5 |
| ΔB1 | 7.98 | 6 |
| ΔB3 | 6.96 | 7 |
| ΔNDMI | 6.44 | 8 |
| ΔB7 | 6.29 | 9 |
| ΔNDII | 5.65 | 10 |
| ΔCVI | 4.87 | 11 |
| Elevation | 4.76 | 12 |
| Precipitation | 3.91 | 13 |
| ΔB5 | 3.62 | 14 |
| ΔB6 | 3.35 | 15 |
| contrast | 1.13 | 16 |
| idm | 1.02 | 17 |
| corr | 0.89 | 18 |
| diss | 0.87 | 19 |
| var | 0.80 | 20 |
| asm | 0.76 | 21 |
| ent | 0.51 | 22 |
| Methods * | Consumer Accuracy | Producers Accuracy | Overall Accuracy | Kappa |
|---|---|---|---|---|
| RF | 0.92 | 0.94 | 0.93 | 0.86 |
| NDVI | 0.90 | 0.91 | 0.89 | 0.79 |
| EVI | 0.90 | 0.91 | 0.90 | 0.79 |
| NDII | 0.88 | 0.90 | 0.88 | 0.75 |
| CVI | 0.88 | 0.89 | 0.87 | 0.75 |
| SAVI | 0.90 | 0.90 | 0.89 | 0.79 |
| City | Forest Area (km2) | Affected Area (km2) | Fraction (%) | Light (%) | Moderate (%) | Severe (%) |
|---|---|---|---|---|---|---|
| Wenzhou | 5647.32 | 370.43 | 6.56 | 45.38 | 41.47 | 13.15 |
| Hangzhou | 11,030.66 | 1076.18 | 9.76 | 48.46 | 44.52 | 7.03 |
| Zhoushan | 270.01 | 50.62 | 18.75 | 55.80 | 32.09 | 12.11 |
| Huzhou | 1891.40 | 245.30 | 12.97 | 63.43 | 29.54 | 7.03 |
| Jiaxing | 15.56 | 2.14 | 13.75 | 52.29 | 38.36 | 9.35 |
| Jinhua | 5802.89 | 578.78 | 9.97 | 39.39 | 51.22 | 9.39 |
| Lishui | 12,295.74 | 610.81 | 4.97 | 56.43 | 35.65 | 7.92 |
| Ningbo | 3458.70 | 464.73 | 13.44 | 57.45 | 34.59 | 7.96 |
| Quzhou | 5430.95 | 366.48 | 6.75 | 34.95 | 48.51 | 16.54 |
| Shaoxing | 4205.59 | 495.69 | 11.79 | 48.87 | 44.06 | 7.07 |
| Taizhou | 4464.09 | 337.71 | 7.57 | 32.98 | 49.42 | 17.60 |
| Entire Zhejiang | 54,512.91 | 4598.87 | 8.44 | 45.79 | 44.00 | 10.21 |
Publisher’s Note: MDPI stays neutral with regard to jurisdictional claims in published maps and institutional affiliations. |
© 2021 by the authors. Licensee MDPI, Basel, Switzerland. This article is an open access article distributed under the terms and conditions of the Creative Commons Attribution (CC BY) license (https://creativecommons.org/licenses/by/4.0/).
Share and Cite
Zhang, X.; Chen, G.; Cai, L.; Jiao, H.; Hua, J.; Luo, X.; Wei, X. Impact Assessments of Typhoon Lekima on Forest Damages in Subtropical China Using Machine Learning Methods and Landsat 8 OLI Imagery. Sustainability 2021, 13, 4893. https://doi.org/10.3390/su13094893
Zhang X, Chen G, Cai L, Jiao H, Hua J, Luo X, Wei X. Impact Assessments of Typhoon Lekima on Forest Damages in Subtropical China Using Machine Learning Methods and Landsat 8 OLI Imagery. Sustainability. 2021; 13(9):4893. https://doi.org/10.3390/su13094893
Chicago/Turabian StyleZhang, Xu, Guangsheng Chen, Lingxiao Cai, Hongbo Jiao, Jianwen Hua, Xifang Luo, and Xinliang Wei. 2021. "Impact Assessments of Typhoon Lekima on Forest Damages in Subtropical China Using Machine Learning Methods and Landsat 8 OLI Imagery" Sustainability 13, no. 9: 4893. https://doi.org/10.3390/su13094893