
An Improved Method for Urban Built-Up Area Extraction Supported by Multi-Source Data

1
Chinese Academy of Surveying and Mapping, Beijing 100830, China
2
Department of Geomatics, Xi’an University of Science and Technology, Xi’an 710600, China
*
Author to whom correspondence should be addressed.
Sustainability 2021, 13(9), 5042; https://doi.org/10.3390/su13095042
Submission received: 20 March 2021
/
Revised: 16 April 2021
/
Accepted: 23 April 2021
/
Published: 30 April 2021
(This article belongs to the Special Issue Multi-Temporal Analysis of Landscapes and Urban Areas)
Abstract
:Urban built-up areas, where urbanization process takes place, represent well-developed areas in a city. The accurate and timely extraction of urban built-up areas has a fundamental role in the comprehension and management of urbanization dynamics. Urban built-up areas are not only a reflection of urban expansion but also the main space carrier of social activities. Recent research has attempted to integrate the social factor to improve the extraction accuracy. However, the existing extraction methods based on nighttime light data only focus on the integration of a single factor, such as points of interest or road networks, which leads to weak constraint and low accuracy. To address this issue, a new index-based methodology for urban built-up area extraction that fuses nighttime light data with multisource big data is proposed in this paper. The proposed index, while being conceptually simple and computationally inexpensive, can extract the built-up areas efficiently. First, a new index-based methodology, which integrates nighttime light data with points-of-interest, road networks, and the enhanced vegetation index, was constructed. Then, based on the proposed new index and the reference urban built-up data area, urban built-up area extraction was performed based on the dynamic threshold dichotomy method. Finally, the proposed method was validated based on actual data in a city. The experimental results indicate that the proposed index has high accuracy (recall, precision and F1 score) and applicability for urban built-up area boundary extraction. Moreover, this paper discussed different existing urban area extraction methods, and provides an insight into the appropriate approaches selection for further urban built-up area extraction in cities with different conditions.
1. Introduction
Urban built-up areas (UBUA) are directly linked to the geographic distribution of urban development that is an important indicator of a city’s levels of development and expansion [1,2]. The rapid and accurate extraction of urban built-up areas has always been a popular topic in the areas of remote sensing and urban planning [3,4]. Currently, urban built-up areas are usually extracted based on remote sensing satellite data, including data from conventional remote sensing images and high-resolution remote sensing images by using Object Based Image Analysis and from nighttime light images [5]. The area interpreted from high-resolution images includes land-use cover information but lacks socioeconomic information [6]. Compared with ordinary remote sensing images, nighttime light images are an objective and real-time data source that captures visible radiation in real time, and the brightness information recorded by nighttime light (NTL) images has notable advantages in the detection of regional differences in human activities. Moreover, nighttime light data are not affected by spectral confusion and are currently broadly used for the extraction of urban built-up areas [7,8,9].
Urban built-up area extraction methods mainly include methods based on original NTL images and methods based on the fusion of NTL data with other data [10,11,12,13]. Duque et al. (2019) performed the urban extent delineation by using Defense Meteorological Satellite Programs–Operational Linescan System (DMSP/OLS) nighttime light data [14]. Pandey et al. (2013) monitored urbanization areas in India by integrating DMSP/OLS night time lights and SPOT-VGT data [15]. Due to the limitations of the design and resolution of sensors, it is difficult to obtain high-precision urban built-up area results on small or medium scales. Furthermore, obvious light saturation exists in city centers, leading to a larger extracted area than the actual range [16]. To address the saturation problem, many studies integrated multisource data with NTL data to build indices for urban built-up area extraction to improve its accuracy. For instance, Sharma et al. (2016) proposed an improved methodology for the urban built-up areas’ extraction by combing Moderate Resolution Imaging Spectroradiometer (MODIS) multispectral data with VIIRS nighttime light data [17]. Min et al. (2016) performed urban built-up area extraction by using natural factors such as the normalized difference vegetation index (NDVI) to desaturate NTL data [18]. Zhuo et al. (2015) used the spatial variations in the enhanced vegetation index (EVI) and NTL data to construct the EVI-adjusted NTL index and found that this index can be used to address the internal variations in urban areas and accurately reflect urban development [19]. Zhang et al. (2018) proposed the temperature and vegetation adjusted NTL urban index for the extraction of urban built-up areas [20]. However, the existing urban built-up area extraction methods that incorporate natural factors also have limitations. For instance, areas with high vegetation cover are less sensitive to night light than are other areas, resulting in low-accuracy urban built-up area extraction. Therefore, some researchers have incorporated social factors into extraction to improve the extraction of the results. Based on the relationship between NTL patterns and human activity, Zheng et al. (2018) used road network length data to amend the NTL data and found that the incorporation of road network data helped to capture the details of the light intensity distribution, thus increasing the characterization precision of the urban structure [21]. Yan et al. (2020) proposed the road density–EVI-adjusted NTL index (REANI) and found that the REANI is an effective tool for urban built-up area extraction [22]. Due to the rapid development of mapping services and mobile communications technologies, POI (Points of Interest) data are of considerable value. POI data are social data that reflect the human activities and include accurate location and attribute information. Some studies have proven that there is a good coupling relationship between NTL and POI, and POI enables convenient and accurate determination of the boundary of UBUA [23,24]. For example, Li et al. (2020 d) proposed the POI–land surface temperature (LST)-adjusted NTL urban index (PLANUI) to precisely extract urban built-up areas [25].
Although the most recently proposed methods have combined social factors with NTL data, they often focus on specific social factors, such as POIs or road networks, resulting in weak constraints and weak mitigation of the NTL blooming effect, and thus leading to a low extraction accuracy. For instance, if a region has a low road density but contains a significant amount of POI information (or vice versa), the existing methods will fail to fully capture the urban built-up area in this region. In addition, the main method for integrating multisource social data is to set a threshold value for the kernel density to obtain accurate urban built-up areas. A single factor usually has limited constraints related to the NTL data, leading to the misevaluation of built-up areas. Both of these issues can result in low-accuracy urban built-up area extraction. In reality, the units formed by road network connections are the basic units of a city, and POI information reflects the spatial aggregation of different urban functional land types. Both the road network and POIs influence the urban spatial pattern. Therefore, this paper proposed an NTL-based urban built-up area extraction index by integrating EVI (Enhanced Vegetation Index), POI and road network data to reduce the blooming effect of NTL, improve the extraction accuracy and represent urban spatial patterns in a highly realistic manner.
2. Related Work
The most recent NTL-based urban built-up area extraction methods consider social factors to greatly increase the accuracy of UBUA extraction. These methods are the POI-adjusted NTL extraction method and the road network-adjusted NTL extraction method.
2.1. Existing Methods
- (1)
- Road density adjusted NTL extraction methodBased on the a priori knowledge that the impervious surfaces and UBUAs of a city are negatively correlated with vegetation and positively correlated with the road density, a REANI index that considers road density and EVI was proposed [22].where denotes the min–max normalized road density of point I and () is the min–max normalized value of point i within the range of [0,1].
- (2)
- POI adjusted the extraction methodAs one of the basic data types for urban spatial analysis, POIs can intuitively and effectively reflect the spatial patterns of various urban elements. Based on the spatial distributions of POIs, urban spatial structures and urban factors, existing studies have integrated the POI density with data to extract UBUA boundaries [25].where represents the intensity at the i-th point and denotes the POI kernel density at the i-th point.
2.2. Limitations of the Current Methods
The existing methods have extracted UBUA boundaries by integrating social factors and NTL data. However, these methods only focus on one social factor (POI or road networks) and ignore the distribution variations among different social elements, thus leading to false extraction.
Scenario 1: For areas with low road densities, the road density-based method may lead to the exclusion of some UBUAs from the extraction results. For areas with high road network densities, this method may also lead to the misjudgment of non-built-up areas due to weak constraints. As illustrated in Figure 1a, the yellow and red lines indicate the real urban built-up area boundary and extracted boundary based on the REANI index, respectively. When urban built-up area extraction is performed based on the REANI index, the built-up area in older residential regions (such as Area A1) may be excluded because they have low road densities. By contrast, some areas with high road network densities, such as Area A2, are extracted as built-up areas with the road density-based method. In reality, Area A2 is only a small industrial zone and not a built-up area.
Scenario 2: For areas with low POI densities, the POI density-based method may lead to the exclusion of UBUAs from the extraction results. As shown in Figure 1b, in some newly constructed contiguous industrial/development zones (Area B), because most buildings in the area are homogeneous, the POI density is relatively low. When urban built-up area extraction is performed based on the POI-based method, the built-up areas in these regions will be ignored.
3. EVI, POI and Road Network Adjusted NTL Urban Index for Urban Built-Up Area Extraction
In this paper, a UBUA extraction method that integrates POI, road network, and EVI data with NTL images is proposed to achieve the comprehensive and accurate extraction of building areas considering the constraints associated with natural and social factors. This method mainly includes two steps: the construction of the adjusted NTL index and the extraction of urban built-up area based on dynamic threshold dichotomy.
3.1. PREANI Index: The EVI, POI and Road Network Adjusted NTL Urban Index
3.1.1. NTL Data Processing Model
Compared with DMSP/OLS (Optical Linescan System of the Defense Meteorological Satellite Program) data, NPP/VIIRS (Visible Infrared Imaging Radiometer Suite sensor on the Suomi National Polar-orbiting Partnership satellite) data have a higher spatial resolution and a wider radiometric detection range. However, the data represent a preliminary product that has not been filtered to remove the features associated with gas flares, volcanoes, and background noise. Moreover, the data contain features associated with the reflectance light of bright surfaces. These light noises can limit the accuracy and reliability of UBUA extraction. Therefore, interfering noises that are irrelevant to real economic activities must be removed. First, the pixels with negative DN (Digital Number) values in the original NPP/VIIRS data are assigned a value of 0. Since Beijing, Shanghai, and Guangzhou are the three largest and most developed cities in China, the pixel values of the other areas should not, in theory, exceed those of the three megacities. Therefore, the brightest pixels in these cities in the NPP-VIIRS dataset were used as the maximum values for China. Each pixel with a DN value larger than the maximum DN value was assigned the largest DN value among those of the pixel’s eight immediate neighbors. This method eliminates the short-term strong light interference in the NPP/VIIRS NTL data.
3.1.2. POIs and Road Kernel Density Calculation
In this study, the distribution density is used to estimate the kernel density of the POIs and road network, and the continuous spatial distribution patterns of the two elements are obtained. Kernel density analysis was used to calculate the unit density of the point and line factors in some areas, and the density at each point was the weighted average of the density at all of the points in the area. Kernel density is given by Equation (1).
where Kj is the weight of point j, Dij is the Euclidean distance between point i and point j; R denotes the bandwidth, and n is the number of points j in the selected region. POI kernel density can reflect urban structures and the aggregation of human activities; the density is significantly higher in urban areas than in rural areas, and it decreases significantly in the transition zones between urban and rural areas. The kernel density of a road network reflects the development trend of land use. Generally, the density of road networks gradually decreases from the urban core to rural areas [19].
The selection of bandwidth (R) is crucial for kernel density analysis, and the determination of bandwidth must fully combine the spatial distributions of the elements and the relevant practical requirements. A small bandwidth can effectively capture high- or low-value regions and can reflect the local characteristics of the kernel density distribution. A large bandwidth can effectively reflect the characteristics of the kernel density distribution at the global scale [26].
To obtain a smooth-edge and detailed kernel density distribution and ensure the scientific soundness and reliability of the thresholds, bandwidths of 500, 1000, and 2000 m were selected and compared in this paper. We randomly selected a certain profile as the sample and calculated the kernel density values at different bandwidths (Figure 2). The kernel density curve with a bandwidth of 500 m fluctuated and contained multiple density centers due to the narrow bandwidth considered. As the bandwidth increased, the density curve became smoother. When the bandwidth was 1000 m, the important density centers were still clear, but when the bandwidth was increased to 2000 m, the curve became too smooth to capture the important and basic characteristics. Therefore, by comparing the kernel density curves for different bandwidths, a bandwidth of 1000 m was selected for this work. The corresponding kernel density plot effectively illustrated the most important kernel density centers and retained a suitable level of smoothness.
3.1.3. Data Normalization
Since the kernel density of each factor has different orders of magnitude, it is necessary to normalize the data prior to analysis. Based on the principles of data standardization, this paper uses the min–max normalization method (Equation (1) to standardize the data and eliminate the effects of factor magnitude differences on accuracy.
where is the value of the i-th factor, is the minimum value of index i, and max(xi) represents the maximum value of index i.
3.1.4. Adjusted NTL Index (PREANI) Construction
Previous studies have proven that EVI and POI data and road networks are suitable for urban built-up area extraction. Therefore, this study combined NTL, EVI, POI and road networks to propose PREANI. Based on the related literature, the three pieces of data are given equal weights. PREANI aims to compensate for the shortcomings of the low accuracy of the existing UBUA extraction methods.
Generally, the POI density and road density are positively correlated with the population density and socioeconomic development, respectively, which in turn are positively correlated with the light intensity. However, if the NTL data are amended using the road density data only, old urban areas with poorly developed infrastructure will often be missed during urban built-up area extraction. Likewise, if extraction is performed only using the POI density, areas with low POI densities (newly developed areas and large factories) will be overlooked. The combination of POI and road network data can increase the intensity of the light signal and reinforce the boundaries between urban and rural areas, thus improving the accuracy of built-up area extraction. The POI–road density–EVI-adjusted NTL index (PREANI) was defined as shown in Equation (3). It should be noted that the geometric average method is selected to calculate PREANI. The reasons for selecting this method are as follows: (1) the geometric mean can integrate the advantages of NTL, EVI, POI and road network, for instance, it can avoid the areas with noise points being mistakenly extracted as urban built-up area; (2) the geometric average method is less affected by the extreme value and can correct the abnormal illumination value.
where EVI denotes the normalized EVI value of point i, P is the normalized POI kernel density value of point i, R is the normalized kernel density value of the road network at point i, and NTL is the standardized intensity of NTLs at point i.
3.2. Dynamic Threshold Method
NPP/VIIRS NTL data can be amended based on the constructed PREANI. Then, based on the reference built-up area value, the built-up area can be extracted by using the dynamic threshold method.
where Di represents the threshold of the light intensity, is the total extracted area with a light intensity greater than Di, Dmax denotes the maximum light intensity in the region, is the area with light intensity Dj, S is the reference area of the built-up area, and is the residual between the extracted and reference areas. The optimal threshold was obtained by iterating Di to minimize the residual. Finally, UBUA extraction was performed based on the PREANI-amended NTL data using the optimal threshold.
4. Experiment Analysis and Discussion
4.1. Experimental Data
Based on the proposed method, the boundaries of built-up areas were extracted by using the actual data in Dongying city, Shandong Province. Dongying city is located at the mouth of the Yellow River in the northeastern part of Shandong, bordering the Bohai Sea in the east and the Beijing–Tianjin–Hubei region in the north; it is the central city of the Yellow River Delta and an important part of the Bohai Economic Zone. Dongying city is composed of Dongying District, Kenli District, Hekou District and two counties, namely, Guangrao and Lijin, covering approximately 8243 square kilometers in total. According to the 2020 urban spatial layout plan of Dongying city, a "two-core, five-zone, two-horizontal, two-vertical, and multicenter pattern" has been proposed to guide the aggregation of urban functional areas, optimize the city’s spatial structure, and promote urban health and sustainable development [27]. Dongying city was chosen for this study because it contains diverse geographical regions, including the newly developed economic development zone (such as in Hekou District) and some old urban areas (such as in Lijin County), which meet the experimental requirements for the proposed method validation.
The experimental data used in this study mainly include NTL, EVI, POI, road network, and reference built-up area boundary data (Figure 3). (1) The NPP-VIIRS NTL data with a spatial resolution of 15 arc were obtained from the National Geophysical Data Center of the National Oceanic and Atmospheric Administration (NOAA-NGDC) at http://ngdc.noaa.gov/eog/viirs/download_monthly.html (accessed on 1 November 2020). It should be noted that the NPP-VIIRS data from the middle and high latitudes of China exhibit distortion that usually occurs in the summer months; thus, data from seven periods from January–March and September–December were used to synthesize an annual NTL data set. (2) EVI data with a spatial resolution of 250 m and temporal resolution of 16 days were obtained from the MOD13A1 dataset published by NASA. This study obtained the monthly EVI value by using the maximum value synthesis method to synthesize the EVI data in the growing season. Then, the maximum value of the EVI dataset in the growing season is synthesized into the annual EVI value. (3) The POI data were obtained from Baidu Maps, which is one of the biggest map service providers in China [28]. After the data were cleaned, they contained more than 150,000 data points in 14 categories, such as catering services, transportation services, shopping and science, education and cultural services [29]. (4) The road network data were obtained from the basic national geographic monitoring data set of China that includes national highways, provincial highways, expressways and city roads. (5) The reference built-up area boundary was derived from the Third National Land Survey Data of China; these survey data were obtained through the visual interpretation of high-resolution remote sensing images and field surveys with high accuracy.
4.2. Overall Accuracy Analysis
Figure 4 illustrates the results of UBUA extraction for Dongying city by using road network data (blue color, reference [22]), POI data (yellow color, reference [25]) and the integrated road network and POI data (green color). Overall, the spatial distributions of the built-up areas in Dongying city extracted by the three methods are similar; that is, the central urban area of Dongying District is agglomerated and expansive, and the other areas are scattered, suggesting that these three methods can reflect the overall spatial structure of the city. Such a result is consistent with the findings of Lou et al. [30] with respect to Hangzhou city.
In terms of the overall spatial patterns, the extraction result of the road density-based extraction method excludes some built-up areas in the main city area, outer periphery areas and town centers (purple dotted-line rectangles). Moreover, because the NTL data were constrained by only one social factor, the extracted built-up area exhibited spillover and fragmentation, as denoted by the black dotted-line rectangles in Figure 4. As illustrated by Figure 4, the overall spatial characteristics of the urban built-up area extracted by the proposed method (green colors) are generally consistent with the reference built-up area (red line). Specifically, compared with the extraction results obtained with the POI-based method, there is a significant difference in the northern river mouth area of Dongying city (purple dotted-line rectangle). This area is the Dongying Port Economic Development Zone (a national-level petrochemical industrial base) that has excellent infrastructure, a relatively complete road network and a high road density. However, because this region mainly contains homogeneous enterprises and the regional POI density is low, the POI-based method excludes some built-up areas from the extraction result. The proposed method and the road density-based method can effectively identify newly built-up areas. The graded road network density toward the edges of built-up areas is generally lower than that near the center of built-up areas, which can lead to some built-up areas not being extracted. It should be noted that for the built-up area extraction based on the road density-based method, it is easy to misjudge small-scale factory areas as urban built-up areas, as observed in the region denoted by the black dashed box in B. The PREANI proposed in this study comprehensively considers both the road network and POIs and compensates for the incomplete expression of built-up areas associated with considering only a single element; thus, the results of built-up area extraction reflect the actual situation by considering multiple constraints.
To compare the extraction results of the existing methods and the method proposed in this study, the differences in UBUAs were calculated. The results show that the method proposed in this paper has approximately 22 differences from the method based on road networks and 17 differences from the method based on POIs.
4.3. Local Accuracy Analysis
To verify the superiority of the proposed method in UBUA extraction, local comparisons were performed between the extraction results of our method and those of existing methods in the areas where they differed.
- (1)
- Comparison with the road density-based method (low road density and high POI density scenario).
In this paper, six areas were randomly selected from regions with different results, as shown in Figure 5. The red, pink and green lines are the reference built-up boundaries, the boundaries extracted by the road density-based method, and the boundaries extracted by our method, respectively. Some areas that have low road densities but large numbers of POIs (mostly distributed around the periphery of built-up areas) are overlooked by the road density-based UBUA extraction method. Since these areas still have many buildings and a high POI density, the PREANI proposed in this paper can improve the identification of the urban spatial structure, leading to enhanced consistency between the UBUAs extracted by our method and the reference urban built-up area.
- (2)
- Comparison with the POI-based method (high road density and low POI density scenario)
Similarly, six areas were randomly selected from regions with different results, as shown in Figure 6. The red, yellow and green lines are the reference built-up boundaries, the boundaries extracted by the POI-based method, and the boundaries extracted by our method, respectively. Some areas that have highly developed road networks but low POI densities are overlooked by the POI-based urban built-up area extraction method. The extraction method that combines road networks and POI data can compensate for this limitation, reflecting the superiority of the proposed method. By performing a spatial autocorrelation analysis of the UBUAs extracted by these three methods, we found that most of the areas in which the UBUA extraction results differ are industrial areas around the outskirts of the city and some old communities; these areas have low POI densities and high road densities.
4.4. Quantitative Analysis
To validate the accuracy of the proposed method, the area residuals (Ea) for our method, the road density-based method and the POI density-based method in the case of Dongying city were compared and analyzed using the same data set. The extraction results were assessed using precision, recall and F1 score indicators [31]. Table 1 summarizes the overall accuracy of the proposed method, existing methods and the manual discrimination approach.
The absolute residual area is given by . Precision refers to the ratio of the correctly predicted urban built-up area to the number of predicted UBUAs (Equation (5). Recall refers to the ratio of correctly predicted UBUAs to the number of actual UBUAs (Equation (6). The F1 score evaluates the balance between precision and recall (Equation (7). denotes the area of overlap between the reference UBUAs and extracted UBUAs, describes the area of the extracted UBUAs, and represents the area of the reference UBUAs.
As observed from the results presented in Table 1 and Figure 7, the proposed method is more accurate than the existing methods. The absolute error between the UBUAs extracted by our method and the reference urban built-up area was 0.39%, and this value was 62.8% and 20% lower than the errors of the POI-based and road density-based methods, respectively. Overall, the proposed method and the POI-based method both have recall values greater than 80%, indicating that both methods can effectively extract urban built-up areas and capture the characteristics of urban built-up areas. The road density-based method performed poorly compared with the other two methods. The precision of the proposed method is 4% and 18% higher, respectively, than that of the existing methods, suggesting that the proposed method provides more accurate built-up areas descriptions and can identify built-up areas with high accuracy. Moreover, the F1 score of the proposed method is substantially higher than the scores of the existing methods. This finding demonstrates that the proposed method notably outperforms the existing methods in terms of the UBUA extraction accuracy and verifies that the accuracy of UBUA extraction can be improved by considering multiple constraints. However, Table 1 indicates that our method may overlook certain urban built-up areas or misidentify some non-built-up areas as urban built-up areas. These errors generally occur in the areas with low road networks and POI densities that may be either caused by data gaps or associated with areas of future development or undeveloped infrastructure.
5. Discussion
5.1. Advantages of Urban Built-Up Area by PREANI
Accurate extraction of urban built-up areas is of great significance for assessing the urbanization process. It is difficult to identify urban built-up areas objectively and accurately with single-source data [23]. Therefore, to evaluate urban built-up areas more accurately, many studies have used multisource data to identify urban built-up areas.
Recently, by considering that the urban built-up areas are not only the embodiment of urban expansion but also the main carrier of urban activities, research that integrates NTL data with POI data and road network data to capture urban built-up areas has become popular. Integration with social factors can effectively compensate for the shortcomings of low resolution and the blooming effect of NTL. However, although the accuracy of the built-up area extraction is increased by integrating data with one social factor, the result for the urban built-up area extracted by NTL data still show limitations. For methods that integrate road networks, the results show misclassification of the areas with higher lighting values but low road density in built-up areas (new economic development zones/industrial zones). For methods that integrate POI, the results show the misclassification of the areas with low lighting values and low POI in built-up areas (old communities). Both the road network and POIs influence the urban spatial pattern. Therefore, this paper proposed the novel PREANI urban index and first combined the EVI, POI, road network and NTL data to extract urban built-up areas. POIs and road networks are based on social sensing, while EVIs are based on natural sensing. All of these are strongly correlated with urban built-up areas. Due to its good correlation with built-up areas, PREANI can enhance the identification of urban built-up areas. Moreover, compared with the extraction method based on remote-sensed images, this index proposed in this paper is intuitive and easy to implement, which is very useful for large scale urban built-up area extraction.
5.2. Applications of the Proposed Method
With the rapid development of urbanization, the challenge becomes how to formulate a reasonable policy for land use planning, in order to ensure the orderly expansion of a city. Accurate urban built-up area data are necessary information for urban planning [25], so it is significant to grasp the dynamic changes of an urban built-up area for the adjustment of urban land planning in the next year or further into the future. Facing the rapid development of a city, an economical, fast and accurate method for the dynamic extraction of urban built-up area is needed. Compared with the extraction method based on remote-sensed images, the new index proposed in this study is intuitive and easy to implement. Additionally, the extraction results based on the proposed method have te advantages of high precision and consistency with the reference built-up area. Therefore, they can be applied to the extraction of urban built-up areas efficiently and provide certain guiding significance for urban expansion.
For some developed cities, the proposed method can realize the rapid dynamic update and dynamic analysis of urban built-up area, provide a useful supplement for the existing/previous urban built-up area data, and has a certain guiding significance for future urban expansion, urban function and structure dynamic adjustment. For underdeveloped territories, based on open source data, such as nighttime lighting data, POI data provided by Google or other maps, and road network provided by Open Street Map, the boundaries of urban built-up areas can be preliminarily delineated easily, which provides a scientific basis for future urban land planning.
5.3. The Methodological Implications: Choose the Appropriate Approaches
Many existing studies have obtained urban built-up areas by using different data and methods across different cities, and their results generally have high extraction accuracy and feasibility. However, different cities have different spatial characteristics of urban areas, and urban built-up areas may produce various results by using different methods.
In our paper, the proposed method was validated by the actual data in Dongying city. By comparing different methods, the experimental results demonstrated that the proposed method and the POI-based method performed better than the road-based method. This is mainly because Dongying city is a young city with developed enterprises, and in recent years has been committed to developing new economic development zones as newly urban built-up areas outside the original built-up area. Many commercial buildings and enterprises are distributed in these new economic development zones, resulting in a significant increase in the POI data. However, compared with the original developed urban area and some residential areas, the road density in the new economic development zones is relatively low. Hence, the method that integrates NTL with road networks performs poorly in Dongying city. For further research on urban built-up area extraction, choosing the appropriate approaches that are suitable for the urban area characteristics of the city in question is crucial. For areas with more new development zones, such as Dongying city, it is preferable to adopt POI data for urban built-up area extraction. For areas with a greater number of old urban areas, adoption of the road network data can better capture the urban spatial characteristics. The best performance is obtained by adopting both the POI data and the road networks data.
In the future, urban built-up area extraction for will be tested for more cities using our method and the existing method to provide more detailed information for the future study of urban area analysis.
5.4. Limitations and Future Reseach
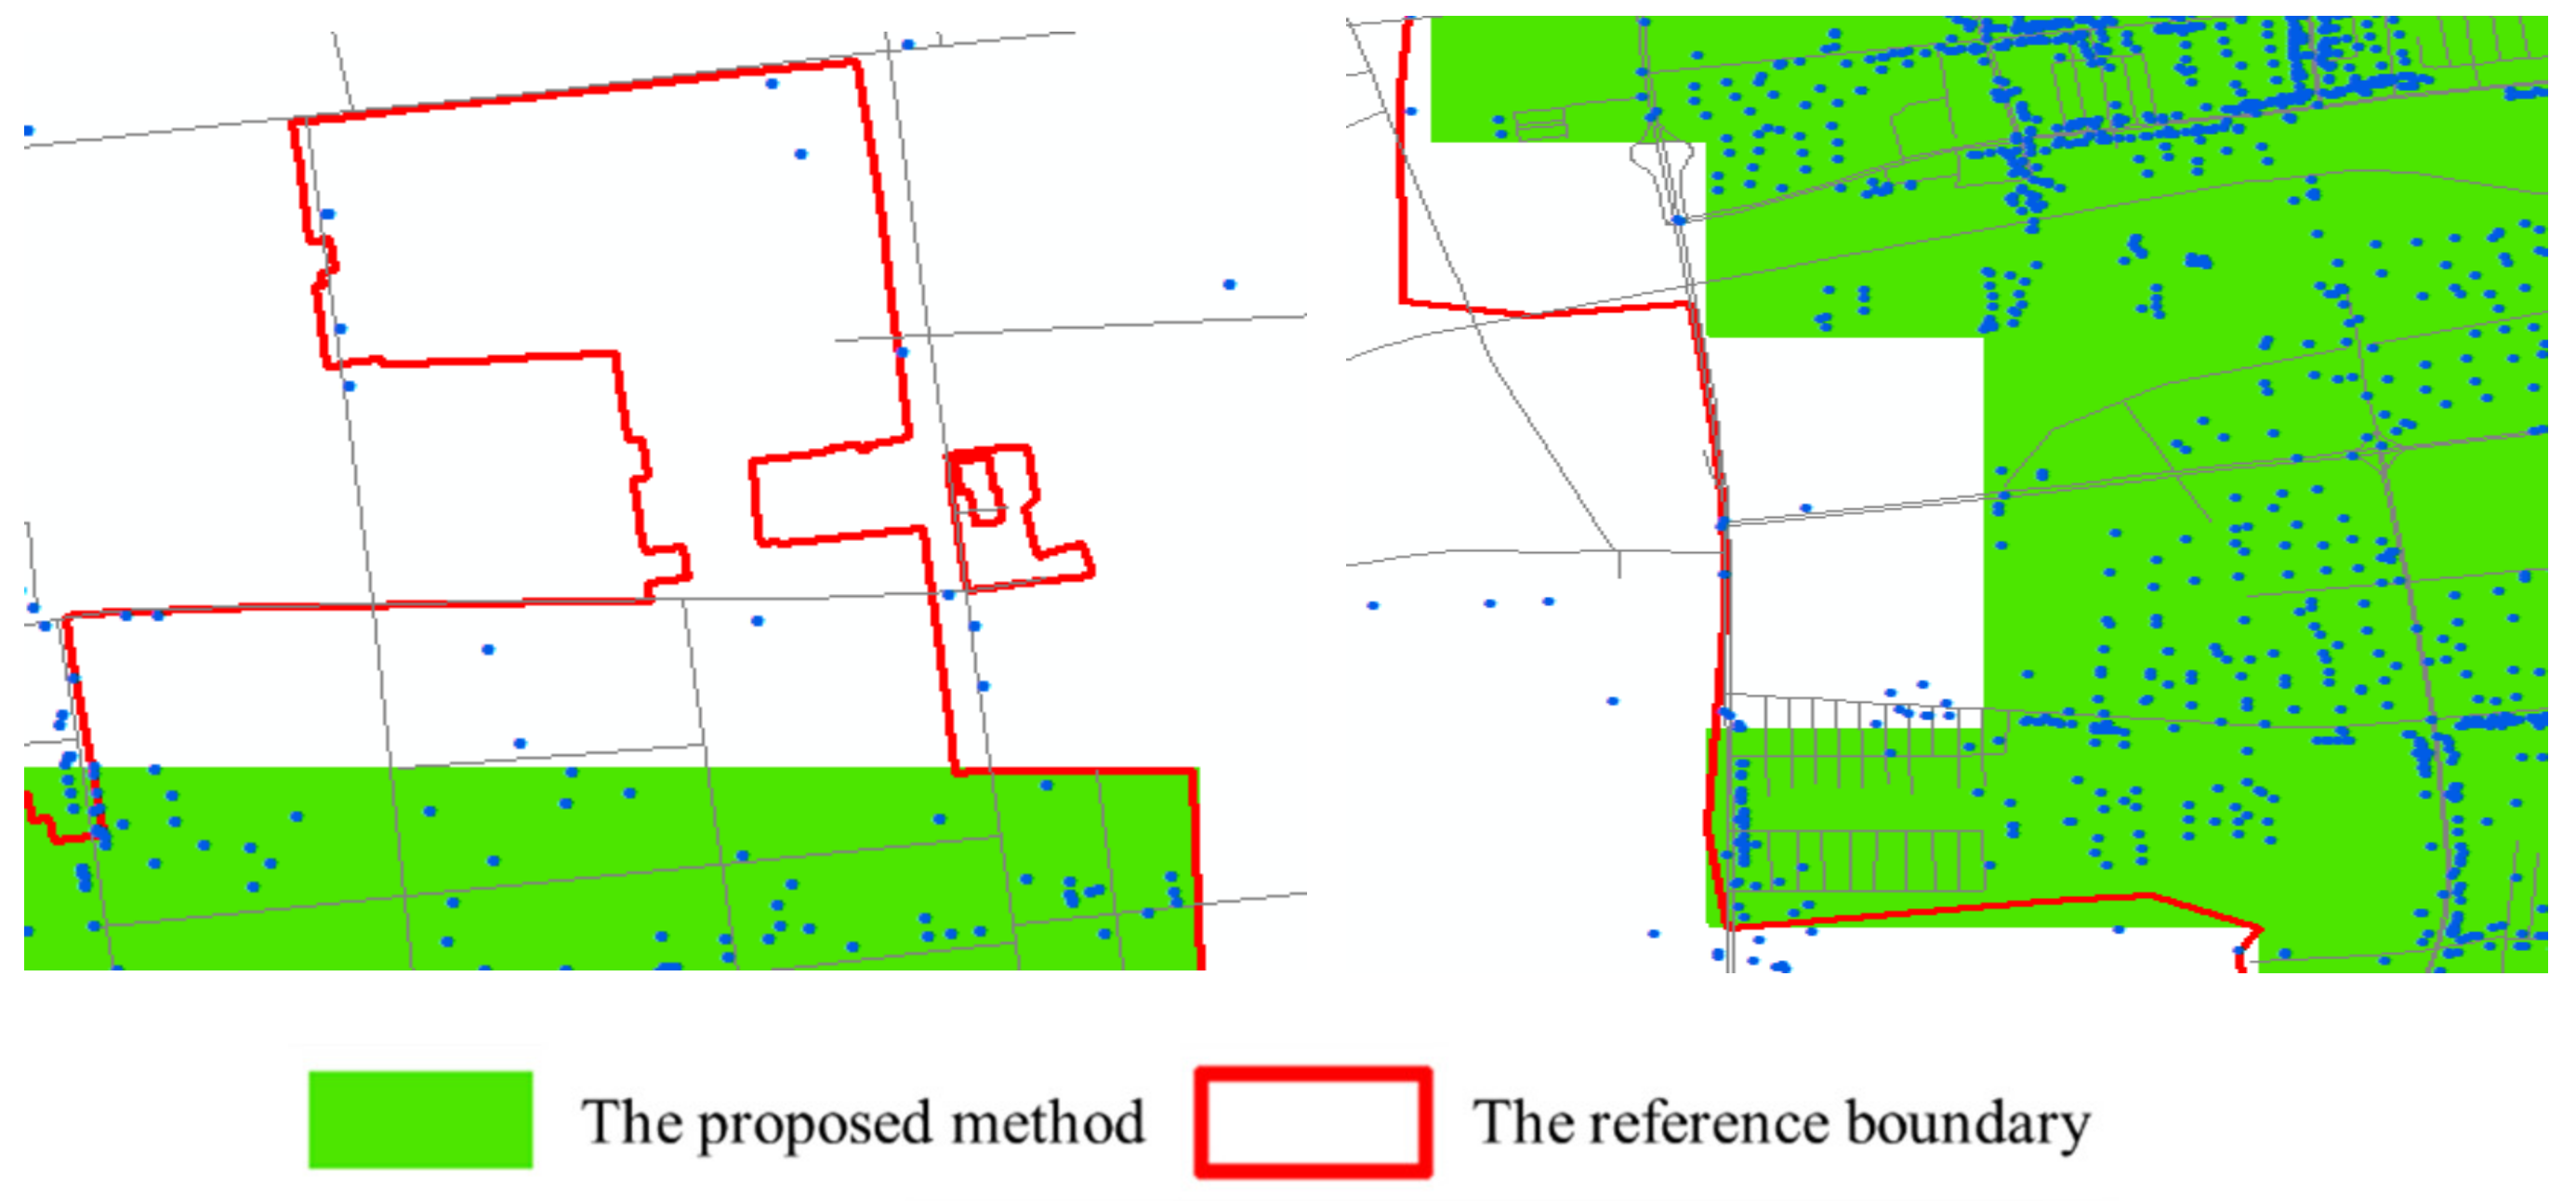
In this paper, the built-up areas extracted by the proposed method are compared with the reference urban built-up area data from field surveys, and the results indicate that the proposed method still has some limitations, particularly for built-up area extraction in areas with low POI and road network densities, as illustrated in Figure 8. Notably, some such areas have not yet been fully developed, such as urban–rural transition zones and urban areas with to-be-developed infrastructure. In future research, we will improve the extraction accuracy of built-up areas by including remote sensing images and other data in the proposed approach.
6. Conclusions
This paper proposes an urban built-up area extraction method (PREANI) that considers EVI, POI, road density, and NTL constraints, to overcome the limitations of the existing method and to improve the urban built-up area extraction accuracy. PREANI was evaluated quantitatively and qualitatively by comparing it with PEANI and the REANI. The experimental results prove that the UBUA extraction accuracy is effectively enhanced, achieving the first goal of this study. The proposed method was validated using actual data from Dongying, Shandong Province. The main conclusions are as follows.
- (1)
- With regard to the overall accuracy, the UBUA boundaries extracted by the proposed method are highly consistent with the reference UBUA boundaries. Through difference comparisons, 22 differences between the proposed method and the road density-based method and 17 differences between the proposed method and the POI-based method were identified.
- (2)
- For local accuracy, UBUA extraction based on the proposed method is superior to that with existing methods in the areas with low POI densities and high road densities (e.g., new industrial areas) and the areas with low road densities and high POI densities (e.g., urban–rural transition zones). However, our method may have limitations in the areas with low road and POI densities.
- (3)
- Quantitative analysis showed that the recall values of built-up area extraction for both the proposed and POI-based methods are above 80%. However, in terms of the precision and F1 score, the proposed method yields values that are superior by at least 4% and 0.04, respectively, to those of the other methods, demonstrating that the proposed method considerably outperforms the existing method in terms of UBUA extraction accuracy.
The proposed method in this paper depends on the POI and road density data, and is prone to overlook urban built-up areas in the areas with low POI and road densities. In the future, we may consider the incorporation of additional types of data, such as land use data, in order to improve the accuracy of UBUA extraction in these scenarios. In addition, since the urban characteristics of each region can vary significantly, we will validate our method in additional regions and locations to test its generality in cities with different development scale, especially the cities in different countries.
Author Contributions
C.L. conceived the original idea for the study, and all coauthors conceived and designed the methodology. X.W., Z.D. and Z.W. conducted the processing and analysis of the data. C.Z., X.W. and J.Y. drafted the manuscript. All authors read and approved the final manuscript.
Funding
This research was funded by the National Key Research and Development Program of China, 2018YFB2100704; National Natural Science Foundation of China under grant number 41871375 and 41907389.
Institutional Review Board Statement
Not applicable.
Informed Consent Statement
Not applicable.
Conflicts of Interest
The authors declare no conflict of interest.
References
- He, C.; Shi, P.; Xie, D.; Zhao, Y. Improving the normalized difference built-up index to map urban built-up areas using a semiautomatic segmentation approach. Remote Sens. Lett. 2010, 1, 213–221. [Google Scholar] [CrossRef] [Green Version]
- Wang, L.; Zhu, J.; Xu, Y.; Wang, Z. Urban Built-Up Area Boundary Extraction and Spatial-Temporal Characteristics Based on Land Surface Temperature Retrieval. Remote Sens. 2018, 10, 473. [Google Scholar] [CrossRef] [Green Version]
- Li, Q.; Zheng, B.; Tu, B.; Yang, Y.; Wang, Z.; Jiang, W.; Yao, K.; Yang, J. Refining Urban Built-Up Area via Multi-Source Data Fusion for the Analysis of Dongting Lake Eco-Economic Zone Spatiotemporal Expansion. Remote Sens. 2020, 12, 1797. [Google Scholar] [CrossRef]
- Li, Y.; Sun, Q.; Ji, X.; Xu, L.; Lu, C.; Zhao, Y. Defining the Boundaries of Urban Built-up Area Based on Taxi Trajectories: A Case Study of Beijing. J. Geovisualization Spat. Anal. 2020, 4, 8. [Google Scholar] [CrossRef]
- Rizeei, H.; Pradhan, B.; Saharkhiz, M. Urban object extraction using Dempster Shafer feature-based image analysis from worldview-3 satellite imagery. Int. J. Remote Sens. 2019, 40, 3. [Google Scholar]
- Cheng, F.; Liu, S.; Hou, X.; Zhang, Y.; Dong, S.; Coxixo, A.; Liu, G. Urban Land Extraction Using DMSP/OLS Nighttime Light Data and OpenStreetMap Datasets for Cities in China at Different Development Levels. IEEE J. Sel. Top. Appl. Earth Obs. Remote Sens. 2018, 11, 1–13. [Google Scholar] [CrossRef]
- Tan, J.; Zhang, M.; Tan, X. Methods for Extracting Urban Construction Land Using Night-Light Data: Assessment and Application. In Proceedings of the 2018 26th International Conference on Geoinformatics, Kunming, China, 28–30 June 2018; pp. 1–4. [Google Scholar]
- Yu, B.; Tang, M.; Wu, Q.; Yang, C.; Deng, S.; Shi, K.; Peng, C.; Wu, J. Urban Built-Up Area Extraction from Log- Transformed NPP-VIIRS Nighttime Light Composite Data. IEEE Geosci. Remote Sens. Lett. 2018, 15, 1279–1283. [Google Scholar] [CrossRef]
- Ou, J.P.; Liu, X.P.; Liu, P.H.; Liu, X.J. Evaluation of Luojia 1-01 nighttime light imagery for impervious surface detection: A comparison with NPP-VIIRS nighttime light data. Int. J. Appl. Earth Obs. Geoinf. 2019, 81, 1–12. [Google Scholar] [CrossRef]
- Liu, X.; Hu, G.; Ai, B.; Li, X.; Shi, Q. A normalized urban areas composite index (NUACI) based on combination of DMSP/OLS and MODIS for napping impervious surface area. Remote Sens. 2015, 7, 17168–17189. [Google Scholar] [CrossRef] [Green Version]
- Wang, R.; Wan, B.; Guo, Q.; Hu, M.; Zhou, S. Mapping Regional Urban Extent Using NPP-VIIRS DNB and MODIS NDVI Data. Remote Sens. 2017, 9, 862. [Google Scholar] [CrossRef] [Green Version]
- Hsu, F.C.; Baugh, K.E.; Ghosh, T.; Zhizhin, M.; Elvidge, C.D. DMSP-OLS radiance calibrated nighttime lights time series with intercalibration. Remote Sens. 2015, 7, 1855–1876. [Google Scholar] [CrossRef] [Green Version]
- Tselios, V.; Stathakis, D. Exploring regional and urban clusters and patterns in Europe using satellite observed lighting. Environ. Plan. B Urban Anal. City Sci. 2020, 47, 553–568. [Google Scholar] [CrossRef]
- Duque, J.; Lozano-Gracia, N.; Patino, J.; Restrepo, P.; Velasquez, W.A. Spatiotemporal dynamics of urban growth in Latin American cities: An analysis using nighttime light imagery. Landsc. Urban Plan. 2019, 191, 103640. [Google Scholar] [CrossRef]
- Pandey, B.; Joshi, P.K.; Seto, K.C. Monitoring urbanization dynamics in India using DMSP/OLS night time lights and SPOT-VGT data. Int. J. Appl. Earth Obs. Geoinf. 2013, 23, 49–61. [Google Scholar] [CrossRef]
- Li, F.; Yan, Q.; Zou, Y.; Liu, B. Improving the accuracy of built-up area extraction based on nighttime light data and POI: A case study of NPP/VIIRS and Luojia 1-01 nighttime light images. Geomat. Inf. Sci. Wuhan Univ. 2021, 1–14. [Google Scholar]
- Sharma, R.; Tateishi, R.; Hara, K.; Gharechelou, S.; Iizuka, K. Global mapping of urban built-up areas of year 2014 by combining MODIS multispectral data with VIIRS nighttime light data. Int. J. Digit. Earth 2016, 9, 1–17. [Google Scholar] [CrossRef]
- Min, X.; Chunyang, H.; Zhifeng, L.; Dou, Y. How did urban land expand in China between 1992 and 2015. A multi-scale landscape analysis. PLoS ONE 2016, 11, e0154839. [Google Scholar]
- Zhuo, L.; Zhang, X.; Zheng, J.; Tao, H.; Guo, Y. An EVI-based method to reduce saturation of DMSP/OLS nighttime light data. Acta Geogr. Sin. 2015, 70, 1339–1350. [Google Scholar]
- Zhang, X.Y.; Li, P.J. A temperature and vegetation adjusted NTL urban index for urban area mapping and analysis. ISPRS J. Photogramm. Remote Sens. 2018, 135, 93–111. [Google Scholar] [CrossRef]
- Zheng, Z.; Chen, X.; Wu, Z.; Zhang, Q. Method to reduce saturation of DMSP/OLS nighttime light data based on UNL. J. Remote Sens. 2018, 22, 161–173. [Google Scholar]
- Yan, Q.; Li, F.; Li, L. Research on built-up area extraction via brightness correction indexes based on two kinds of nighttime light images. J. Geo-Inf. Sci. 2020, 22, 1714–1724. [Google Scholar]
- He, X.; Zhou, C.; Zhang, J.; Yuan, X. Using Wavelet Transforms to Fuse Nighttime Light Data and POI Big Data to Extract Urban Built-Up Areas. Remote Sens. 2020, 12, 3887. [Google Scholar] [CrossRef]
- Xu, Z.; Gao, X. A novel method for identifying the boundary of urban built-up areas with POI data. Acta Geogr. Sin. 2016, 71, 928–939. [Google Scholar]
- Li, F.; Yan, Q.; Bian, Z.; Liu, B.; Wu, Z. A POI and LST adjusted NTL urban index for urban built-up area extraction. Sensors 2020, 20, 2918. [Google Scholar] [CrossRef]
- Mao, J.; Yan, X. A study to the impacts on urban land use of transport system in highly-densely developed city—A case study of Guangzhou. Econ. Geogr. 2005, 25, 185–188+210. [Google Scholar]
- Li, B. Layout evolution and optimization of Dongying central city. Urban Rural Dev. 2015, 3, 43–45. [Google Scholar]
- Li, S.; Dragicevic, S.; Castro, F.A.; Sester, M.; Winter, S.; Coltekin, A.; Pettit, C.; Jiang, B.; Haworth, J.; Stein, A. Geospatial big data handling theory and methods: A review and research challenges. ISPRS J. Photogramm. Remote Sens. 2016, 115, 119–133. [Google Scholar] [CrossRef] [Green Version]
- Li, C.; Liu, L.; Dai, Z.; Liu, X. Different Sourcing Point of Interest Matching Method Considering Multiple Constraints. ISPRS Int. J. Geo-Inf. 2020, 9, 214. [Google Scholar] [CrossRef] [Green Version]
- Lou, G.; Chen, Q.; He, K.; Zhou, Y.; Shi, Z. Using Nighttime Light Data and POI Big Data to Detect the Urban Centers of Hangzhou. Remote Sens 2019, 11, 1821. [Google Scholar] [CrossRef] [Green Version]
- Lüscher, P.; Weibel, R. Exploiting empirical knowledge for automatic delineation of city centres from large-scale topographic databases. Comput. Environ. Urban Syst. 2013, 37, 18–34. [Google Scholar] [CrossRef] [Green Version]
Figure 1.
Limitations of the current UBUA extraction methods. (a) Limitation of road density-based methods; (b) Limitation of POI-based methods.
Figure 1.
Limitations of the current UBUA extraction methods. (a) Limitation of road density-based methods; (b) Limitation of POI-based methods.
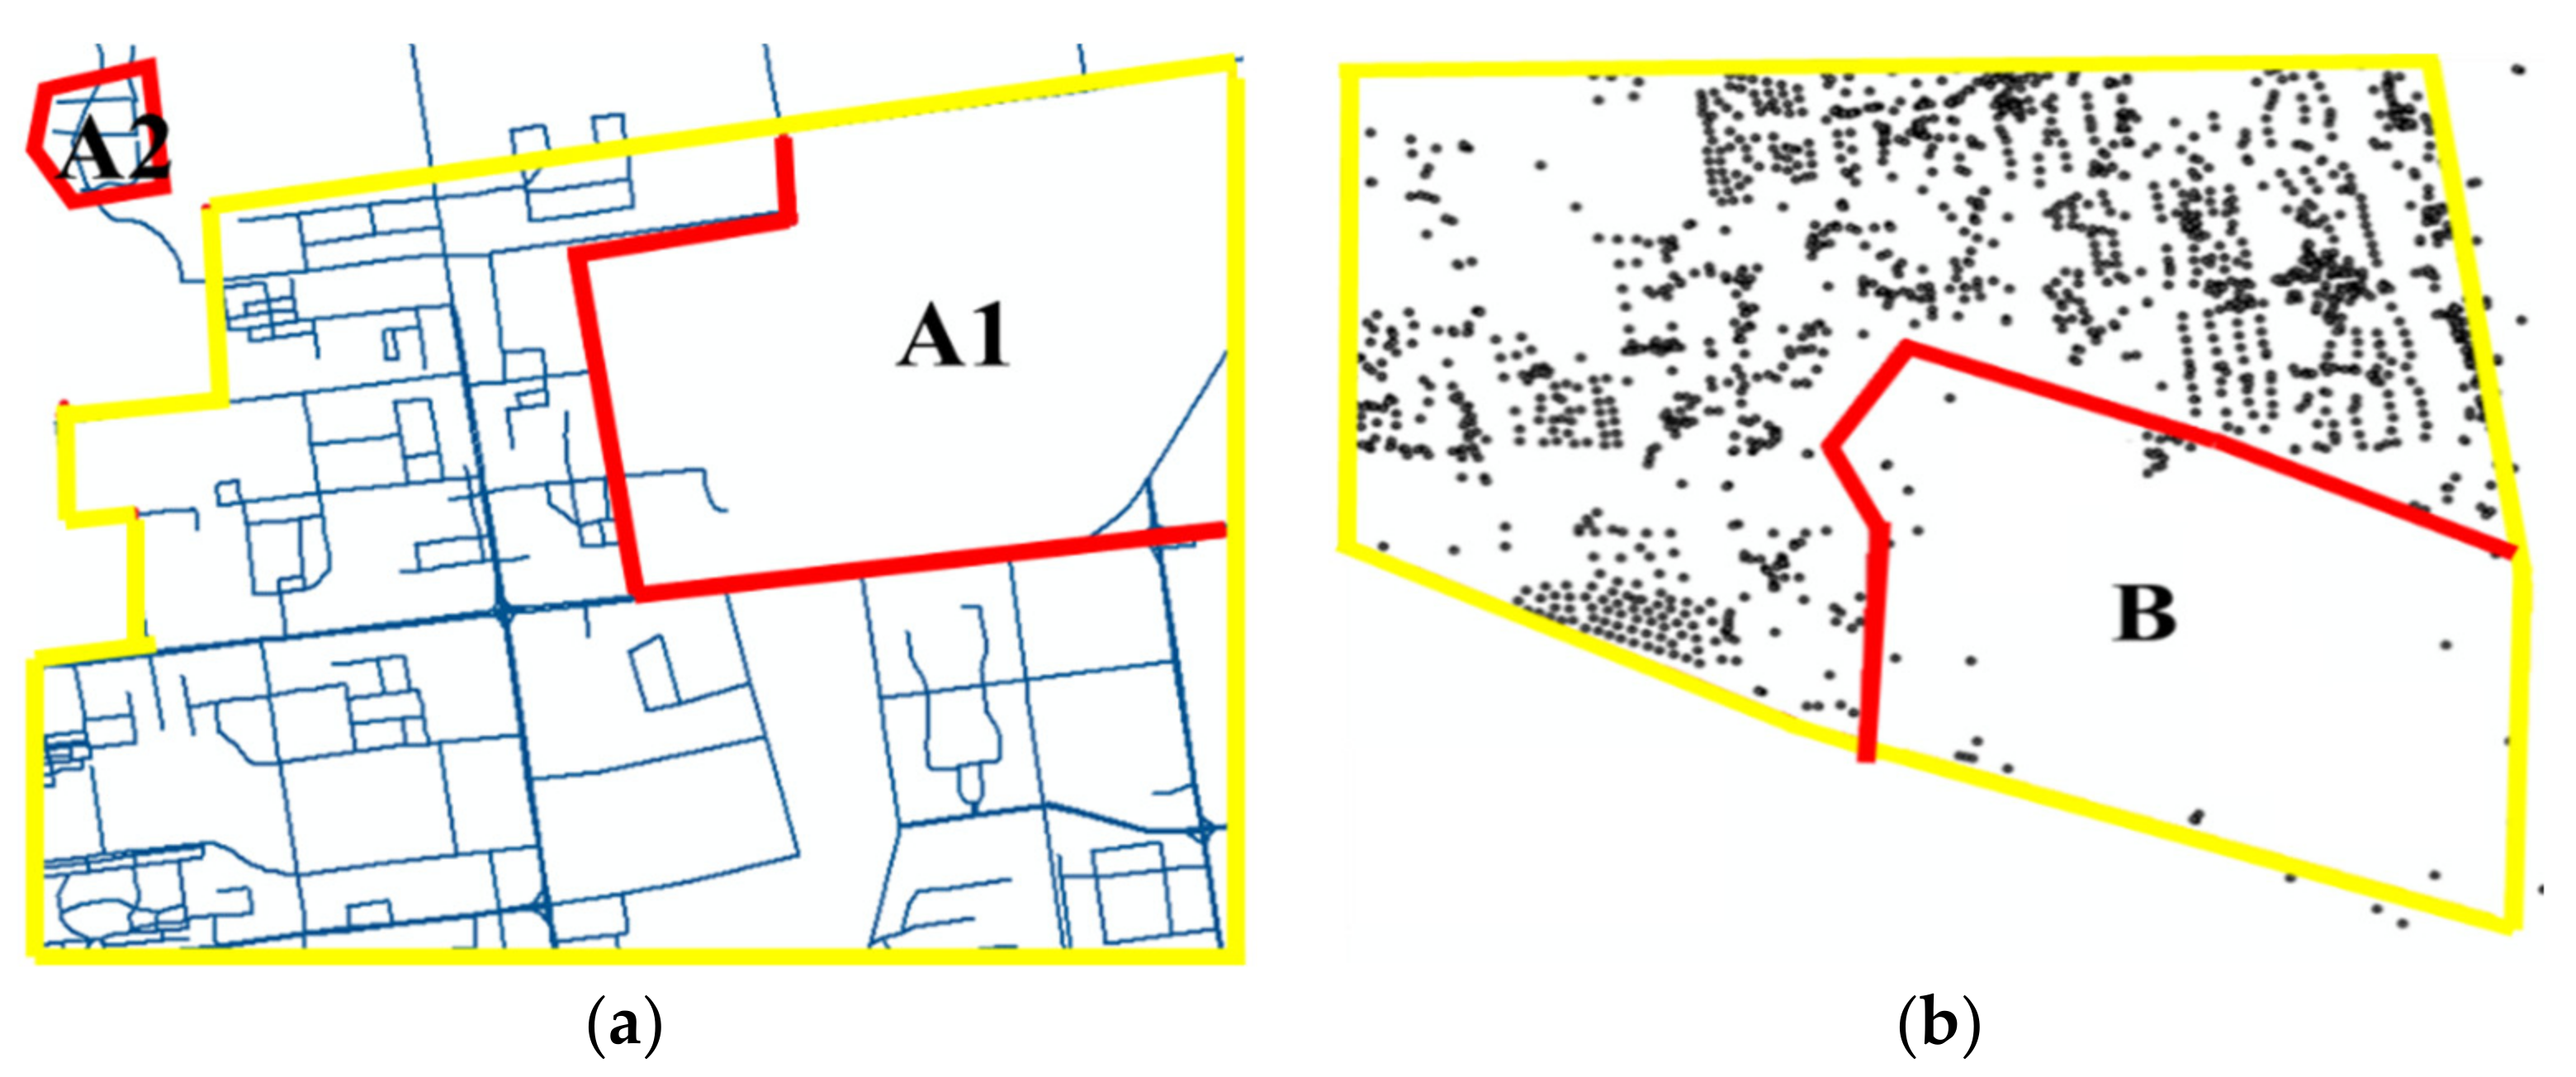
Figure 2.
Sensitivity analysis based on bandwidth selection.
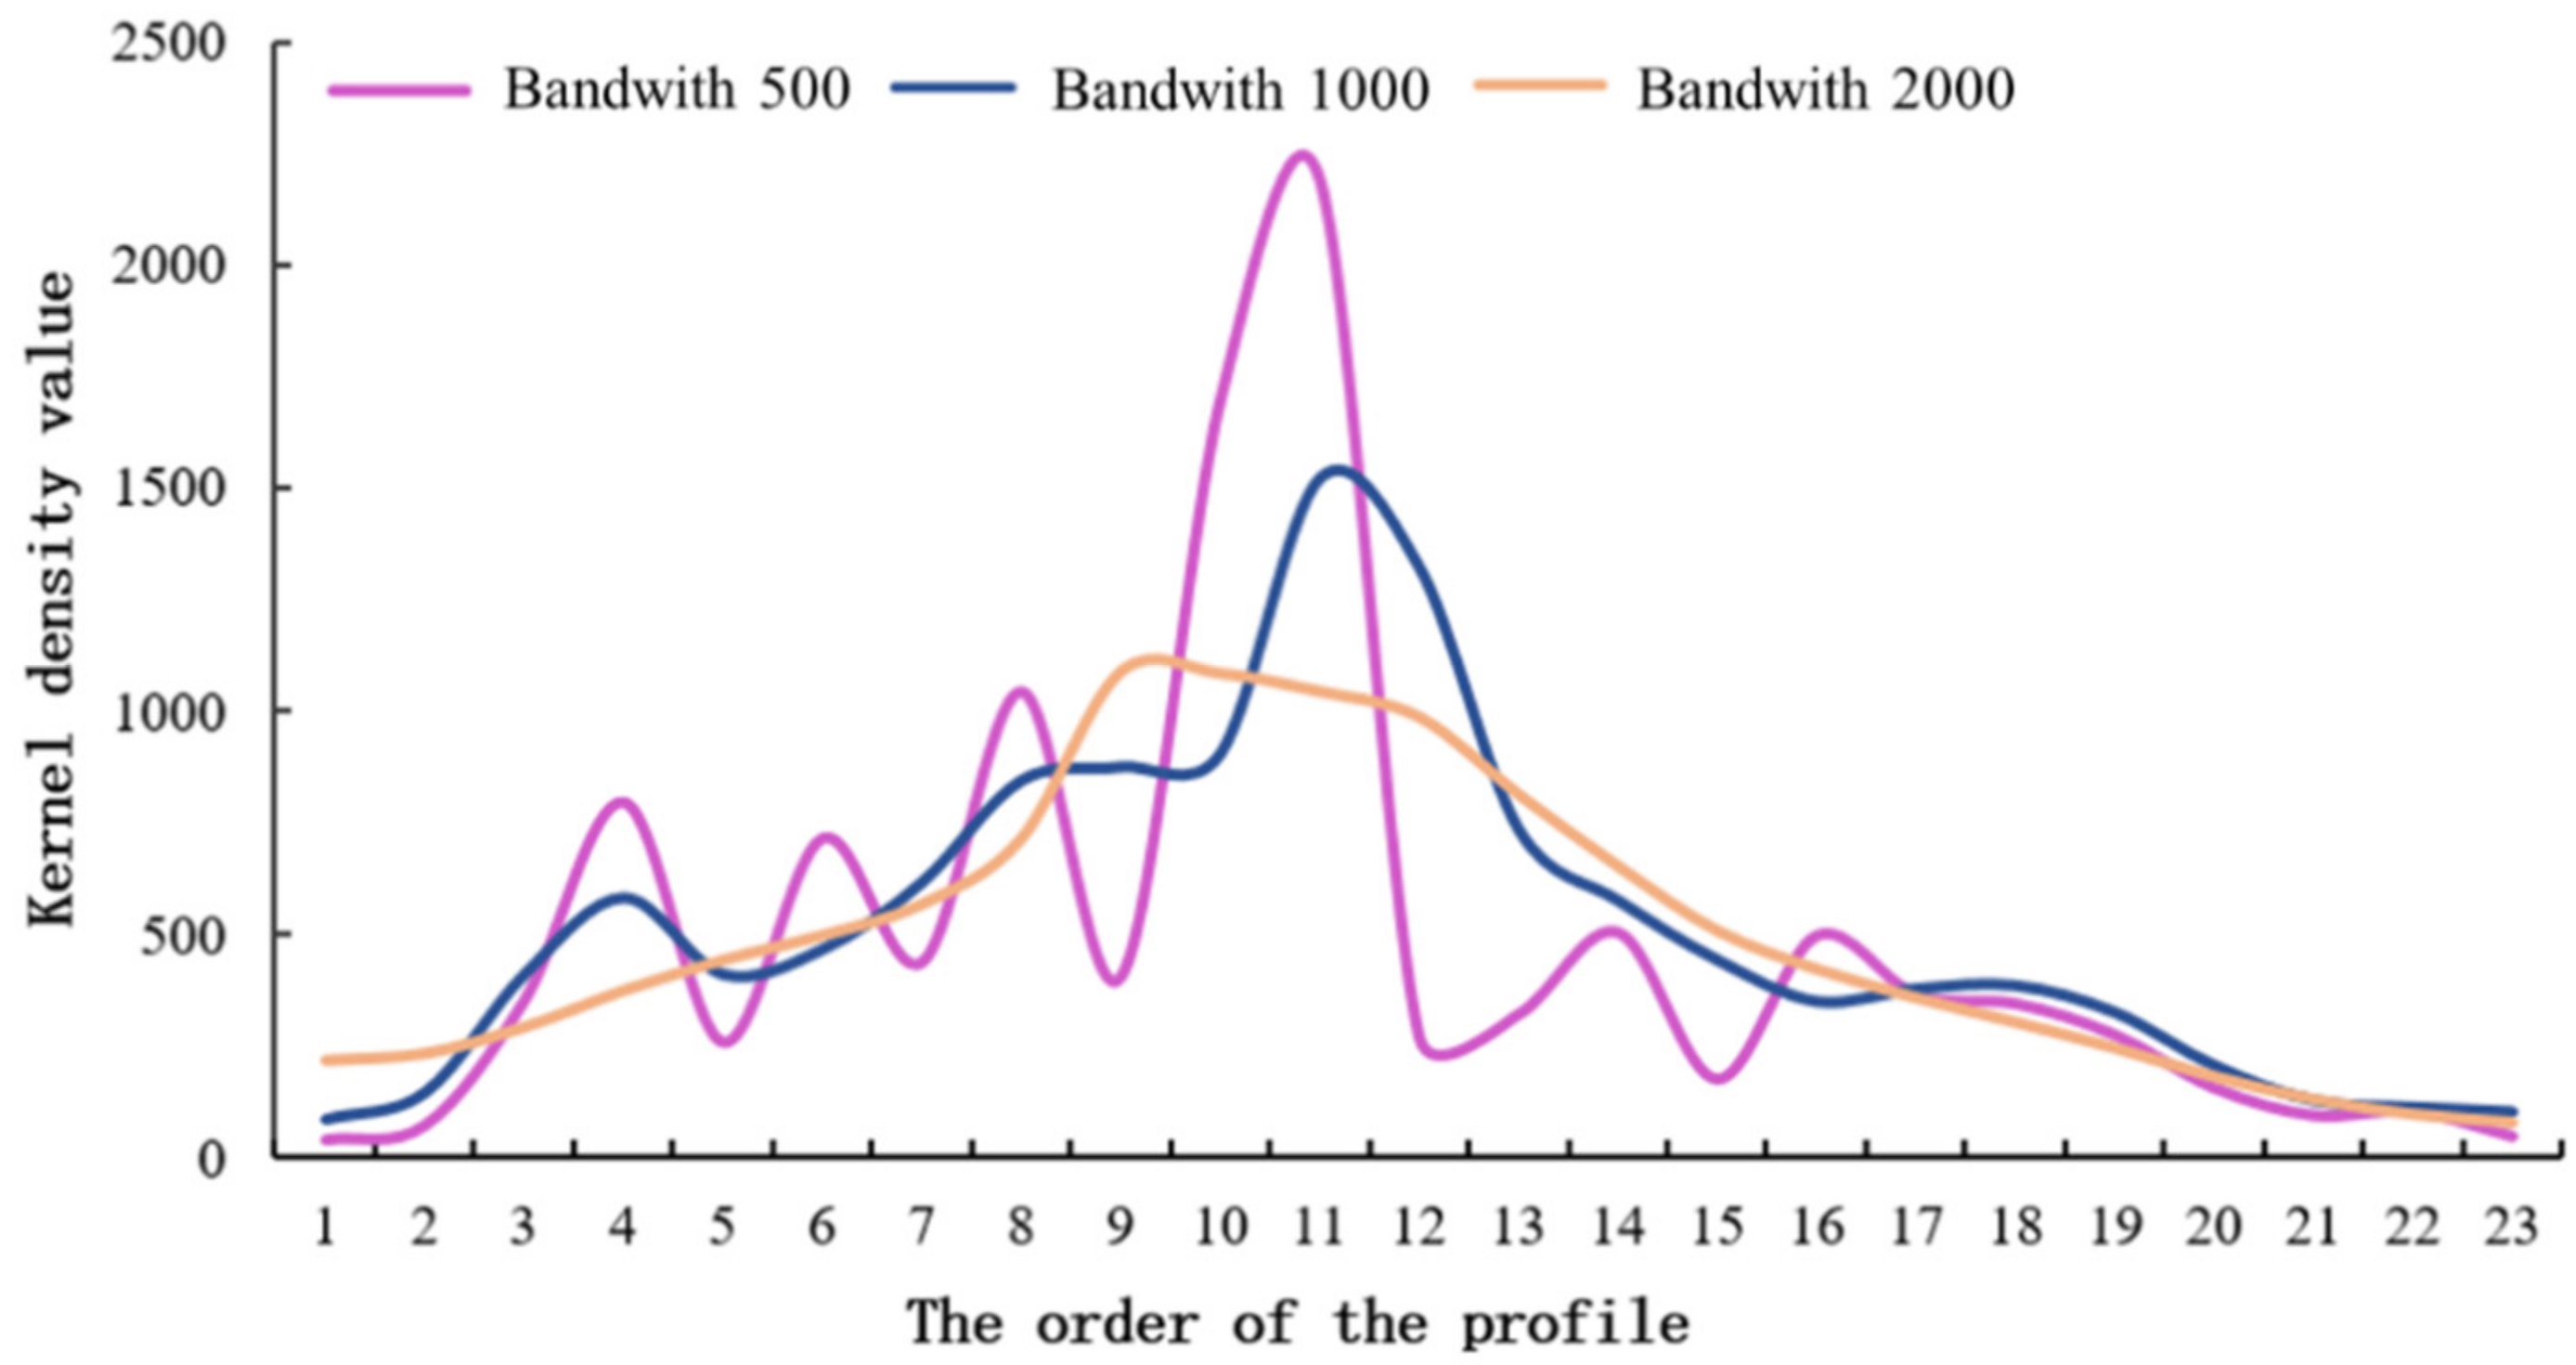
Figure 3.
The experimental data used in this paper: (a) POI data; (b) road network data; (c) EVI data; (d) NPP/VIIRS nighttime light data.
Figure 3.
The experimental data used in this paper: (a) POI data; (b) road network data; (c) EVI data; (d) NPP/VIIRS nighttime light data.
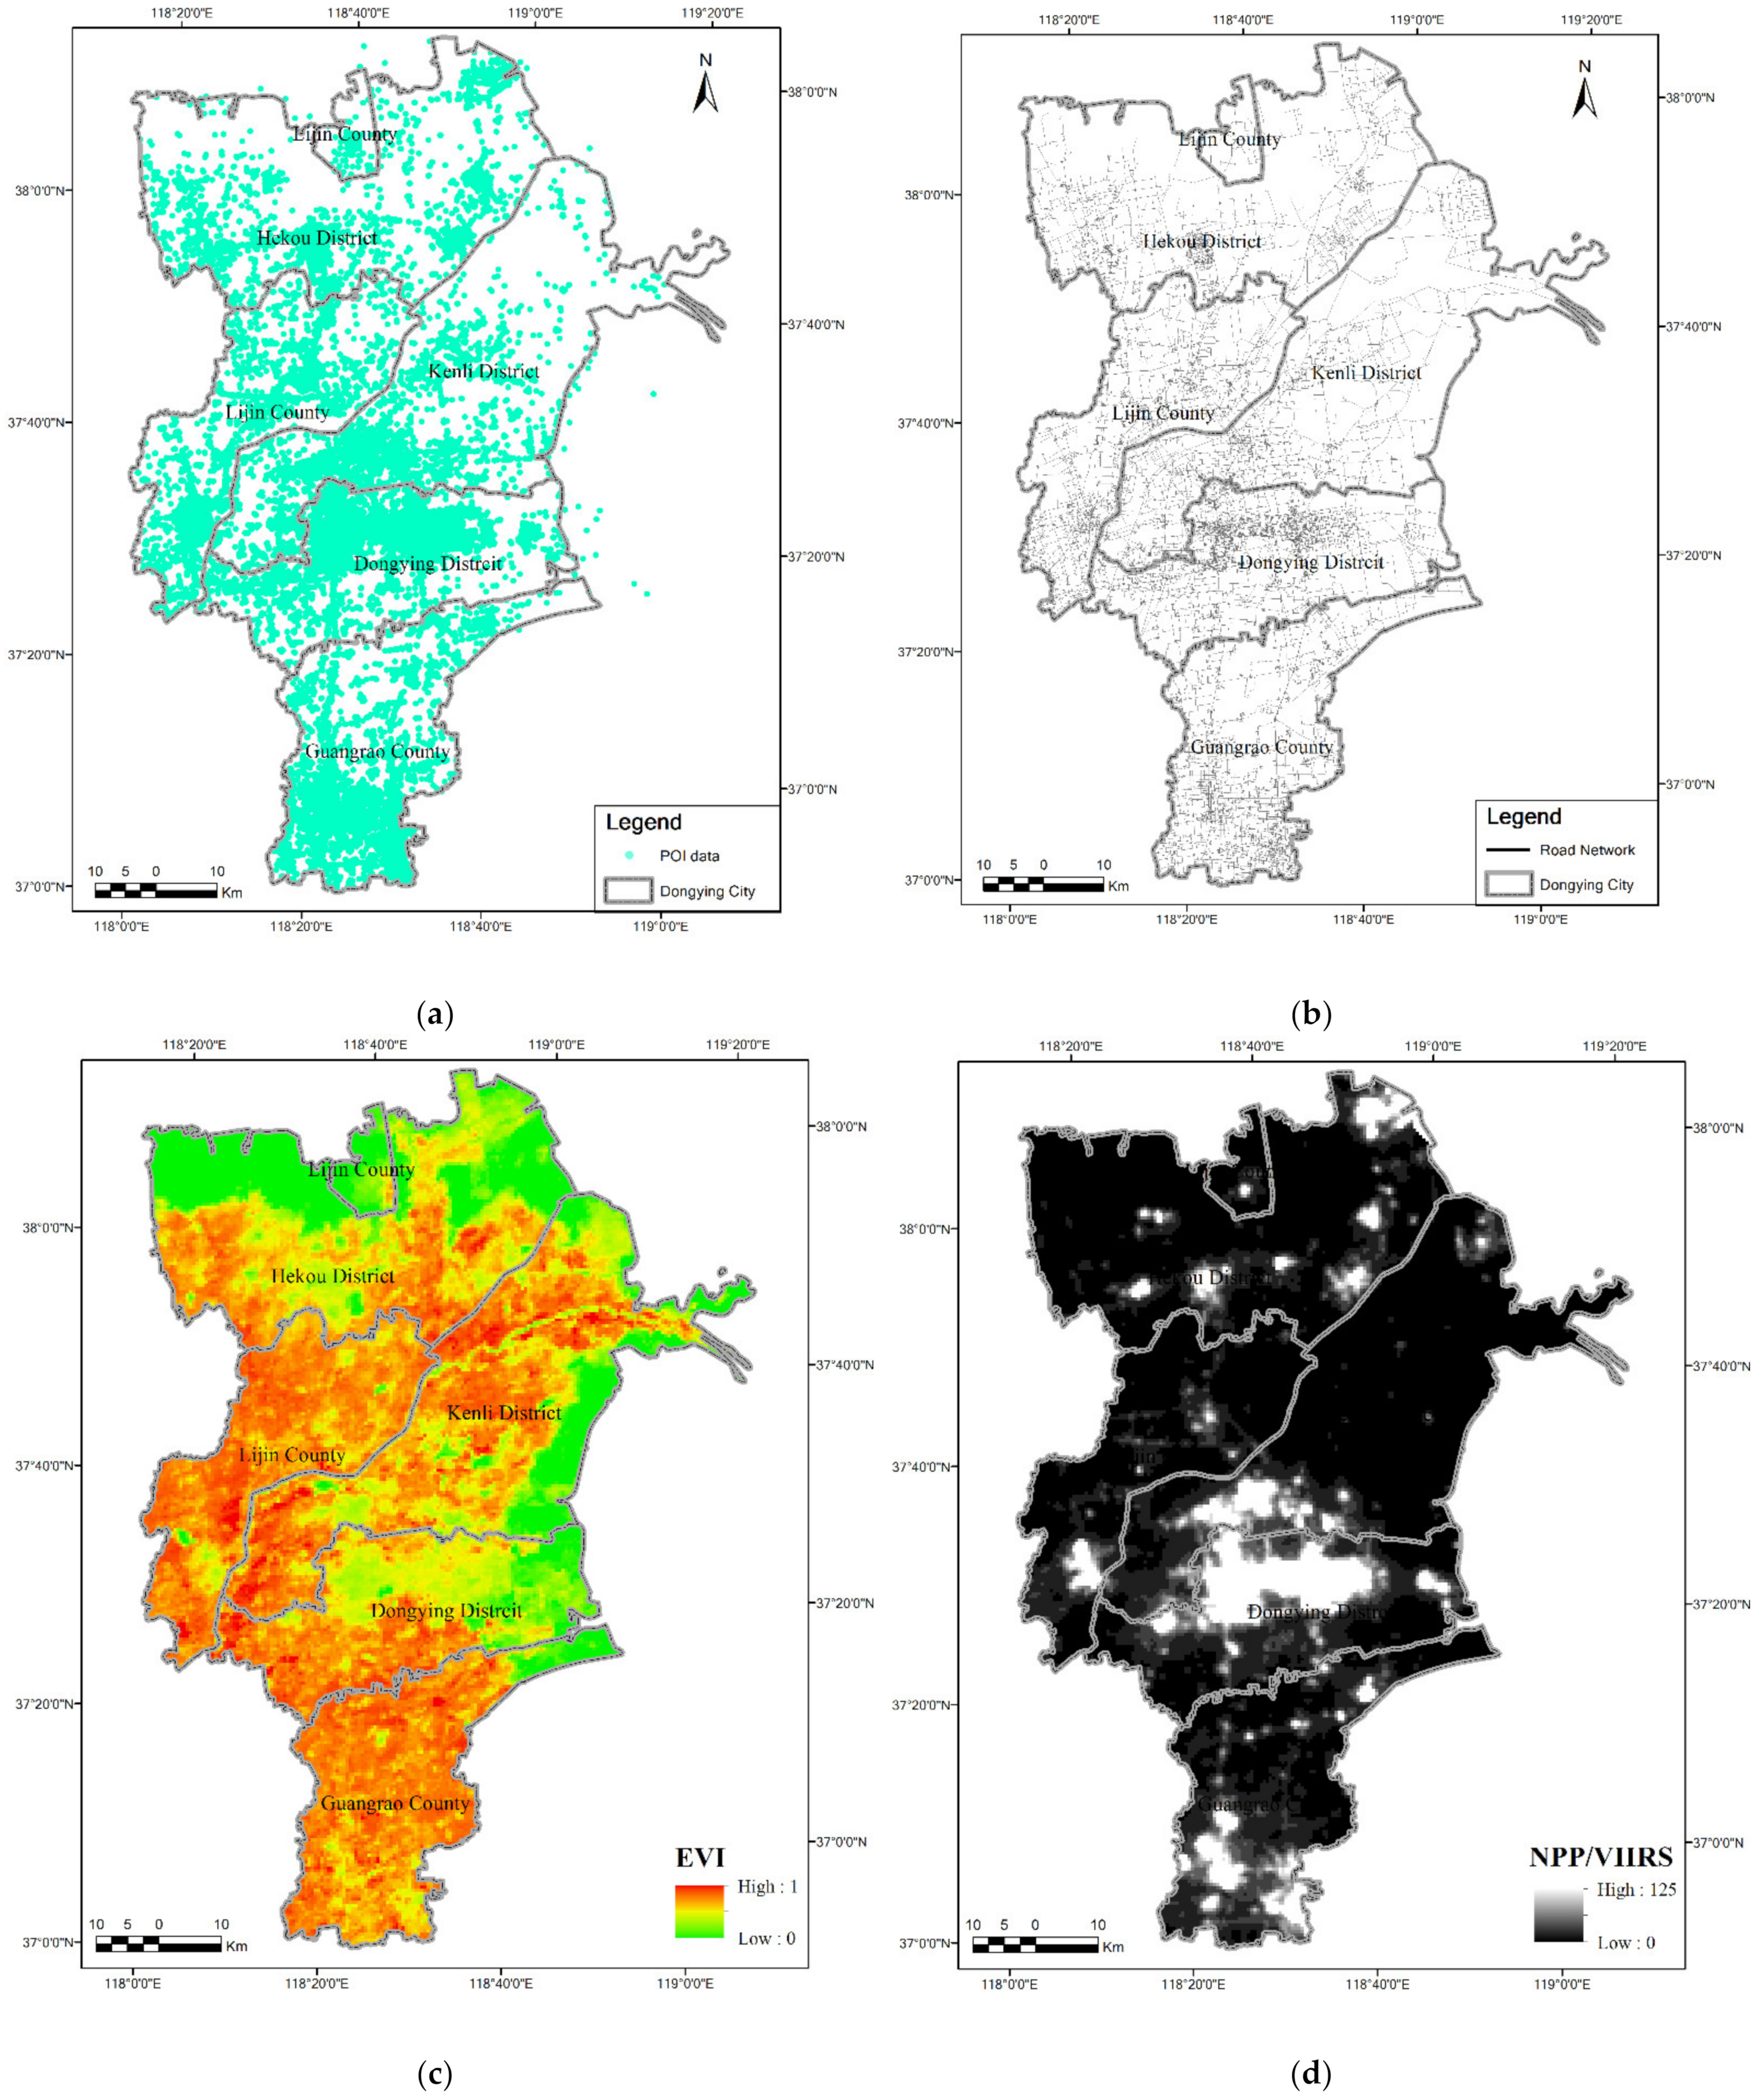
Figure 4.
Comparison of different UBUA extraction methods.
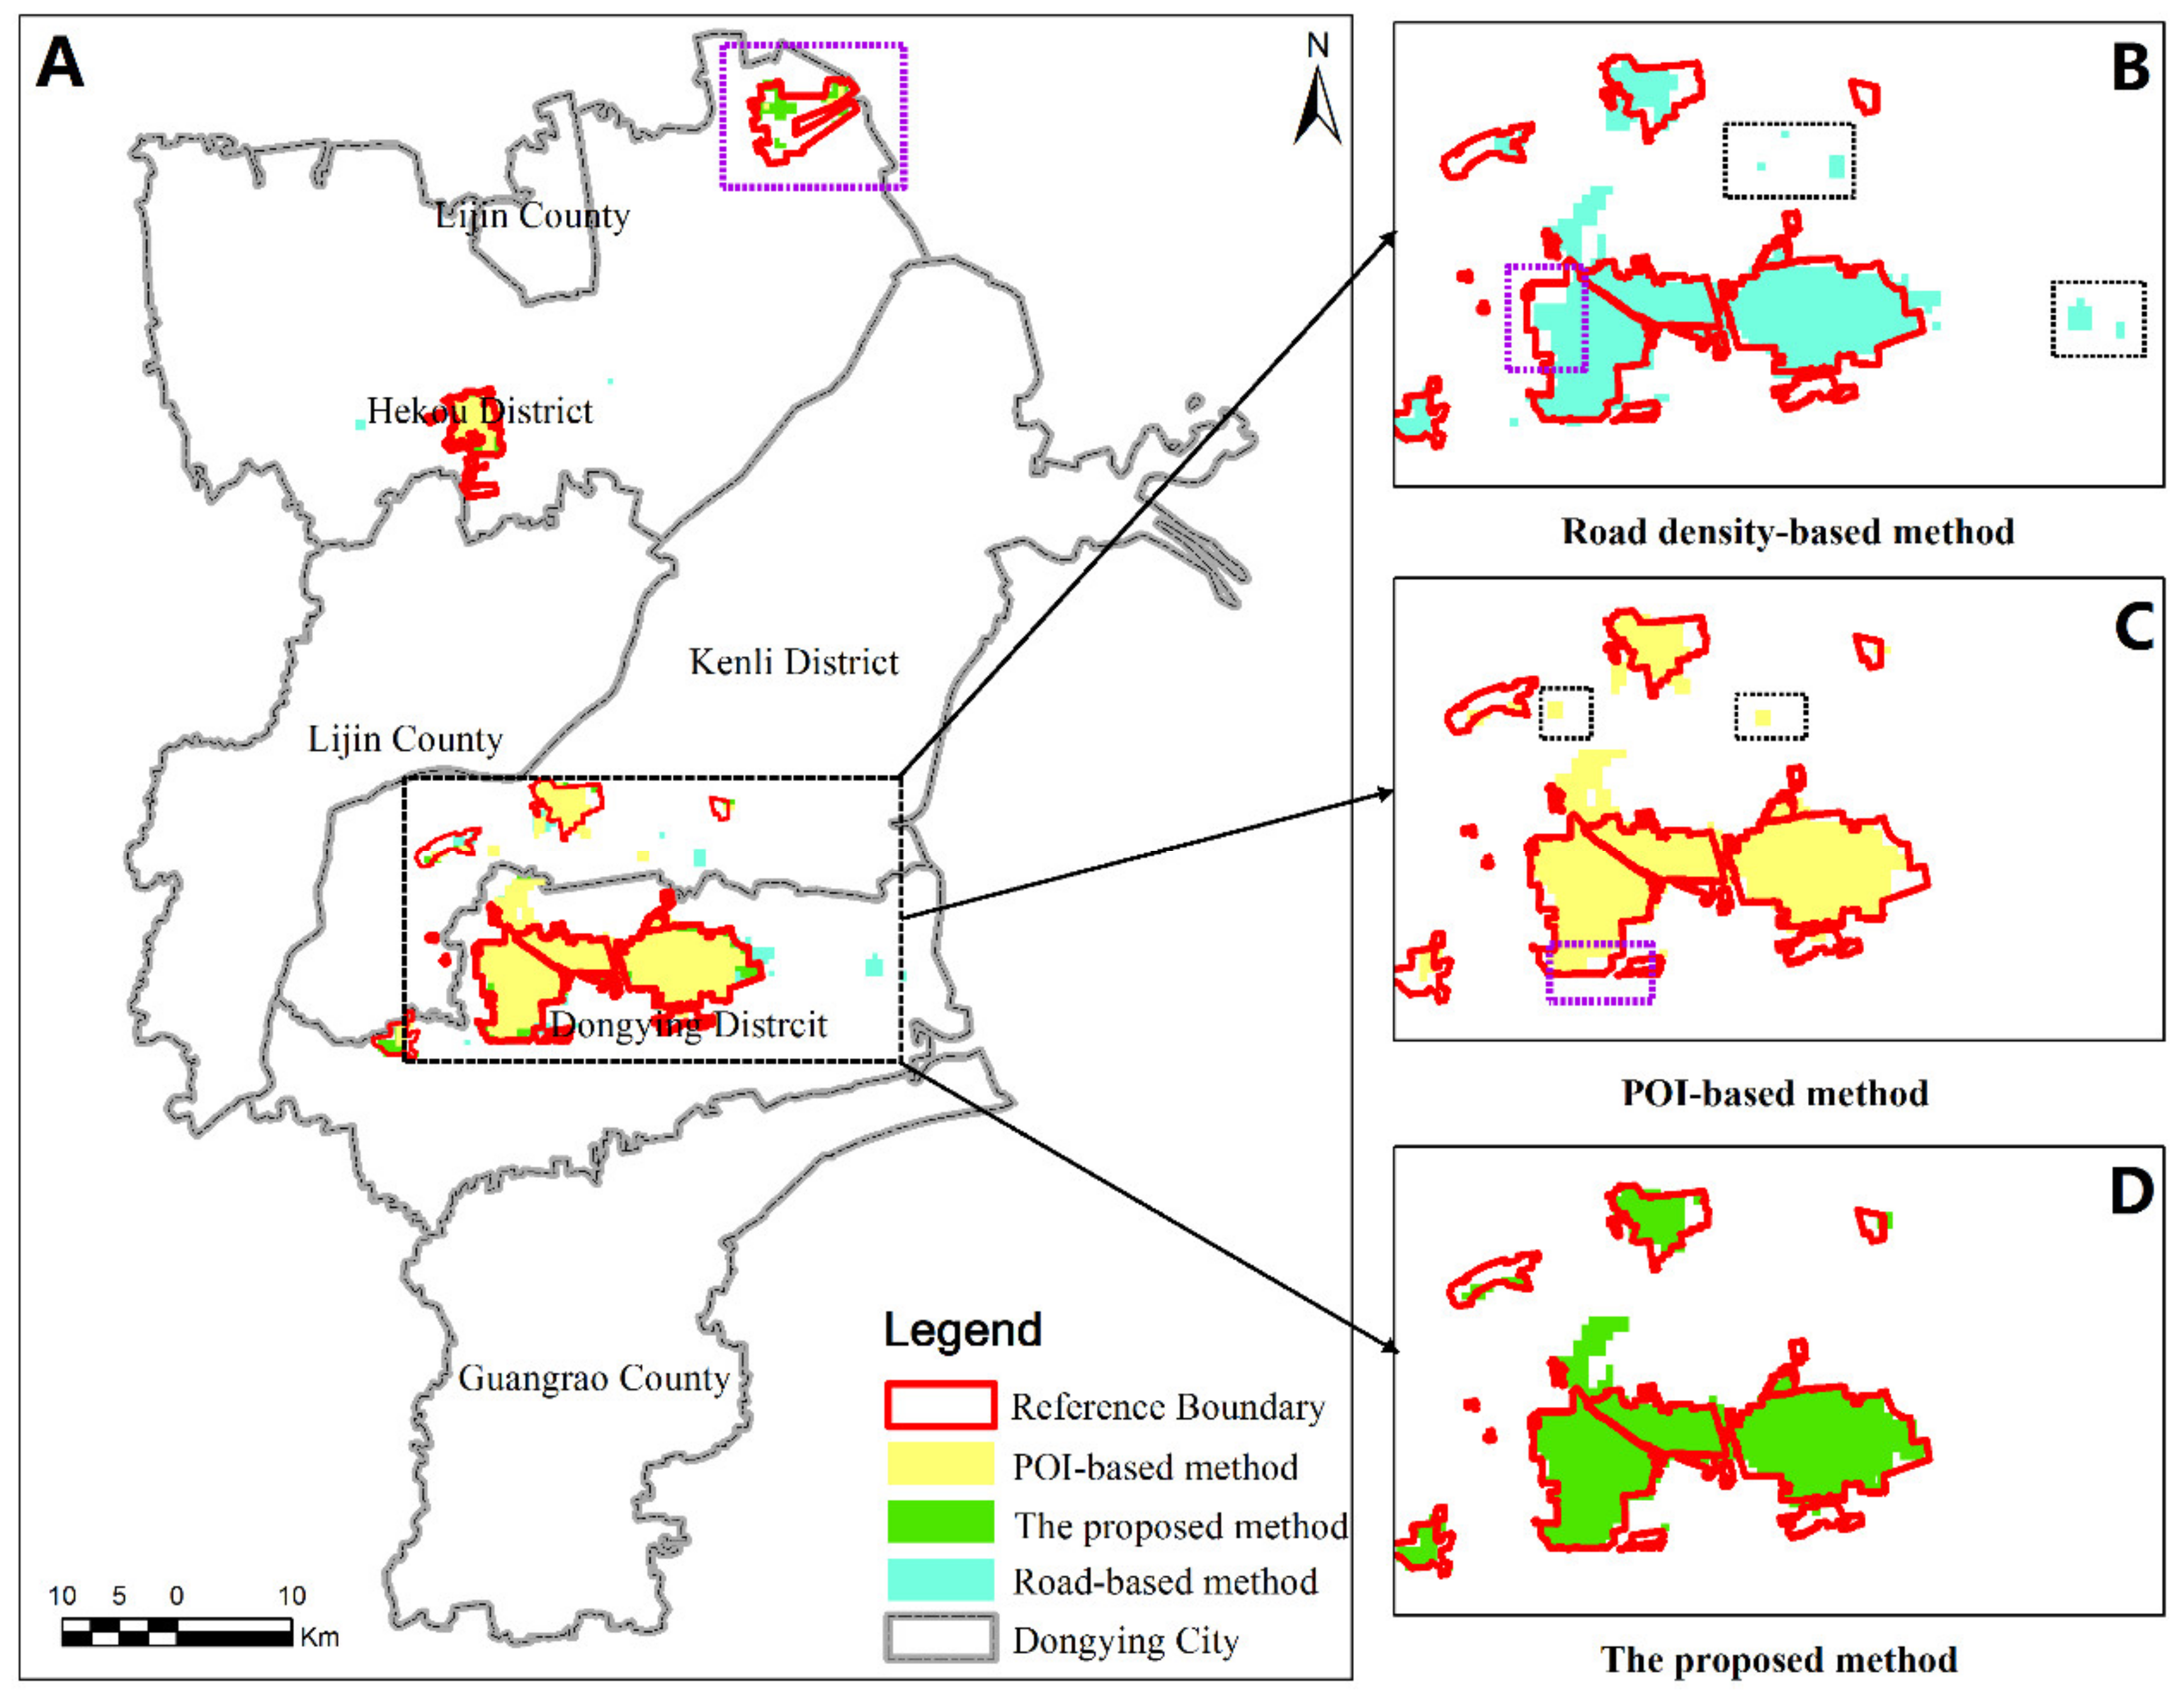
Figure 5.
Comparison between our method and the road density-based method.
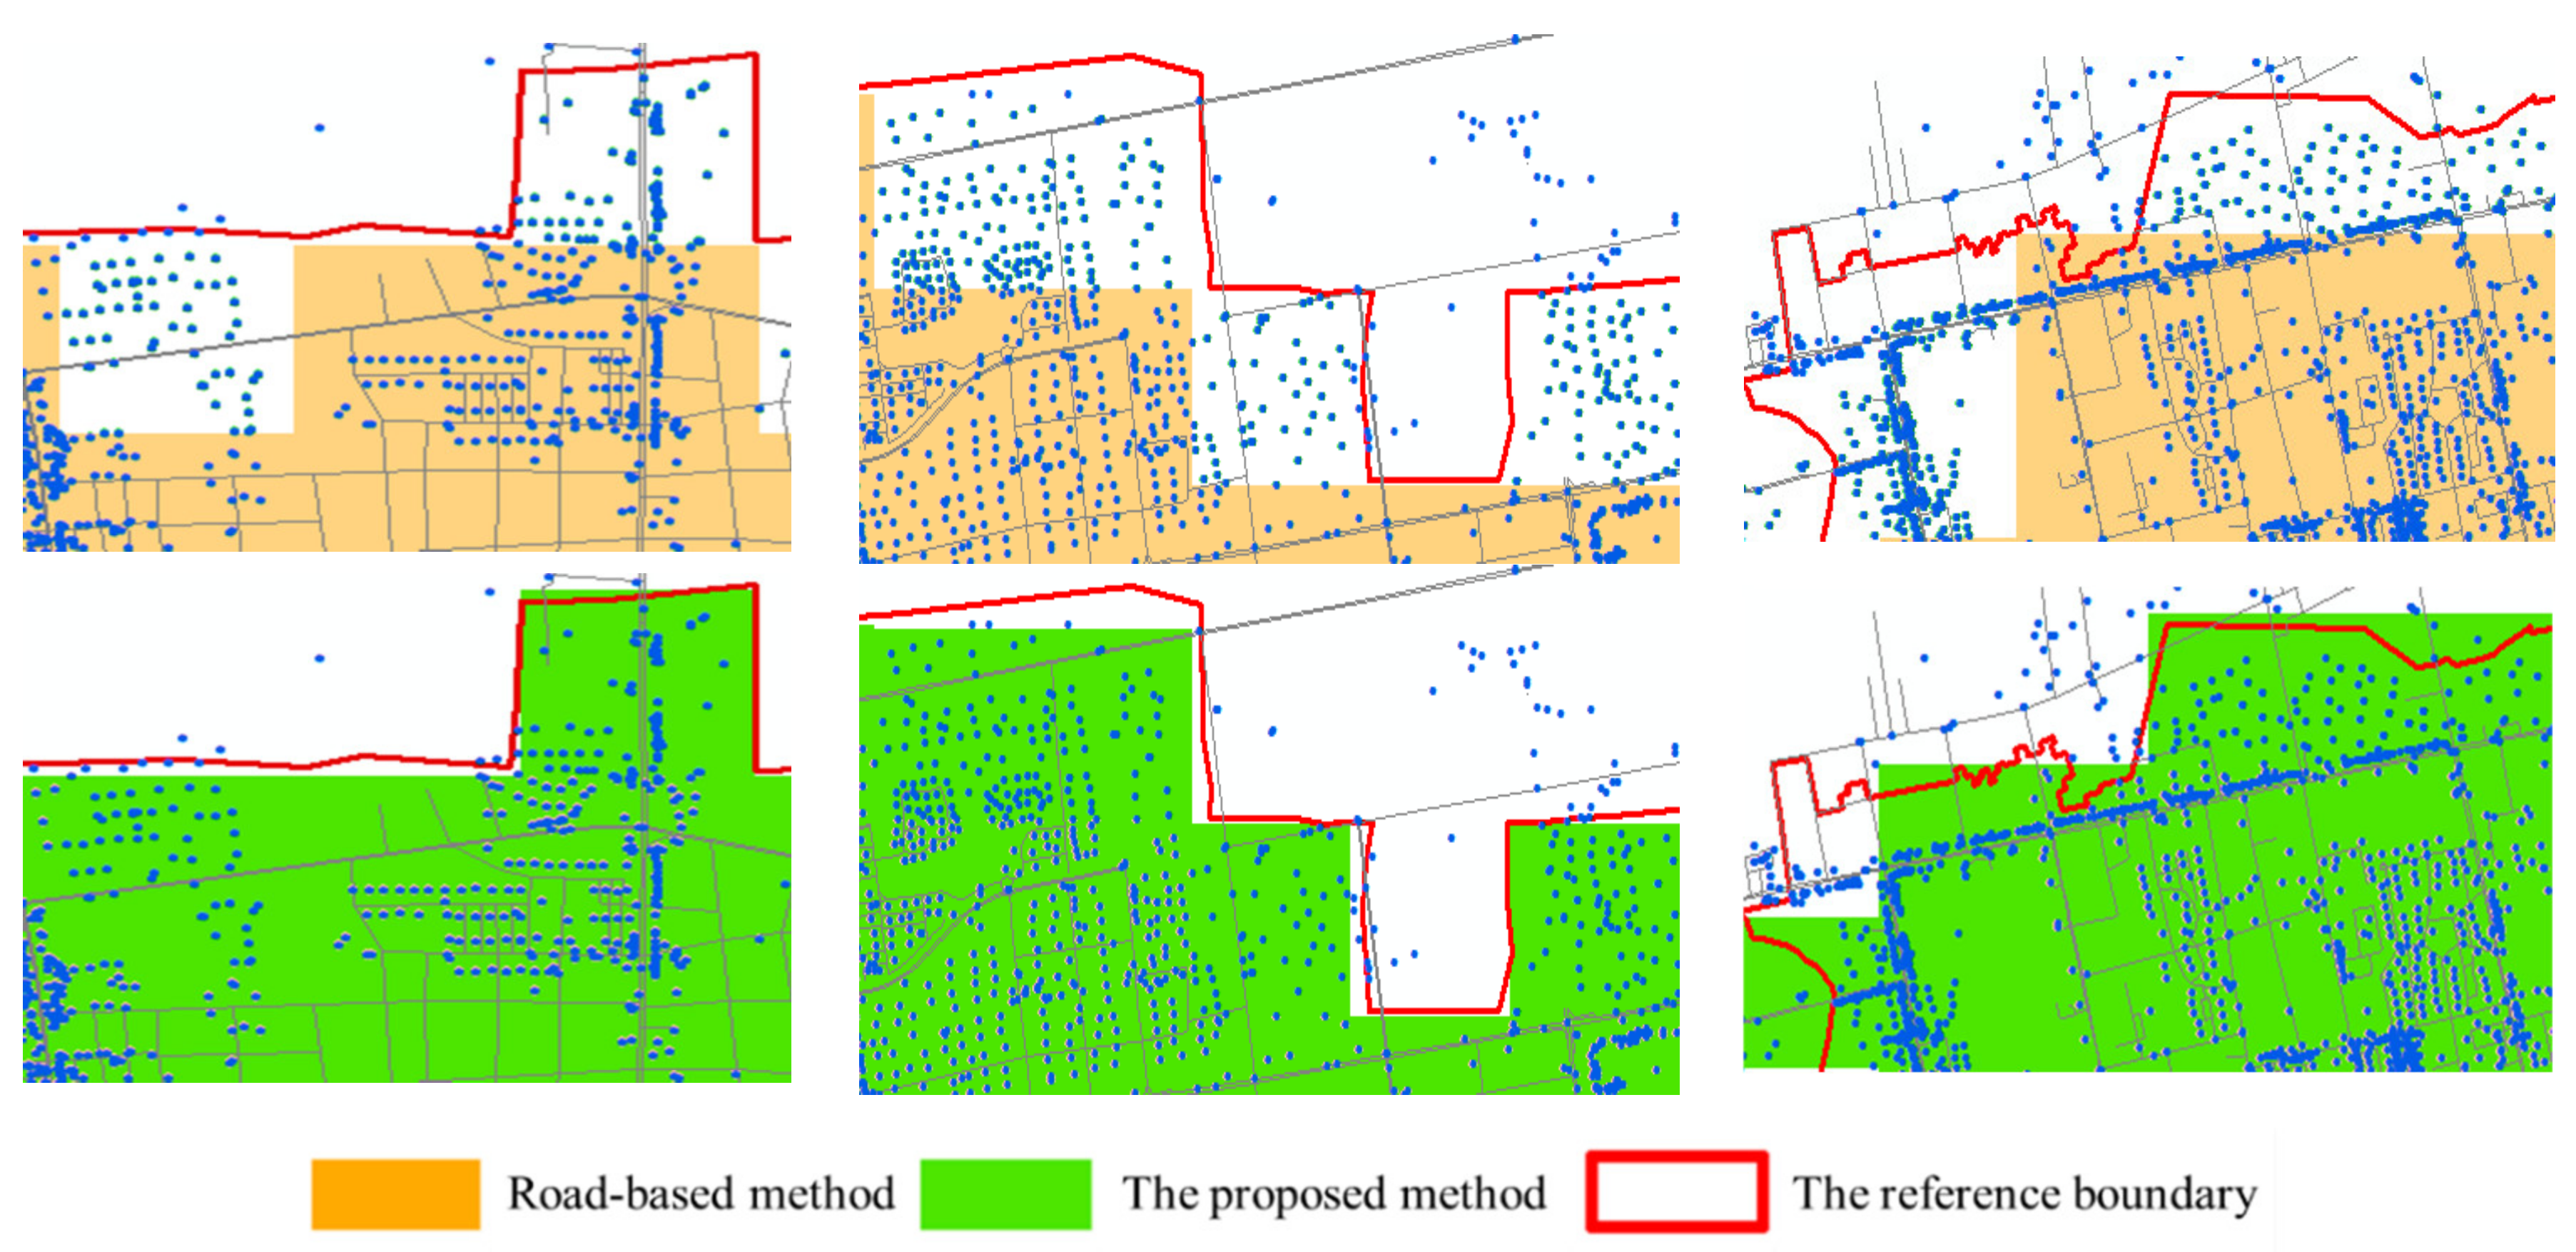
Figure 6.
Comparison between our method and the POI-based method.
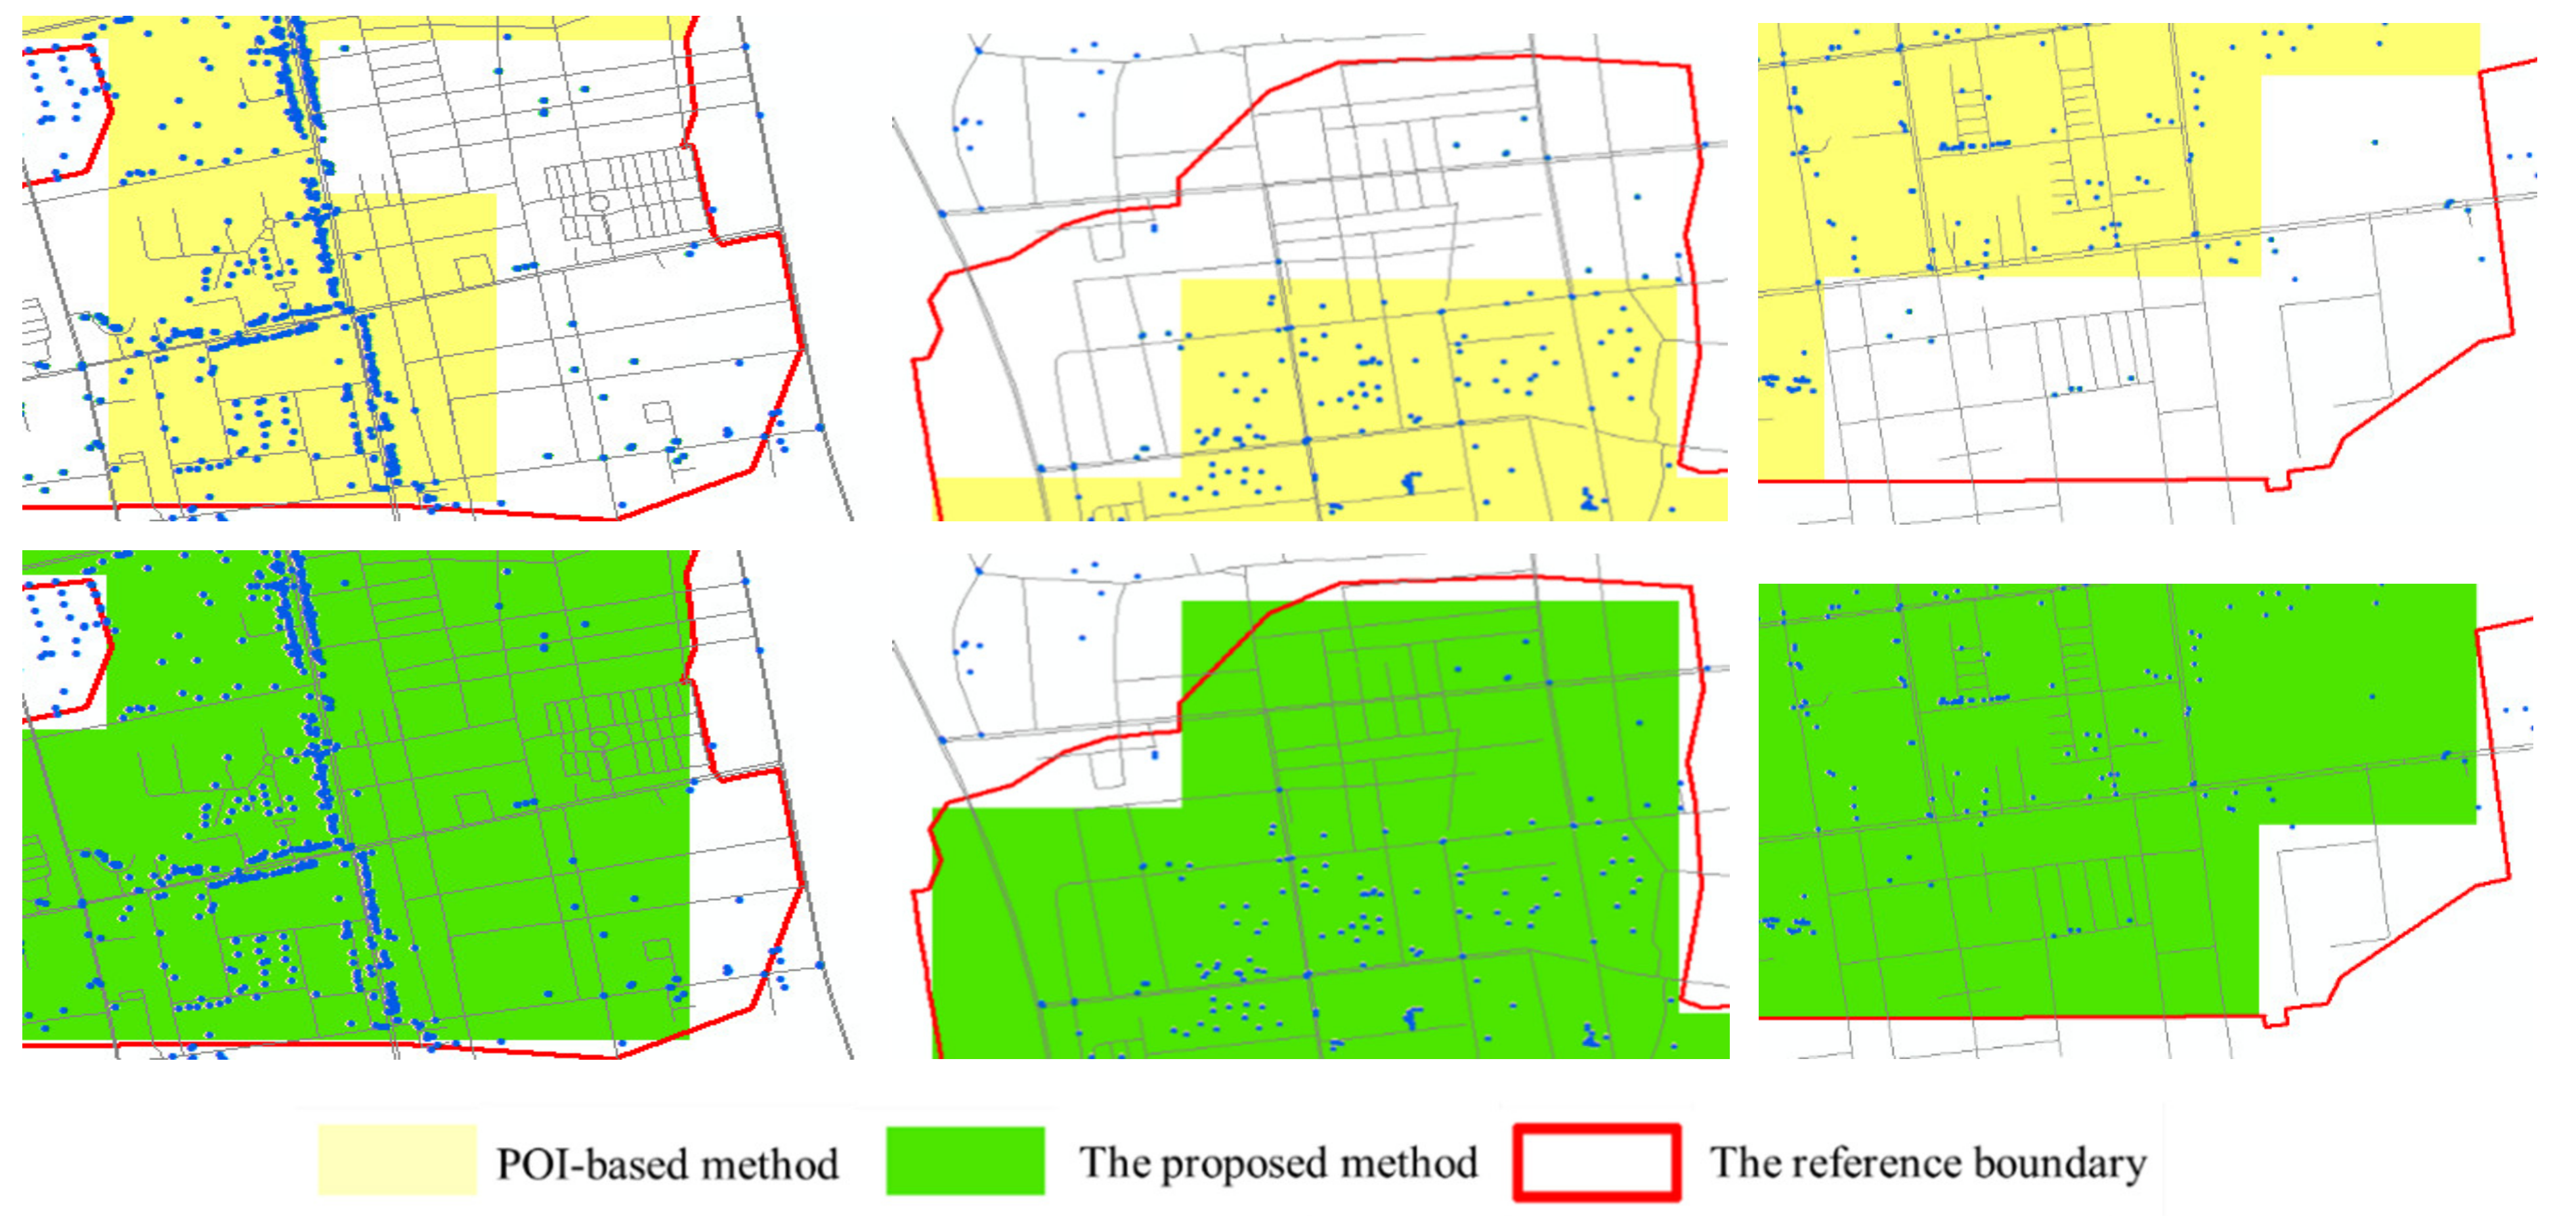
Figure 7.
Overall urban built-up area extraction performance.
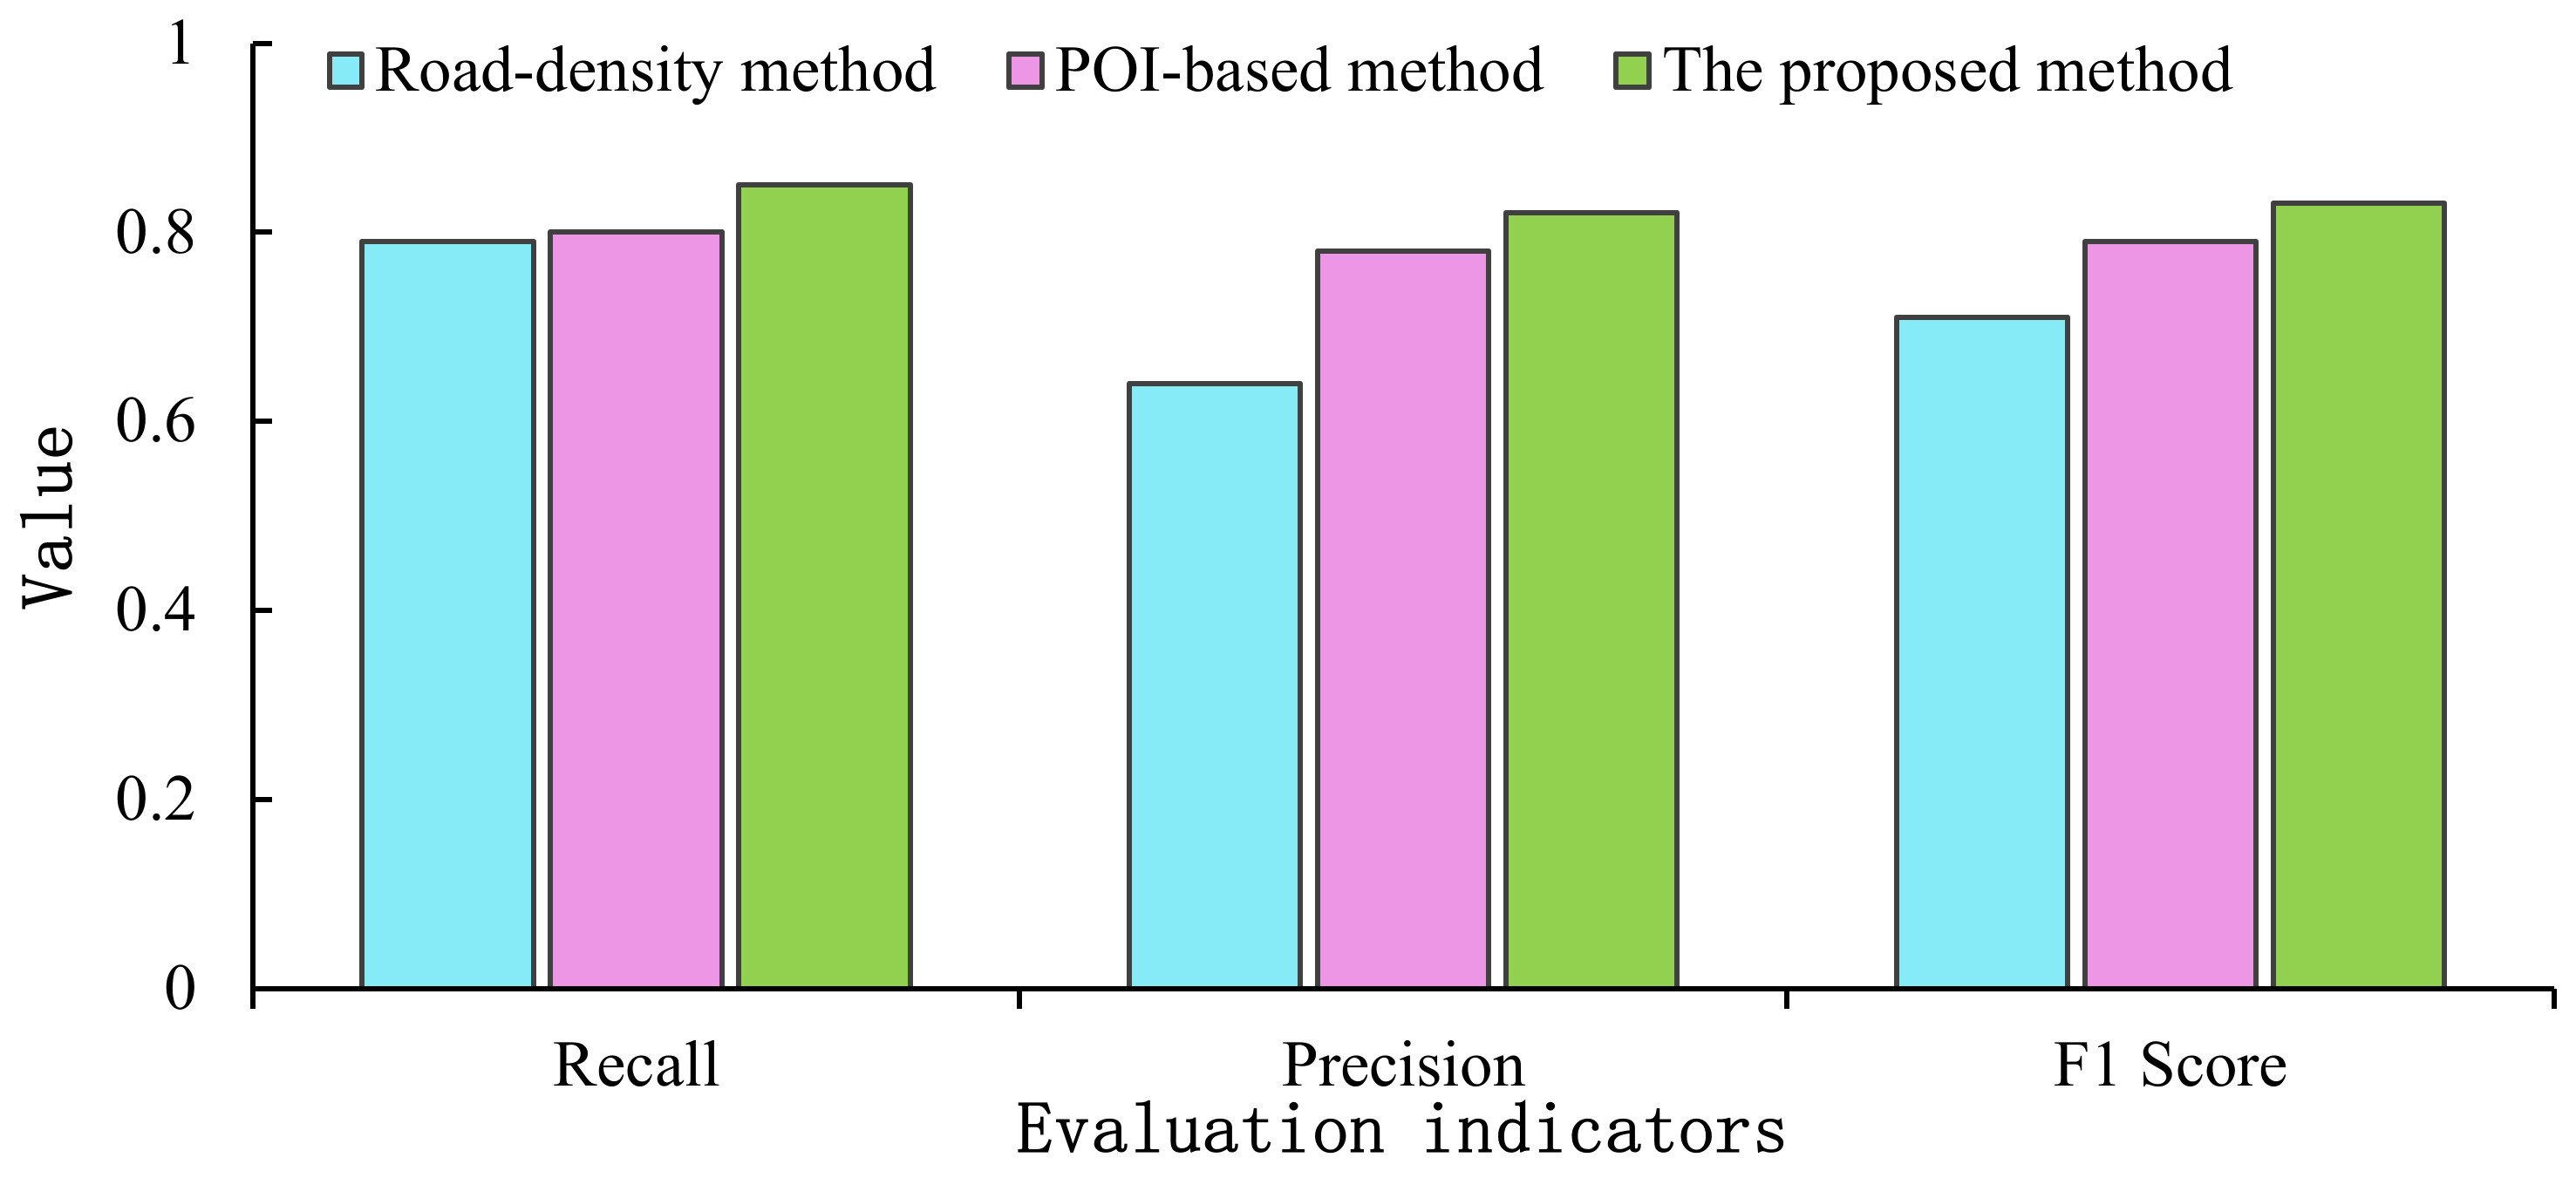
Figure 8.
Areas with low road network and POI densities.

Table 1.
Overall urban built-up area extraction performance.
| Method | Extracted UBUA Area (km2) | Absolute Error (%) | Recall | Precision | F1 Score |
|---|---|---|---|---|---|
| Road-based method | 211.5 | 1.05 | 79.1% | 64.2% | 0.71 |
| POI-based method | 208.1 | 0.66 | 80.6% | 78.5% | 0.79 |
| Proposed method | 210.1 | 0.39 | 85.4% | 82.7% | 0.83 |
Publisher’s Note: MDPI stays neutral with regard to jurisdictional claims in published maps and institutional affiliations. |
© 2021 by the authors. Licensee MDPI, Basel, Switzerland. This article is an open access article distributed under the terms and conditions of the Creative Commons Attribution (CC BY) license (https://creativecommons.org/licenses/by/4.0/).
Share and Cite
MDPI and ACS Style
Li, C.; Wang, X.; Wu, Z.; Dai, Z.; Yin, J.; Zhang, C. An Improved Method for Urban Built-Up Area Extraction Supported by Multi-Source Data. Sustainability 2021, 13, 5042. https://doi.org/10.3390/su13095042
AMA Style
Li C, Wang X, Wu Z, Dai Z, Yin J, Zhang C. An Improved Method for Urban Built-Up Area Extraction Supported by Multi-Source Data. Sustainability. 2021; 13(9):5042. https://doi.org/10.3390/su13095042
Chicago/Turabian StyleLi, Chengming, Xiaoyan Wang, Zheng Wu, Zhaoxin Dai, Jie Yin, and Chengcheng Zhang. 2021. "An Improved Method for Urban Built-Up Area Extraction Supported by Multi-Source Data" Sustainability 13, no. 9: 5042. https://doi.org/10.3390/su13095042
Note that from the first issue of 2016, this journal uses article numbers instead of page numbers. See further details here.