Article

An Innovative and Interactive Teaching Model for Cultivating Talent’s Digital Literacy in Decision Making, Sustainability, and Computational Thinking

1
Department of Labor and Human Resources, Chinese Culture University, Taipei 11114, Taiwan
2
Department of Applied Mathematics, Chinese Culture University, Taipei 11114, Taiwan
3
Department of Health and Leisure Management, Yuanpei University of Medical Technology, Hsinchu 30015, Taiwan
*
Author to whom correspondence should be addressed.
Sustainability 2021, 13(9), 5117; https://doi.org/10.3390/su13095117
Submission received: 15 March 2021 / Revised: 18 April 2021 / Accepted: 22 April 2021 / Published: 3 May 2021

Abstract

:
In the modern era, talent cultivation plays an essential role in the transition process to sustainable development. The emerging direction of talent cultivation is intended to achieve global competence in computational thinking and digital literacy; however, there is still a gap in Taiwan. Scholars and educators have identified the contents of digital literacy, which include statistical concepts, data analysis skills, and critical thinking. To fill this gap, this study proposed an innovative educational teaching method that integrates data visualization techniques and critical thinking training to improve students’ decision-making literacy. An experiment on the curriculum with a one-group pre-test and post-test design was conducted for 79 participants. The data consisted of a geographical data map, visualized data diagrams, and a statistical test; the scores for critical thinking, academic self-confidence, and academic performance were separated into high, middle, and low achievement groups. For data analysis, the bootstrapping method (resampled 1000 times), paired sample t-test, and ANCOVA were applied for data analysis to compare the difference between each independent group. The results showed that the post-test scores (statistic test M = 9.59, infographic test M = 6.09, map test M = 5.02) were higher than the pre-test scores (statistic test M = 7.15, infographic test M = 3.46, map test M = 3.13). The most significant implication is the innovative teaching approach based on integrated data visualization and critical thinking. It plays a very significant role in enhancing decision-making abilities.

1. Introduction

Developed countries are promoting their talents in digital literacy through curriculum design and educational programs. The internet is full of mass information and data, which include both factual and fake messages that confuse users and even impact societal development; thus, digital literacy should be promoted to enhance users’ ability to handle information and communication technology (ICT) usage. Therefore, digital literacy has emerged as a way to deal with the digital challenges caused by developing trends in ICT and internet usage [1]. Obviously, COVID-19 has dramatically changed our work and lifestyle in the direction of using ICTs and the internet [2]. Hence, the utility of the internet and online sources has become more and more important worldwide. However, there is a lack of related digital literacy training for undergraduates, except for science majors. Thus, judgment skills and critical thinking related to the use of ICTs and the internet will impact learning and work outcomes [3]. Based on strengths in computing and hardware data processing capabilities, evidence-based decision-making has become mainstream in government, industry, and education applications. As a consequence, the larger reliance on the internet or ICTs in dealing with work and learning tasks without appropriate digital literacy training will cause more risks in the use of online information, messages, open data, and uncertain applications. Decision-making quality is impacted not only at the organizational level, but also on the group level and individual levels. However, a global survey, “The International Computer and Information Literacy Study” (ICILS), reported that around 17% of young people failed to meet the basic digital literacy requirements [4]. This demonstrated that young peoples’ digital literacy was insufficient and needs to be improved in the short-term. Educators have argued that the relevant aspects of computational thinking include numerical concepts, statistical concepts, data analysis skills, and critical thinking [5]. Furthermore, these aspects are associated with digital decision-making literacy. Hence, they have become the focus for the cultivation of digital literacy, which is a current education goal in developed countries, especially Taiwan. Further, the goals of computational thinking and critical thinking affect not only productivity but also the sustainability of the development of individuals and organizations [6]. Thus, the ecological systems of the enterprises can survive continuously when these goals are met. Moreover, the traditional lecture and test teaching model is still the predominant teaching method in current classrooms. An innovative teaching method is required in order to improve learning efficiency and promote learning outcomes [7]. Hence, it is critical to equip students with computational thinking, digital literacy, and decision-making skills for sustaining the development of firms.
In addition, there is insufficient training and education for cultivating digital decision-making literacy. Therefore, this study designed an experimental curriculum to examine the validity of an innovative digital decision-making literacy teaching model with designed materials, lectures, teaching methods, and assessments for Taiwanese subjects.

2. Theoretical Basis

According to scholars, fostering digital literacy via education should receive more attention. This study is intended to cultivate the digital literacy of social art major undergraduates through the incorporation of a teaching strategy in a selected professional course. The data visualization aspect of the course involved high-level concepts which included data mining, infographic-style selection, cross-analysis principles, mixed graphics, and interactive settings. These concepts should be involved in the cultivation of digital literacy; thus, this study developed materials for an experimental course in order to verify the effectiveness of the designed teaching model. This program will guide the cultivation of evidence-based decision-making skills. In the evaluation of the designed course, scholars suggested that the teaching assessment could be conducted after the course was finished [8]. Therefore, the researchers designed a survey to evaluate the teaching method, learning efficacy, the usefulness of the knowledge, and self-assessment of learning performance.
In general, decision making based on evidence is an important skill. Thus, cultivating critical thinking skills to deal with the mass information and data on the internet is a priority in higher education. Fostering digital literacy and decision-making skills on the basis of critical thinking is the goal of this study. The designed experimental curriculum was applied to verify the efficacy of the innovated teaching model in this study. The relevant research factors are explained below.

2.1. Digital Literacy

The term “literacy” is not a new concept and reflects the degree of an individual’s social status which is used to connect with other people or organizations. It can be treated as a form of cultural learning [9]. This perspective originated in 2001 with the “No Child Left Behind” act in the US [10]. It changed educators’ focus from competency cultivation to literacy development [11]. Literacy education has played a core role in modern education hereafter. Facing the dramatic development of ICTs, information literacy has been promoted as a new target for education goals [12]. There are different meanings and contexts between information literacy and digital literacy. Koltay defined information literacy as involving the user’s behavior regarding internet searching, hypertext navigation, knowledge assembly, and content evaluation [11]. Meanwhile, digital literacy reflects the user’s awareness, attitude, and ability to use digital tools appropriately, and to identify, access, control, integrate, evaluate, analyze, and synthesize all of the digital resources. Based on this, the user will construct new knowledge, create media expressions, and even strengthen their decision making [13]. Thus, the individual’s decision-making process is part of digital literacy.

2.2. Data Visualization

Prior to the popularization of special-purpose software for data analysis and visualization, the information capability and performance of traditional statistical charts and tables had been limited and contained static information only. Meanwhile, the readers or audiences could simply receive limited and segmented information [14]. However, in the era of information, traditional infographics no longer suffice [15]. Scholars agree that the infographic design should including three essential elements such as data information, the details of the information presented; core concepts, the information that the producer wants to deliver to the audiences; and presentation style, using visual design methods, symbols, and patterns to enrich information and meaning [16]. Quantitative graphics thus require us to combine different charts, graphics, or figures, e.g., bar charts, pie charts, line graphs, or curve diagrams. They may also include timelines, geographical information, and mass texts—most important is that the infographic presents a dynamic visual narrative [17]. The main function of data visualization is to provide an interactive visual narrative to show information both in the static and dynamic style, allowing the user to interact with and explore the intrinsic meanings using graphic function settings.

2.3. Decision Making

Following the development of society, scholars in the fields of humanities, society, nature, engineering, etc. began to study and explore the systematical decision-making theory, method, and model. The Concept of Decision Making applied this practice, establishing the theoretical bases and becoming a subject of scientific study [18]. The meaning of decision making can be defined as a process by which people select from optional solutions. Out of some optional solutions, there is an optimal solution, and decision making is the process of problem-solving to find this solution [19]. The decision-making process consists of a five-step feedback loop involving problem identification, information collection, solution selection, conduct decision, and outcome assessment [19]. Those development trends show that decision-making science is key in determining human behavior at an individual level and the performance of people at the organizational level. Furthermore, a high level of decision-making competency is essential for managers. Evidence-based decision making is common in the medical field, and Ciliska, Pinelli, DiCens, and Cullum provide a five-stage procedure for this: specify the question, search for related evidence systematically, judge the evidence from the literature review, integrate the most powerful evidence for decision making, and evaluate the outcome [20]. In the initial stage, a PICO (Population, Issue, Comparison, and Outcome) model can be applied for question identification [21]. In the second stage, the four actions that can be used to search or collect the related evidence are “Define the Scope of Database and Searching Condition”, “Use the Correct Terms for Searching”, “Decide the Searching Strategy and Action”, and “Modify Searching Terms Depending on the Feedback”. In the third stage, to verify the validity of search information that includes review and comment the evidence, the comments are reviewed and compared, and the evidence is then classified.

2.4. Critical Thinking

In the rapidly changing environment caused by information and communication technology, information sources are easy to search. Therefore, the question of how to select information more effectively and transfer it to knowledge via critical thinking ability is a foundational skill for modern workers [22]. This pushes human beings to improve the environment constantly via critical thinking, and the main reason for this is that they apply these skills to conduct a continual dialectical process until the truth is revealed [23]. Scholars agree that digital learning will inspire learners’ critical thinking skills [20]. Hence, a digitalized teaching strategy is the most useful method to cultivate students’ critical thinking ability. They can deal with future uncertainties and stand out in the global competitive environment using this ability [24]. This viewpoint was an important US educational policy focus under former President Obama, demonstrating that critical thinking is considered a core competency for the next generation [25].

3. Research Methods

3.1. Research Hypotheses

To deal with the challenge of cultivating talents in computational thinking and digital literacy, this study designed an experimental curriculum consisting of basic statistics concepts and data visualization skills: map and infographic knowledge and skill training. The following research hypotheses were assumed.
Hypothesis 1 (H1).
The course will affect learners’ ability; thus, the basic statistics concepts of the post-test mean score higher will be higher than the pre-test mean score.
Hypothesis 2 (H2).
The course will affect learners’ ability; thus, the data visualization skill map post-test mean score was higher than the pre-test mean score.
Hypothesis 3 (H3).
The course will affect learners’ ability; thus, the data visualization skill infographic mean score was higher than the pre-test mean score.

3.2. Experimental Design

The one-group pre-test and post-test of the quasi-experimental design were employed in this study as in Figure 1. The observation O1 was a pre-test of prior knowledge that included basic statistical concepts and mapping and infographic data visualization software skills. Intervention X is an 8-week incorporation teaching strategy in the curriculum for undergraduates. The O2 was a post-test of learned basic statistical concepts and mapping and infographic data visualization software skills.

3.3. Teaching Strategy

The LPC Strategy was applied for incorporating a teaching strategy that consisted of three parts: Lecture, Practice, and Competition [26]. The incorporated teaching subjects involved basic statistical concepts and data visualization software operation skills for maps and infographics. Based on the LPC Strategy, the lecturer explained the subjects, then assigned data visualization software operation practice for two knowledge points represented by infographics and geographic map data from a map. The designed curriculum units are summarized in Table 1.
The curriculum design followed the ADDIE model, an instructional development procedure including the following components: Analysis, Design, Development, Implement and Evaluation [27]. The strengths and weaknesses of undergraduates’ basic statistical concepts and data visualization software operation skills for maps and infographics were first analyzed. Next, the material, supplemental data, and teaching model were designed and developed accordingly. The implementation step was used the LPC strategy. Then, the evaluation took place upon the final competition of the testing. In addition, the interactive software “Kahoot!” was used as a pre-test and post-test tool prior to the course and before ending the course to inspire students’ learning motivation and concentration [28]. Then, the records and scores of “Kahoot!” were statistically processed to estimate students’ learning performance.

3.4. Participants

A total of 79 undergraduates participated in this experimental course—49 females and 30 males. They were sophomores pursuing the Bachelor of Arts in Business Administration from a technological university located in Northern Taiwan. The incorporation teaching course was in the 3-credit “Marketing Management” course.

3.5. Instruments

3.5.1. Quiz

The lecturer generated the quiz, and the scope contained basic statistical concepts and data visualization software operation skills regarding maps and infographics. Each quiz consisted of 10 items, and the reliability measurement applied Kuder-Richardson 20 (KR-20), which ranged from 0.81 to 0.87. The data visualization software applied Microsoft Power BI. The critical thinking quiz consisted of 30 multiple-choice questions adapted from Beaton [29] and translated into Chinese via a back-translation procedure to confirm the original context of translated items [30]. This produced the critical thinking training material.

3.5.2. Questionnaire

The questionnaire explored the academic performance of the previous semester and 3 items pertaining to the confidence of the subject with respect to learning, adapted from Fogarty, Cretchley, Arman, llerton, and Konki [31]. Furthermore, the learning confidence of map and infographic were rated before and after the quasi-experimental curriculum. In addition, 13 items for evaluating the overall course design and students’ self-assessment were added to the questionnaire.

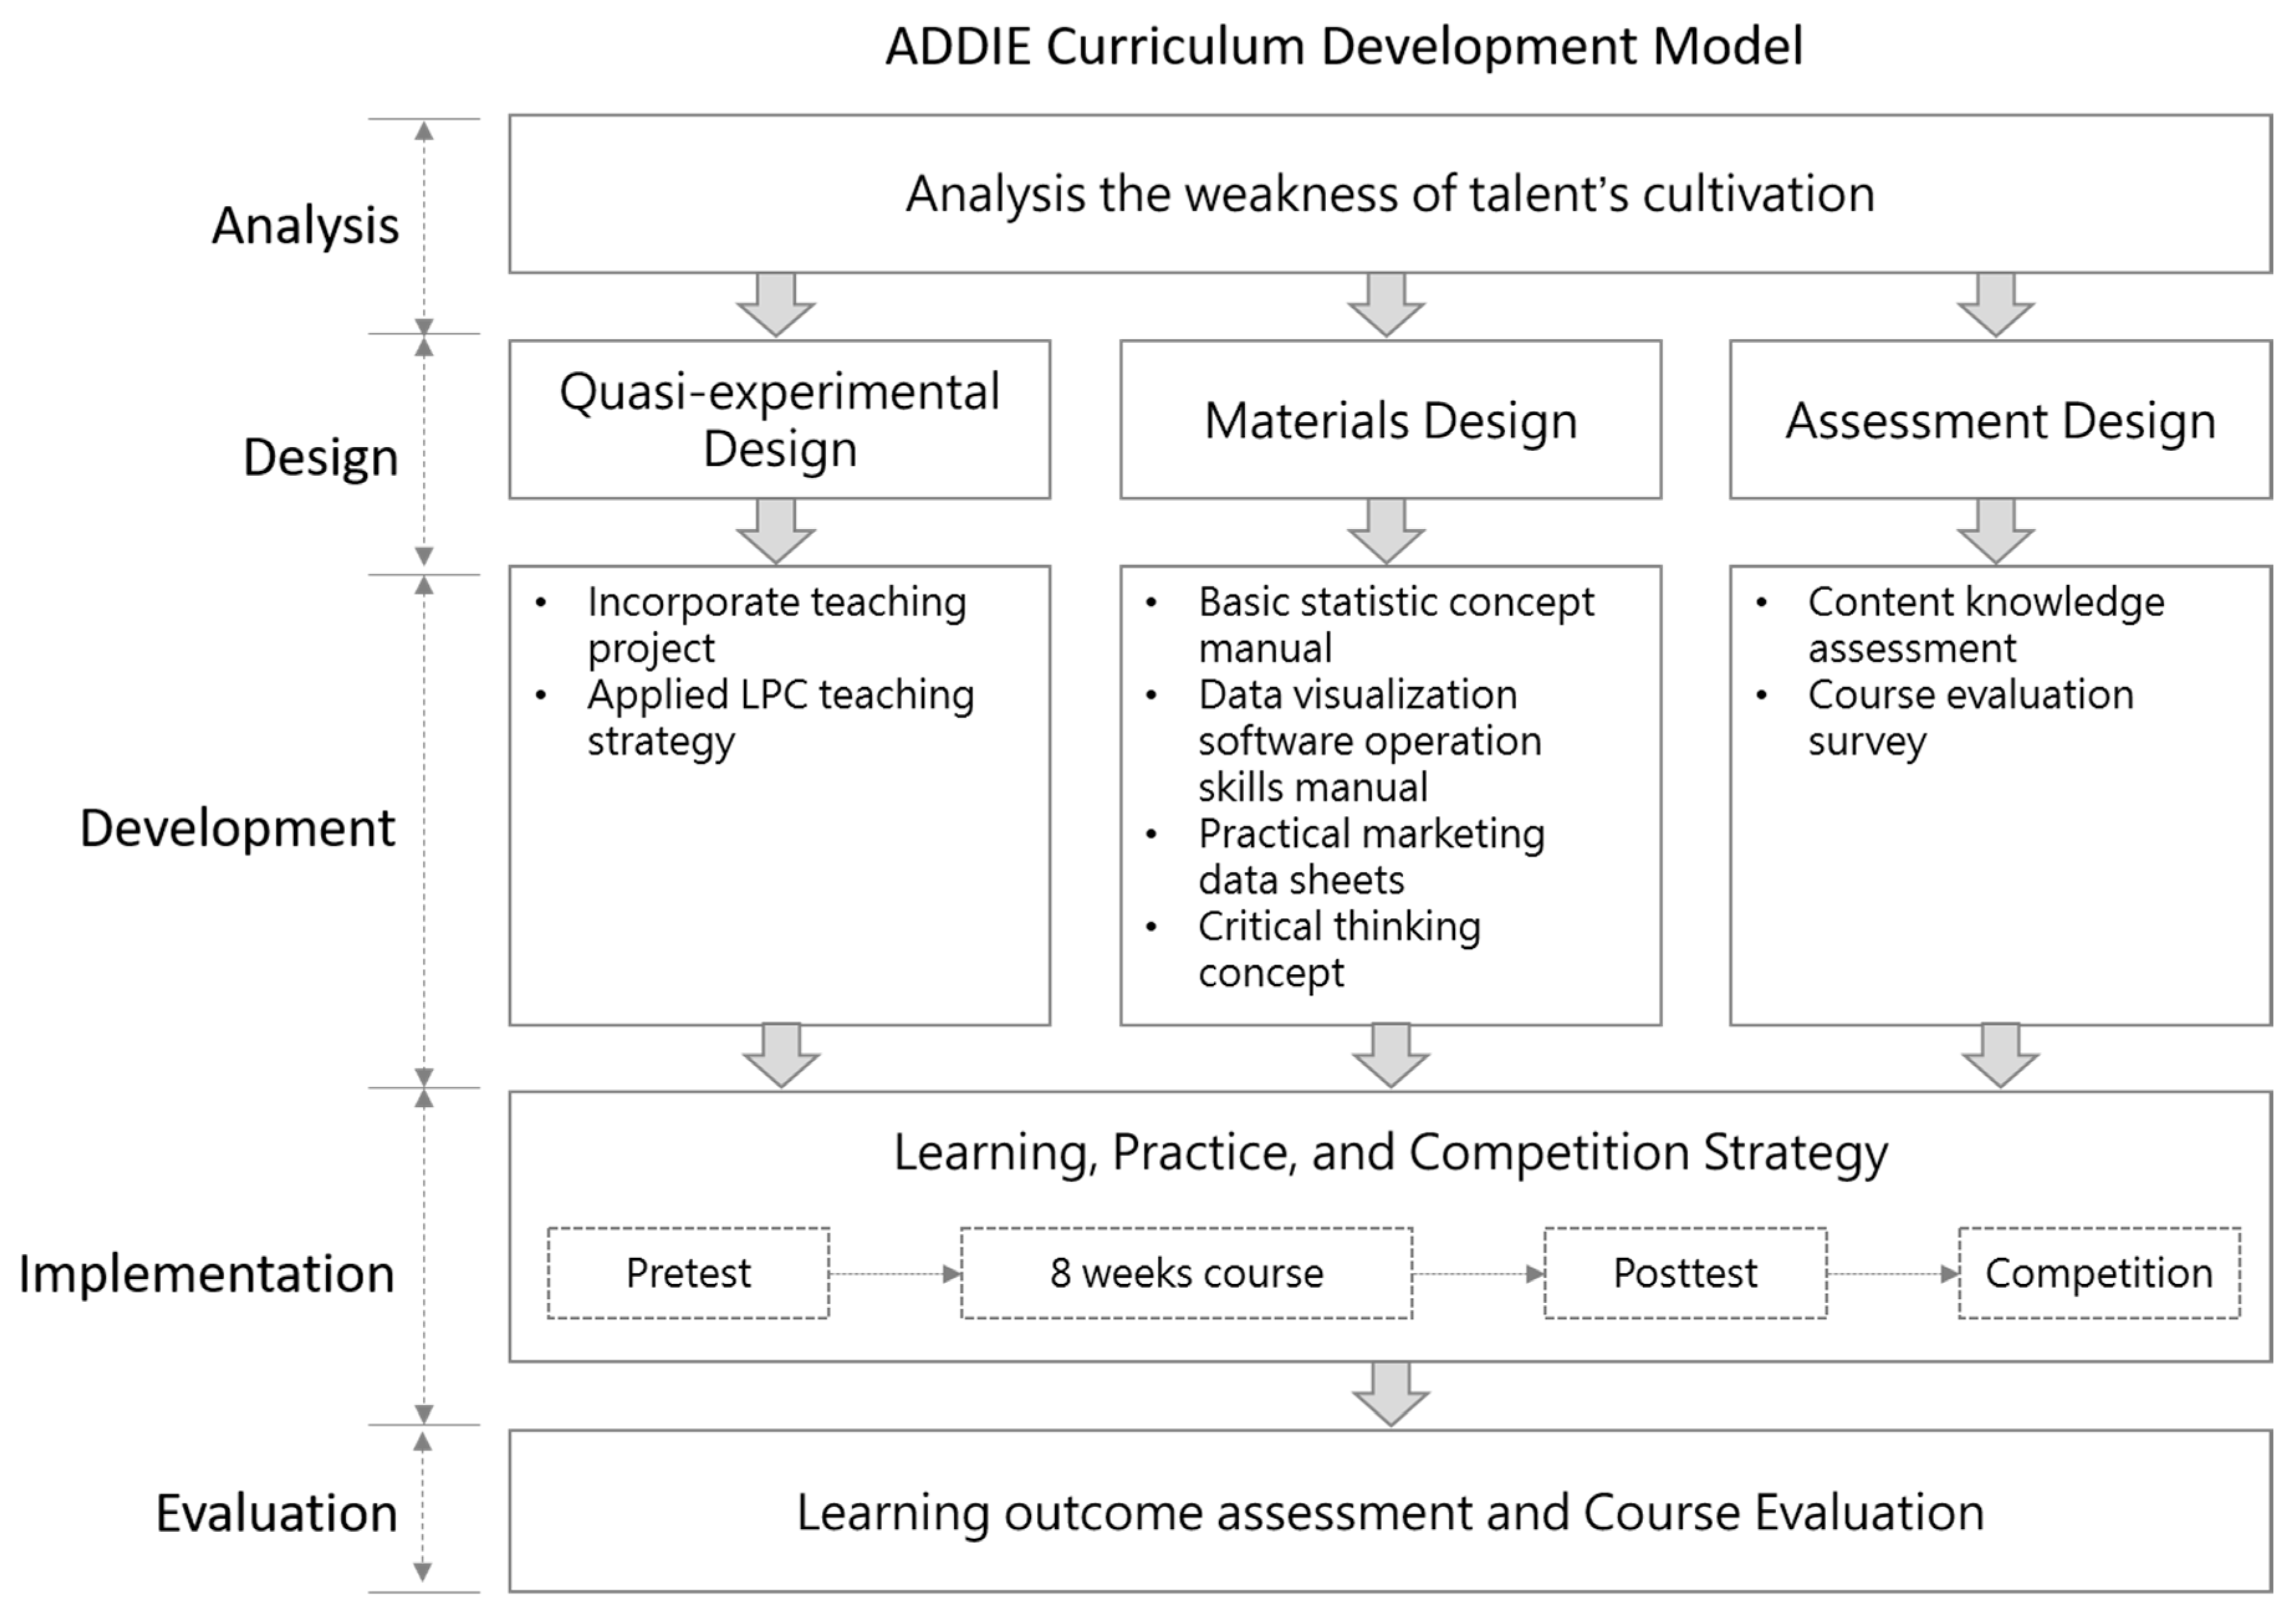
3.6. ADDIE Model as Useful Curriculum Development Strategy

This study followed the ADDIE model [26] to develop the curriculum and the overall curriculum design as in Figure 2. In the analysis stage, the researchers observed that participants had no organized digital literacy and decision-making skills. Therefore, the researchers conducted a small interview highlighting the importance of digital literacy in the first and second weeks. Then, as the second and third stage, the research team developed the appropriate teaching project and materials. During this stage, the research team decided on additional subjects, knowledge, and skills to teach. To ensure the quality and usability of the material, the research team invited three scholars to review the designed materials. Hereafter, the LPC (learning, practice, and competition) teaching method was implemented in the experimental curriculum as the fourth stage. Prior to the experimental course, the assessment tool was designed accordantly. The final stage evaluated the performance of the designed course, including teaching efficiency and learning outcomes. Thus, the pre- and post-testing of basic statistical concepts and data visualization software operation skills regarding maps and infographics were conducted to assess learning. A course teaching evaluation using the designed survey was conducted to collect student feedback.

3.7. Data Analysis

3.7.1. Descriptive Statistics

The frequencies, mean (M), standard deviation (SD), minimum (Min), maximum (Max), median (Me), mode (Mo), and percentage (%) were applied to outline patterns in students’ educational backgrounds.

3.7.2. Paired Sample t-Test

A paired sample t-test was used to examine the mean test scores. Thus, the pre-test mean scores and post-test mean scores were compared to explore differences between the experimental and control groups. This study used the paired sample t-test method to check the differences in mean scores between the pre- and post-tests of basic statistical concepts and data visualization software operation skills regarding maps and infographics.

3.7.3. ANCOVA

The ANCOVA method was used to verify the result of the quasi-experimental design. It was constrained to the pre-test mean scores as the control variable then compared to the adjusted post-test mean scores to observe the results. This study used ANCOVA to explore the differences between the adjusted post-test mean scores of basic statistical concepts and data visualization software operation skills regarding maps and infographics. The equation of ANCOVA is:
yi2 = β0 + β1xi + β2yi1 + ei
The variables are: yi1 = pre-test scores; yi2 = post-test scores; xi = 1 is the experimental group; xi = 0 is the control group; i = participants.

3.7.4. The Effect Check

The formula of effect size was developed by Hedges and Olkin [32] and originally presented by Cohen [33] to check the power and effect of the quasi-experimental design [34] as in Equation (2).
g ^ = x 1 ¯ x 2 ¯ ( n 1 1 ) S D 1 2 + ( n 2 1 ) S D 2 2 ( N t o t a l 2 ) × ( 1 3 4 ( n 1 + n 2 ) 9 )

4. Findings

4.1. The Background of Participants

The results are shown in Table 2. There were 49 female (62.0%) and 30 male (38.0%) participants from two classes (34 and 45 separated). The mean score of academic confidence (AC) was 3.11 on Likert’s 5-point scale (SD = 0.734), that of academic performance (AP) was 3.56 (SD = 0.944), and that of critical thinking (CT) was 15.67 out of 30 points (SD = 3.787).

4.2. The Effects of Experimental Curriculum

The sample size of this study was small, so the Bootstrapping method was employed to eliminate the bias and non-normal distribution data [35]. Thus, the 1000-times resampling Bootstrapping method was conducted during the statistical analysis. The paired samples t-test analysis results are listed in Table 3. All of the post-test mean scores were higher than the pre-test mean scores. The post-test score of the statistic test (M = 9.59, SD = 2.146) was higher (t = −7.692, p < 0.001) than that of the pre-test (M = 7.15, SD = 1.908). The Infographic post-test test score (M = 6.09, SD = 0.732) was higher (t = −22.739, p < 0.001) than the pre-test score (M = 3.46, SD = 0.698); and the post-test Map test score (M = 5.02, SD = 1.276) was higher (t = −11.352, p < 0.001) than the pre-test score (M = 3.13, SD = 0.865).

4.3. The Pure Effects of Learning Outcome

Analysis of covariance (ANCOVA) is designed to control for covariates when groups are randomly assigned against naturally occurring group differences [36]. In this study, selected research samples were distributed into different groups depending on their term and purpose overseas. A total of 79 valid samples were then put into the ANCOVA analysis process. The homogeneity of within-regression assumption should be tested prior to ANCOVA analysis. Bump [36] argued that a non-significant test result of homogeneity within-regression reflects a linear relationship between the dependent variable and covariance; thus, the covariance analysis process could be continuous. Table 4 shows that the test result did not reject the null hypothesis. The dependent variable and covariance have a linear relationship. The course units, Map (F(2,73) = 0.217; p > 0.05), Infographic (F(2,73) = 0.878; p > 0.05), and Statistic (F(2,73) = 0.938; p > 0.05), did not reached the significant level. Therefore, the ANCOVA analysis was continued.
The samples were separated into high, middle, and low achievement groups by the different mean scores of basic statistical concepts and data visualization software operation skills regarding maps and infographics. The results of three groups of Academic Confidence failed to reach the significant level in the Map (F(2,75) = 0.221, p > 0.05), Infographic (F(2,75) = 0.497, p > 0.05), and Statistic (F(2,75) = 1.290, p > 0.05) measures. This suggested that the Academic Confidence levels of students will not impact their learning achievement in Map, Infographic, and Statistic learning.
The results of three Academic Performance groups did not reach the significance level in Map (F(2,75)= 0.0431, p > 0.05), Infographic (F(2,75) = 0.028, p > 0.05), and Statistic (F(2,75) = 0.029, p > 0.05) learning. Thus, Academic Performance levels did not affect student learning achievement on these topics.
The results of three Critical Thinking groups did not reach the significance level (see Table 5) in Map (F(2,75) = 0.0399 p > 0.05) and Infographic (F(2,75) = 0.815, p > 0.05) measurements. Thus, differences in Critical Thinking levels will not impact learning regarding Map, Infographic, and Statistic learning. However, the analysis result of Statistic learning reached a significant level (F(2,75) = 3.952, p < 0.05) showing that a discrepancy occurred between different levels of Critical Thinking. Furthermore, the power of Critical Thinking was found to be 0.693, and the effect size was 0.324.

4.4. Teaching Assessment

The survey was conducted after the course was finished to assess teaching performance. Students responded the designed course could help them learn new things about marketing management (see Table 6), linking between theory and practical marketing data and data visualization to simulate managerial decision making. Students reportedly enjoyed the learning process and felt it easy to learn new knowledge and skills in this course.
Results show that students’ basic statistical concepts and data visualization software operation skills regarding Map and Infographic learning had been raised. This was determined via a paired sample t-test of the pre-test and post-test mean score differentiation. The designed quasi-experimental curriculum was found to significantly enhance learning via the ADDIE strategy for curriculum development, incorporation of the teaching method for the additional subject, and the LPC strategy with Kahoot! This finding agrees with previous studies [21,27,35]. A similar opinion raised by Brunette [37] noted that the critical thinking concept will impact an individual’s basic statistical competencies. Interactive application implementation significantly inspired learning motivation in the credit course. Thus, the designed curriculum and teaching model could affect computational thinking and digital decision-making literacy via the implementation of the experimental course and designed materials. In addition, a limitation of this study was that the subjects were selected from one department of a university in Taiwan, which will constrain the generalizability and applicability of the findings. Therefore, we suggest including a greater diversity of disciplines in a newly designed experimental curriculum to verify the validity and reliability of the results.

5. Conclusions

The experimental curriculum was designed based on credit courses to teach students skills that are highly relevant to the subject of the credit course in which they were enrolled. This study, designed as an innovative teaching model, involved elements of computational thinking and digital literacy in the designed curriculum. These elements were more comprehensive than those used in some previous studies. Furthermore, the subjects of related studies were focused on undergraduates majoring in science or K-12 students, whereas this study focused on undergraduates majoring in social science. The developed materials complied with the purpose of the curriculum. Thus, this study represents progress and significantly supports the efficiency of the studied teaching outcomes. In the designed course, the credit subject took up 60% to 70% of class time and the incorporated teaching subject took up 30% to 40%. Based on this design, students could have learned the course-required professional knowledge and the additional knowledge simultaneously. Moreover, this design can significantly inspire the motivation and concentration of students with respect to their learning. The ANCOVA test results demonstrated that the students’ level of academic confidence and past academic performance have no influence on basic statistical concepts and data visualization software operation skills regarding maps and infographics. Neither the student’s achievement nor confidence will affect their learning regarding the designed subjects. However, critical thinking will impact students’ basic competencies in statistics significantly. Furthermore, critical thinking is an important factor affecting digital literacy. In this study, the goal of cultivating digital literacy by fostering critical thinking skills is supported by the quasi-experimental design and innovative teaching model.

Author Contributions

Conceptualization, Y.-H.Y. and C.-H.L.; methodology, Y.-H.Y.; validation, Y.-H.Y., C.-H.L. and S.-S.K.; formal analysis, Y.-H.Y.; investigation, Y.-H.Y.; quasi-experimental design, Y.-H.Y.; resources, S.-S.K.; writing—original draft preparation, Y.-H.Y.; writing—review and editing, Y.-H.Y., C.-H.L. and S.-S.K.; supervision, C.-H.L.; project administration, S.-S.K.; funding acquisition, Y.-H.Y. All authors have read and agreed to the published version of the manuscript.

Funding

This research was funded by the Ministry of Education, Taiwan, grant number PBM107100.

Data Availability Statement

All subjects gave their informed consent for inclusion before they participated in the study. The study was conducted in accordance with the Declaration of Helsinki, and the protocol was approved by the Ethics Committee of MOE.

Acknowledgments

We are thankful to the MOE for funding (Project No. PBM107100) and the editor and reviewers for their great support in helping us improve this article.

Conflicts of Interest

The authors declare no conflict of interest.

References

  1. Jan, S. Investigating the Relationship between Students’ Digital Literacy and Their Attitude towards Using ICT. Int. J. Educ. Technol. 2018, 5, 26–34. [Google Scholar]
  2. Ratten, V. Coronavirus (covid-19) and entrepreneurship: Changing life and work landscape. J. Small Bus. Entrep. 2020, 32, 503–516. [Google Scholar] [CrossRef]
  3. Ing, H.C.; Yahaya, N.; Kumar, L.; Al-Rahmi, W.M. Examining Learners’ Interaction Pattern in Asynchronous Text-Based Online Learning. i-Manag. J. Educ. Technol. 2020, 16, 9–16. [Google Scholar]
  4. Nyikes, Z. Contemporary digital competency review. Interdiscip. Descr. Complex Syst. 2018, 16, 124–131. [Google Scholar] [CrossRef]
  5. Gretter, S.; Yadav, A. Computational thinking and media & information literacy: An integrated approach to teaching twenty-first century skills. TechTrends 2016, 60, 510–516. [Google Scholar]
  6. Easterbrook, S. From Computational Thinking to Systems Thinking: A conceptual toolkit for sustainability computing. In Ict Sustain; (ICT4S-14); Atlantis Press: Paris, France, 2014. [Google Scholar]
  7. Djambong, T.; Freiman, V.; Gauvin, S.; Paquet, M.; Chiasson, M. Measurement of computational thinking in K-12 education: The need for innovative practices. In Digital Technologies: Sustainable Innovations for Improving Teaching and Learning; Springer: Cham, Switzerland, 2018; pp. 193–222. [Google Scholar]
  8. Zoller, U. Science education for global sustainability: What is necessary for teaching, learning, and assessment strategies? J. Chem. Educ. 2012, 89, 297–300. [Google Scholar] [CrossRef]
  9. Buckingham, D. Defining digital literacy. In Medienbildung in neuen Kulturräumen; VS Verlag für Sozialwissenschaften: Berlin/Heidelberg, Germany, 2010; pp. 59–71. [Google Scholar]
  10. OSPI. No Child Left Behind Act of 2001. Available online: www.k12.wa.us/policy-funding/grants-grant-management/every-student-succeeds-act-essa-implementation/elementary-and-secondary-education-act-esea/no-child-left-behind-act-2001 (accessed on 2 March 2021).
  11. Ungerer, L. Digital curation as a core competency in current learning and literacy: A higher education perspective. Int. Rev. Res. Open Distrib. Learn. 2016, 17, 1–27. [Google Scholar] [CrossRef]
  12. Hatlevik, O.E.; Throndsen, I.; Loi, M.; Gudmundsdottir, G.B. Students’ ICT self-efficacy and computer and information literacy: Determinants and relationships. Comput. Educ. 2018, 118, 107–119. [Google Scholar] [CrossRef]
  13. Koltay, T. The media and the literacies: Media literacy, information literacy, digital literacy. MediaCult. Soc. 2011, 33, 211–221. [Google Scholar] [CrossRef]
  14. Chen, C.H.; Härdle, W.K.; Unwin, A. (Eds.) Handbook of Data Visualization; Springer Science & Business Media: Berlin, Germany, 2007. [Google Scholar]
  15. Telea, A.C. Data Visualization: Principles and Practice; CRC Press: Boca Raton, FL, USA, 2014. [Google Scholar]
  16. Evergreen, S.; Metzner, C. Design principles for data visualization in evaluation. New Dir. Eval. 2013, 140, 5–20. [Google Scholar] [CrossRef]
  17. Pimenta, S.; Poovaiah, R. On defining visual narratives. Des. Thoughts 2010, 3, 25–46. [Google Scholar]
  18. Marchau, V.A.; Walker, W.E.; Bloemen, P.J.; Popper, S.W. Decision Making Under Deep Uncertainty: From Theory to Practice; Springer Nature: New York, NY, USA, 2019; pp. 405–458. [Google Scholar]
  19. Škraba, A.; Kljajić, M.; Leskovar, R. Group exploration of system dynamics models—Is there a place for a feedback loop in the decision process? System Dynamics Review. J. Syst. Dyn. Soc. 2003, 19, 243–263. [Google Scholar] [CrossRef]
  20. Ciliska, D.K.; Pinelli, J.; DiCenso, A.; Cullum, N. Resources to enhance evidence-based nursing practice. Aacn Clin. Issues 2001, 12, 520–528. [Google Scholar] [CrossRef] [PubMed]
  21. Fineout-Overholt, E.; Johnston, L. Teaching EBP: Asking searchable, answerable clinical questions. Worldviews Evid. Based Nurs. 2005, 2, 157–160. [Google Scholar] [CrossRef]
  22. Hahnel, C.; Goldhammer, F.; Kröhne, U.; Naumann, J. The role of reading skills in the evaluation of online information gathered from search engine environments. Comput. Hum. Behav. 2018, 78, 223–234. [Google Scholar] [CrossRef]
  23. Schudel, I.J. Modelling dialectical processes in environmental learning: An elaboration of Roy Bhaskar’s onto-axiological chain. J. Crit. Realism 2017, 16, 163–183. [Google Scholar] [CrossRef]
  24. Chang, C.Y.; Kao, C.H.; Hwang, G.J.; Lin, F.H. From experiencing to critical thinking: A contextual game-based learning approach to improving nursing students’ performance in electrocardiogram training. Educ. Technol. Res. Dev. 2020, 68, 1225–1245. [Google Scholar] [CrossRef]
  25. Çavdar, G.; Doe, S. Learning through writing: Teaching critical thinking skills in writing assignments. Political Sci. Politics 2012, 45, 298–306. [Google Scholar] [CrossRef] [Green Version]
  26. Kuo, Z.H.; Sun, Z.H. The Practical Innovation Teaching Strategy and Implementation for Senior Vocational High School Curriculum of Electronic Commerce. 2016. Available online: Ba.tchcvs.tc.edu.tw/epapers/course/1050525_01.pdf (accessed on 20 February 2021).
  27. Licorish, S.A.; Owen, H.E.; Daniel, B.; George, J.L. Students’ perception of Kahoot!’s influence on teaching and learning. Res. Pract. Technol. Enhanc. Learn. 2018, 13, 1–23. [Google Scholar] [CrossRef] [Green Version]
  28. Learning Express. Critical Thinking Assessment Practice. AL: Columbia Southern University. 2010. Available online: pdf4pro.com/amp/view/critical-thinking-assessment-practice-quiz-mycsu-5b6cf3.html (accessed on 20 February 2021).
  29. Tan, S. Misuses of KR-20 and Cronbach’s alpha reliability coefficients. Egit. Bilim 2009, 34, 101. [Google Scholar]
  30. Beaton, D.E.; Bombardier, C.; Guillemin, F.; Ferraz, M.B. Guidelines for the process of cross-cultural adaptation of self-report measures. Spine 2000, 25, 3186–3191. [Google Scholar] [CrossRef] [PubMed] [Green Version]
  31. Fogarty, G.; Cretchley, P.; Harman, C.; Ellerton, N.; Konki, N. Validation of a questionnaire to measure mathematics confidence, computer confidence, and attitudes towards the use of technology for learning mathematics. Math. Educ. Res. J. 2001, 13, 154–160. [Google Scholar] [CrossRef]
  32. Hedges, L.; Olkin, I. Statistical Methods for Meta-Analysis. Meta-Analysis; Academic Press: San Diego, CA, USA, 1985. [Google Scholar]
  33. Cohen, J. Statistical Power Analysis for the Behavioral Sciences; Academic Press: New York, NY, USA, 1969. [Google Scholar]
  34. Muthén, B.O.; Curran, P.J. General longitudinal modeling of individual differences in experimental designs: A latent variable framework for analysis and power estimation. Psychol. Methods 1997, 2, 371. [Google Scholar] [CrossRef]
  35. Hoyle, R.H. (Ed.) Statistical Strategies for Small Sample Research; Sage: New York, NY, USA, 1999. [Google Scholar]
  36. Bump, W.M. The Homogeneity of Regression Assumption in the Analysis of Covariance, Proceedings of the Annual Meeting of the Southwest Educational Research Association. Huston, TX, USA, 31 January–2 February 1992.
  37. Brunette, D.M. Critical Thinking: Understanding and Evaluating Dental Research; Quintessence: Chicago, IL, USA, 1996; pp. 187–203. [Google Scholar]
Figure 1. The designed experimental curriculum and the implementation process.
Sustainability 13 05117 g001
Figure 2. The overall framework of the designed ADDIE strategy curriculum.
Sustainability 13 05117 g002
Table 1. The timetable of the experimental curriculum.
WeekActivities
5thPre-test:
  • Basic statistical concept.
  • Data visualization software operation skills.
  • Critical thinking concept.
6thLecture: Critical thinking concept.
Practice: Critical thinking skill assignment.
7thLecture: Basic statistical concept I.
Practice: Basic statistic assignment: pre-test and post-test by Kahoot!
8thLecture: Basic statistical concept II.
Practice: Basic statistic assignment: pre-test and post-test by Kahoot!
9thLecture: Data visualization software operation skills: infographics.
Practice: Software operation with practical marketing data: pre-test and post-test by Kahoot!
10thLecture: Data visualization software operation skills: geographic data in map.
Practice: Software operation with practical marketing data: pre-test and post-test by Kahoot!
11thPractice: Discussion and software operation with practical marketing data.
12thCompetition: Data visualization software operation skills and interpretation of the meaning of produced infographics.
Post-test:
  • Basic statistical concept.
  • Data visualization software operation skills.
Table 2. The descriptive statistic results of participants’ backgrounds (n = 79).
VariableGroupn%MeanSt.Dev.ModeMedian
GenderFemale4962.00.380.4880.00.0
Male3038.0
AcademicLower1417.73.110.7343.03.0
ConfidenceMiddle4253.2
Higher2329.1
AcademicLower2430.43.560.9444.04.0
PerformanceMiddle3038.0
Higher2531.6
Critical Lower1215.215.763.78716.015.76
ThinkingMiddle2430.4
Higher4354.43.560.9444.04.0
Table 3. The results of the paired samples t-test analysis (n = 79).
UnitTestMeanSDThe Difference of Paired Variablest Value
MeanSDStd. Error of Mean95% Confidence Interval
LowerUpper
Statistic test mean scorePre7.151.908−2.4452.8250.318−3.078−1.812−7.692 ***
Post9.592.146
Infographic test mean scorePre3.460.698−2.6291.0270.116−2.859−2.398−22.739 ***
Post6.090.732
Map test mean scorePre3.130.865−1.8981.4860.167−2.231−1.565−11.352 ***
Post5.021.276
Note: *** p < 0.001.
Table 4. The original pre-test and post-test mean scores and standard deviation coefficients (n = 79).
Pre- TestPost- Test
SubjectsUnitsGroupnMeanSDMeanSD
StatisticHigh237.181.71110.141.893
Middle427.421.9639.482.394
Low146.271.9139.011.598
InfographicHigh233.520.7985.970.855
Academic Confidence Middle423.410.7156.110.578
Low143.500.4626.210.939
MapHigh233.451.0135.051.296
Middle423.030.7205.081.197
Low142.880.9174.801.530
StatisticHigh258.002.15210.121.587
Middle306.951.4429.411.756
Low246.501.9029.272.940
InfographicHigh253.520.7786.100.733
Academic Performance Middle303.430.5056.100.761
Low243.430.8326.060.781
MapHigh253.410.8405.331.143
Middle303.080.5904.981.189
Low242.891.1004.761.484
StatisticHigh258.002.15210.121.587
Middle306.951.4429.411.756
Low246.501.9029.272.940
InfographicHigh253.520.7786.100.733
Critical Thinking Middle303.430.5056.100.716
Low243.430.8326.060.781
MapHigh253.410.8405.331.143
Middle303.080.5904.981.189
Low242.891.1004.761.484
Table 5. The ANCOVA analysis coefficients of the critical thinking variable (n = 79).
UnitGroupAdj. MSESourceSum of SquaresdfMSFEta²Observed Power (a)
High10.0320.320Contrast34.219217.1093.952 *0.0950.693
StatisticMiddle9.5460.426Error324.720754.330
Low8.1010.604
High6.3100.215Contrast0.88920.4440.815 n.s.0.0210.185
InfographicMiddle6.1170.152Error40.894750.545
Low6.0080.113
High5.1130.199Contrast0.33020.6650.399 n.s.0.0110.112
MapMiddle5.1040.373Error124.918751.666
Low4.8230.267
Note: n.s.: p > 0.05; *: p < 0.05.
Table 6. The post-survey response results (n = 79).
ItemsResponsesRanking
5. The teacher is attentively92%1
3. This course is designed attentively88%2
9. I think my competency to be enhanced via this course in data visualization skills84%3
7. I feel the data visualization skills is useful to me84%4
8. I agree to learn data visualization skill is important84%5
6. I learned marketing management knowledge in this course84%6
4. The progress is appropriated for me83%7
1. The materials is suited for me for learning83%8
2. I can easy to learn by the teaching method82%9
10. I enjoy the course which combined theory and practical case and data81%10
12. I learned the critical thinking concept80%11
11. My learning performance in this course78%12
The overall evaluated of the course88%
Publisher’s Note: MDPI stays neutral with regard to jurisdictional claims in published maps and institutional affiliations.

