
The Analysis of the Factors Influencing the Severity of Bicyclist Injury in Bicyclist-Vehicle Crashes


1
Department of Transport Systems, Traffic Engineering and Logistics, Faculty of Transport and Aviation Engineering, Silesian University of Technology, Krasińskiego 8 Street, 40-019 Katowice, Poland
2
Department of Engineering, University of Palermo, Viale delle Scienze Ed 8, 90128 Palermo, Italy
*
Author to whom correspondence should be addressed.
Sustainability 2022, 14(1), 215; https://doi.org/10.3390/su14010215
Submission received: 28 October 2021
/
Revised: 22 December 2021
/
Accepted: 23 December 2021
/
Published: 26 December 2021
(This article belongs to the Section Sustainable Transportation)
Abstract
:Transportation and technological development have for centuries strongly influenced the shaping of urbanized areas. On one hand, it undoubtedly brings many benefits to their residents. However, also has a negative impact on urban areas and their surroundings. Many transportation and technological solutions lead, for example, to increased levels of pollution, noise, excessive energy use, as well as to traffic accidents in cities. So, it is important to safe urban development and sustainability in all city aspects as well as in the area of road transport safety. Due to the long-term policy of sustainable transport development, cycling is promoted, which contributes to the increase in the number of this group of users of the transport network in road traffic for short-distance transport. On the one hand, cycling has a positive effect on bicyclists’ health and environmental conditions, however, a big problem is an increase in the number of serious injuries and fatalities among bicyclists involved in road incidents with motor vehicles. This study aims to identify factors that influence the occurrence and severity of bicyclist injury in bicyclist-vehicle crashes. It has been observed that the factors increasing the risk of serious injuries and deaths of bicyclists are: vehicle driver gender and age, driving under the influence of alcohol, exceeding the speed limit by the vehicle driver, bicyclist age, cycling under the influence of alcohol, speed of the bicyclist before the incident, vehicle type (truck), incident place (road), time of the day, incident type. The obtained results can be used for activities aimed at improving the bicyclists’ safety level in road traffic in the area of analysis.
1. Introduction
Road traffic safety is an important public health issue in every country on the world. According to the data presented by the European Transport Safety Council [1], Poland belongs to the group of the most dangerous EU countries for bicyclists. In Poland, 8 bicyclists are killed per million inhabitants (in 2005, according to CARE/Eurostat data, this indicator amounted to less than 16 bicyclists killed (15.8) per million inhabitants annually [2]). On average in the EU, this indicator is twice as low and amounts to 4.2 [bicyclists/million inhabitants]. Apart from Poland, this infamous group also includes Serbia (8.5) and Lithuania (8.5). The proportion of the number of accidents to the bicycles traffic volume is also unfavorable. Bicyclists account for almost 10% of road fatalities, while the share of bicycles in total travel is estimated at only 1–2%.
A traffic incident (recorded by the police) is a traffic accident or collision that occurs or begins on a public road, in a traffic zone or in a residential area, due to the movement of at least one vehicle. Road incidents are divided into road accidents and road collisions. In a road accident, there are casualties, while in a road collision there are only material losses. Over the past few years, several thousand road incidents involving bicyclists have been recorded in Poland every year (Figure 1). This number is likely to be significantly underestimated. First of all, because many typical collisions involving a motor vehicle and bicycle, or even less serious accidents, do not require the involvement of the Police. Drivers often prefer to cover the damage on the spot in cash, so as not to receive a penalty notice and lose the discount in the insurance for a damage-free driving car. Secondly, random verification shows that also many incidents in which the Police participated are not recorded in the nationwide database in which information on road incidents is collected, i.e., in The System of Records of Accidents and Collisions (SRAC) [3].
In 2010–2020, an average of 316 bicycle users died in road accidents on Polish roads, and less than 2000 were slightly and seriously injured. This is a problem both in large cities, where the number of incidents is greatest, and in small towns, where accidents are less frequent but more severe. The presented statistics emphasize the need to understand the causes of the most serious and fatal accidents involving bicycles and motor vehicles in order to prevent such accidents in the future as well as mitigate the effects of dangerous road incidents.
In many reports, studies on road safety analyses can be found data on the number of road incidents, accidents, injured and dead per unit of time, area, or a number of inhabitants. None of these indicators is a measure of bicycling safety and does not directly reflect the risk of an accident during a bicycle trip. A higher number of accidents or collisions involving bicyclists in a given year, month, city, or province may result from a greater number of bicycle trips, not from a lower level of bicycle traffic safety. The lack of reference to the bicycle traffic volume often leads to wrong conclusions. Ultimately, correct indicators of bicycle traffic safety are, for example, the number of accidents (number of fatalities, number of injured) per million bicycle trips, number of accidents (number of fatalities, number of injured) per million bicycle kilometers. Such indicators would make it possible to draw conclusions about the level of safety, to make meaningful comparisons with other European countries and to legally formulate the objectives of road safety improvement programs. Unfortunately, currently in Poland, there is no reliable data on the number of trips or kilometers traveled by bike. While some cities carry out comprehensive traffic surveys, the percentage of bicycle journeys is within the error of the sample size.
On the Figure 2, the values of the relative indicator have been presented. The relative indicator of injured victims in a road accident is defined as the quotient of the number of injured victims of a given category of road users to the number of injured passenger car drivers. This indicator takes into account both the probability of participating in a road incident and the probability that a given user will be injured as a result of this incident. It is a relative risk, i.e., related to the average risk borne by a passenger car driver.
From Figure 2 it follows that bicyclists (9.4), after motorcyclists (12) and mopeds (as many as 65.4), are the third most endangered group of road users. The relative risk of being injured in the group of bicyclists is 9.4, which means that bicyclists are 9.4 times more likely than car drivers of being involved in a road incident that would result in injury. The likelihood of bicyclists, pedestrians, and car drivers participating in road incidents is almost identical. Different values of the relative indicator of the injured person in accidents for these groups of users result from a different degree of protection against the consequences of accidents. Drivers of passenger cars and trucks are protected by the vehicle structure, airbags, seat belts, etc., therefore the likelihood of being injured as a result of an incident is much less for them than for pedestrians and bicyclists.
Therefore, the aim of the research was to analyze the characteristics of bicyclists, vehicle drivers, road and road environment, which may affect the severity of injuries suffered by bicyclists in bicyclist-vehicle crashes. This analysis allowed for the identification of predictors influencing the probability of incurring certain types of injuries in a road incident, i.e., severe injuries and fatal injuries in accidents with motor vehicles, as these injuries have the most tragic consequences.
The paper consists of seven sections. After the introduction, the second section presents an overview of the literature on the subject in the field of research related to bicyclists’ road safety as well as previous research related to the analysis of factors determining the occurrence of injuries in road accidents. The third section contains a description of the used materials and the research methods. The collected data allowed for the performance of many different statistical analyzes regarding the time of occurrence of the incident, location of the incident, type and place of the incident, vehicles involved in the incident as well as causes and participants. Hence, the fourth section contains an analysis of selected features of road incidents of bicyclists with motor vehicles. The fifth section is devoted to modeling the severity of bicyclist injury in bicyclist-vehicle crashes, characterizes the binomial logit model as a modeling technique, defined dependent and explanatory variables as well as factors influencing the performance and severity of bicyclist injury in bicyclist-vehicle crashes. The next section discusses the obtained variables that affect the likelihood of a bicyclist suffering severe or fatal injuries. The paper ends with conclusions from the conducted research as well as a description of future research in this area.
2. Literature Studies in the Field of Research Concerning Bicyclists Safety Analysis
Cycling can be used not only as a form of travel in everyday commuting to work but also as a form of recreation. Regardless of whether it is a trip realized by bike or recreational riding, bicyclists are usually exposed to many risks. The problem is particularly important because bicyclists and pedestrians belong to the group of unprotected road users, i.e., participants who are particularly vulnerable to injuries in possible road accidents. In the literature on the subject, can be found a lot of different, multi-faceted scientific works in the field of bicycle traffic safety analyzes.
For example, J.R. Klop and A.J. Khattak [6], investigated the influence of physical and environmental factors on the severity of bicyclists’ injuries in accidents involving bicyclists and motor vehicles occurring on two-lane, undivided roadways in the USA. Using an ordered probit model, they investigated the effect of a set of road, environmental, and collision variables on the severity of bicyclists’ injuries. Variables that greatly increase the injury severity include straights, dips, horizontal arcs, darkness, fog, and speed limit. The higher average annual daily traffic, speed limits, and unfavorable lighting conditions significantly increase the severity of bicyclist injuries. The authors constructed separate models for rural areas and separate models for urban areas.
While E. Robanes and T.D. Chen [7] investigated the influence of bicyclists ‘characteristics, vehicle drivers, and the road environment on the degree of bicyclists’ injuries. The results of this study indicated that driving a car under the influence of alcohol six times increased the likelihood of a bicyclist’s death and doubling the risk of a serious injury. On the other hand, a bicyclist who is intoxicated and rides a bicycle increases the likelihood of death by 36.7% and doubles the likelihood of serious injury. In addition, these studies have shown that bicycle and car speed, lack of proper visibility of the car driver, certain types of the vehicle body (SUV, truck, and van), vertical slopes, and horizontal curves increase the likelihood of bicyclists more serious injuries. The authors recommend conducting social campaigns in the field of the intoxicated bicyclist, education about alcohol-induced incidents and the negative effects of such incidents for bicyclists, as well as suggest physical separation of vehicles and bicycles on the road by introducing changes to the existing infrastructure.
In turn, A. Behnood and F. Mannering [8], using the results obtained from the multinomial logit model, found that the probability of serious injuries in accidents involving a motor vehicle and a bicycle is influenced by many potential factors, mainly: race and sex of the vehicle driver and bicyclist, sobriety of the motor vehicle driver and bicyclist, age of the bicyclist (the older the bicyclist is, the greater the likelihood of a road incident and serious injuries by the bicyclist), driving on the wrong side of the road, dangerous speeding by vehicle drivers, bicyclist without a helmet. The results of these studies indicate the need for further research on the factors influencing the severity of bicyclists’ injuries.
Whereas J.K. Kim et al. [9] analyzed the factors contributing to the severity of bicyclist injuries in accidents involving a motor vehicle and a bicycle in the US using the multinomial logit model. The constructed model allows determining the probability of four levels of severity of bicyclist injuries: fatal, incapacitating, non-incapacitating, and no injuries. The results from the analyzes allowed for the conclusion that it is possible to indicate several factors, the influence of which causes more than twice the probability of a fatal injury to a bicyclist in a road accident, while all other factors were kept at a constant level. These factors include factors such as unfavorable weather conditions, darkness (no street lighting), peak in the morning (from 06:00 a.m. to 09:59 a.m.), frontal collision, exceeding the speed limit, vehicle speed above 48.3 km/h (30 m/h), involvement in a truck incident, intoxicated driver, intoxicated bicyclist, bicyclist aged 55 or older. The conducted analyzes also allowed to determine the role of speed in the severity of injuries. Analyzes indicated that when the vehicle speed before the collision is greater than 80.5 km/h (50 m/h), the likelihood of a bicyclist being fatally injured increases more than 16 times. The threshold speed of a motor vehicle was also indicated at the level of 32.2 km/h (20 m/h), as ensuring the appropriate level of bicyclist safety. This conclusion confirms the validity of the application of speed limits of up to 30 km/h in residential areas.
The literature on the subject also includes research works dedicated to the analysis of the severity of bicyclists’ injuries in case the bicyclist uses an electric bicycle. T. Wang et al. [10] identified a number of factors related to the severity of injuries in bicyclists. As the most important factors contributing to increasing the severity of bicyclists’ injuries, T. Wang et al. indicated older e-bike users, intoxicated drivers, inexperienced drivers, a significant share of motorcycles, a significant share of trucks, exceeding the speed limit, motorway, performing a left-turn maneuver by an e-biker, performing a right-turn maneuver by an e-biker, crossing the road, intersection with traffic lights, winding road, industrial site, weekday. In turn, the variables correlated with the reduced severity of injuries in e-bikes include two-way divided carriageways with separation of directions in the form of trees or barriers, occurrence of an incident during rush hour, highly urbanized and economically developed area, including commercial area and residential area. On the basis of the obtained results, it was also found that older e-cyclists and inexperienced drivers are special groups that should be subjected to separate studies of behavior.
S. Liu and W.D. Fan investigated differences in the behavior and severity of injuries of bicyclists involved in road incidents taking place on weekdays and during weekends traveling on US roads [11]. To this end, the authors developed an ordered logit model and logit models of partial proportional odds for the severity of injuries in weekday and weekend incidents, respectively. The obtained results allowed to state that different sets of determinants were identified for weekdays and for weekends, as well as the influence of the same determinants is different on weekdays from weekends. The authors found that the most significant influence on the severity of injuries to bicyclists on weekdays was such as older bicyclists, direction of travel, collision of a bicyclist with a pickup truck, male drivers, time period from 0:00 a.m. to 5:59 a.m. and from 10:00 a.m. to 14:49 p.m. In turn, speed limits of 45–55 km/h and commercial areas have the greatest impact on the severity of bicyclists’ injuries on weekends. In turn, such features as speed limits, time of day, alcohol consumption by participants of a road accident, severity of injuries are different for weekdays and different for weekends.
In recent years, in the scientific literature, a certain part of the research work has been devoted to research aimed at determining the role of protective helmets used by bicyclists in protecting the health and life of a bicyclist. The conclusions of the conducted research indicate that the use of a helmet is indicated due to a reduced risk of head trauma, serious head trauma, facial trauma, and fatal head trauma. The studies presented in the research work of J. Olivier and P. Creighton [12] indicate that the reduction of the risk of head injury to a bicyclist wearing a protective helmet is greater in the case of severe or fatal head injuries. Neck injuries, on the other hand, are not related to the use of a helmet. However, based on research conducted in the USA by F.P. Rivara et al. [13] found that it is not possible to prevent serious injury to bicyclists by only using a helmet while cycling. Other factors are equally important. Table 1 summarizes the features studied by selected authors that may affect the severity of bicyclist injury in a road incident.
In general, the characteristics that have the potential to influence the severity of bicyclists’ injuries, and that have been studied by various authors, can be grouped into several groups, such as:
- bicycle characteristics—e.g., bicycle speed before crash, bicyclist drinking, bicyclist vision obscured/not obscured, bicyclist distraction/lack of bicyclist distraction, helmet-wearing/no helmet, drug use, gender (female, male);
- vehicle driver characteristics—e.g., vision obscured, driver drinking, gender (female, male), vehicle condition (defective/not defective), vehicle driver vision obscured/not obscured, vehicle driver distraction/non-distraction, drug use;
- vehicle characteristics—e.g., vehicle speed before crash, vehicle type (passenger car vehicle, SUV, truck, van, division into small and large vehicles), vehicle condition (without defects, with a technical defect)
- environmental characteristics—e.g., lighting conditions (dawn, daylight, dusk, darkness—road lit, darkness road unlit), weather conditions (no rainfall, rainfall);
- roadway characteristics—e.g., two-way divided unprotected, two-way divided median, one way roadway, vertical alignment (straight, curve), vertical alignment level (grade, hillcrest, dip), horizontal align curve, location (no intersection, intersection of a given type, traffic control), number of intersection arms (two approaches, three approaches, four or more approaches), location-zone (school zone, out-of-school zone, work zone), road surface type (concrete, asphalt, gravel, stone, cobblestone), surface condition road (dry, wet)
Summarizing the review of the scientific literature in the field of research conducted so far in the analysis of bicyclists’ road safety and determining the severity of bicyclist injuries in a road incident, it can be concluded that in different works, different authors selected different sets of determinants of the bicyclist severity of injuries in road incidents. However, the studies conducted so far in this area allow stating that among the features that have been identified as the ones that most often affect the severity of bicyclist injuries in road incidents, there are primarily such features as the speed of the motor vehicle involved in the incident, the speed of the bicyclist, the bicyclist’s age, time of day, lighting of the incident site, occurrence of the incident on weekdays, on weekends, participants in the incident under the influence of alcohol, wearing a helmet by the bicyclist (but only in the case of light and moderate injuries of the bicyclist). It should be noted, however, that in many cases the limitation of the conducted research was the possibility/inability to obtain detailed or specific data for the analysis. On the other hand, taking into account the mathematical apparatus used in the analysis, it should be stated that despite the research work with the use of machine learning models to identify significant factors affecting bicyclists’ injuries [26,27,28], the dominant works are those in which the authors used in their analyzes discrete choice models (i.e., logit models [29,30], mixed logit models [16,31], probit models [7], or polynomial logit models [32,33,34,35]). Discrete choice models are more often selected for analysis of factors affecting bicyclists’ injury, as the model inputs, as well as the outputs, are usually discrete. Moreover, the parameters estimated on the basis of the discrete model have more possibilities of interpretation.
3. Materials and Methods
The subject of the research was the determination of the factors affecting the severity of bicyclist injury in bicyclist-vehicle crashes. Data on the number of road accidents involving a motor vehicle and a bicyclist and the characteristics of these incidents came from various sources. They were:
- database containing information on all types of road incidents registered by the Police in Poland since 2007 (Accident and Collision Recording System (ACRS) [3]),
- data from the Traffic Control Center (TCC). TCC records and archiving of information about road traffic and road scene at transport network covered by the area traffic control system have been taking place continuously since 2013. The database created in this way enables the analysis of necessary data such as vehicle and bicycle characteristics and accident circumstances. The TCC is connected to Intelligent transport systems which use advanced technologies in the field of remote sensing, data collection, information processing, telecommunications, and traffic control to meet the current transport needs,
- orthophoto maps from publicly available websites in order to inventory the road/intersection, road geometry, and type of road surface. The ortophoto maps it is a raster image of the terrain surface, resulting from the processing of aerial or satellite images, thanks to which it was possible to identify the necessary data.
The area of analysis was Silesian Voivodeship (Poland). The data included all incidents involving bicyclists in the Silesian Voivodeship that took place in 2019. According to [3,36], in 2019, 1410 road incidents involving bicyclists took place in the Silesian Voivodeship. There were 8 fatalities, 130 seriously injured, and 1272 lightly injured in these events. As much as 94% of the incidents took place outside built-up areas.
The main limitation of the data on road incidents recorded in the database is their underestimated number (of unknown scale), as not all incidents were reported to the police and recorded in the database. This limitation applies to all types of incidents, including incidents involving bicyclists, as such incidents take place mainly on local streets and are not always reported to the police (especially those in which the participants were not injured or were minor injured). This limitation may, to some extent, affect the obtained results, but despite these limitations, generally available databases are the best source of data for this type of analysis due to the richness and diversity of the collected data.
On the other hand, the data from the Accident and Collision Recording System was supplemented with information downloaded from road remote sensing devices for the analysis area. Much of the transport network of the analysis area is equipped with vehicle detection and traffic control systems, video detection cameras, and induction loops, which are part of the intelligent transportation system. Remote sensing tools are an effective means of detecting vehicles and traffic conditions in the transport network. Digital camera images are ideal for obtaining various road traffic parameters such as average vehicle speed, vehicle density, congestion start and end, congestion length, or other road traffic monitoring applications.
The following assumptions were made for the analysis of the occurrence and severity of bicyclist injury in bicyclist-vehicle crashes:
- only incidents involving a bicyclist and a motor vehicle were analyzed,
- the data relates to working days, i.e., from Monday to Friday. Weekend days (i.e., Saturdays and Sundays) were not included in the analysis, as these days are characterized by a lower traffic volume and thus by different traffic and accident characteristics.
In traffic incidents, the bicyclist may not be injured or maybe slightly injured, seriously injured, or fatally injured. According to [37], a fatal victim of a road accident is a person who died as a result of the injuries on the spot or within 30 days. An injured victim of a road accident is a person who has been injured and has received medical attention. According to [38,39], a seriously injured victim of a road accident is a person who has suffered a health impairment in the form of loss of eyesight, hearing, speech, walking ability, other severe disability, severe incurable disease, or a long-term real life-threatening disease, permanent mental illness, total significant permanent incapacity to work in the profession or permanent, serious disfigurement or distortion of the body or other injuries resulting in the violation of the functions of an organ of the body or health deterioration lasting more than 7 days. On the other hand, a slightly injured victim of a road accident is a person against whom a doctor or paramedic stated that he or she had suffered a health impairment or injuries other than those specified in the definition of a seriously injured person.
In 2019 in the Silesian Voivodeship in bicyclist-vehicle crashes were 8 fatalities, 130 seriously injured and 1272 slightly injured bicyclists. Due to the fact, in the modeling process, two groups of bicyclists were distinguished, i.e., bicyclists with slight injuries and bicyclists with serious and fatal injuries. When constructing the model, it should be remembered that the size of the data set for the construction of the logit model should be ten times greater than or equal to the number of estimated model parameters (n-10 (k + 1)) [40,41]. This condition has been met in this study.
4. Analysis of Selected Features of Road Incidents Involving Bicyclists
The collected data allowed for the performance of many different statistical analyzes regarding the incidents time and location, type and place of the incidents, vehicles involved in the incident, as well as causes and participants characteristics. Selected characteristics representing the above-mentioned features are presented in the following part of this section.
Analyzing the collected data set, it can be concluded that 1203 incidents (i.e., 86%) occurred during the day in daylight, 117 (8%) at night in conditions when the road was illuminated, 60 (4%) incidents occurred at dusk/dawn and the least, i.e., 30 (2%) incidents at night when the road was unlit (Figure 3). These results confirm the well-known regularity that in conditions of good visibility, daylight, well-lit road, drivers have excellent conditions to develop high speeds and tend to drive with a small margin of safety. On the other hand, unfavorable lighting and weather conditions contribute to increasing the attention of vehicle drivers, reducing vehicle speed, and driving with greater caution, which translates into the number of road incidents.
On the other hand, taking into account the variability of the number of incidents over time, the analysis covered the variability of the number of incidents per month, on individual days of the week, and the variability of the number of incidents in individual hours of the day. The analysis of the number of incidents in individual months of the year shows that the largest number of incidents took place in the summer-autumn period from June to September (Figure 4a). This period corresponds to the occurrence of warm weather in Polish conditions, conducive to the use of the bicycle both when traveling to and from work, as well as for tourist purposes. On the other hand, the distribution of the number of incidents on individual days of the week indicates that on individual working days there is a similar number of incidents with a visible spike on Saturdays and Sundays (Figure 4b).
In Figure 5a, the daily distribution of the number of road incidents involving bicyclists is shown. The figure shows that the highest number of incidents takes place in the afternoon, between 2 p.m. and 6 p.m. Most road incidents involving bicyclists take place under circumstances conducive to good control of the vehicle, i.e., in good weather conditions, on a dry surface (Figure 5b). These are probably the circumstances conducive to greater intensity of bicycle traffic, although the greater propensity of drivers to engage in risky behaviors may also be important (driving fast, overtaking, etc.).
Taking into account the variability of individual types of road incidents with bicyclists, it can be stated that the most common type of incident is side-impact collisions (58%). Rear collisions, which are instinctively the most feared by novice bicyclists on the road, are more than four times less frequent (14%). Apart from side-impact collisions and rear vehicle collisions, frontal collisions are also relatively frequent (10%). Up to 3% of all incidents are collisions on pedestrians, immobilized vehicles, and bicyclist rollover. The remaining types of incidents are reported sporadically (Figure 6). It is worth noting that the distribution of incident types clearly depends on the area. While side-impact collisions remain dominant regardless of the area, they are almost 6 times more frequent in built-up areas than rear collisions, and in undeveloped areas—only by 50%. In large cities (cities with poviat rights) a pedestrian collision occurs much more often. While, in rural areas, bicyclists roll over more often.
Figure 7 are shown the characteristics of the incidents for bicyclists depending on the place of the incident (Figure 7a) and road geometry (Figure 7b). When analyzing the place of the incident, it can be concluded that the most incidents took place in the area of the road (as much as 72%), followed by the sidewalk, footpath (9%), a ride for bicyclists (6%), zebra crossing (6%), road lane, bicycle look (4%). On the other hand, in terms of road geometry, most incidents took place on the straight section (90%) and then on the horizontal curve of the road (6%).
5. Modeling of the Severity of Bicyclist Injury in Bicyclist-Vehicle Crashes
5.1. Binomial Logit Model as a Modeling Technique
The collected data was analyzed using the binomial logit model. The binomial logit model is used to determine the probability of a given phenomenon. If the dependent variables are of a qualitative nature, their representants in the model are dichotomous variables. These variables in the model take the following values [42]:
where:
Yn—dependent variable.
Yn—the dependent variable (n = 1, 2),
K—the number of independent (explanatory) variables,
x1, x2, x3, …, xk—the explanatory variables,
α1, α2, α3, …, αk—structural parameters of the model.
The logit model (2) is transformed using logarithm to the following form:
Equation (3) is called the odds ratio and is expressed as the ratio of the probability that a phenomenon will occur to the probability that a phenomenon will not occur.
5.2. Dependent and Explanatory Variables
The analysis of the factors influencing the occurrence and severity of bicyclist injury in bicyclist-vehicle crashes was performed using the binary logit model. The severity of bicyclist injury is the dependent variable in the model and is defined as a binary variable, i.e.,:
- 1 = bicyclist with severe and fatal injuries and
- 0 = slightly injured bicyclist.
The independent variable and their binary definition have been presented in Table 2.
5.3. The Factors Influencing the Occurrence and Severity of Bicyclist Injury in Bicyclist-Vehicle Crashes
In the first stage of analyzes with the use of the correlation matrix, those variables that showed a strong mutual correlation (R ≥ 0.7) were excluded from the model. On the other hand, the verification of the statistical significance of the predictors for the dependent variable Y1 using the Wald coefficient (Table 3) showed that the degree of injuries to bicyclists in bicyclists—vehicles crashes was significantly (i.e., for which p < 0.05) influenced by such features as:
- vehicle driver characteristics: gender (X1) and age (X2), intoxicated driver (X3), exceeding the speed limit (X6),
- bicyclist characteristics: bicyclist age (X8), intoxicated bicyclist (X9), bicyclist speed before the incident (X10),
- vehicle characteristics: vehicle type (X11),
- road characteristics: incident place (X14),
- environmental characteristic: time of the day (X19),
- accident characteristics: the type of incident (X21).
Hence, the model that allows determining the probability of the influence of particular explanatory variables on the severity of bicyclists’ injuries in bicyclist-vehicle crashes (Y1) takes the general form:
The estimated structural parameters of the model Y1 together with the level of statistical significance of the predictors of the random variable are presented in Table 3.
The quality of the model fit is described by the coefficients Pseudo R2 = 0.29, R2 Nagelkerke = 0.41 and R2 Coxa–Snell = 0.31. The goodness of fitting the model to the expected variables was also confirmed by the Hosmer and Lemeshow test (p = 0.1927), in which the observed abundance of the distinguished value and the predicted probability are compared for different data. The collective test of the model coefficients showed its significant difference compared to the model containing only the intercept (p < 0.001).
According to R2 Nagelkerk’s calculated value, it explains 41% of the variance of the dependent variable. Summing up, it can be concluded that the model is statistically significant, which is also confirmed by the likelihood ratio test result (<0.00001).
Since an increase in Xi by a unit increases (decreases) the cetis paribus the odds ratio to Exp(αi) [(Exp(αi)-1)·100%]. Hence, on the basis of the constructed model and the odds ratios calculated for individual predictors, it can be concluded that the probability of severity of bicyclist injury in bicyclist-vehicle crashes:
- decreases by 21% when the vehicle driver is a female and other variables remain unchanged,
- increases by 47% if the vehicle driver is a young (up to 60 years old), cetis paribus,
- increases by 29% in the case when the vehicle driver is intoxicated, cetis paribus,
- increases by as much as 92% when the vehicle driver exceeds the speed limit, cetis paribus,
- increases by 13% if the bicyclist is older than 60 years old, cetis paribus,
- increases by 11% if the bicyclist is a intoxicated, cetis paribus,
- increases by as much as 84% if the bicyclist exceeded speed = 30 km/h, cetis paribus,
- increases by as much as 72%, if the vehicle is truck, cetis paribus,
- increases by 55% if the accident happened on the road area, cetis paribus,
- increases by 59% if the crash occurred during nighttime, i.e., from 22:00 p.m. to 6:00 a.m., cetis paribus,
- increases by 65% if the crash was a head-on collision, cetis paribus.
6. Discussion
The lack of protective systems in vehicles and the much higher speed of motor vehicles than the speed of bicyclists make bicyclists very susceptible to injuries. Along with the growing popularity of using bicycles in road traffic (which is also facilitated by bike-sharing systems [43,44,45]), the number of serious accidents involving bicyclists and the severity of injuries suffered by bicyclists, especially in urban environments, is also growing.
When analyzing vehicle driver characteristics, it should be stated that such features as vehicle driver gender and age, the driver of the vehicle under the influence of alcohol, exceeding the speed limit by the vehicle driver turned out to be significant factors that determine the probability of serious and fatal injuries by a bicyclist. In the case of the gender of the vehicle driver, the probability of severity of bicyclist injury in bicyclist-vehicle crashes is reduced when the vehicle driver is female. Women tend to drive more sensibly and at a lower speed than men. Men are often looking for strong sensations and get some satisfaction from speeding, which may translate into a reduction in the level of road safety. Similar results were obtained in their research by S.L. Liu and W.D. Fan [11] or Y. Li and W. Fan [46].
The likelihood of a bicyclist being seriously injured or fatally injured increases if the vehicle driver is young (up to 60 years old). Young vehicle drivers, in contrast to older drivers, are characterized by faster response times, better parameters characterizing eyesight and health, but at the same time they are impatient, seek strong sensations, have little driving experience. Older vehicle drivers tend to have poorer health and a longer reaction time, but they are often balanced, responsible and disciplined. In addition, older vehicle drivers have participated many times in various typical road traffic situations, which meant that they are taught how to react to given road traffic situations in an appropriate manner. The reaction time of an experienced, older driver is shorter than that of an inexperienced driver, which results from the experience already acquired in life. It is also believed that experience to some extent compensates for the unfavorable changes in responsiveness that occur with age.
If a vehicle driver is intoxicated, the likelihood of a bicyclist being seriously injured or fatally injured increases. Similar research results confirming the increased probability of serious injuries or fatal injuries in a road accident were also obtained by J.K. Kim et al. [9] or L. Guohua et al. [47]. This conclusion is basically indisputable, as each intoxicated road user poses a threat to other road users, regardless of the means of transport they are using. This conclusion also emphasizes the constant need to conduct social campaigns to make people more aware of the great danger for themselves and other road users driving under the influence of alcohol.
Exceeding the speed limit by the vehicle driver is also an element that contributes to the increase in the likelihood of a bicyclist suffering serious or fatal injuries. Similar conclusions are confirmed by many published scientific works, e.g., by J.K. Kim et al. [9] or S. Boufous et al. [30]. At higher vehicle speeds, the driver shifts his eyesight to farther distances, which at the same time makes the driver’s immediate surroundings poorly perceived. Therefore, bicyclist safety can be improved by reducing vehicle speed in areas where increased bicyclist traffic is expected.
For bicycle characteristics, such features as bicyclist age and alcohol usage were found as significant factors in the severity of bicyclist injury in bicyclist-vehicle crashes. The bicyclist age, especially if the bicyclist is older than 60 years old, is a factor that increases the risk of and seriously injuring bicyclists compared to other age groups of bicyclists. This result is in line with the test results obtained by S.A. Samerei et al. [48]. Moreover, according to the data presented in the research work of S. Scheiman et al. [49], half of the fatally injured bicyclists in a road accident involving a motor vehicle in Sweden are bicyclists aged 65 years and over. Conclusions in this area are particularly important in the context of aging societies in many countries, which will contribute to an increase in the share of this particular group of bicycle users in road traffic. Hence, detailed knowledge in this regard is particularly important.
The level of bicyclists’ safety also depends to some extent on the available infrastructure for bicyclists and the safe bicycling practices of bicyclists. However, even a very well-designed transport infrastructure and adherence to good practices do not apply when a bicyclist is intoxicated. The effects of alcohol consumption by bicyclists have a negative impact on the severity of the injuries. These results are consistent with most previous research studies (e.g., with D.N. Moore et al. [14], N.K. Namini et al. [50], S.L. Liu and S.L. Fan [11], B.E. Smink et al. [51]. On the other hand, the conclusions of these analyzes can be used to conduct awareness-raising campaigns while bicycling under the influence of alcohol and to design a safe infrastructure for bicyclists far from motor vehicle traffic.
In general, bicyclists are obliged to obey the same traffic rules as vehicle drivers. Bicyclists are most often injured by inattentive drivers, but they too often contribute to accidents themselves. In the analyzed voivodeship, in 2019 the most common cause of accidents caused by bicyclists was the non-yielding of right-of-way. However, in the second place, there was maladjustment of speed to traffic conditions, and in the third place, incorrect execution of a turning maneuver. Cycling at high speed probably causes that the bicyclist is not able to observe the surroundings with sufficient precision and attention. The results of the conducted analysis allowed to state that the probability of serious or fatal injuries by a bicyclist increases by as much as 84% in a situation where the bicyclist exceeded speed = 30 km/h. Similar research results were also obtained by J. Killops et al. [52] and E. Macioszek and A. Kurek [53].
The truck turned out to be a very important factor contributing to the increase in the likelihood of a bicyclist suffering severe and fatal injuries by as much as 72% when the level of other variables would be the same. Nowadays, people are encouraged to cycling because this form of travel has a positive effect on their health and reduces the negative effects of motorized traffic. On the other hand, the rapid economic development and consumer demand contribute to the increase in the traffic volume of trucks in cities [54,55,56,57,58]. Due to the increasing traffic volume for both trucks and bicyclists, their routes often intersect in some confined urban spaces. G. Vandebulcke et al. [59] and C. Allen-Munley and J. Daniel [60] have shown in their research that the mere presence of a truck in road traffic contributes to a greater risk of an accident for bicyclists, and accidents of bicyclists with a truck usually have serious consequences for the bicyclist. Therefore, in order to improve the level of bicyclists’ safety in this aspect, it would be necessary to strive for urban design of cities in such a way as to physically separate the spaces dedicated to bicyclists and trucks. The ideal solution, due to the level of bicyclists’ safety, would be to completely separate the spaces dedicated to bicyclists from the spaces dedicated to motor vehicles.
Bicyclists have the opportunity to cycle around various elements of the transport network. Bicyclists can cycle along lanes shared with motor vehicles, on designated bicycle lanes dedicated to bicyclists adjacent to motor vehicle lanes, and on segregated bicycle lane, away from the traffic lanes dedicated to motor vehicles as well as on shared bus and bicycle lanes or on shared bicycle lane and footpath. The results of the analyzes showed that the likelihood of a bicyclist being seriously injured or fatally injured increases by 55% if the accident happened on the road area when bicyclists share lanes with motor vehicles. Therefore, it should be concluded that the bicycle infrastructure that allows bicyclists to cycle along lanes separated from road traffic lanes dedicated to motor vehicles has a positive effect on the protection of bicyclists’ health and life. Similar results were obtained in research studies conducted e.g., by C. Hamann and C. Peek-Asa [61]. Some other research studies, e.g., A. Raihan et al. [62] additionally indicate that the presence of sidewalk and sidewalk barriers was found to increase the bicycle crash probabilities. Further research in this area should compare the effectiveness in reducing the number of incidents and the severity of bicyclists’ incidents on different forms of transport infrastructure dedicated to bicyclists.
The results of the analyzes also show that the probability of bicyclists being serious or fatal increases by 59% if crashes occurred during nighttime, i.e., from 22:00 p.m. to 6:00 a.m. Both the behavior of bicyclists and vehicle drivers are characterized by certain daily patterns, patterns in different periods of the year. Hence, the behavior of bicyclists and drivers may be different at different times of the day. The period of the day, time of day, has already been identified as an important factors contributing to the occurrence of bicycles severe and fatal injuries in numerous previous studies in this field, e.g., S. Boufous [30], S.A.H. Zahabi et al. [63]. The level of illumination is significantly related to the severity of bicyclists injuries. The bicyclists’ injuries turn out to be severe at dawn and in the dark (both in the presence of light and in unlit road conditions) compared to the injuries sustained in daylight. Many studies (e.g., M. Asgarzadeh et al. [64]), show that the risk of bicyclists’ serious injuries are also high in the early morning hours, before 7 a.m., and may persist even up to 4 p.m. (S. Bahrololoom et al. [65]).
The results showed that the likelihood of bicyclists’ serious or fatal injuries increases by 65% if the crash was a head-on collision. This result seems to be logical as the head-on collision of a bicyclist with a motor vehicle can lead to serious consequences. Many studies have indicated that it was one of the most important factors contributing to bicyclists’ fatal injuries. It was confirmed by research conducted e.g., by M. Bil et al. [66], X. Yan et al. [19], S.L. Liu [11], J.K. Kim et al. [9]. These research works also indicated that an equally important type of incident contributing to the bicyclists’ serious and fatal injuries in a road incident are side-impact collisions.
7. Conclusions
An important element of road traffic safety, apart from the safety of vehicle drivers, is also taking care of other road users, i.e., pedestrians and bicyclists, also often called unprotected road users. In recent years, the number of bicyclists participating in road traffic has been steadily increasing. Many cities have adopted their infrastructure to the needs of not only motorized road users but above all to the needs of vulnerable road users. Despite this, the number of road accidents involving bicyclists is still high, and bicyclists suffer the most severe injuries in this type of accident. In connection with the above, it is important to know the main reasons for the occurrence of these incidents so that in the future it will be possible to effectively prevent their occurrence.
The article presents the analysis of the factors influencing the occurrence and severity of bicyclist injury in bicyclist-vehicle crashes. Crash data from the Silesian Voivodeship in 2019 constituted the basis for the development of a binomial logit model allowing to determine bicyclist injury severity in bicyclist-vehicle crashes during the working days i.e., from Monday to Friday in the analyzed area. The obtained results allow to concluding that the main factors influencing the occurrence of and severity of bicyclist injury in bicyclist-vehicle crashes in the Silesian Voivodeship (Poland) in 2019 include: vehicle driver gender and age, intoxicated vehicle driver, exceeding by the vehicle driver speed limit, bicyclist age, intoxicated bicyclist, bicyclist speed before a crash, vehicle type, especially when it is a truck, place of the incident, time of the day and the type of incident. Proper recognition of these factors is crucial in developing the right strategies to protect bicyclists from injury, particularly severe and fatal injuries.
The presented studies were pilot studies as they covered one voivodeship and data from one year. Future research in this area should concern the extension of the analysis period up to available data for the analyzed area as well as the extension of the analysis area for a larger number of voivodeships or even up to the entire territory of Poland. In addition, further research work may also include detailing the injuries sustained by bicyclists by looking at slight injuries, serious injuries, and fatal injuries separately. This refinement will probably contribute to the improvement of the accuracy of the model estimation. Moreover, the further research works could also include inclusion weekend days (i.e., Saturdays and Sundays). Weekend days are characterized by a lower traffic volume and thus by different traffic and accident characteristics. Therefore, future works could also contain a separate analysis for weekend days, and then will be possible to conclude about the differences in the events that occurred on weekdays and on weekend days.
Author Contributions
Conceptualization, E.M. and A.G.; methodology, E.M. and A.G.; software, E.M. and A.G.; validation, E.M. and A.G.; formal analysis, E.M. and A.G.; investigation, E.M. and A.G.; resources, E.M. and A.G.; data curation, E.M. and A.G. writing—original draft preparation, E.M. and A.G.; writing—review and editing, E.M. and A.G.; visualization, E.M. and A.G.; supervision, E.M. and A.G.; project administration, E.M. and A.G.; funding acquisition, E.M. and A.G. All authors have read and agreed to the published version of the manuscript.
Funding
Publication supported under the Rector’s pro-quality grant. Silesian University of Technology, grant number 12/040/RGJ21/0039.
Institutional Review Board Statement
Not applicable.
Informed Consent Statement
Not applicable.
Data Availability Statement
Not applicable.
Acknowledgments
The authors would like to gratefully acknowledge the reviewers who provided helpful comments and insightful suggestions on the draft of the manuscript.
Conflicts of Interest
The authors declare no conflict of interest.
References
- European Transport Safety Council. Available online: https://www.brd24.pl/technologie/europejski-raport-rowerzystach-polska-niebezpieczna/ (accessed on 15 July 2021).
- Eurostat Data. Available online: https://ec.europa.eu/eurostat/web/main/data/database (accessed on 15 July 2021).
- Accident and Collision Record System. Available online: http://sewik.pl/search (accessed on 16 July 2021).
- Elvik, R.; Høye, A.; Vaa, T.; Sørensen, M. The Handbook of Road Safety Measures, 2nd ed.; Emerald Group Publishing: Bingley, UK, 2009. [Google Scholar]
- Macioszek, E.; Kurek, A.; Kowalski, B. Overview of safety at rail-road crossings in Poland in 2008–2018. Transp. Probl. 2020, 15, 57–68. [Google Scholar] [CrossRef]
- Klop, J.R.; Khattak, A.J. Factors influencing bicycle crash severity on two-lane, undivided roadways in North Carolina. Transp. Res. Rec. J. Transp. Res. Board 1999, 1674, 78–85. [Google Scholar] [CrossRef]
- Robartes, E.; Chen, T.D. The effect of crash characteristics on cyclist injuries: An analysis of Virginia automobile-bicycle crash data. Accid. Anal. Prev. 2017, 104, 165–173. [Google Scholar] [CrossRef]
- Behnood, A.; Mannering, F. Determinants of bicyclist injury severities in bicycle-vehicle crashes: A random parameters approach with heterogenity in means and variances. Anal. Methods Accid. Res. 2017, 16, 35–47. [Google Scholar] [CrossRef]
- Kim, J.K.; Kim, S.; Ulfarsson, G.F.; Porrello, L.A. Bicyclist injury severities in bicycle-motor vehicle accidents. Accid. Anal. Prev. 2007, 39, 238–251. [Google Scholar] [CrossRef] [PubMed]
- Wang, T.; Chen, J.; Wang, C.; Xiaofei, Y. Understand e-bicyclist safety in China: Crash severity modeling using a generalized ordered logit model. Adv. Mech. Eng. 2018, 10, 1–11. [Google Scholar] [CrossRef] [Green Version]
- Liu, S.L.; Fan, W.D. Investigating factors affecting injury severity in bicycle-vehicle ceashes: A day-of-week analysis with partial proportional odds logit models. Can. J. Civ. Eng. 2021, 48, 941–947. [Google Scholar] [CrossRef]
- Olivier, J.; Creighton, P. Bicycle injuries and helmet use: A systematic review and meta-analysis. J. Epidemiol. 2017, 46, 278–292. [Google Scholar] [CrossRef] [PubMed] [Green Version]
- Rivara, F.P.; Thompson, D.C.; Thompson, R.S. Epidemiology of bicycle injuries and risk factors for serious injury. Injury Prev. 1997, 3, 110–114. [Google Scholar] [CrossRef]
- Moore, D.N.; Schneider, W.H., 4th; Savolainen, P.T.; Farzaneh, M. Mixed logit analysis of bicyclist injury severity resulting from motor vehicle crashes at intersection and non-intersection locations. Accid. Anal. Prev. 2011, 43, 621–630. [Google Scholar] [CrossRef] [PubMed]
- Kaplan, S.; Vavatsoulas, K.; Prato, C.G. Aggravating and mitigating factors associated with cyclist injury severity in Denmark. J. Saf. Res. 2014, 50, 75–82. [Google Scholar] [CrossRef]
- Hu, F.; Lv, D.; Zhu, J.; Fang, J. Related Risk Factors for Injury Severity of E-bike and Bicycle Crashed in Hefei. Traffic Inj. Prev. 2014, 15, 319–323. [Google Scholar] [CrossRef] [PubMed]
- Eluru, N.; Bhat, C.R.; Hensher, D.A. A mixed generalized ordered response model for examining pedestrian and bicyclist injury severity level in traffic crashes. Accid. Anal. Prev. 2008, 40, 1033–1054. [Google Scholar] [CrossRef] [Green Version]
- Chen, P.; Shen, Q. Built environment effects on cyclist injury severity in automobile-involved bicycle crashes. Accid. Anal. Prev. 2016, 86, 239–246. [Google Scholar] [CrossRef] [PubMed]
- Yan, X.; Ma, M.; Huang, H.; Abdel-Aty, M.; Wu, C. Motor vehicle-bicycle crashes in Beijing: Irregular maneuvers, crash patterns, and injury severity. Accid. Anal. Prev. 2011, 43, 1751–1758. [Google Scholar] [CrossRef]
- Myhrmann, M.S.; Janstrup, K.H.; Moller, M.; Mabit, S.E. Factors influencing the injury severity of single-bicycle crashes. Accid. Anal. Prev. 2021, 149, 105875. [Google Scholar] [CrossRef]
- Bahrololoom, S.; Young, W.; Logan, D. Modelling injury severity of bicyclists in bicycle-car crashes at intersections. Accid. Anal. Prev. 2020, 144, 105597. [Google Scholar] [CrossRef]
- Wang, Z.; Huang, S.; Wang, J.; Sulaj, D.; Hao, W.; Kuang, A. Risk factors affecting crash injury severity for different groups of e-bike roders: A classification tree-based logistic regression model. J. Saf. Res. 2021, 76, 176–183. [Google Scholar] [CrossRef]
- Chen, P.; Shen, Q. Identifying high-risk built environments for severe bicycling injuries. J. Saf. Res. 2019, 68, 1–7. [Google Scholar] [CrossRef] [PubMed]
- Chen, P. Built environment factors in explaining the automobile-involved bicycle crash frequesncies: A spatial statistic approach. Saf. Sci. 2015, 79, 336–343. [Google Scholar] [CrossRef]
- Fountas, G.; Fonzone, A.; Olowosegun, A.; McTigue, C. Addressing unobserved heterogenity in the analysis of bicycle crash injuries in Scotland: A correlated random parameters ordered probit approach with heterogenity in means. Anal. Methods Accid. Res. 2021, 32, 100181. [Google Scholar] [CrossRef]
- Rahman, M.S.; Abdel-Aty, M.; Hasan, S.; Cai, Q. Applying machine learning approaches to analyze the vulnerable road-users charshes at statewide traffic analysis zones. J. Saf. Res. 2019, 70, 275–288. [Google Scholar] [CrossRef]
- Wang, C.; Kou, S.; Song, Y. Identify risk pattern of E-bike riders in China based on machine learning framework. Entropy 2019, 21, 1084. [Google Scholar] [CrossRef] [Green Version]
- Shirani-Bidabadi, N.; Mallipaddi, N.; Haleem, K.; Anderson, M. Developing bicycle-vehicle crash-specific safety performance functions in Alabama using different techniques. Accid. Anal. Prev. 2020, 146, 105735. [Google Scholar] [CrossRef]
- Seva, R.R.; Flores, G.M.T.; Gotohio, M.P.T.; Paras, N.G. Logit model of motorcycle accidents in the Philipines considering personal and environmental factors. Int. J. Traffic Transp. Eng. 2013, 3, 173–184. [Google Scholar] [CrossRef] [Green Version]
- Boufous, S.; de Rome, L.; Senserrick, T.; Ivers, R. Risk factors for severe injury in cyclists involved in traffic crashes in Victoria, Australia. Accid. Anal. Prev. 2012, 49, 404–409. [Google Scholar] [CrossRef] [PubMed]
- Li, Y.; Fan, W.D. Pedestrian Injury Severities in Pedestrian-Vehicle Crashes and the Partial Proportional Odds Logit Model: Accounting for Age Difference. Transp. Res. Rec. 2019, 2673, 1–16. [Google Scholar] [CrossRef]
- Ambo, T.B.; Ma, J.; Fu, C. Investigating influence factors of traffic violation using multinomial logit mehod. Int. J. Inj. Control. Saf. Promot. 2021, 28, 78–85. [Google Scholar] [CrossRef]
- Intini, P.; Berloco, N.; Fonzone, A.; Fountas, G.; Ranieri, V. The influence of traffic, geometric and context variables on urban crash types: A grouped random parameter multinomial logit approach. Anal. Methods Accid. Res. 2020, 28, 100141. [Google Scholar] [CrossRef]
- Celik, A.K.; Oktay, E. A multinomial logit analysis of risk factors influencing road traffic injury severities in the Erzurum and Kars Provinces of Turkey. Accid. Anal. Prev. 2014, 72, 66–77. [Google Scholar] [CrossRef] [PubMed]
- Macioszek, E. The application of HCM 2010 in the determination of capacity of traffic lanes at turbo roundabout entries. Transp. Probl. 2016, 11, 77–89. [Google Scholar] [CrossRef] [Green Version]
- Traffic Control Data. Available online: https://its.gliwice.eu/ (accessed on 3 June 2021).
- Terms Used in Official Statistics. Available online: https://translate.google.pl/?sl=pl&tl=en&text=Poj%C4%99cia%20stosowane%20w%20statystyce%20publicznej&op=translate (accessed on 3 May 2021).
- Regulation No. 31 of the Police Commander in Chief of October 26, 2015 on the Methods and Forms of Statistics of Road Incidents Conducted by the Police. Available online: https://www.infor.pl/akt-prawny/U27.2015.048.0000085,zarzadzenie-nr-31-komendanta-glownego-policji-w-sprawie-metod-i-form-prowadzenia-przez-policje-statystyki-zdarzen-drogowych.html (accessed on 30 April 2021).
- Order No. 40 of the Police Commander in Chief of December 18, 2017 Amending the Regulation on the Methods and Forms of Conducting Statistics on Road Incidents by the Police. Available online: https://isp.policja.pl/isp/aktualnosci/prawo/12251,Zarzadzenie-nr-40-Komendanta-Glownego-Policji-z-dnia-18-grudnia-2017-r.html (accessed on 30 April 2021).
- PQStat. Statistical Calculation Software. Available online: https://pqstat.pl/?mod_f=log_reg (accessed on 1 June 2021).
- Greene, W.H. Econometric Analysis, 5th ed.; Prentice Hall: Plano, TX, USA, 2002. [Google Scholar]
- Cieślak, M. (Ed.) Prognozowanie Gospodarcze: Metody i Zastosowania; Wydawnictwo Naukowe PWN: Warszawa, Poland, 2008. [Google Scholar]
- Macioszek, E.; Kurek, A. P&R parking and bike-sharing system as solutions supporting transport accessibility of the city. Transp. Probl. 2020, 15, 275–286. [Google Scholar] [CrossRef]
- Żochowska, R.; Jacyna, M.; Kłos, M.J.; Soczówka, P. A GIS-based method of the assessment of spatial integration of bike-sharing stations. Sustainability 2021, 13, 3894. [Google Scholar] [CrossRef]
- Oskarbski, J.; Birr, K.; Żarski, K. Bicycle traffic model for sustainable urban mobility planning. Energies 2021, 14, 5970. [Google Scholar] [CrossRef]
- Li, Y.; Fan, W. Modeling the severity of pedestrian injury in pedestrian-vehicle crashes in North Carolina: A partial proportional odds logit model approach. Accid. Anal. Prev. 2018, 131, 284–296. [Google Scholar] [CrossRef] [PubMed]
- Guohua, L.; Baker, S.P.; Smialek, J.E.; Soderstrom, C.A. Use of alkohol as a risk factor for bicycling injury. JAMA New. 2001, 285, 893–896. [Google Scholar] [CrossRef] [Green Version]
- Samerei, S.A.; Aghabak, K.; Shiwakoti, N.; Mohammadi, A. Using latent class clustering and binary logistic regression to model Australian cyclist injury severity in motor vehicle-bicycle crashes. J. Saf. Res. 2021, 79, 246–256. [Google Scholar] [CrossRef]
- Scheiman, S.; Moghaddas, H.S.; Bjornstig, U.; Bylund, P.O.; Saveman, B.I. Bicycle injury evens among older adults in Northen Sweden: A 10-year population based study. Accid. Anal. Prev. 2010, 42, 758–763. [Google Scholar] [CrossRef]
- Namini, N.K.; Lee, A.W.; Amend, G.M.; Vargo, J.; Breyer, B. Impact of alkohol and drug use on bicycle and electric scooter injuries and hospital admissions in the United States. Sage J. 2021, 1–9. [Google Scholar] [CrossRef]
- Smink, B.E.; Ruiter, B.; Lusthof, K.J.; De Gier, J.J.; Uges, D.R.; Egberts, A.C. Drug use and the severity of a traffic accident. Accid. Anal. Prev. 2005, 37, 427–433. [Google Scholar] [CrossRef]
- Killops, J.; Sewry, N.A.; Schwellnus, M.; Swanevelder, S.; van Rensburg, D.J.; Jordaan, E. Woman, Older Age, Faster Cycling Speed and Increased Wind Speeds Are Independent Risk Factors for Acue Injury-Related Medical Encounters During a 109 Km Mass Community-Based Paericipation Cycling Event: A 3-Yesr Study in 102251 Race Starters—Safer Xii. Available online: https://injuryprevention.bmj.com/content/27/4/338 (accessed on 4 June 2021).
- Macioszek, E.; Kurek, A. Roundabout users subjective safety—Case study from upper silesian and masovian voivodeships (Poland). Trans. Transp. Sci. 2020, 11, 39–50. [Google Scholar] [CrossRef]
- Pokorny, P.; Pitera, K. Truck-bicycle safety: An overview of methods of study, risk factors and research needs. Eur. Transp. Res. Rev. 2019, 11, 1–14. [Google Scholar] [CrossRef]
- Dablanc, L. Goods transport in large European cities: Difficult to organize, difficult to modernize. Transp. Res. Part A Policy Pract. 2007, 41, 280–285. [Google Scholar] [CrossRef]
- Jaller, M.; Holguín-Veras, J.; Hodge, S. Parking in the city: Challenges for freight traffic. Transp. Res. Rec. J. Transp. Res. Board 2013, 2379, 46–56. [Google Scholar] [CrossRef]
- Macioszek, E.; Kurek, A. Extracting road traffic volume in the city before and during COVID-19 through video remote sensing. Remote Sens. 2021, 13, 2329. [Google Scholar] [CrossRef]
- Macioszek, E. Changes in values of traffic volume—Case study based on general traffic measurements in opolskie voivodeship (Poland). Lect. Notes Netw. Syst. 2019, 51, 66–76. [Google Scholar] [CrossRef]
- Vandebulcke, G.; Thomas, I.; Panis, L.I. Predicting cycling accident risk in Brussels: A spatial case-control approach. Accid. Anal. Prev. 2014, 62, 341–357. [Google Scholar] [CrossRef]
- Allen-Munley, C.; Daniel, J. Urban bicycle route safety rating model—Application in Jersey City, New Jersey. J. Transp. Eng. 2006, 132, 499–507. [Google Scholar] [CrossRef]
- Hamann, C.; Peek-Asa, C. On-road bicycle facilities and bicycle crashes in Iowa, 2007–1010. Accid. Anal. Prev. 2013, 56, 103–109. [Google Scholar] [CrossRef]
- Raihan, A.; Alluri, P.; Wu, W.; Gan, A. Estimation of bicycle crash modification factors (CMFs) on urban facilities using zero inflated negative binomial models. Accid. Anal. Prev. 2019, 123, 303–313. [Google Scholar] [CrossRef]
- Zahabi, S.A.H.; Strauss, J.; Manaugh, K.; Miranda-Moreno, L.F. Estimating potential effect of speed limits, built environment, and other factors on severity of pedestrian and cyclist injuries in crashes. Transp. Res. Rec. 2011, 2247, 81–90. [Google Scholar] [CrossRef]
- Asgarzadeh, M.; Fisher, D.; Verma, S.K.; Courtney, T.K.; Christiani, D.C. The Impact of Weather, Road Surface, Time-of-Day, and Light Conditions on Severity of Bicycle-Motor Vehicle Crash Injuries. Am. J. Ind. Med. Inc. Environ. Occup. Health 2018, 1–10. [Google Scholar] [CrossRef] [PubMed]
- Bahrololoom, S.; Moridpour, S.; Tay, R. Factors Affecting Bicycle Fatal and Serious Injury Crashes in Victoria, Australia. Available online: https://www.australasiantransportresearchforum.org.au/sites/default/files/ATRF2016_Full_papers_resubmission_202.pdf (accessed on 4 June 2021).
- Bil, M.; Bilova, M.; Muller, I. Critical factors in fatal collisions of adult cyclists with automobiles. Accid. Anal. Prev. 2010, 42, 1632–1636. [Google Scholar] [CrossRef] [PubMed]
Figure 1.
Annual variability of the number of road incidents involving bicyclists and variability of bicyclist casualties in Poland in 2010–2021 (data for 2021 are data from January to July 2021) Source: Own work based on data presented in [3,4,5].

Figure 2.
Relative indicator of the occurrence of an injured victim in a road accident for individual road users. Source: Own work based on data presented in SRAC database [3].
Figure 2.
Relative indicator of the occurrence of an injured victim in a road accident for individual road users. Source: Own work based on data presented in SRAC database [3].
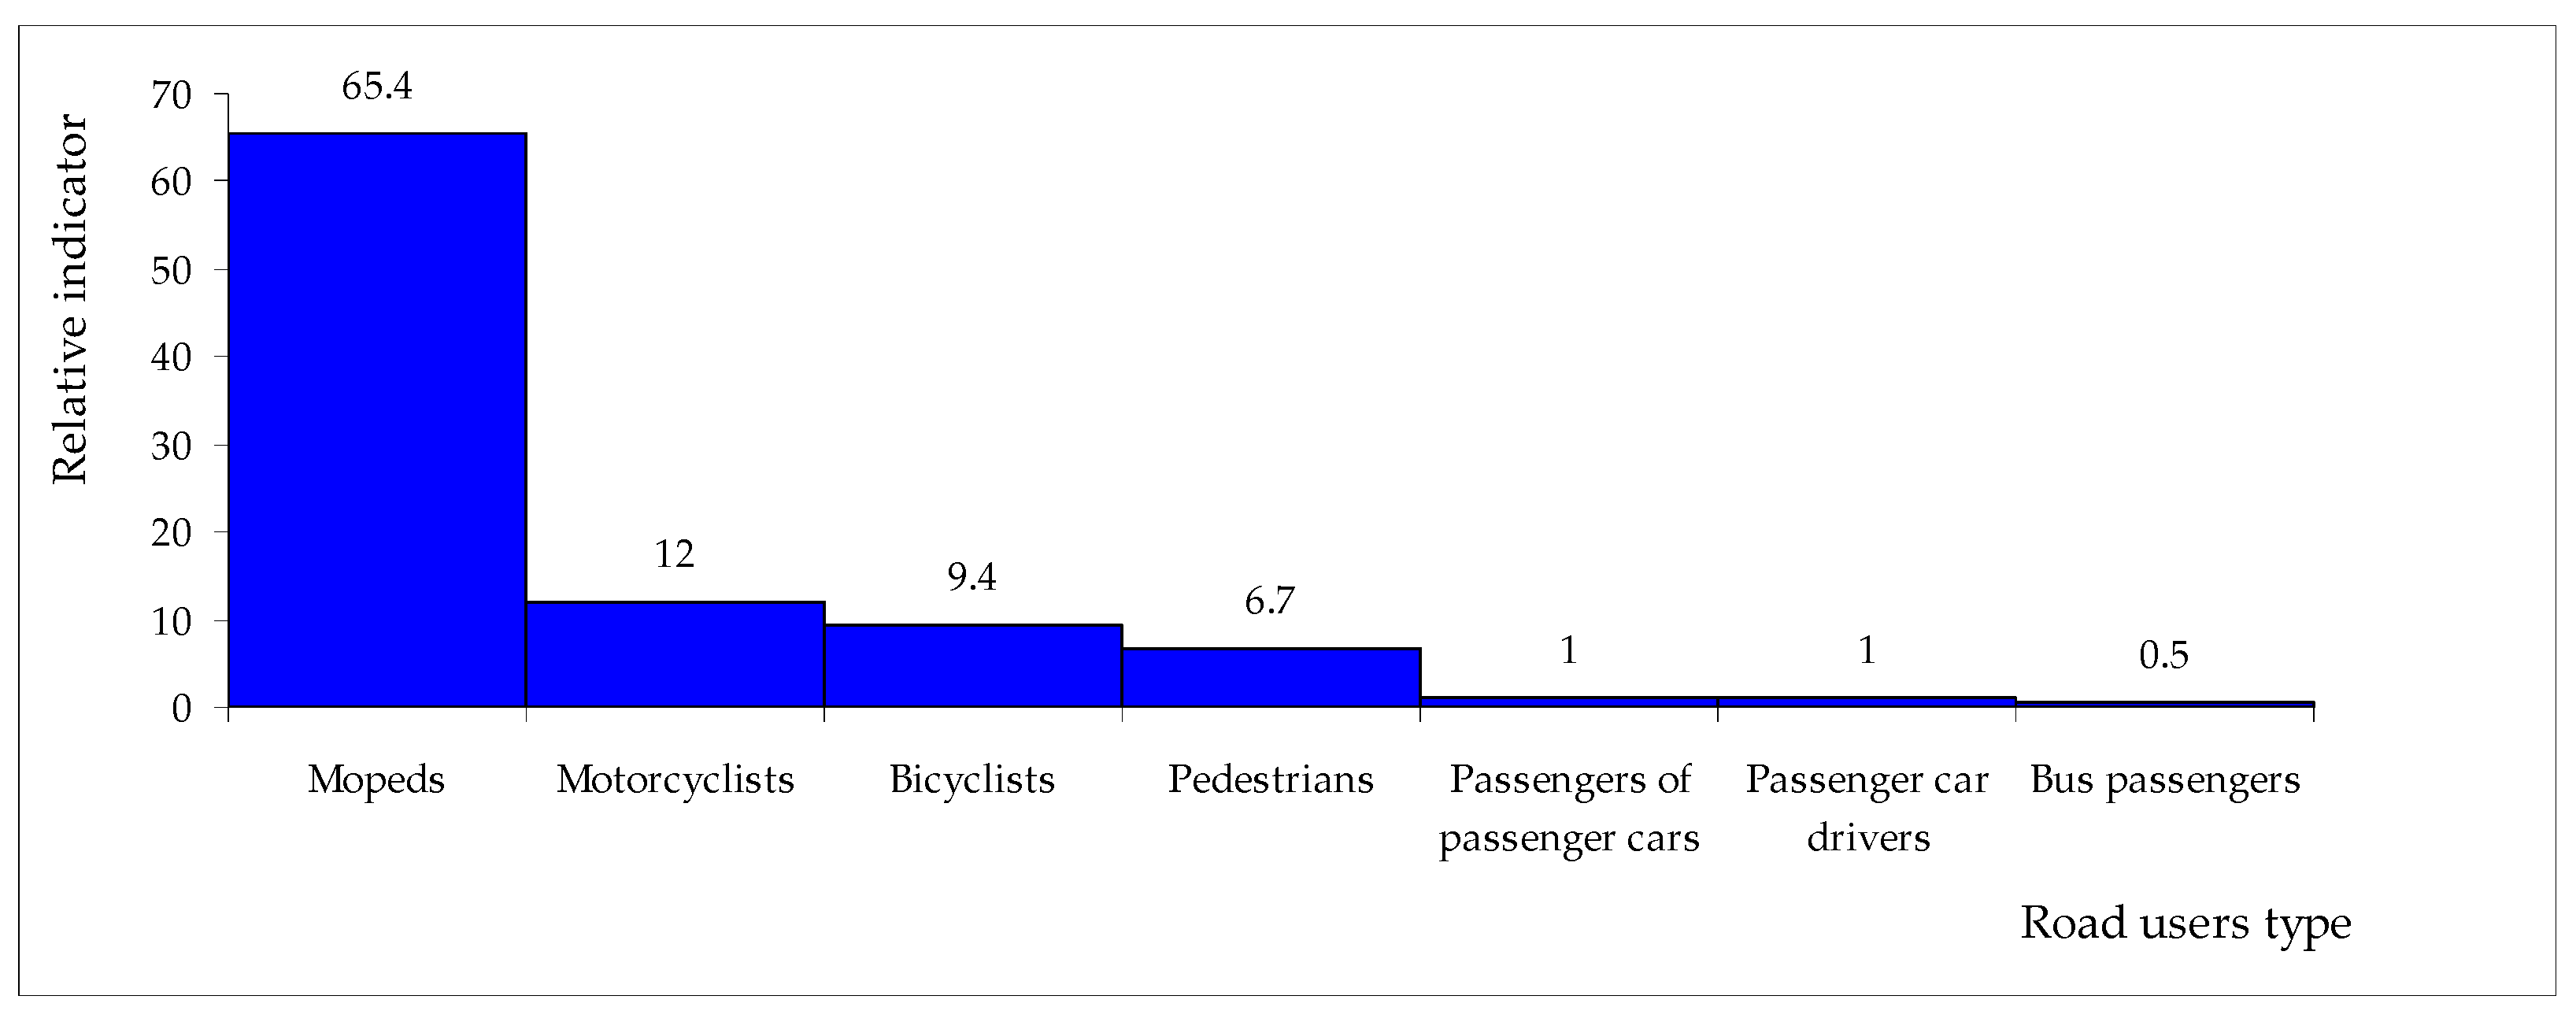
Figure 3.
Share of road incidents involving bicyclists in particular lighting conditions. Source: Own work based on data presented in SRAC database [3].
Figure 3.
Share of road incidents involving bicyclists in particular lighting conditions. Source: Own work based on data presented in SRAC database [3].

Figure 4.
Distribution of the number of road incidents involving bicyclists in individual (a) months of the year, (b) days of the week. Own research based on the data presented in [3].
Figure 4.
Distribution of the number of road incidents involving bicyclists in individual (a) months of the year, (b) days of the week. Own research based on the data presented in [3].

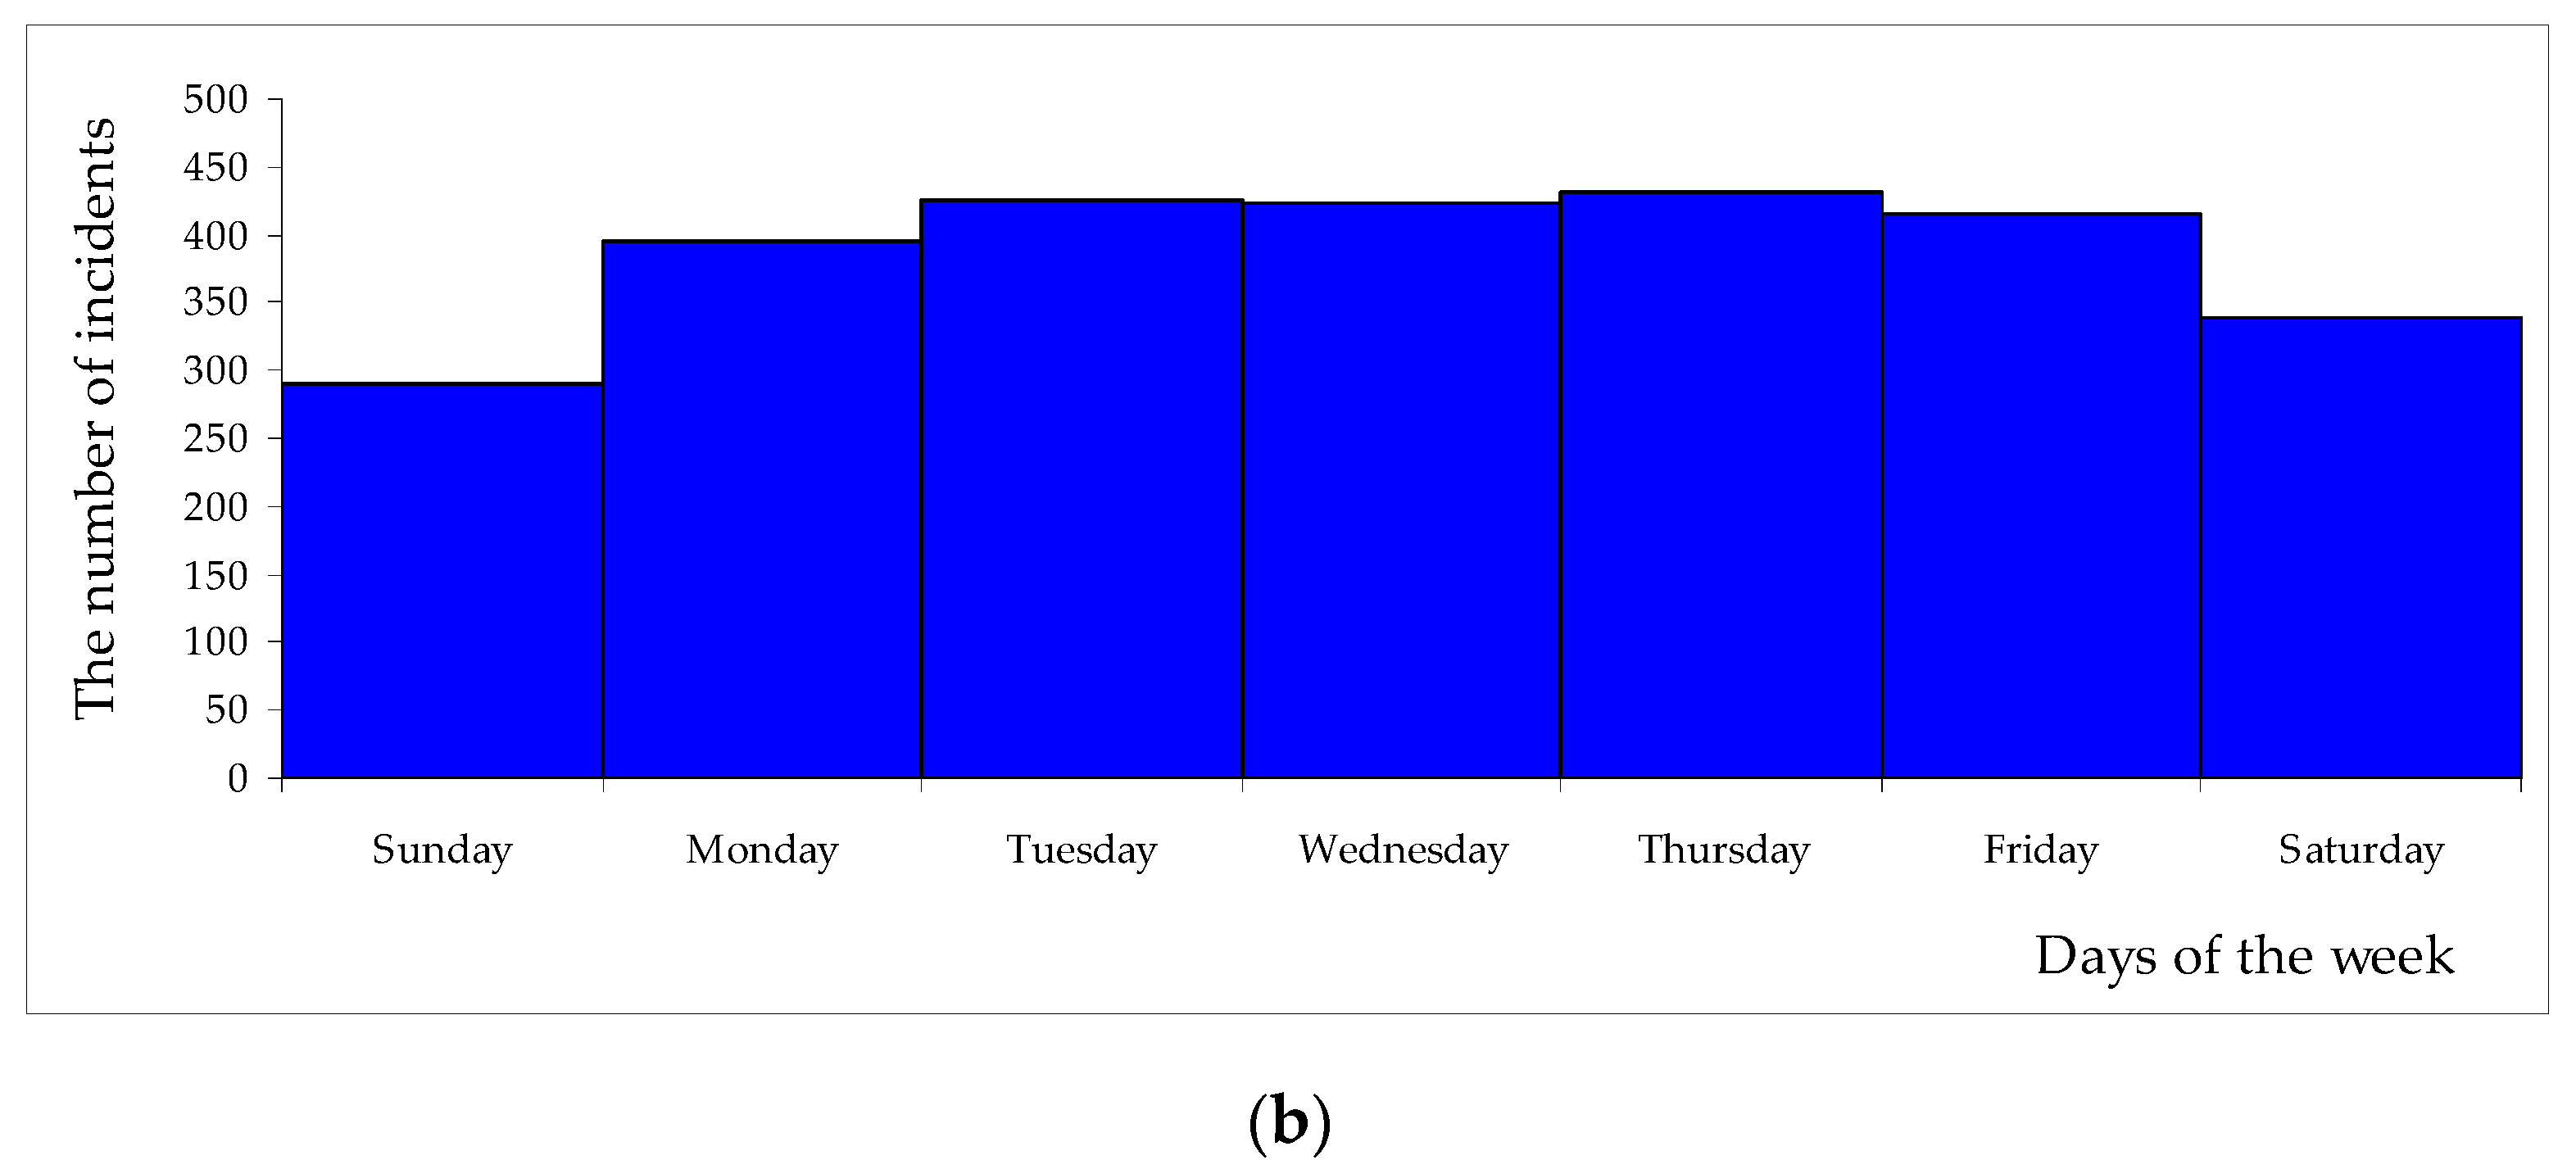
Figure 5.
Distribution of the number of road incidents involving bicyclists (a) in particular hours of the day, (b) in various weather conditions. Source: Own work based on data presented in SRAC database [3].
Figure 5.
Distribution of the number of road incidents involving bicyclists (a) in particular hours of the day, (b) in various weather conditions. Source: Own work based on data presented in SRAC database [3].
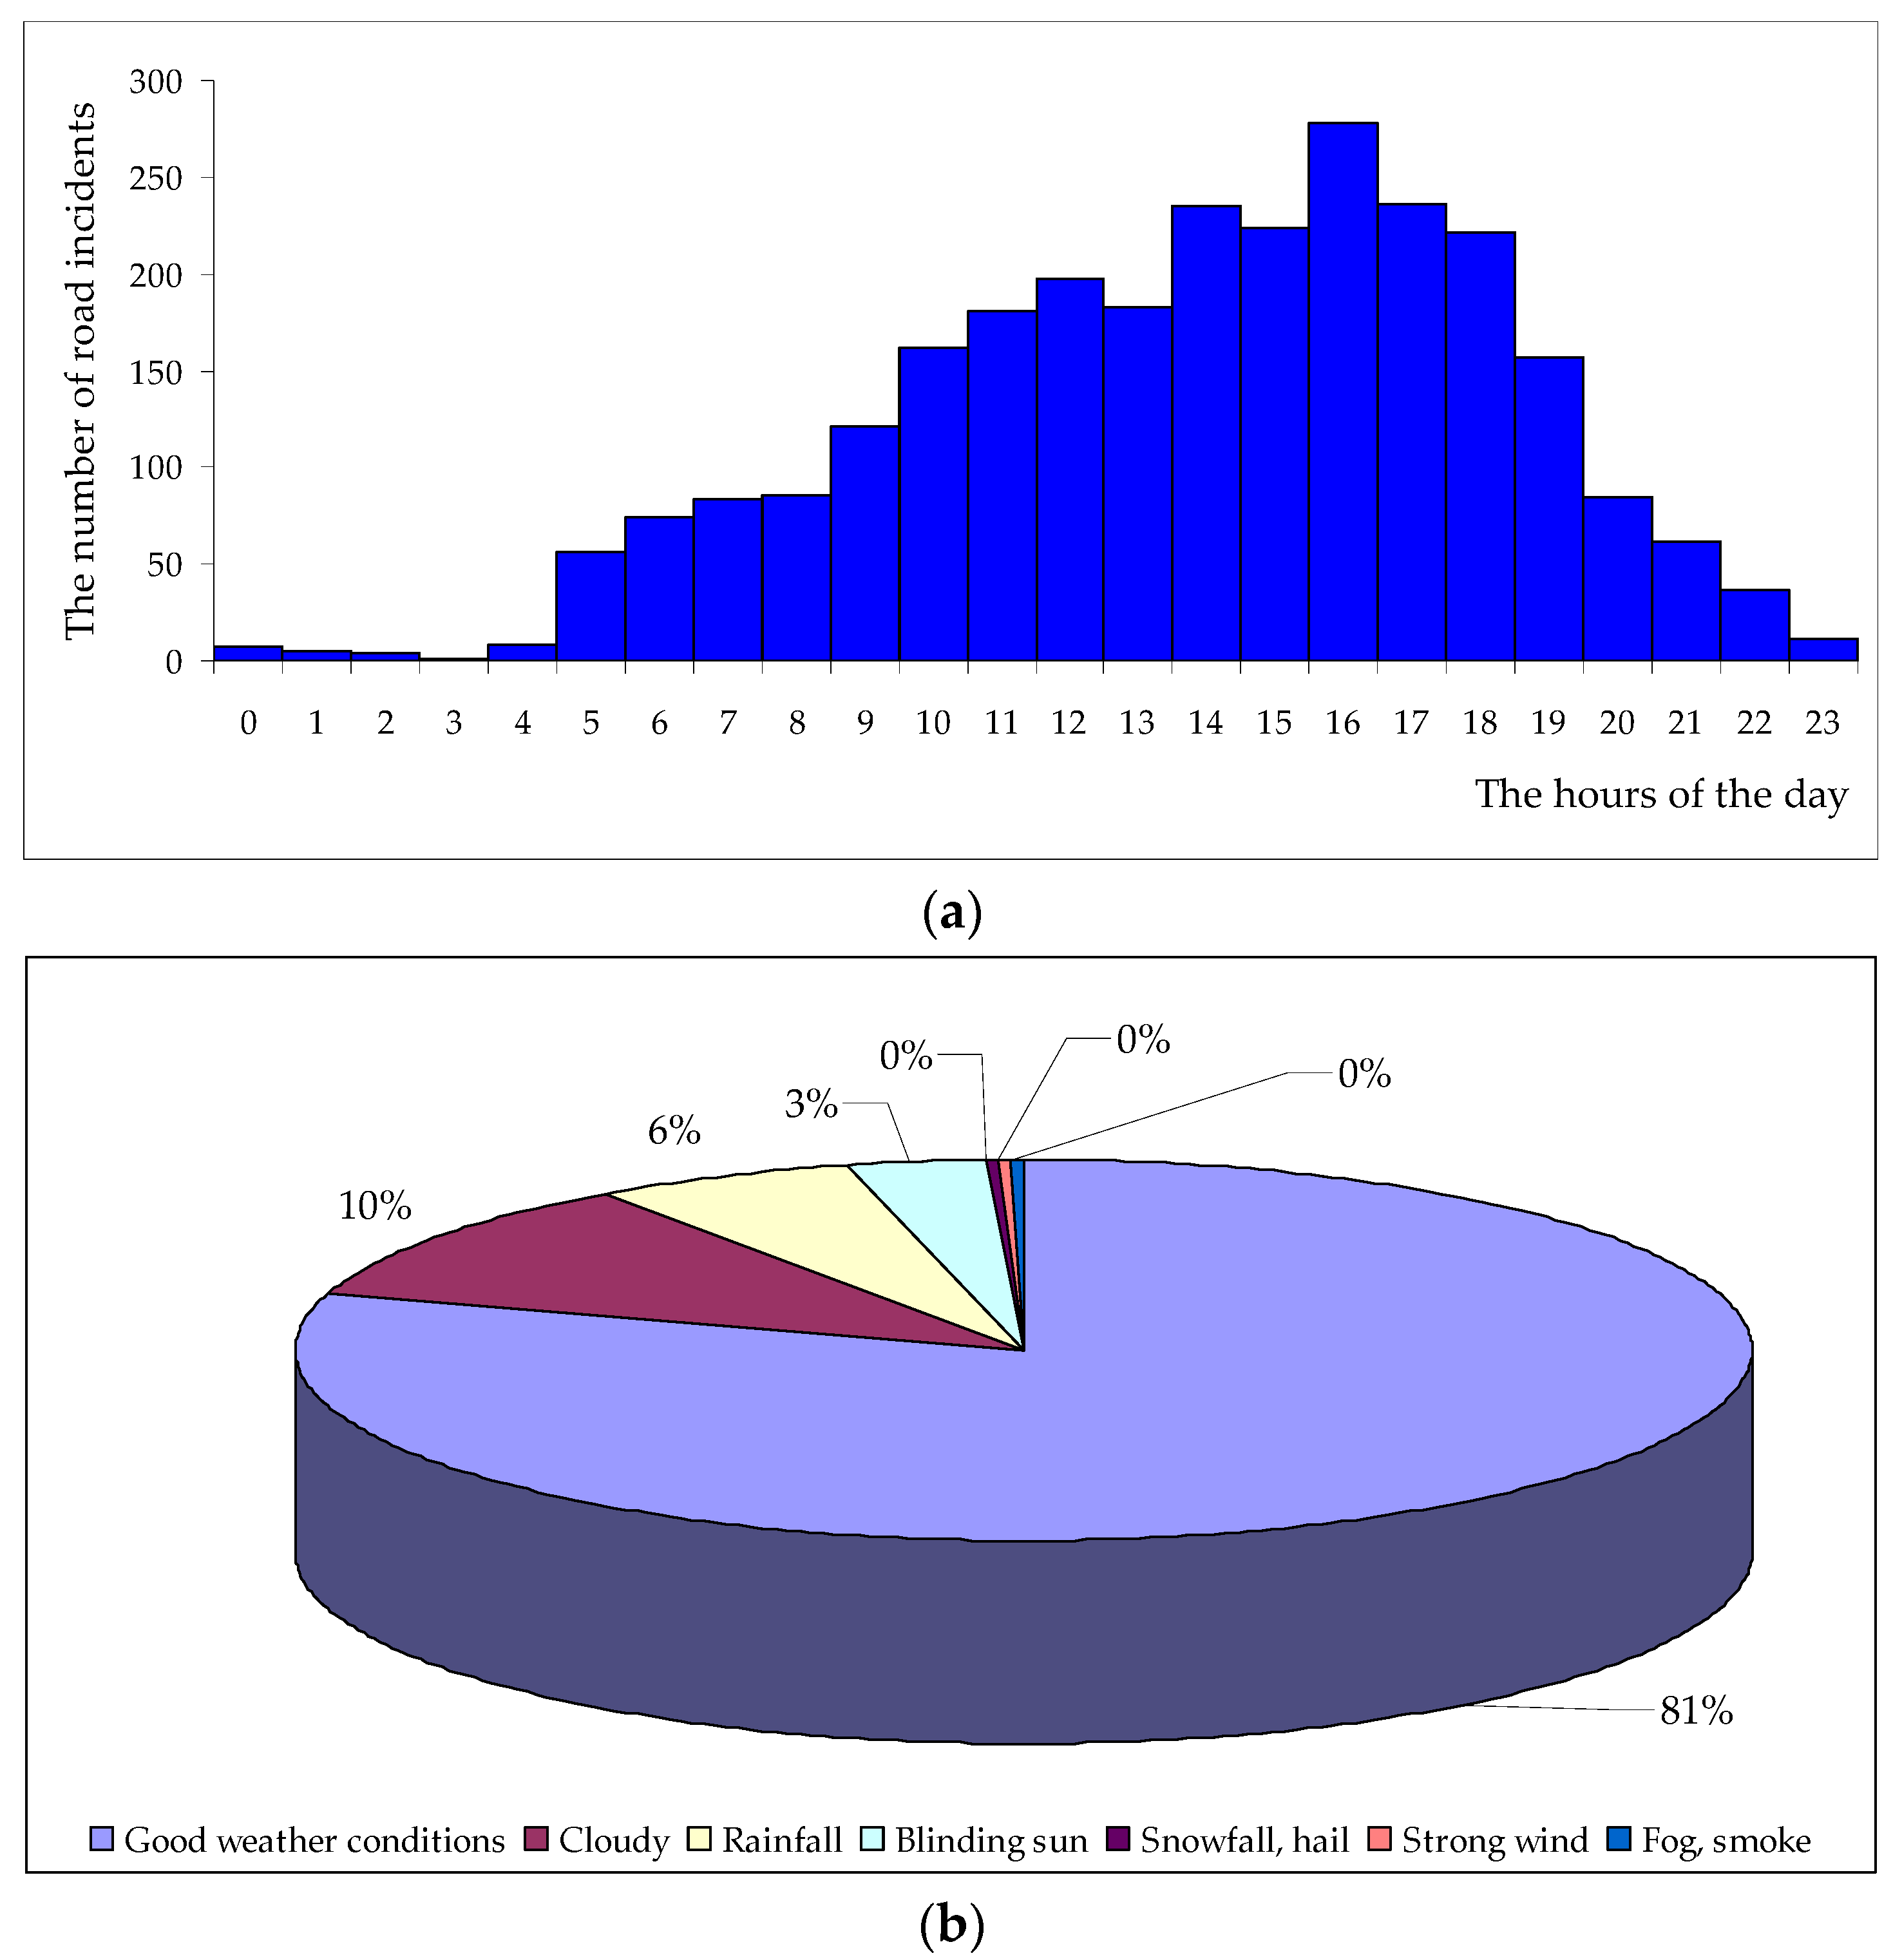
Figure 6.
The number of individual types of road incidents involving bicyclists. Source: Own work based on data presented in SRAC database [3].
Figure 6.
The number of individual types of road incidents involving bicyclists. Source: Own work based on data presented in SRAC database [3].
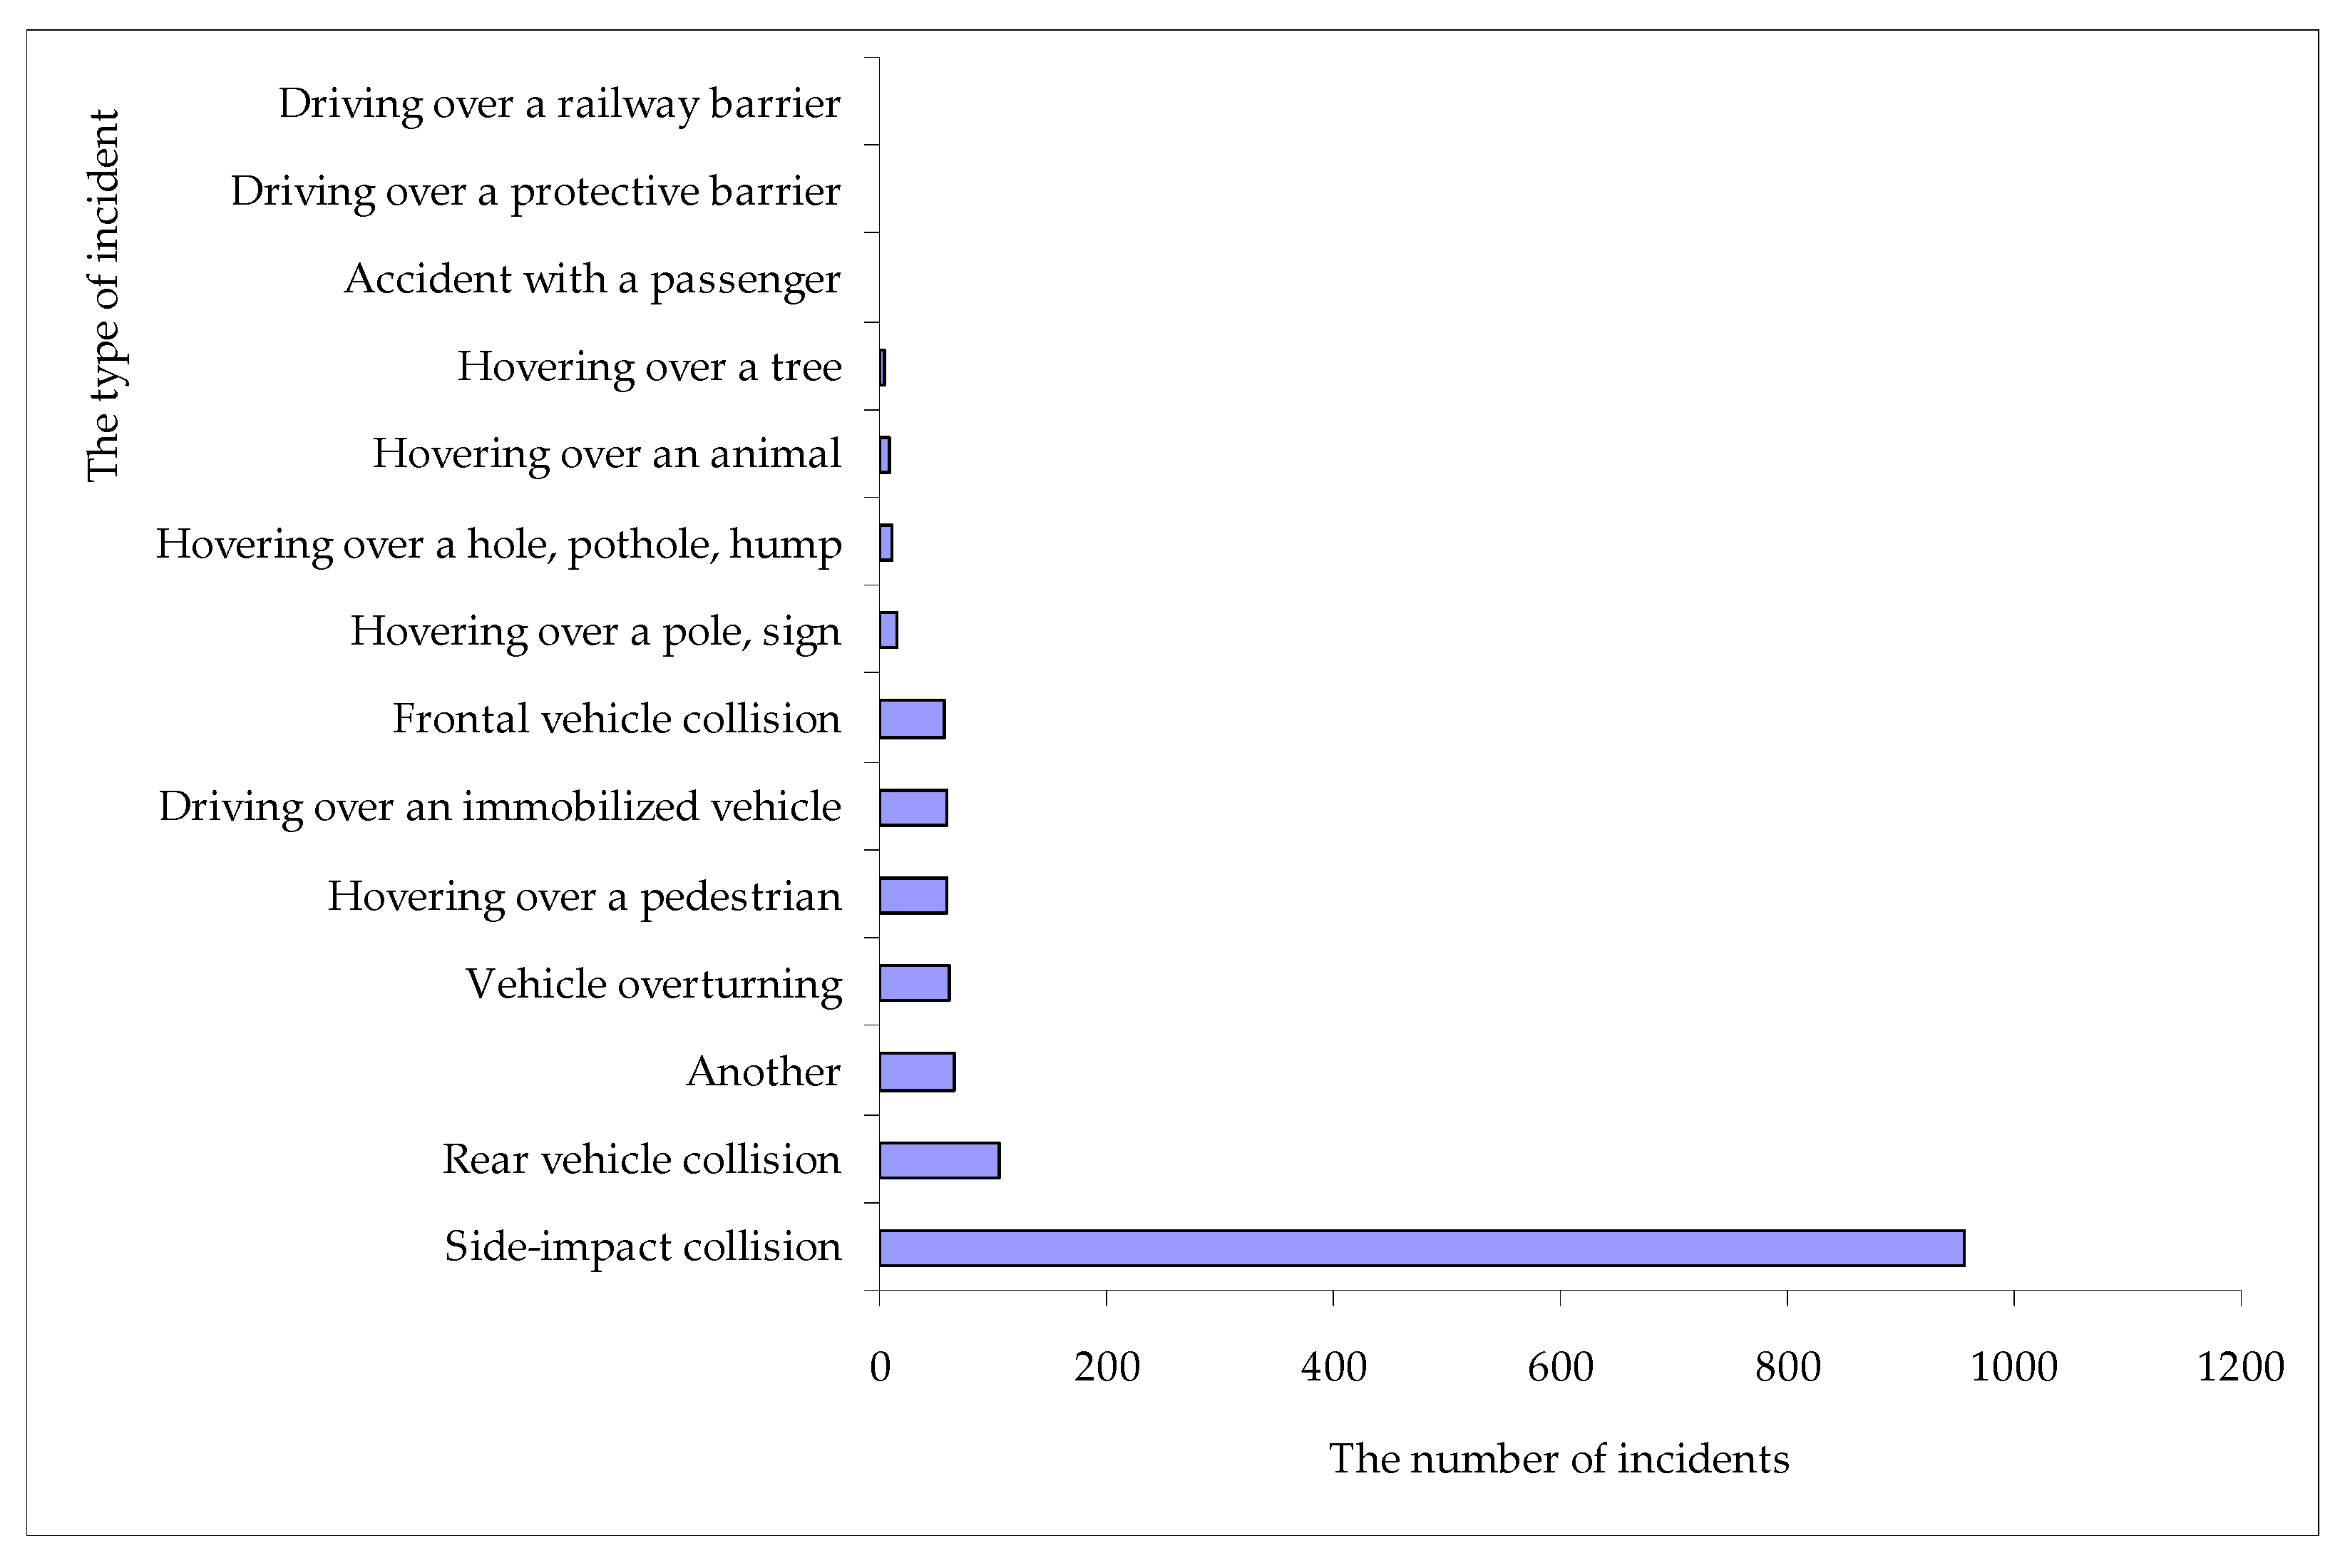
Figure 7.
Characteristics of the incidents with bicyclists (a) incident place, (b) road geometry. Source: Own work based on data presented in SRAC database [3].
Figure 7.
Characteristics of the incidents with bicyclists (a) incident place, (b) road geometry. Source: Own work based on data presented in SRAC database [3].


Table 1.
The summary of the characteristics studied by individual authors that showed an impact on the severity of bicyclist injuries in bicyclist-vehicle crashes.
Table 1.
The summary of the characteristics studied by individual authors that showed an impact on the severity of bicyclist injuries in bicyclist-vehicle crashes.
| The Author (-s) | Bicyclist Characteristics | Vehicle Driver Characteristics | Vehicle Characteristics | Environmental Characteristics | Roadway Characteristics | Time of the Year | Crash Characteristics |
|---|---|---|---|---|---|---|---|
| E. Robartes and T.D. Chen [7] |
|
|
|
|
| - | - |
| D. N. Moore et al. [14] |
|
|
| - |
|
|
|
| S. Kaplan et al. [15] |
|
|
|
|
| - |
|
| F. Hu et al. [16] |
|
|
| - | - | - | - |
| N. Eluru et al. [17] |
|
|
| - |
| - |
|
| P. Chen and Q. Shen [18] |
|
|
|
|
| - | - |
| X. Yan et al. [19] |
| - |
|
|
| - |
|
| M.S. Myhrmann et al. [20] |
| - | - |
|
|
| - |
| S. Bahrololoom et al. [21] |
| - | - | - |
| - |
|
| Z. Wang et al. [22] |
|
|
|
|
|
| - |
| P. Chen and Q. Shen [23] |
|
|
|
|
| - |
|
| P. Chen [24] |
| - | - |
|
| - | - |
| G. Fountas and al. [25] |
|
| - |
|
| - | - |
Table 2.
Characteristics and binary definition of explanatory variables.
| Explanatory Variable Designation | Explanatory Variable Name | Explanatory Variable Description |
|---|---|---|
| Driver characteristics | ||
| X1 | Gender | =1 if the driver is a female, =0 otherwise |
| X2 | Age | =1 if the driver is a young (up to 60 years old), =0 otherwise (i.e., older than 60 years old) |
| X3 | Alcohol usage | =1 if the driver is an intoxicated, =0 otherwise |
| X4 | Experience (i.e., the number of years possesing the driver licence) | =1 if the driver caused crashes has an experience between (0–5) years, =0 otherwise |
| X5 | Possession of driving license | =1 if the driver has a driver license, =0 otherwise |
| X6 | Exceeding the speed limit | =1 If the driver exceeded posted speed limit, =0 otherwise |
| Bicyclist characteristics | ||
| X7 | Gender | =1 if the bicyclist is a male, =0 otherwise |
| X8 | Age | =1 if the bicyclist is older than 60 years old, =0 otherwise (i.e., up to 60 years old) |
| X9 | Alcohol usage | =1 if the bicyclist is a intoxicated, =0 otherwise |
| X10 | Speed before incident | =1 If the bicyclist exceeded speed = 30 km/h, =0 otherwise |
| Vehicle characteristics | ||
| X11 | Vehicle type | =1 if the vehicle is truck, =0 otherwise |
| Road characteristics | ||
| X12 | Speed limit | =1 if the vehicle is passenger car, =0 otherwise |
| X13 | Intersection | =1 if the accident happened in intersection area, =0 otherwise |
| X14 | Incident place | =1 if the accident happened on the road, =0 otherwise |
| X15 | Type of surface | =1 if the pavement is hard, =0 otherwise |
| X16 | Road geometry | =1 if the accident occurred on a straight section, =0 otherwise |
| X17 | Road type | =1 if the road is a one-way, =0 otherwise |
| Envinronmental characteristic | ||
| X18 | The type of the area | =1 if crash occurred on urban area, =0 otherwise |
| X19 | Time of the day | =1 if crash occurred during nighttime (i.e., from 22:00 p.m. to 6:00 a.m.), =0 otherwise |
| X20 | Weather conditions | =1 If crash occurred during the good weather condition, =0 otherwise |
| Accident characteristics | ||
| X21 | Incident type | =1 if crash was a head-on collision, =0 otherwise |
Table 3.
Structural parameters estimated for the model Y1, the level of statistical significance of the predictors, and their odds ratios.
Table 3.
Structural parameters estimated for the model Y1, the level of statistical significance of the predictors, and their odds ratios.
| Explanatory Variable Xk | αk | Wald Statistics | Significance Level p-Value | Exp(αi) |
|---|---|---|---|---|
| X1 | −0.231 | 5.880 | 0.108 | 0.794 |
| X2 | 0.387 | 6.868 | 0.112 | 1.473 |
| X3 | 0.251 | 6.490 | 0.104 | 1.285 |
| X6 | 0.651 | 6.027 | 0.107 | 1.917 |
| X8 | 0.125 | 18.971 | 0.125 | 1.133 |
| X9 | 0.101 | 42.224 | 0.000 * | 1.106 |
| X10 | 0.607 | 38.513 | 0.000 * | 1.835 |
| X11 | 0.541 | 4.823 | 0.097 | 1.718 |
| X14 | 0.439 | 7.374 | 0.114 | 1.551 |
| X19 | 0.461 | 3.952 | 0.076 | 1.586 |
| X21 | 0.502 | 32.155 | 0.100 | 1.652 |
| α0 | 7.340612 | |||
| H.R. (Hit Ratio) | ||||
| Log Likelihood | −63.281726 | |||
| -2 Log Likelihood | 126.563452 | |||
| Log Likelihood (for α0) | 85.89028 | |||
| 2 Log Likelihood (for α0) | 171,78056 | |||
| Chi-square statistics | 49.972028 | |||
| p-value | <0.00001 | |||
| Pseudo R2 | 0.287162 | |||
| R2 Nagelkerke | 0.412436 | |||
| R2 Coxa–Snella | 0.311029 | |||
| Hosmer–Lemeshow test results: | ||||
| Chi-square statistics | 12.801928 | |||
| p-value | 0.1927 |
* p < 0.001.
Publisher’s Note: MDPI stays neutral with regard to jurisdictional claims in published maps and institutional affiliations. |
© 2021 by the authors. Licensee MDPI, Basel, Switzerland. This article is an open access article distributed under the terms and conditions of the Creative Commons Attribution (CC BY) license (https://creativecommons.org/licenses/by/4.0/).
Share and Cite
MDPI and ACS Style
Macioszek, E.; Granà, A. The Analysis of the Factors Influencing the Severity of Bicyclist Injury in Bicyclist-Vehicle Crashes. Sustainability 2022, 14, 215. https://doi.org/10.3390/su14010215
AMA Style
Macioszek E, Granà A. The Analysis of the Factors Influencing the Severity of Bicyclist Injury in Bicyclist-Vehicle Crashes. Sustainability. 2022; 14(1):215. https://doi.org/10.3390/su14010215
Chicago/Turabian StyleMacioszek, Elżbieta, and Anna Granà. 2022. "The Analysis of the Factors Influencing the Severity of Bicyclist Injury in Bicyclist-Vehicle Crashes" Sustainability 14, no. 1: 215. https://doi.org/10.3390/su14010215
Note that from the first issue of 2016, this journal uses article numbers instead of page numbers. See further details here.