
The Economic and Environmental Impact of Greenhouse Heating Pipe Insulation


1
Department of Agricultural Structures and Irrigation, Ondokuz Mayıs University, 55139 Samsun, Turkey
2
Department of Agricultural and Biological Engineering, Purdue University, West Lafayette, IN 47907, USA
*
Author to whom correspondence should be addressed.
Sustainability 2022, 14(1), 549; https://doi.org/10.3390/su14010549
Submission received: 7 December 2021
/
Revised: 24 December 2021
/
Accepted: 30 December 2021
/
Published: 5 January 2022
(This article belongs to the Special Issue Bioprocess Advances for Renewable Energy and Environmental Sustainability)
Abstract
:This study aimed to determine the effect of optimum pipe insulation thickness on energy savings and air pollution under greenhouse conditions. In this regard, an optimization model based on a Life Cycle Cost (LCC) analysis was carried out using the P1–P2 method. Three fuel types, coal, natural gas, and fuel oil, were tested with nominal pipe sizes ranging from 25 to 65 mm, and hot water was used in the system. Our findings showed that the highest insulation thickness (0.807 m), the greatest energy savings ($62.351/m), and the lowest payback period (0.502 years) were achieved with a 65 mm pipe size for fuel oil. Overall, the insulation minimizes heat loss through the heating pipelines, resulting in economic and environmental benefits. Fuel oil was determined as the best option for savings in this study. Hence, for fuel oil utilization, the emissions of CO2 varied from 2.762 to 3.798 kg/m and SO2 from 0.014 to 0.020 kg/m for pipe thicknesses ranging from 25 and 65 mm, respectively.
1. Introduction
Energy conservation is critical for the economies of all countries, particularly Turkey, which is heavily reliant on imported energy. Increasing demand for energy from Turkey’s growing economy and population has led to an increase in the country’s dependence on imports [1]. Natural gas imports account for most of Turkey’s natural gas consumption, whereas domestic oil production accounts for only 7% of total demand. Although domestic coal production has increased significantly, Turkey still imports nearly 58% of its coal [2]. The growing scarcity of energy sources has compelled this country to figure out ways to regulate its energy consumption and effective energy use. The most effective method of reducing energy consumption is insulation application, particularly in buildings and mechanical systems [3,4,5,6]. Therefore, insulating pipes/ducts in buildings and mechanical systems reduces heat loss and promotes economic growth.
Installing insulation in mechanical systems is crucial and should not be neglected since insulation reduces energy costs during the heating or cooling processes. Hence, any pipelines, tanks, valves, or other mechanical equipment that has cold or hot fluids passing through must be insulated to appropriate thicknesses with materials having suitable properties. Thermal insulation saves energy by reducing fuel consumption and prolongs equipment life by reducing condensation and protecting them from corrosion and mold [7,8].
As documented in numerous studies, insulation materials for heating pipe systems affect energy efficiency and energy savings worldwide. Bahadori and Vuthaluru [9] examined the economics of thermal insulation thickness for process piping and equipment. Keçebaş et al. [10] investigated the effect of thermal insulation on energy conservation for the municipal water pipe systems of Afyonkarahisar, Turkey. They stated that geothermal energy is better than natural gas in terms of the economic and environmental benefits. Similarly, Başoğul and Keçebaş [11] performed environmental evaluations of the thermal insulation in district heating pipelines. Their findings revealed that thermally insulating a district heating pipeline reduces the amount of CO2 emitted into the atmosphere by 21%. Kayfeci [12] estimated the optimum insulation thickness for various heating pipe diameters with different insulation materials and found that fiberglass saved the most energy for small-diameter pipes. Ertürk [13] determined the optimum insulation thicknesses of pipes for different insulation materials, fuel types, and climate zones in Turkey. Daşdemir et al. [14] optimized the thickness of the insulation layer in different material pipes (steel, copper, and plastic) and stated that copper pipes were the most energy-efficient. Ucar [15] used a thermo-economic approach to determine the optimum thickness of thermal insulation for piping systems. Although many studies have addressed the optimum thickness of insulation material for pipes in residential buildings, there is no printed information on how to calculate the thickness of insulation material needed in greenhouses. Planning the climatic conditions for greenhouses differs significantly from planning other types of buildings. Since greenhouses’ primary objectives are to provide optimum climatic conditions for crop growth and protect crops from external pests, these buildings should be designed to provide appropriate environmental conditions. In greenhouses, plants have adapted to an average temperature range of 17–27 °C. Optimal temperatures vary between 15–20 °C at night and 22–28 °C during the day [16].
High humidity is a leading problem in unheated greenhouses because of the low temperature [17]. In greenhouses, a common occurrence is using harmful chemicals to fight diseases due to high humidity. Overuse of pesticides in unheated greenhouses adversely affects consumer health and the environment. While low temperatures and high humidity result in deficiencies in the crops’ physical, chemical, and aromatic quality, they also necessitate intensive agricultural pesticides and hormones [18]. Therefore, heating greenhouses is critical for resolving the problems arising from high humidity [19].
In some countries, the heating costs of greenhouses are very high and cover almost 65–85% of total production costs [20]. As a result, heating is one of the significant factors determining the profitability of greenhouse cultivation [21]. In greenhouses, heating is required to achieve qualitative and quantitative efficiency if the daily average outdoor temperature falls below 12 °C [22]. Hot water piping systems are widely used for heating greenhouses [23,24,25], but there is not much information in the literature on the environmental impact of pipe insulation.
The current study is a pioneering work involving a life cycle assessment of the insulation thickness of steel pipes in greenhouses and its effect on air pollution. Therefore, this research aims to find the optimum thickness of insulation for various greenhouse pipe dimensions using climatic data from Konya, Turkey. The calculations were made for Rockwool insulation material, and three different fuel sources were used: coal, natural gas, and fuel oil. The energy savings, payback periods, and emissions of the harmful gases (CO2 and SO2) associated with insulation use were assessed.
2. Materials and Methods
Heat-generating and heat-transfer elements are critical components of district heating systems. The pipe, which allows energy to be transported, is an essential component of such a system; however, pipes contribute significantly to heat loss. Temperature variation in pipelines is greatly influenced by insulation and the surrounding environment. Thus, determining heat loss and temperature change in pipes is critical for determining the insulation material’s environmental impact. Figure 1 is a schematic illustration of an insulated pipe. The following assumptions are made in the life cycle cost (LCC) analysis of the heating system:
- The analysis is conducted under steady-state and ideal conditions.
- The pipe has a uniform cross section per unit length.
- The covering is made up of a thin material with a very high thermal conductivity value. Therefore, it is ignored.
- The temperatures of the surrounding environment and hot water are constant (12–80 °C).
- Pressure and temperature drops along the pipe are neglected.
- The insulation material is resistant to steam diffusion at a high coefficient of resistance.
2.1. Heat Losses and the Economics of Heating Pipeline Insulation
The annual heat amounts were calculated for heating pipes using heating degree-days (HDD), i.e., 2226 °C-days (Table 1). The pipe material properties that are generally preferred in the greenhouse are presented in Table 2. Fuel costs, lower heating values, and heating system efficiencies were utilized for calculations (Table 3).
The loss of heat from the pipe (Qp) can be obtained with Equation (1):
where U is the overall heat transfer coefficient, A is the total surface area of the pipe, Tf is the average design temperature of the inside fluid, and To is the temperature of the outside air. The total thermal resistance of the uninsulated heating piping system (Rp-unins) is given by Equation (2):
and the total thermal resistance of insulated pipe (Rp-ins) is given by Equation (3):
where r0 and r1 are the inner and outer radius of the pipe, respectively. r2 is the outer radius of the insulation envelope, kp and kins are the heat transfer coefficients of the pipes and insulation materials, respectively. L is the length of the pipe. Additionally, the convection heat transfer coefficients, hi and ho, for the inside and outside surfaces of a piping system are determined as shown in Equations (4) and (5) [28]:
where Re is the Reynolds number, Pr is the Prandtl number, kfl is the fluid heat transfer coefficient in the pipe, Tms is the average temperature of the piping system’s exterior surface, Vair is the pipe’s external air velocity, and the annual heat loss (QA) is calculated using Equation (6):
The annual energy requirement (EA) for heating and the annual fuel consumption (mf) for the piping system is determined via Equations (7) and (8), respectively:
where ns is the heating system’s efficiency and Hu is the annual energy requirement by the lower heating value of the fuel (Table 3).
The annual total energy cost for heating (Cf) is provided by Equation (9):
where Cfuel is the unit cost of fuel as in Table 3.
The total cost of insulation (CI) is determined using Equation (10):
where Cins is the cost of insulation material per unit volume, as given in Table 1, and the volume of the insulation material (V) is calculated using Equation (11):
The LCC analysis is carried out using the P1–P2 method following the cost calculations for fuel, insulation, and energy. The life cycle energy ratio (P1) and life cycle expenditure ratio (P2) can be defined using Equations (12) and (13) [29]:
and
where d is the inflation rate, i is the discount rate or interest rate, N is the lifetime, Ms is the annual operating and maintenance cost ratio to the initial purchase cost, and Rv is the resale value to initial cost ratio. P2 can be taken as one of the maintenance costs, and the operation costs are zero. The total cost of using the insulated piping system for heating (Ct) is computed using Equation (14):
The net energy cost savings associated with the use of insulation material for a heating system’s lifetime (S) is calculated using Equation (15):
The insulated piping system’s outer radius is computed by either minimizing Equation (14) or maximizing Equation (15). This is accomplished by computing the differential of S or Ct for r2 and then setting it to zero. After that, the MATLAB Optimization Toolbox is used to determine the optimum insulation thickness. The payback period can be calculated by inserting P1 into Equation (15) and setting it to zero [10].
2.2. Calculation of the Total Gas Emissions
Insulation not only reduces heat losses, but also the emission values that affect environmental factors. The following is the general chemical formula for fuel combustion [11]:
The rate of combustion product emission per kg of fuel burned is computed using Equations (17) and (18):
where M is the molecular weight of the fuel, determined using Equation (19):
3. Results
This study evaluated the economic and environmental effects of insulating heating pipelines for greenhouse conditions in Konya, Turkey. Calculations were performed using Rockwool insulation material and three different fuel types (coal, natural gas, or fuel oil). Based on the calculations, the optimum insulation thickness, energy savings, payback periods, and emissions of CO2 and SO2 were determined. The findings of the analysis are summarized in Table 4. Briefly, the optimum insulation thickness ranged from 0.033 to 0.087 m, the energy savings varied between 10.352 and 62.351 $/m, the payback periods were between 0.502 and 0.955 years, the CO2 emissions varied between 2.564 and 7.618 kg/m, and the SO2 emissions changed between 0.000 and 0.020 kg/m depending on the pipe sizes and fuel types.
3.1. Energy Savings and Total Costs for Various Energy Sources and Pipe Sizes
The effect of insulation thickness on the total cost in 65-mm pipe is illustrated in Figure 2. The total cost initially declined and then gradually rose in response to increases in the insulation material cost. The insulation thickness that resulted in the lowest total cost was considered the optimum insulation thickness. The optimum insulation thickness for the 65-mm pipe size was 0.061 m for coal, 0.060 for natural gas and 0.087 m for fuel oil. As reported by Kaynaklı [30], in contrast to flat surfaces, such as the external walls of a building, the increase in insulation cost is nonlinear because of the cylindrical geometries of the pipes.
A comparison of energy savings with insulation thickness for different energy sources with a pipe size of 65 mm is demonstrated in Figure 3. The energy saving in Konya was 62.351 $/m for fuel oil, 24.057 $/m for natural gas, and 25.532 $/m for coal. Additionally, Figure 4 compares the energy savings achieved with coal, natural gas, and fuel oil for all nominal pipe diameters. The optimum insulation thickness was achieved when the savings declined as the insulating material thickness increased. At optimum insulating thickness, energy savings were maximized. Additionally, energy savings varied according to the dimension of the pipes. For example, for coal fuel, the energy savings for the 25- and 65-mm nominal pipe sizes were 10.996 and 25.532 $/m, whereas these values were 27.175 and 62.351 $/m for fuel oil, respectively.
3.2. Effect of Pipe Dimensions in LCA Analysis of Various Energy Sources
The optimum insulation thicknesses, energy savings, payback periods, emissions of CO2 and SO2 for various fuel types, and pipe sizes are shown in Figure 5. As illustrated in Figure 5a, insulation thicknesses were greater for larger pipe dimensions. The highest optimum insulation thickness (0.087 m) was achieved with a 65-mm pipe size and fuel oil. The highest energy savings for all pipe sizes was achieved when fuel oil was used as the energy source, while the lowest energy savings were found when natural gas was used. As seen in Figure 5b for fuel oil, the energy savings for 25, 32, 40, 50, and 65 mm pipes were 27.18, 35.19, 40.31, 51.01, and 62.35 $/m, whereas for natural gas, these values were 10.35, 13.47, 15.46, 19.64, and 24.06 $/m, respectively. The payback period for various fuel types and pipe sizes proved that fuel oil had the shortest payback period with increasing pipe diameter (Figure 5c). For instance, the payback periods for fuel oil, coal, and natural gas decreased from 0.626 to 0.502 years, from 0.851 to 0.708 years, and from 0.869 to 0.724 years at optimum insulation thickness when the pipe size ranged from 25 to 65 mm, respectively. The highest emissions were achieved by using coal as an energy source. The highest value of CO2 emissions (7.618 kg/m) was reached in the 65-mm pipe size with coal (Figure 5d). The highest SO2 emission (0.019 kg/m) was achieved with fuel oil in the 65-mm pipe size, whereas natural gas emitted no SO2 due to the absence of sulfur in its chemical formula (Figure 5e).
3.3. Effect of Degree Days for Various Energy Sources and Pipe Sizes
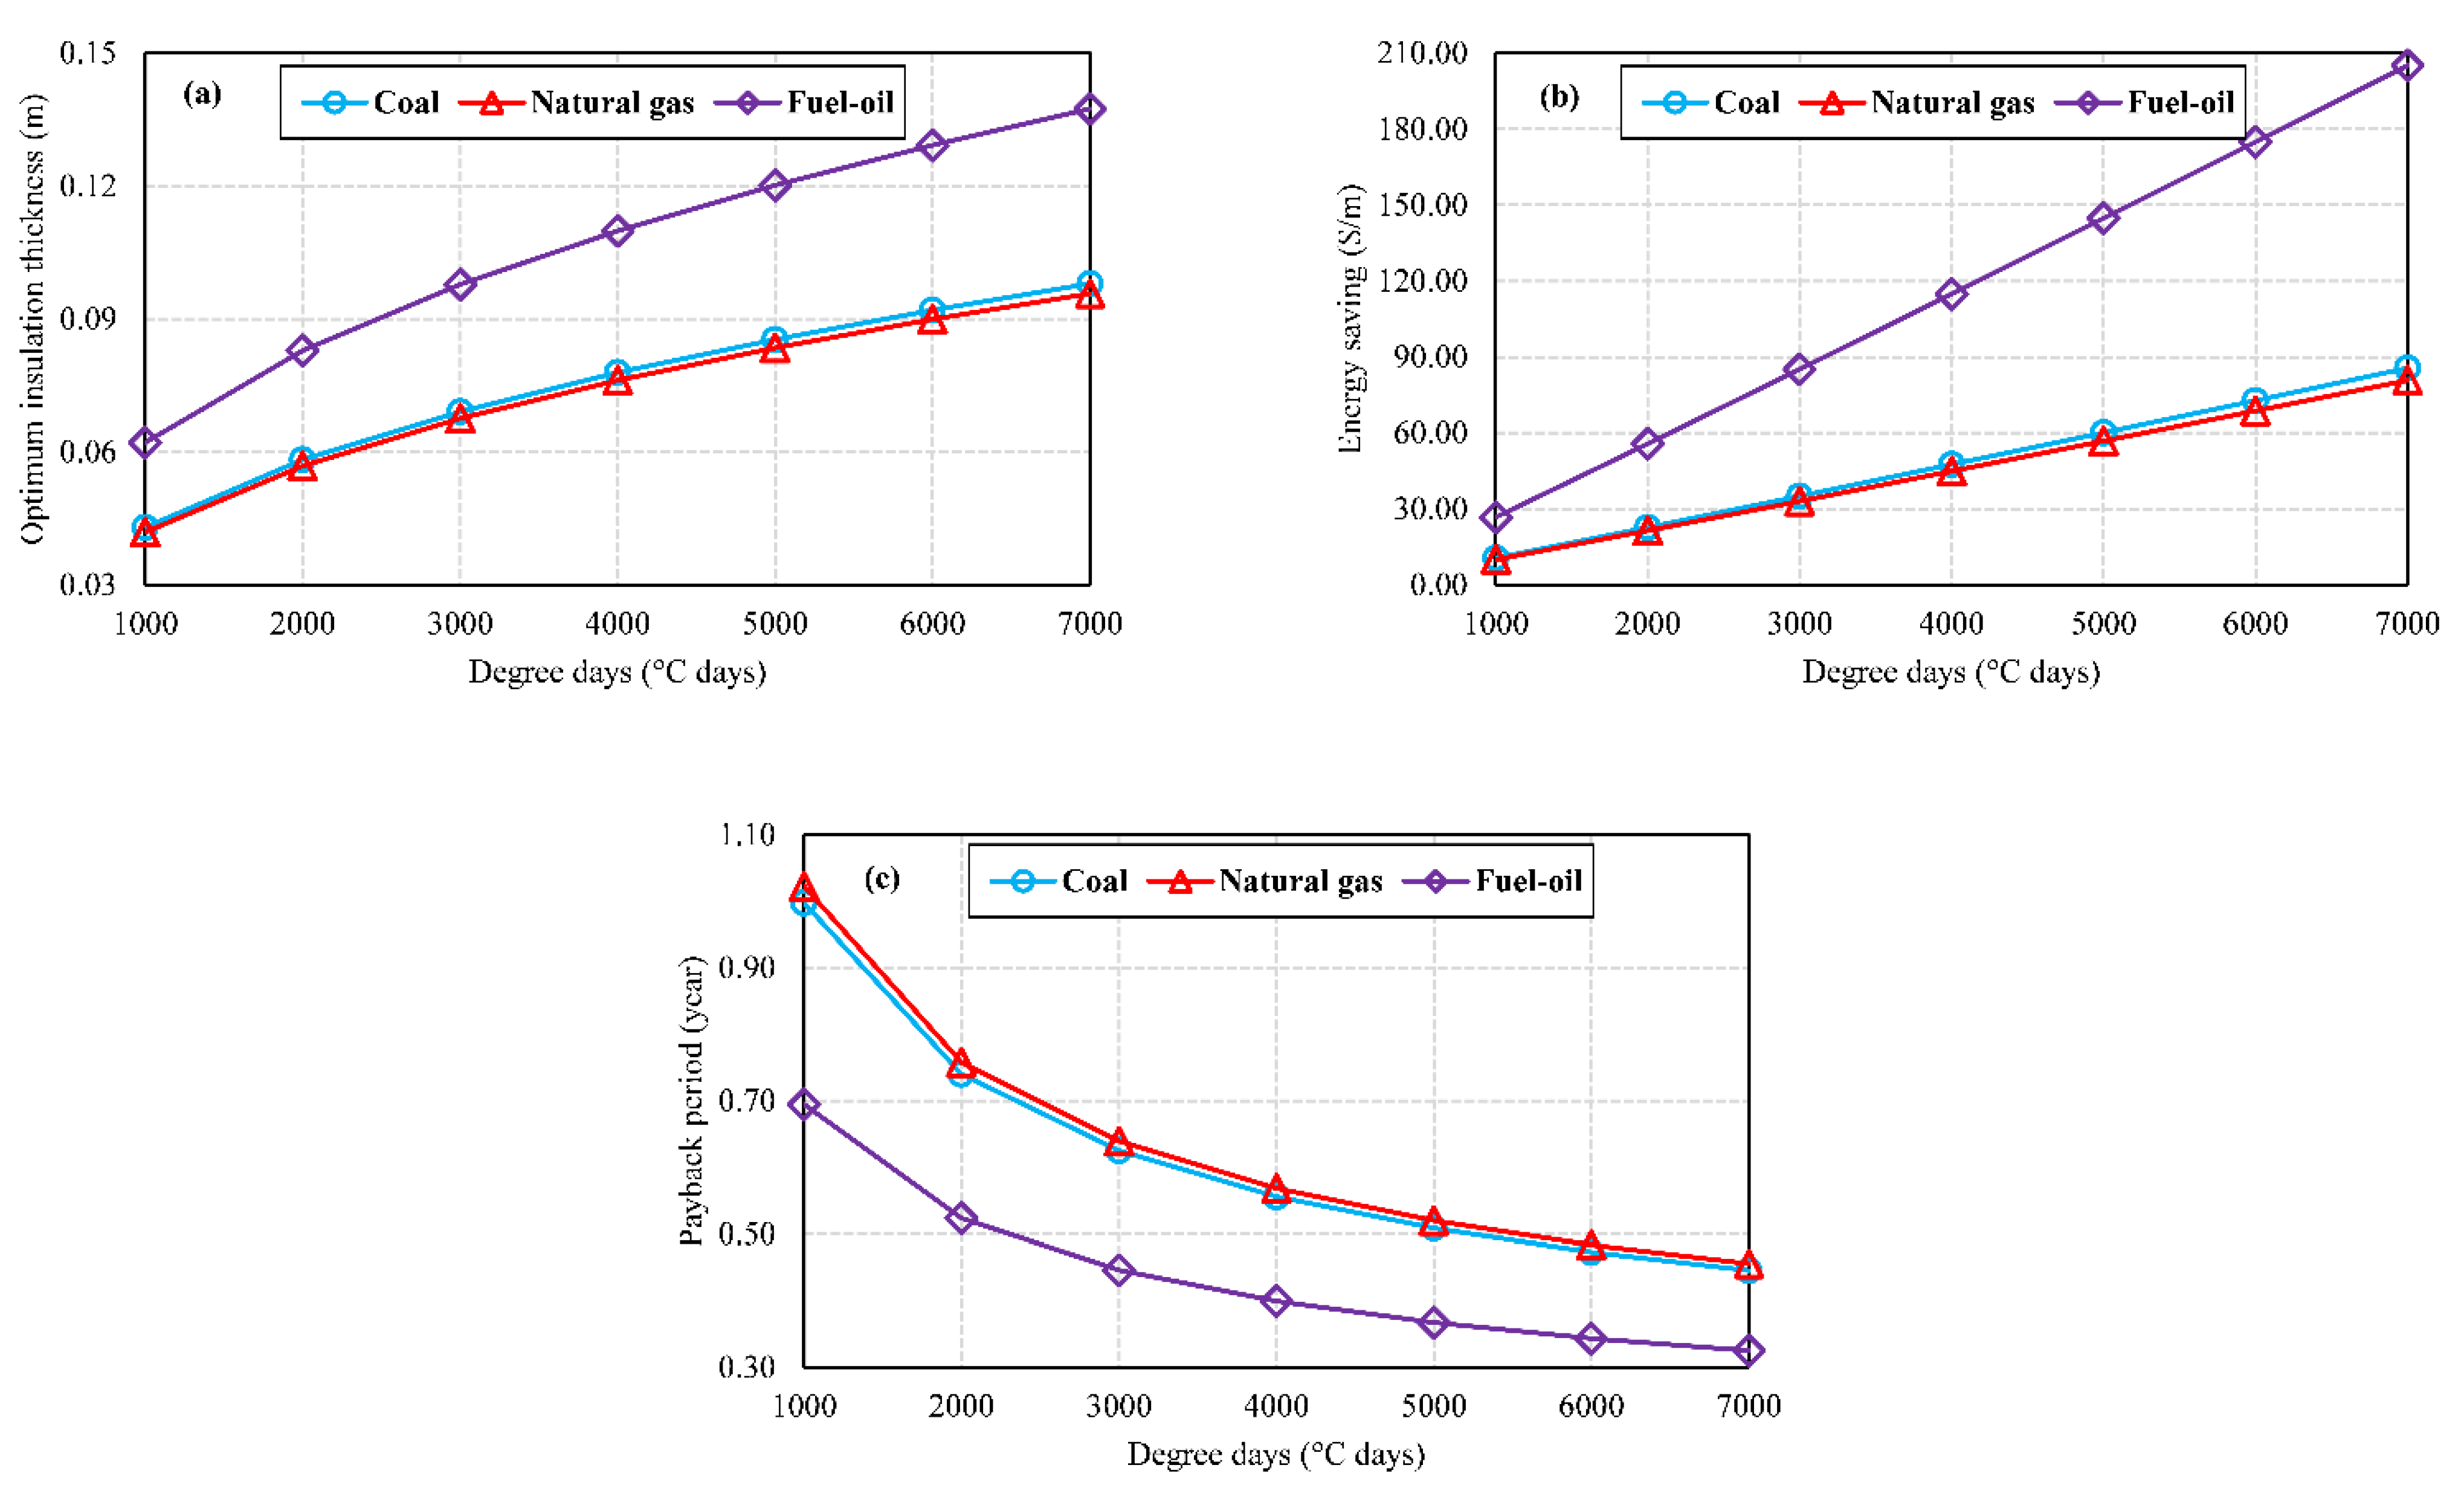
Turkey has four distinct degree-day regions, with the coldest being the fourth. The calculations were performed for Konya, with a degree-day value of 2226 matching the third climatic region. Calculations were extended to incorporate various degree-day values to apply the study’s findings to other locations. The variation in optimum insulation thicknesses, energy savings, and payback periods versus degree-days for various energy sources using a 65-mm pipe size is shown in Figure 6. In parallel to the increase in the degree-day values, the optimum insulation thickness increased. The highest optimum insulation thickness was achieved with fuel oil, and the lowest with natural gas (Figure 6a).
Energy savings were directly proportional to climatic conditions and fuel prices. Energy saving became even more critical in cold regions. Energy savings increased approximately 8-fold as degree days increased from 1000 to 7000. For instance, the energy savings for fuel oil were 26.737 and 205.047 $/m for 1000 and 7000 °C-days, respectively (Figure 6b). The payback period shortened as the number of degree days increased. This demonstrated that insulation was more beneficial in colder regions (Figure 6c).
4. Discussion
The findings of this study were compared to those of other studies looking at the economic and environmental effects of pipe insulation (Table 5). Kayfeci [12] tested five different pipe insulation materials’ thermal performance, using natural gas as the fuel source. The highest optimum insulation thickness (0.134 m) was achieved with Rockwool in a 250-mm-diameter pipe, while the lowest (0.048 m) was attained with fiberglass in a 50-mm-diameter pipe. The energy savings ranged from 10.84 to 49.78 $/m depending on the pipe dimensions and insulation materials. Fiberglass insulation material had the highest payback period of 1.29 years in a 250-mm pipe, while EPS insulation material had the lowest payback period of 0.74 years in a 50-mm pipe. Keçebaş et al. [10] studied the effects of the different energy sources on pipe insulation using Rockwool insulation material. The highest optimum insulation thickness (0.228 m) was achieved with fuel oil in a 250-mm-diameter pipe, while the lowest (0.085 m) was obtained with geothermal energy in a 50-mm-diameter pipe. The energy savings were 10.04 $/m to 175.17 $/m, depending on the energy sources and pipe diameters. The shortest payback period was 0.44 years for a 200-mm-diameter pipe with fuel oil. Daşdemir [14] examined different pipe types’ insulation performance (stainless steel, plastic, and copper). Because of plastic pipes’ low heat conduction coefficient, an LCA analysis was ineffective at determining the optimum insulation thickness. The study’s findings showed that plastic pipe insulation is unnecessary. The optimum insulation thicknesses ranged from 0.050 to 0.160 m and from 0.050 to 0.120 m for steel and copper pipes, respectively. The highest energy savings (244.87 $/m) was obtained for steel pipes with fuel oil and XPS utilization. Başoğul and Keçebaş [11] investigated the economic and environmental implications of heating pipeline insulation. They found that the highest optimum insulation thicknesses, energy savings, and emissions, and the lowest payback period, were achieved for a 200-mm pipe size.
The abovementioned studies provide valuable information on the thermal insulation of heating pipelines. These studies were carried out based on the indoor environment conditions of a residential building. Unlike the previous studies, though, the present study is based on greenhouses. In this respect, it is a pioneering study, providing practical information for people working to improve heating pipe insulation in greenhouses.
This study has some limitations due to the assumptions used in the calculations. For instance, altering the temperature of the surrounding environment also changes the results. The analyses were performed at 12 °C. However, growing temperatures vary depending on the crops cultivated in the greenhouse. The temperature range for greenhouse plant production is relatively narrow, ranging between 10 and 30 °C for almost all species, except for specialized applications. Table 6 provides the minimum/maximum growing temperatures [31] and heat losses from the pipe for various greenhouse crops. These temperature ranges differ according to the plants’ day or night temperature requirements or special growing conditions (germination, precooling, forcing, etc.). The minimum and maximum temperature values were used to calculate heating losses for different pipe diameters. The lowest heat loss (35.92 W/m2) was obtained when using the 25-mm pipe dimension for foliage plants with a growing temperature of 35 °C, whereas the highest heat loss (131.06 W/m2) was obtained when using the 65-mm pipe dimension for Easter lilies and hydrangea at a growing temperature of 2 °C. The results showed that heat loss from pipes varies considerably depending on the pipe dimension, as well as the plants and climatic requirements. Therefore, in future studies, economic and environmental analyses should be conducted on heating pipes in greenhouses where different crops are cultivated, considering the plants’ specific requirements. Such a study would provide more comprehensive information about the thermal performance of heating pipes in greenhouses. Despite the limitations mentioned, the present work’s results can contribute to improved insight into the economic and environmental effects of heating pipes in greenhouses.
5. Conclusions
This study was conducted to determine the economic and environmental effects of heating pipeline insulation in greenhouses in Konya, Turkey. The following conclusions were drawn from the results:
- The highest optimum insulation thickness (0.087 m) and energy savings (62.351 $/m) were achieved with a 65-mm pipe size for fuel oil, while the lowest optimum insulation thickness (0.050 m) and energy savings (10.351 $/m) were obtained with a 25-mm pipe size for natural gas.
- The shortest payback period (0.502 years) was achieved for fuel oil with a 65-mm pipe size, while the longest period (0.869 years) was obtained for natural gas with a 25-mm pipe size.
- The highest CO2 (7.618 kg/m) and SO2 (0.019 kg/m) emissions occurred with a 65-mm pipe size for coal and fuel oil.
- In terms of both economic and environmental benefits, fuel oil is the best option.
- Finally, insulation material reduces heat loss through the heating pipelines and has economic and environmental benefits.
Author Contributions
Conceptualization, E.K. and B.C.; methodology, E.K.; formal analysis, E.K.; writing—original draft preparation, E.K., B.C. and H.S.; writing—review and editing, E.K., B.C. and H.S.; visualization, E.K. and H.S.; supervision, B.C. and H.S. All authors have read and agreed to the published version of the manuscript.
Funding
This research received no external funding.
Institutional Review Board Statement
Not applicable.
Informed Consent Statement
Not applicable.
Data Availability Statement
The data presented in this study are available on request from the first author. The data are not publicly available for ethical reasons.
Acknowledgments
The authors would like to thank the anonymous reviewers and the editor for their constructive comments and suggestions for this paper.
Conflicts of Interest
The authors declare no potential conflicts of interest with respect to the research, authorship, and/or publication of this article.
References
- Küçüktopcu, E.; Cemek, B. A study on environmental impact of insulation thickness of poultry building walls. Energy 2018, 150, 583–590. [Google Scholar] [CrossRef]
- IEA. Turkey 2021 Energy Policy Review; International Energy Agency: Paris, France, 2021; pp. 17–34.
- Küçüktopcu, E.; Cemek, B. The use of artificial neural networks to estimate optimum insulation thickness, energy savings, and carbon dioxide emissions. Environ. Prog. Sustain. Energy 2021, 40, e13478. [Google Scholar] [CrossRef]
- Evin, D.; Ucar, A. Energy impact and eco-efficiency of the envelope insulation in residential buildings in Turkey. Appl. Therm. Eng. 2019, 154, 573–584. [Google Scholar] [CrossRef]
- Dombayci, Ö.A.; Atalay, Ö.; Acar, Ş.G.; Ulu, E.Y.; Ozturk, H.K. Thermoeconomic method for determination of optimum insulation thickness of external walls for the houses: Case study for Turkey. Sustain. Energy Technol. Assess. 2017, 22, 1–8. [Google Scholar] [CrossRef]
- López-Ochoa, L.M.; Las-Heras-Casas, J.; López-González, L.M.; García-Lozano, C. Energy Renovation of Residential Buildings in Cold Mediterranean Zones Using Optimized Thermal Envelope Insulation Thicknesses: The Case of Spain. Sustainability 2020, 12, 2287. [Google Scholar] [CrossRef] [Green Version]
- Apkaryan, A.; Kulkov, S. Study of the Thermophysical Properties of a Glass-Ceramic Material for Thermal Insulation of Pipelines of Heating Pipe Mains and Utilities. Inorg. Mater. Appl. Res. 2021, 12, 499–503. [Google Scholar] [CrossRef]
- Avikal, S.; Devi, R.; Bisht, A.S.; Kumar, K.N. Design and Thermal Analysis of Pipe Insulation. In Advances in Fluid and Thermal Engineering; Springer: Berlin/Heidelberg, Germany, 2021; pp. 455–465. [Google Scholar]
- Bahadori, A.; Vuthaluru, H.B. A simple correlation for estimation of economic thickness of thermal insulation for process piping and equipment. Appl. Therm. Eng. 2010, 30, 254–259. [Google Scholar] [CrossRef]
- Keçebaş, A.; Alkan, M.A.; Bayhan, M. Thermo-economic analysis of pipe insulation for district heating piping systems. Appl. Therm. Eng. 2011, 31, 3929–3937. [Google Scholar] [CrossRef]
- Başoğul, Y.; Keçebaş, A. Economic and environmental impacts of insulation in district heating pipelines. Energy 2011, 36, 6156–6164. [Google Scholar] [CrossRef]
- Kayfeci, M. Determination of energy saving and optimum insulation thicknesses of the heating piping systems for different insulation materials. Energy Build. 2014, 69, 278–284. [Google Scholar] [CrossRef]
- Ertürk, M. Optimum insulation thicknesses of pipes with respect to different insulation materials, fuels and climate zones in Turkey. Energy 2016, 113, 991–1003. [Google Scholar] [CrossRef]
- Daşdemir, A.; Ural, T.; Ertürk, M.; Keçebaş, A. Optimal economic thickness of pipe insulation considering different pipe materials for HVAC pipe applications. Appl. Therm. Eng. 2017, 121, 242–254. [Google Scholar] [CrossRef]
- Ucar, A. A thermo-economic approach for determination of optimum thickness of thermal insulation applied to piping systems. J. Renew. Sustain. Energy 2018, 10, 035102. [Google Scholar] [CrossRef] [Green Version]
- Castilla, N.; Hernandez, J. Greenhouse technological packages for high-quality crop production. In Proceedings of the XXVII International Horticultural Congress-IHC2006: International Symposium on Advances in Environmental Control, Automation and Cultivation Systems for Sustainable, High-Quality Crop Production under Protected Cultivation, Seoul, Korea, 13 August 2006; pp. 285–297. [Google Scholar]
- Piscia, D.; Muñoz, P.; Panadès, C.; Montero, J. A method of coupling CFD and energy balance simulations to study humidity control in unheated greenhouses. Comput. Electron. Agric. 2015, 115, 129–141. [Google Scholar] [CrossRef]
- Körner, O.; Challa, H. Process-based humidity control regime for greenhouse crops. Comput. Electron. Agric. 2003, 39, 173–192. [Google Scholar] [CrossRef]
- Rousse, D.R.; Martin, D.; Thériault, R.; Léveillée, F.; Boily, R. Heat recovery in greenhouses: A practical solution. Appl. Therm. Eng. 2000, 20, 687–706. [Google Scholar] [CrossRef]
- Runkle, E.; Both, A. Greenhouse Energy Conservation Strategies; Michigan State University: East Lansing, MI, USA, 2011. [Google Scholar]
- Canakci, M.; Emekli, N.Y.; Bilgin, S.; Caglayan, N. Heating requirement and its costs in greenhouse structures: A case study for Mediterranean region of Turkey. Renew. Sustain. Energy Rev. 2013, 24, 483–490. [Google Scholar] [CrossRef]
- Von Zabeltitz, C. Integrated Greenhouse Systems for Mild Climates: Climate Conditions, Design, Construction, Maintenance, Climate Control; Springer Science & Business Media: Berlin/Heidelberg, Germany, 2010. [Google Scholar]
- Teitel, M.; Segal, I.; Shklyar, A.; Barak, M. A comparison between pipe and air heating methods for greenhouses. J. Agric. Eng. Res. 1999, 72, 259–273. [Google Scholar] [CrossRef]
- Bartzanas, T.; Tchamitchian, M.; Kittas, C. Influence of the heating method on greenhouse microclimate and energy consumption. Biosyst. Eng. 2005, 91, 487–499. [Google Scholar] [CrossRef]
- Dhiman, M.; Sethi, V.; Singh, B.; Sharma, A. CFD analysis of greenhouse heating using flue gas and hot water heat sink pipe networks. Comput. Electron. Agric. 2019, 163, 104853. [Google Scholar] [CrossRef]
- Shahryari, A.; Pakshir, M. Influence of a modulated electromagnetic field on fouling in a double-pipe heat exchanger. J. Mater. Processing Technol. 2008, 203, 389–395. [Google Scholar] [CrossRef]
- Tükel, M.; Tunçbilek, E.; Komerska, A.; Keskin, G.A.; Arıcı, M. Reclassification of climatic zones for building thermal regulations based on thermoeconomic analysis: A case study of Turkey. Energy Build. 2021, 246, 111121. [Google Scholar] [CrossRef]
- Forsberg, C.H. Heat transfer Principles and Applications; Academic Press, Elsevier: London, UK, 2020; p. 545. [Google Scholar]
- Duffie, J.A.; Beckman, W.A.; Worek, W. Solar engineering of thermal processes. J. Sol. Energy Eng. 1994, 116, 67–68. [Google Scholar] [CrossRef]
- Kaynakli, O. Economic thermal insulation thickness for pipes and ducts: A review study. Renew. Sustain. Energy Rev. 2014, 30, 184–194. [Google Scholar] [CrossRef]
- Hanan, J.J. Greenhouses: Advanced Technology for Protected Horticulture; CRC Press: Washington, DC, USA, 2017. [Google Scholar]
Figure 1.
A schematic illustration of an insulated pipe.

Figure 2.
The impact of insulation thickness on the overall cost of a 65-mm pipe with coal utilization.
Figure 2.
The impact of insulation thickness on the overall cost of a 65-mm pipe with coal utilization.
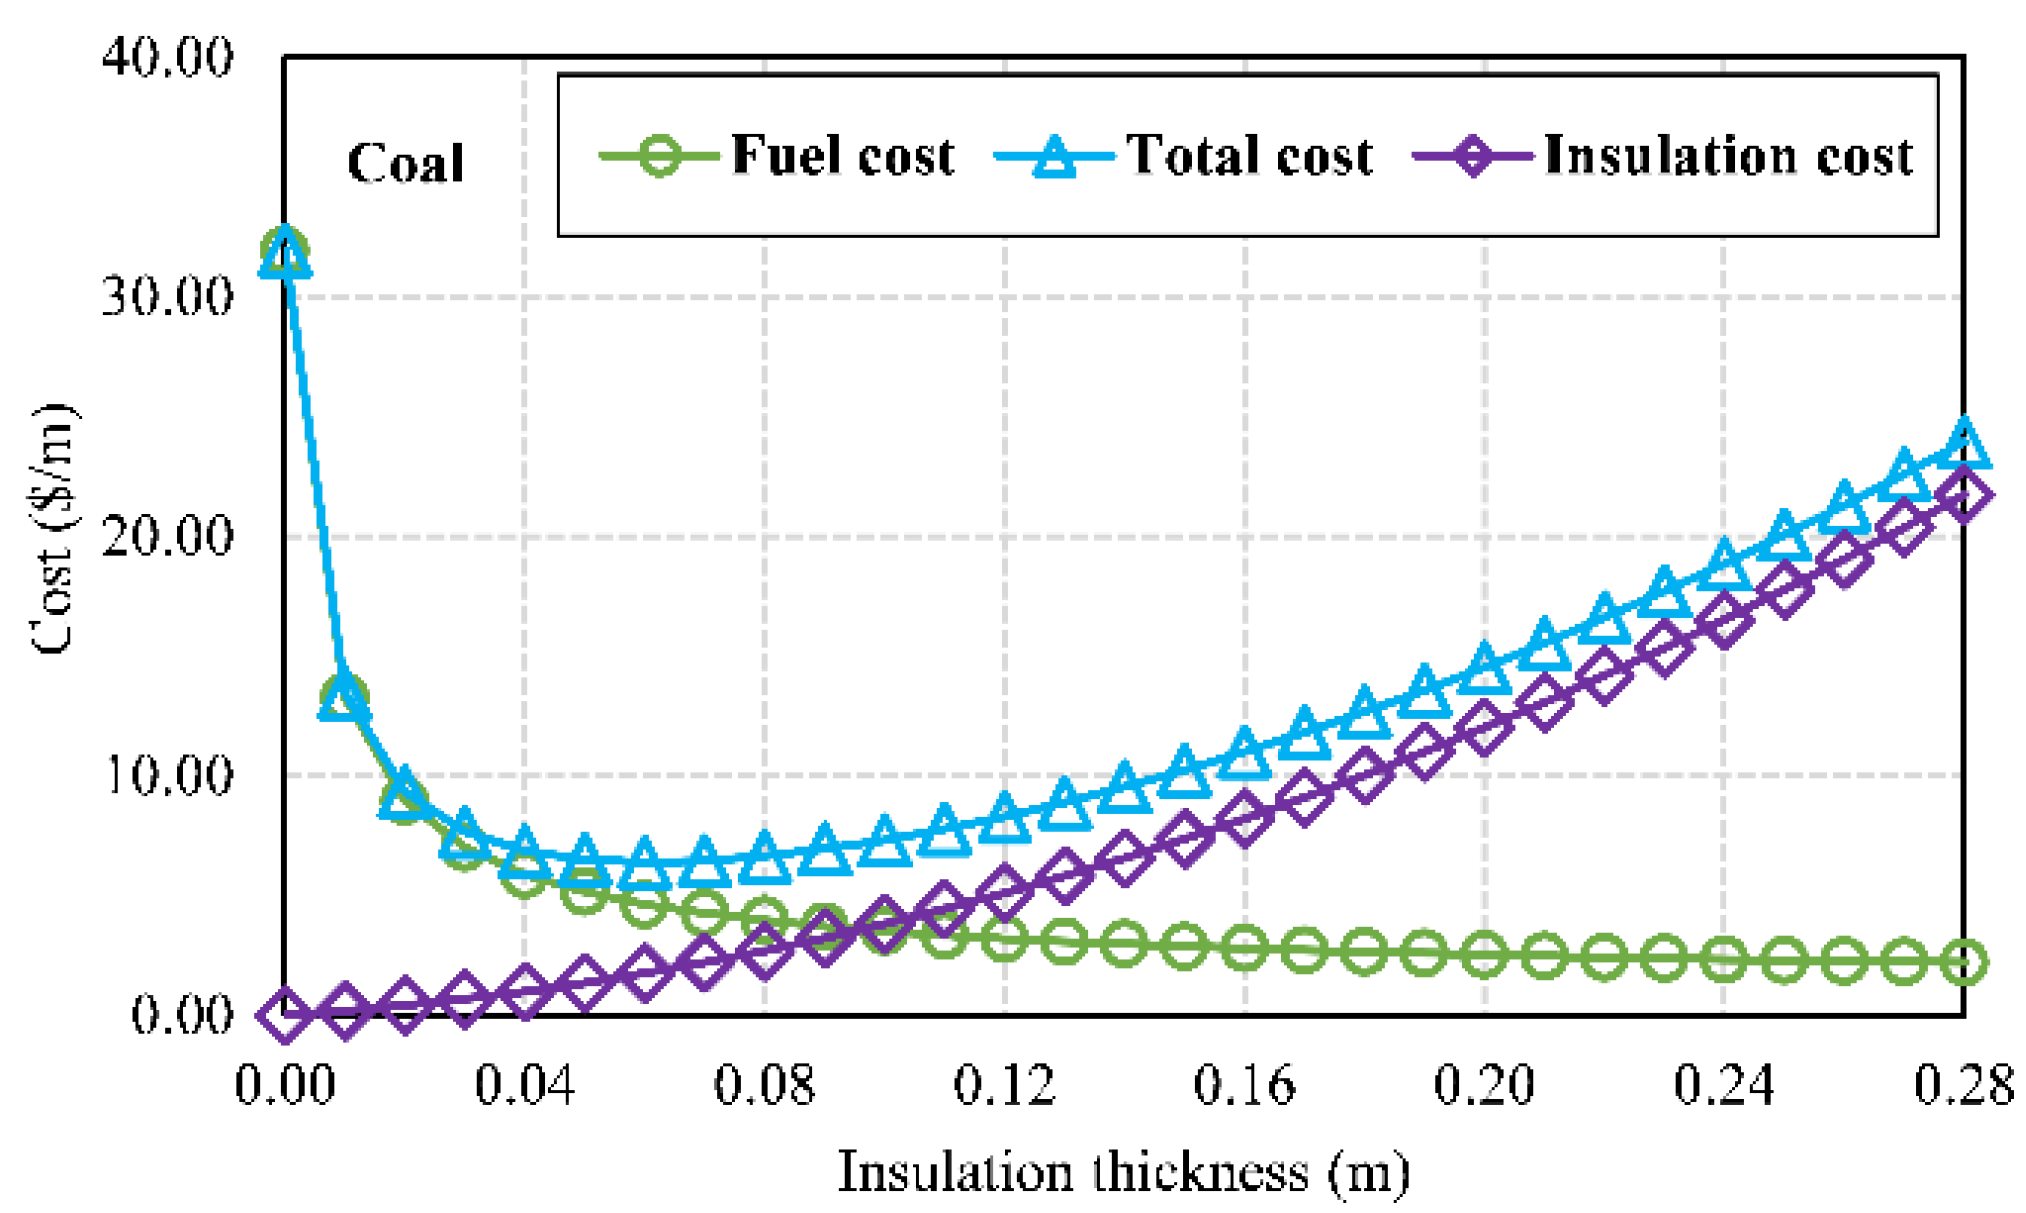
Figure 3.
Energy savings versus insulation thickness for a different energy source in a 65-mm pipe.
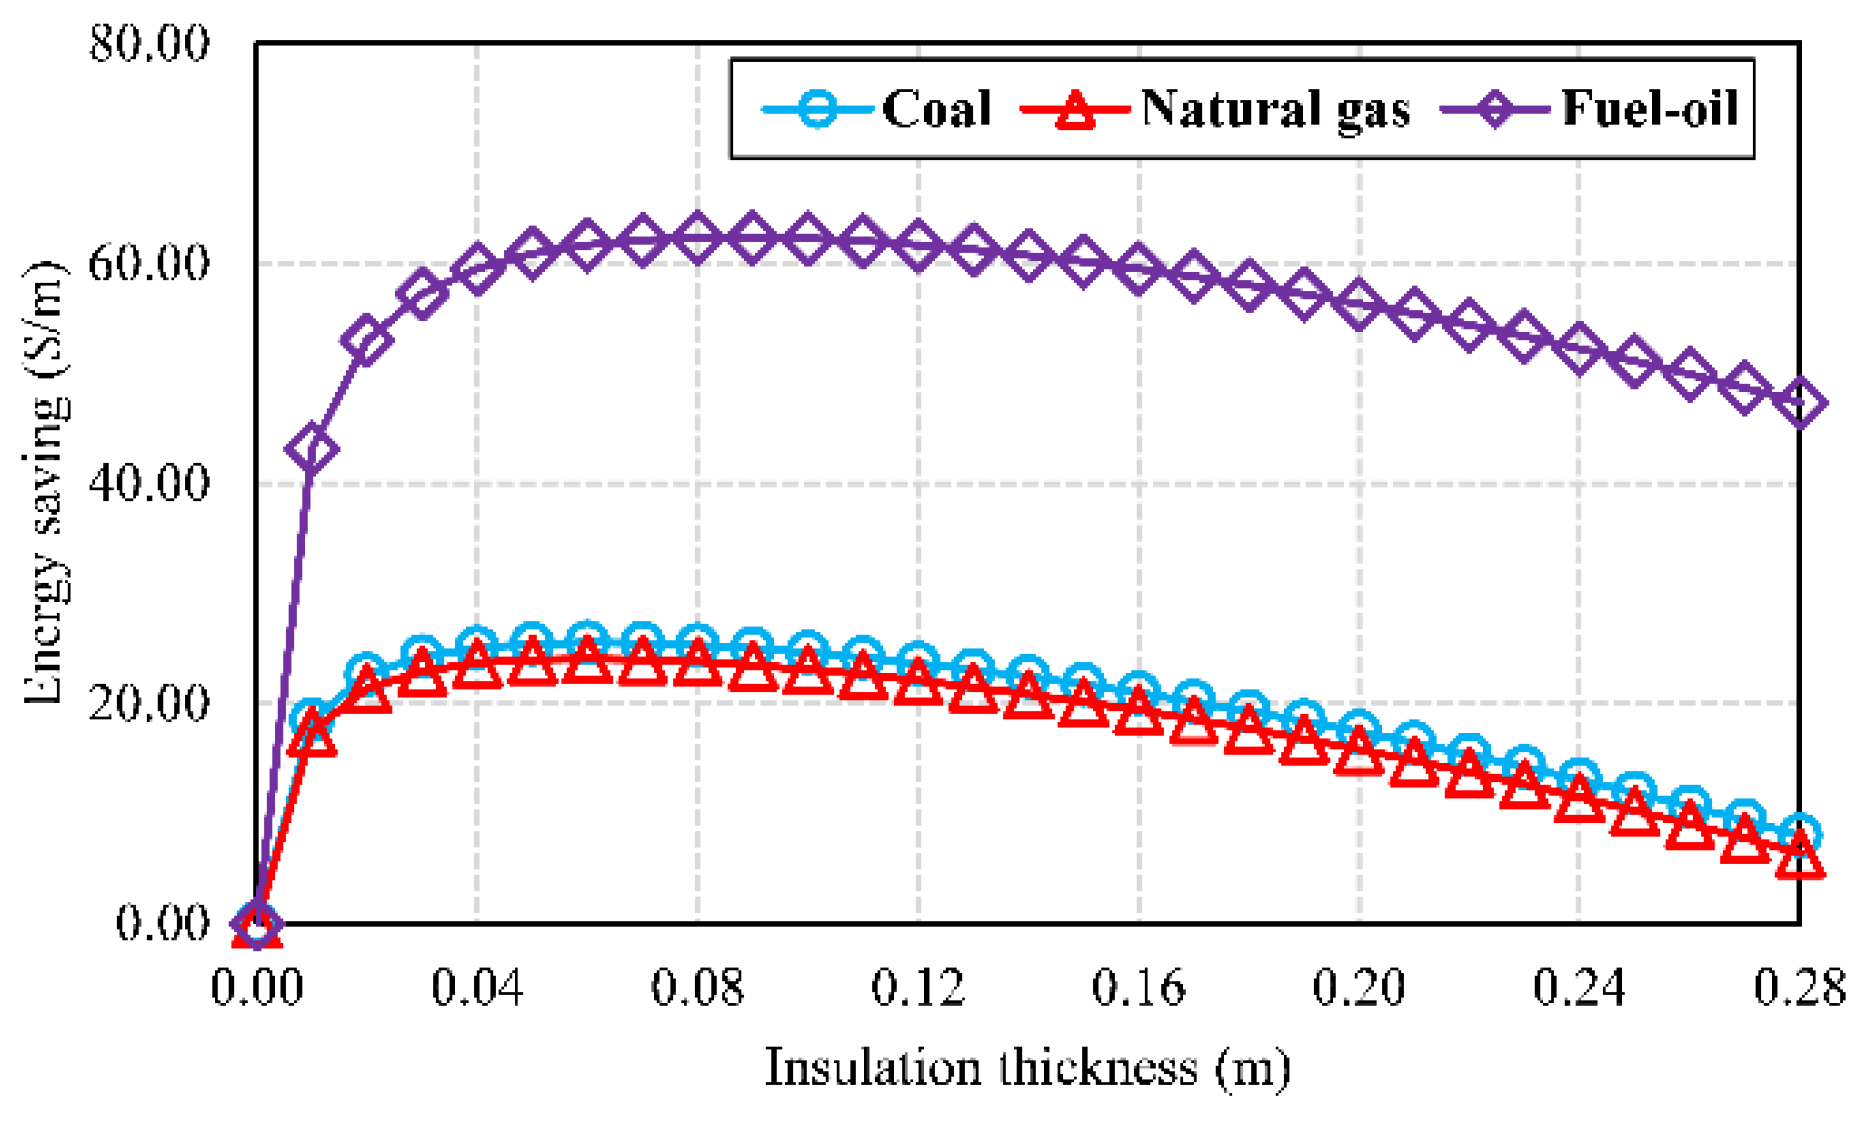
Figure 4.
Energy savings versus insulation thickness in all pipe sizes for (a) coal, (b) fuel oil, and (c) natural gas.
Figure 4.
Energy savings versus insulation thickness in all pipe sizes for (a) coal, (b) fuel oil, and (c) natural gas.

Figure 5.
For various fuel types and pipe sizes, (a) optimum insulation thicknesses, (b) energy savings, (c) payback periods, (d) CO2 emission, and (e) SO2 emission.
Figure 5.
For various fuel types and pipe sizes, (a) optimum insulation thicknesses, (b) energy savings, (c) payback periods, (d) CO2 emission, and (e) SO2 emission.
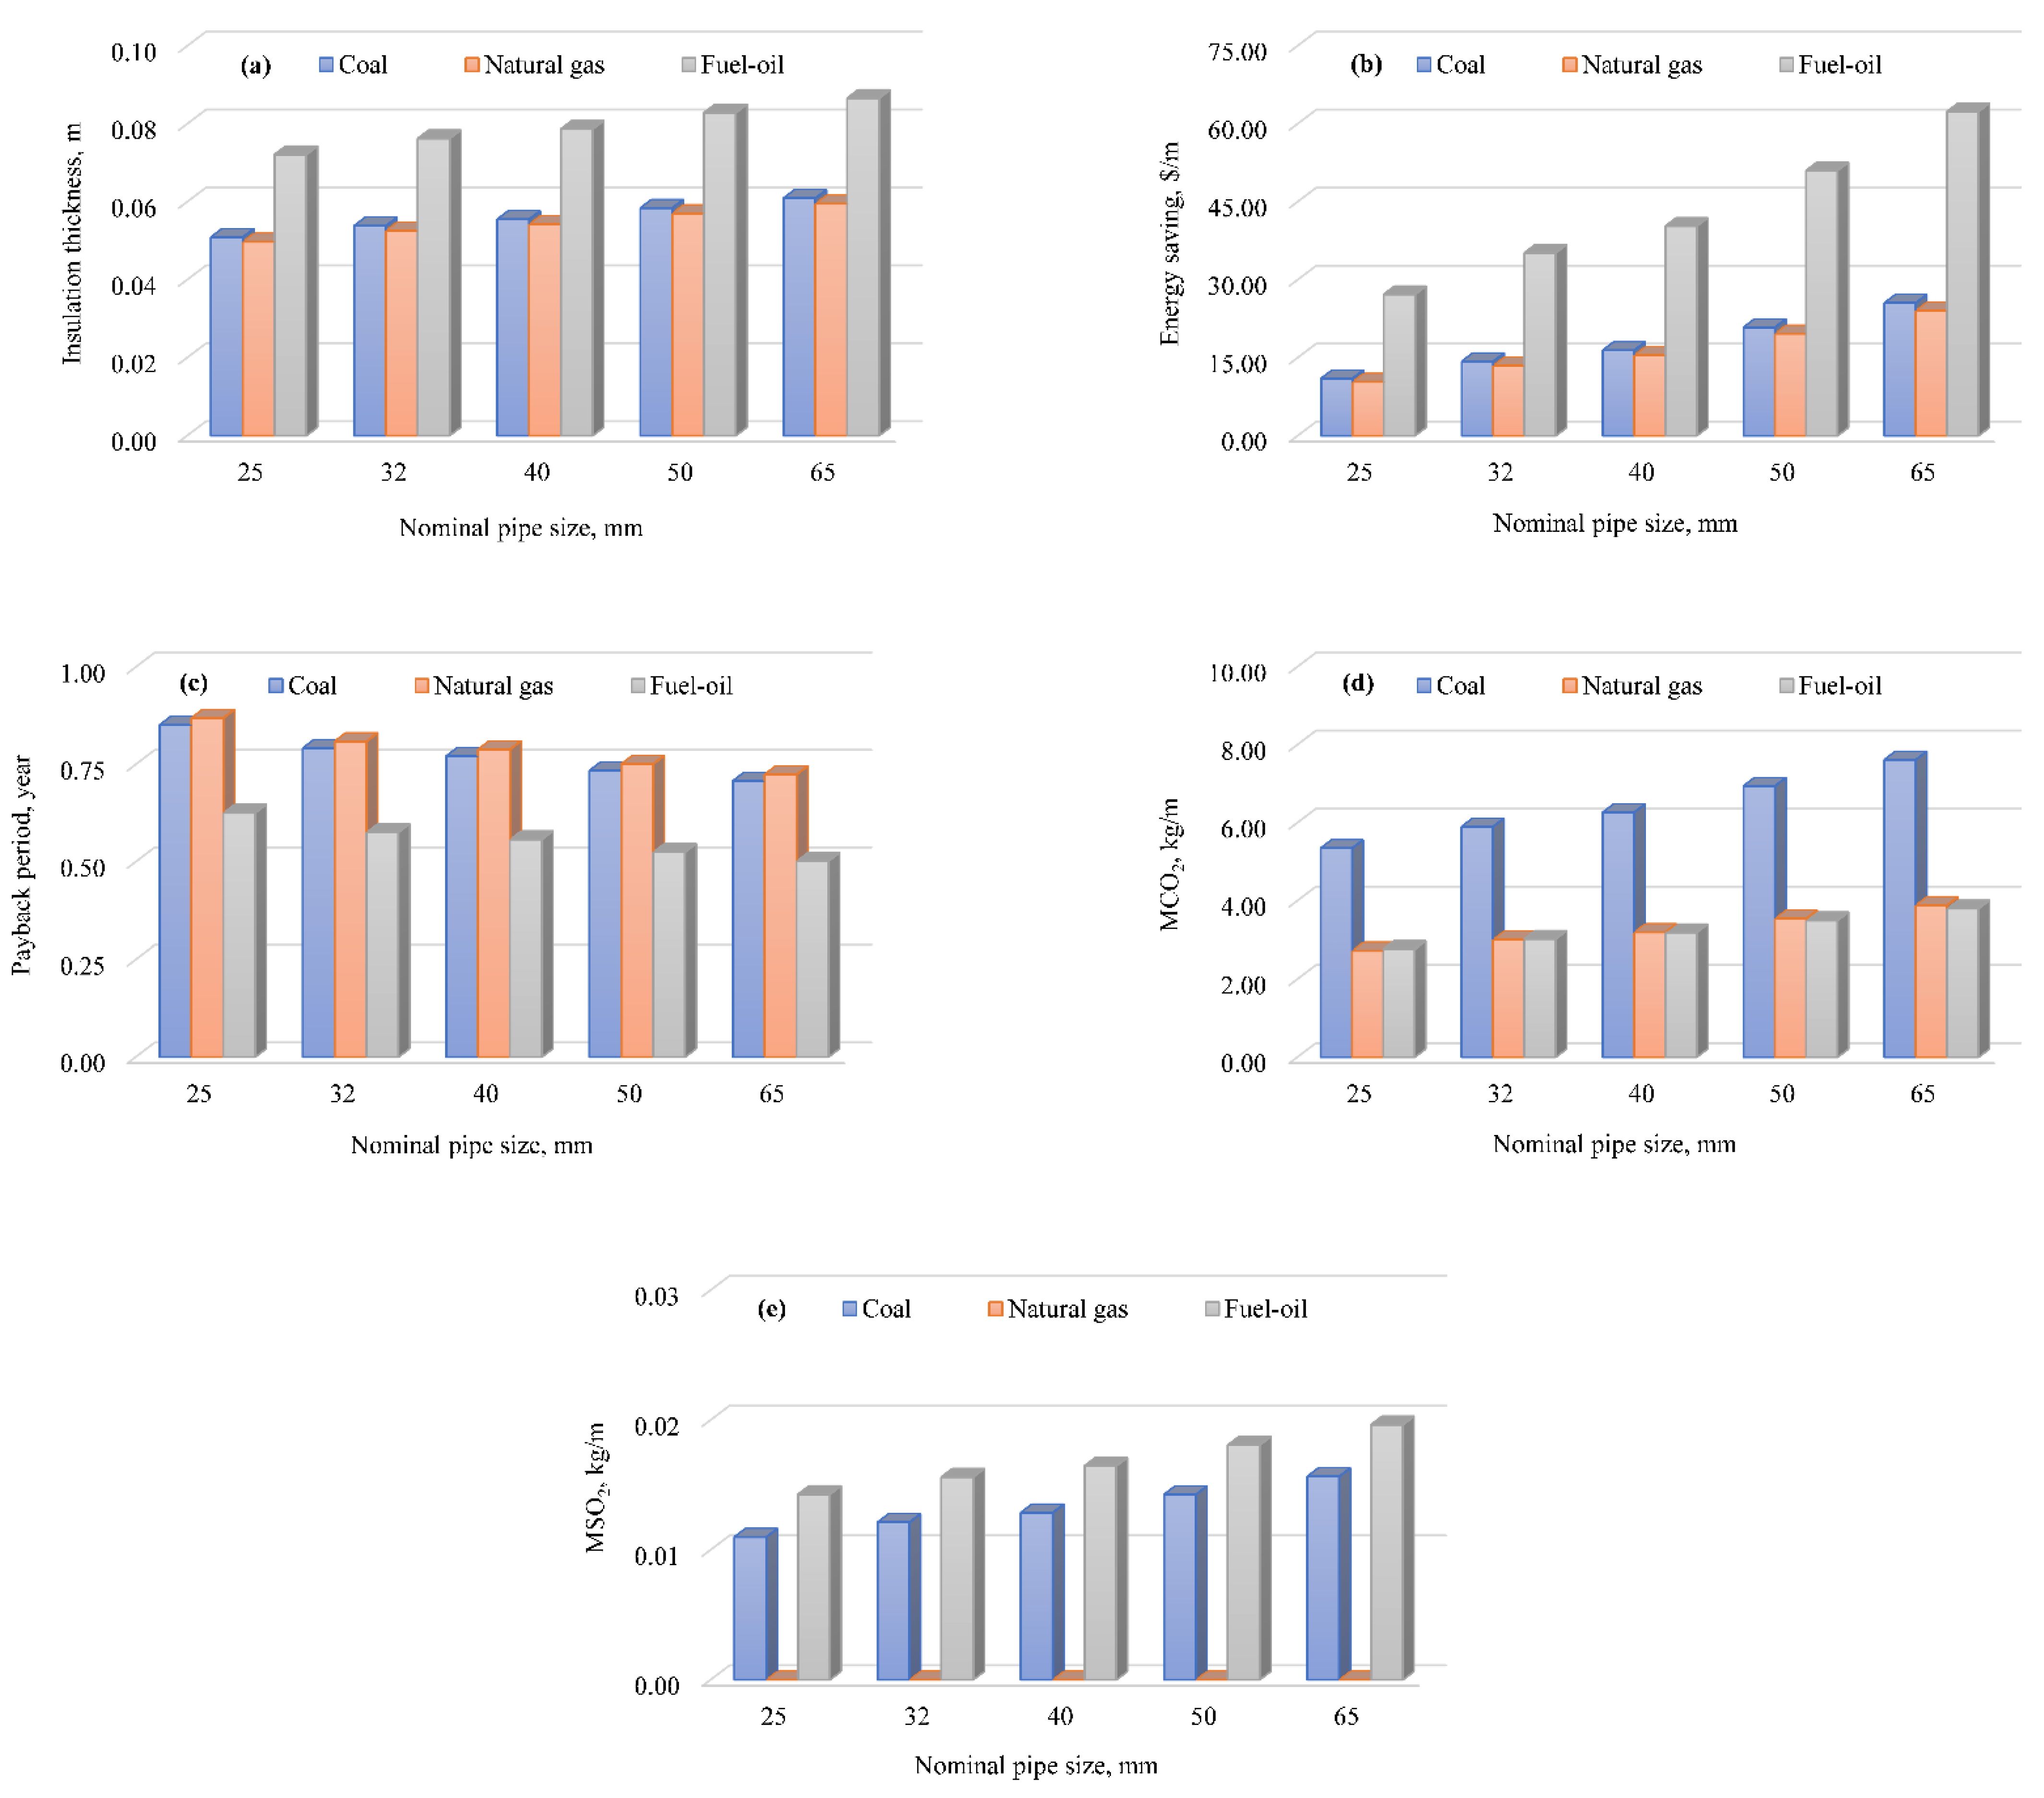
Figure 6.
The variation in the (a) optimum insulation thicknesses, (b) energy savings, and (c) payback periods versus degree days for various energy sources with 65-mm pipes.
Figure 6.
The variation in the (a) optimum insulation thicknesses, (b) energy savings, and (c) payback periods versus degree days for various energy sources with 65-mm pipes.

Table 1.
A general summary of the variables employed in the calculation.
| Variables | Values |
|---|---|
| HDD | 2226 °C-days |
| Nominal pipe sizes | See Table 2 |
| Fuel types | See Table 3 |
| Insulation material | Rockwool |
| Cost | 70 $/m3 |
| Conductivity | 0.040 W/mK |
| Increase rate (d) | 17.14% |
| Discount rate (i) | 19.00% |
| Lifetime (N) | 10 years |
Table 2.
Specific characteristics of the stainless-steel pipes employed in greenhouse heating systems.
Table 2.
Specific characteristics of the stainless-steel pipes employed in greenhouse heating systems.
| Nominal Pipe Size | Outer Diameter | Wall Thickness | Weight Class | Sch No | Unit Weight | |
|---|---|---|---|---|---|---|
| mm | Inch | mm | mm | - | - | kg/m |
| 25 | 1 | 33.40 | 3.38 | STD | 40 | 2.50 |
| 32 | 11/4 | 42.16 | 3.56 | STD | 40 | 3.38 |
| 40 | 11/2 | 48.26 | 3.68 | STD | 40 | 4.05 |
| 50 | 2 | 60.33 | 3.91 | STD | 40 | 5.44 |
| 65 | 21/2 | 73.03 | 5.16 | STD | 40 | 8.63 |
Note: For a stainless-steel pipe (ANSI B 36.10), the conductivity is 16.2 W/m K.
Table 3.
General characteristics of the fuels used in the study [27].
Table 3.
General characteristics of the fuels used in the study [27].
| Fuel Types | Chemical Formulas | Cost | Hu | ns |
|---|---|---|---|---|
| Coal | C7.078H5.149O0.517S0.010N0.086 | 0.205 $/kg | 29288 kJ/kg | 65% |
| Natural gas | C1.050H4.000O0.034N0.022 | 0.327 $/m3 | 34518 kJ/m3 | 93% |
| Fuel oil | C7.313H10.407O0.040S0.026N0.020 | 0.813 $/kg | 40608 kJ/kg | 80% |
Table 4.
Optimum insulation thickness (OIT), energy savings (ES), payback periods (PP), emission of CO2 (MCO2), and SO2 (MSO2) for different energy sources and pipe sizes.
Table 4.
Optimum insulation thickness (OIT), energy savings (ES), payback periods (PP), emission of CO2 (MCO2), and SO2 (MSO2) for different energy sources and pipe sizes.
| Fuel Types | Parameters | Nominal Pipe Size | ||||
|---|---|---|---|---|---|---|
| 25 | 32 | 40 | 50 | 65 | ||
| Coal | OIT (mm) | 0.051 | 0.054 | 0.056 | 0.058 | 0.061 |
| ES ($/m) | 10.996 | 14.307 | 16.418 | 20.843 | 25.532 | |
| PP (year) | 0.851 | 0.792 | 0.771 | 0.734 | 0.708 | |
| MCO2 (kg/m) | 5.347 | 5.900 | 6.263 | 6.942 | 7.618 | |
| MSO2 (kg/m) | 0.011 | 0.012 | 0.013 | 0.014 | 0.016 | |
| Natural gas | OIT (mm) | 0.050 | 0.053 | 0.054 | 0.057 | 0.060 |
| ES ($/m) | 10.351 | 13.474 | 15.463 | 19.635 | 24.057 | |
| PP (year) | 0.869 | 0.809 | 0.788 | 0.751 | 0.724 | |
| MCO2 (kg/m) | 2.722 | 3.006 | 3.192 | 3.541 | 3.887 | |
| MSO2 (kg/m) | --- | --- | --- | --- | --- | |
| Fuel oil | OIT (mm) | 0.072 | 0.076 | 0.079 | 0.083 | 0.087 |
| ES ($/m) | 27.175 | 35.186 | 40.306 | 51.012 | 62.351 | |
| PP (year) | 0.626 | 0.576 | 0.557 | 0.525 | 0.502 | |
| MCO2 (kg/m) | 2.762 | 3.018 | 3.185 | 3.494 | 3.798 | |
| MSO2 (kg/m) | 0.014 | 0.016 | 0.016 | 0.018 | 0.020 | |
Table 5.
The present study’s and other studies’ summary results on pipe insulation’s economic and environmental effects.
Table 5.
The present study’s and other studies’ summary results on pipe insulation’s economic and environmental effects.
| Studies | Location | Parameters | Economic Analyses | Results |
|---|---|---|---|---|
| Present study | Konya, Turkey | Nominal pipe size: 25–65 mm | P1–P2 method | OIT: 0.033–0.087 m |
| Pipe type: Stainless steel | HDD: 2226 °C-days | ES: 10.352–62.351 $/m | ||
| Insulation: Rockwool | N: 10 years | PP: 0.502–0.955 years | ||
| Fuels: coal, natural gas, fuel oil | i: 19.00% | MCO2: 2.654–7.618 kg/m | ||
| d: 17.14% | MSO2: 0.000–0.020 kg/m | |||
| Kayfeci [12] | Isparta, Turkey | Nominal pipe size: 50–250 mm | P1–P2 method | OIT: 0.048–0.134 m |
| Pipe type: Stainless steel | HDD: 2607 °C-days | ES: 10.480–49.780 $/m | ||
| Insulations: Foam board, XPS, EPS, Rockwool, Fiberglass | N: 10 years | PP: 0.740–1.290 years | ||
| Fuels: natural gas | i: 4.00% | MCO2: not investigated | ||
| d: 5.00% | MSO2: not investigated | |||
| Keçebaş et al. [10] | Afyonkarahisar, Turkey | Nominal pipe size: 50–250 mm | P1–P2 method | OIT: 0.085–0.228 m |
| Pipe type: Stainless steel | HDD: 2828 °C-days | ES: 10.041–175.171 $/m | ||
| Insulations: Rockwool | N: 10 years | PP: 0.442–0.808 years | ||
| Fuels: coal, natural gas, fuel oil, geothermal | i: 4.00% | MCO2: not investigated | ||
| d: 5.00% | MSO2: not investigated | |||
| Daşdemir et al. [14] | Afyonkarahisar Turkey | Nominal pipe size: 50–1000 mm | P1–P2 method | OIT: 0.050–0.160 m |
| Pipe type: Stainless steel, plastic, copper | HDD: 2328 °C-days | ES: 8.680–244.870 $/m | ||
| Insulations: Rockwool, XPS, EPS | N: 10 years | PP: 0.110–1.420 years | ||
| Fuels: coal, natural gas, fuel oil | i: 13.00% | MCO2: not investigated | ||
| d: 6.50% | MSO2: not investigated | |||
| Başoğul and Keçebaş [11] | Afyonkarahisar Turkey | Nominal pipe size: 50–200 mm | P1–P2 method | OIT: 0.085–0.259 m |
| Pipe type: Stainless steel | HDD: 2828 °C-days | ES: 10.041–231.299 $/m | ||
| Insulations: Rockwool | N: 10 years | PP: 0.366–0.804 years | ||
| Fuels: coal, natural gas, fuel oil, geothermal | i: 4.00% | MCO2: 2.809–57.629 kg/m | ||
| d: 5.00% | MSO2: 0.000–0.150 kg/m |
Table 6.
Temperature ranges for various greenhouse plants and heat losses from pipes.
| Plants | Temperature Ranges (°C) | Heat Losses from pipes (W/m2) | ||||
|---|---|---|---|---|---|---|
| 25 | 32 | 40 | 50 | 65 | ||
| Alstroemeria | 5–21 | 47.10–59.87 | 59.01–75.02 | 66.65–84.73 | 82.47–104.83 | 99.13–126.02 |
| Alyssum | 3–21 | 47.10–61.46 | 59.01–77.02 | 66.65–86.99 | 82.47–107.63 | 99.13–129.38 |
| Amaryllis | 16–21 | 47.10–51.09 | 59.01–64.01 | 66.65–72.30 | 82.47–89.46 | 99.13–107.54 |
| Anemone | 6–14 | 50.29–59.07 | 63.01–74.01 | 71.17–83.60 | 88.06–103.43 | 105.86–124.34 |
| Aquilegia | 21–29 | 40.71–47.10 | 51.01–59.01 | 57.61–66.65 | 71.29–82.47 | 85.69–99.13 |
| Asparagus | 21–29 | 40.71–47.10 | 51.01–59.01 | 57.61–66.65 | 71.29–82.47 | 85.69–99.13 |
| Aster | 3–12 | 54.28–61.46 | 68.01–77.02 | 76.82–86.99 | 95.05–107.63 | 114.26–129.38 |
| Azalea | 4–18 | 49.49–60.67 | 62.01–76.02 | 70.04–85.86 | 86.66–106.23 | 104.18–127.70 |
| Bedding plants | 13–21 | 47.10–53.48 | 59.01–67.01 | 66.65–75.69 | 82.47–93.65 | 99.13–112.58 |
| Begonia | 13–22 | 46.30–53.48 | 58.01–67.01 | 65.52–75.69 | 81.07–93.65 | 97.45–112.58 |
| Bulbs | 5–16 | 51.09–59.87 | 64.01–75.02 | 72.30–84.73 | 89.46–104.83 | 107.54–126.02 |
| Caladium | 21–29 | 40.71–47.10 | 51.01–59.01 | 57.61–66.65 | 71.29–82.47 | 85.69–99.13 |
| Calceolaria | 3–21 | 47.10–61.46 | 59.01–77.02 | 66.65–86.99 | 82.47–107.63 | 99.13–129.38 |
| Carnation | 10–22 | 46.30–55.88 | 58.01–70.01 | 65.52–79.08 | 81.07–97.84 | 97.45–117.62 |
| Chrysanthemum | 16–21 | 47.10–51.09 | 59.01–64.01 | 66.65–72.30 | 82.47–89.46 | 99.13–107.54 |
| Cineraria | 9–21 | 47.10–56.68 | 59.01–71.01 | 66.65–80.21 | 82.47–99.24 | 99.13–119.30 |
| Cucumber | 21–29 | 40.71–47.10 | 51.01–59.01 | 57.61–66.65 | 71.29–82.47 | 85.69–99.13 |
| Cyclamen | 10–20 | 47.89–55.88 | 60.01–70.01 | 67.78–79.08 | 83.87–97.84 | 100.82–117.62 |
| Easter lilies | 2–21 | 47.10–62.26 | 59.01–78.02 | 66.65–88.11 | 82.47–109.03 | 99.13–131.06 |
| Exacum | 16–26 | 43.10–51.09 | 54.01–64.01 | 61.00–72.30 | 75.48–89.46 | 90.73–107.54 |
| Foliage plants | 18–35 | 35.92–49.49 | 45.01–62.01 | 50.84–70.04 | 62.90–86.66 | 75.61–104.18 |
| Freesia | 13–31 | 39.11–53.48 | 49.01–67.01 | 55.35–75.69 | 68.49–93.65 | 82.33–112.58 |
| Fuchsia | 13–24 | 44.70–53.48 | 56.01–67.01 | 63.26–75.69 | 78.27–93.65 | 94.09–112.58 |
| Geranium | 13–24 | 44.70–53.48 | 56.01–67.01 | 63.26–75.69 | 78.27–93.65 | 94.09–112.58 |
| Gerbera | 9–27 | 42.31–56.68 | 53.01–71.01 | 59.87–80.21 | 74.08–99.24 | 89.05–119.30 |
| Gloxinia | 18–24 | 44.70–49.49 | 56.01–62.01 | 63.26–70.04 | 78.27–86.66 | 94.09–104.18 |
| Hibiscus | 20–24 | 44.70–47.89 | 56.01–60.01 | 63.26–67.78 | 78.27–83.87 | 94.09–100.82 |
| Hydrangea | 2–16 | 51.09–62.26 | 64.01–78.02 | 72.30–88.11 | 89.46–109.03 | 107.54–131.06 |
| Iris | 16–32 | 38.32–51.09 | 48.01–64.01 | 54.22–72.30 | 67.09–89.46 | 80.65–107.54 |
| Kalanchoe | 16–21 | 47.10–51.09 | 59.01–64.01 | 66.65–72.30 | 82.47–89.46 | 99.13–107.54 |
| Lettuce | 10–24 | 44.70–55.88 | 56.01–70.01 | 63.26–79.08 | 78.27–97.84 | 94.09–117.62 |
| Poinsettia | 16–32 | 38.32–51.09 | 48.01–64.01 | 54.22–72.30 | 67.09–89.46 | 80.65–107.54 |
| Rose | 16–29 | 40.71–51.09 | 51.01–64.01 | 57.61–72.30 | 71.29–89.46 | 85.69–107.54 |
| Saintpaulia | 20–23 | 45.50–47.89 | 57.01–60.01 | 64.39–67.78 | 79.67–83.87 | 95.77–100.82 |
| Snapdragon | 10–21 | 47.10–55.89 | 59.01–70.01 | 66.65–79.08 | 82.47–97.84 | 99.13–117.62 |
| Sweet pepper | 7–21.5 | 46.70–58.27 | 58.51–73.01 | 66.09–82.47 | 81.77–102.04 | 98.29–122.66 |
| Tomato | 13–29 | 40.71–53.48 | 51.01–67.01 | 57.61–75.69 | 71.29–93.65 | 85.69–112.58 |
Publisher’s Note: MDPI stays neutral with regard to jurisdictional claims in published maps and institutional affiliations. |
© 2022 by the authors. Licensee MDPI, Basel, Switzerland. This article is an open access article distributed under the terms and conditions of the Creative Commons Attribution (CC BY) license (https://creativecommons.org/licenses/by/4.0/).
Share and Cite
MDPI and ACS Style
Küçüktopcu, E.; Cemek, B.; Simsek, H. The Economic and Environmental Impact of Greenhouse Heating Pipe Insulation. Sustainability 2022, 14, 549. https://doi.org/10.3390/su14010549
AMA Style
Küçüktopcu E, Cemek B, Simsek H. The Economic and Environmental Impact of Greenhouse Heating Pipe Insulation. Sustainability. 2022; 14(1):549. https://doi.org/10.3390/su14010549
Chicago/Turabian StyleKüçüktopcu, Erdem, Bilal Cemek, and Halis Simsek. 2022. "The Economic and Environmental Impact of Greenhouse Heating Pipe Insulation" Sustainability 14, no. 1: 549. https://doi.org/10.3390/su14010549
Note that from the first issue of 2016, this journal uses article numbers instead of page numbers. See further details here.