Article

Use of Off-ASTM Class F Fly Ash and Waste Limestone Powder in Mortar Mixtures Containing Waste Glass Sand

Department of Civil and Environmental Engineering, School of Engineering and Digital Sciences, Nazarbayev University, Nur-Sultan 010000, Kazakhstan
*
Authors to whom correspondence should be addressed.
Sustainability 2022, 14(1), 75; https://doi.org/10.3390/su14010075
Submission received: 4 November 2021 / Revised: 8 December 2021 / Accepted: 9 December 2021 / Published: 22 December 2021
(This article belongs to the Special Issue Sustainable Solid Waste Management and Resource Recycling)

Abstract

:
Developing sustainable concrete with less ordinary Portland cement is a growing issue in the construction industry. Incorporating industrial by-products (such as fly ash or slag) or municipal solid wastes (such as waste glass or recycled concrete aggregate) into the concrete becomes an effective way to reduce the consumption of natural sources and carbon dioxide emission if a proper mix design is provided. The present study examines the influence of the combined use of off-ASTM Class F fly ash (FFA) and waste limestone powder (LSP) on flowability, compressive strength, and expansion characteristics of mortar mixtures containing waste glass sand (WGS). FFA and LSP were used as cement replacement while WGS was used as partial reactive siliceous river sand replacement. Material variables included different WGS replacement ratios (25%, 50%, and 75%) with river sand, LSP contents (25%, 50%, and 75%), FFA contents (15%, 30%, and 45%), and different combinations of FFA-LSP (15–10%, 15–15%, 15–30%, and 15–35%). It is shown that the single use of FFA or LSP reduces both compressive strength and flowability of mortar mixture as its replacement level increases. However, mixtures combined with FFA and LSP provide higher or comparable strength to the single LSP or FFA mixture. For the expansion characteristics due to alkali-silica reaction, the single-use of more than 30% FFA or 75% LSP has less than 0.1% expansion, which is a non-reactive aggregate criterion based on the C1260/C1567 when the test period is extended to 56 days. Moreover, the combination of FFA and LSP has a considerable reduction in expansion rate compared to the single FFA or LSP mixture.

1. Introduction

Sustainability development in the construction industry is a growing issue. The construction industry has set targets to reduce the consumption of raw materials and natural resources and to increase the use of industrial by-products or solid municipal wastes (SMW) as construction materials. In Kazakhstan, approximately 5–6 million tons of household SMW are generated every year. The SMW composition includes organics, gardens, paper, wood, glass, metal, plastic, etc. About 10% of these materials are recycled, and the remaining 90% of SMW is disposed of in landfills. Moreover, in Kazakhstan, only 8.8% of glasses per year are recycled and reused, and the remaining 91.2% of waste glasses are disposed to landfills [1].
On the other hand, Kazakhstan is one of the leading countries in the world, having emerging markets for natural sources and mineral reserves. Kazakhstan’s raw materials base is significant in size and variety, including iron ore, copper, lead, zinc, aluminium, tin, chromium, manganese, coal, and various mineral aggregates [2,3]. Among these minerals, coal is one of the main sources of electric power generation in Kazakhstan. Approximately 70% of the country’s power generation comes from coal-combustion plants located in the northern coal-producing regions [4]. However, the utilization of coal-fired by-products such as fly ash (FA), bottom ash, and flue gas desulfurization gypsum is very limited in Kazakhstan. Because of the low quality of these by-products, they are usually relegated to waste dumps or stockpiled in landfills. Especially, FA is not fitted to ASTM class C, or Class F fly ash criterion.
Moreover, Kazakhstan is known as a Klondike for producing various types of lime and has many regional locations (122 limestone deposits) for limestone supply [5]. Because of the dynamic development of the building industry in Kazakhstan, cement production using limestone in Kazakhstan increased to 10.8 million tons in 2020, which is 5.3% more than in the 12 months of 2019. Using limestone aggregates to produce concrete also increases annually. Despite the widespread use of limestone in the construction industry, waste limestone powders (LSP) produced from limestone quarries are not used and disposed of in Kazakhstan. Since the lack of an integrated waste management system exists, the scarcity of land and the high costs of management and treatment associated with the disposal of these materials create an additional problem for Kazakhstan. Therefore, the Kazak Energy Ministry has introduced amendments to the waste management environmental code to improve the recycling of SMW and initiated the project to utilize crushed waste glass for ecological or environmental benefits.
In concrete construction areas, the crushed waste glass materials are traditionally used as either aggregate in concrete mixtures or supplementary cementitious material (SCM) in the powder form. When finely ground glass particles (less than 75 μm) are used as partial cement replacement in concrete, it shows pozzolanic reactivity that improves long term strength, the microstructure of concrete, and the durability of concrete [6,7,8]
Application as concrete aggregates can be more practical because a large quantity of waste glass can be consumed. However, many researchers [9,10,11,12,13,14] reported that concrete containing waste glass aggregate has excessive expansion and deleterious strength loss due to alkali-silica reaction (ASR) between alkalis in the cement and the reactive silica in the glass. One solution to minimize the expansion due to ASR in the concrete containing waste glass aggregate is to add SCMs such as FA, ground granulated blast furnace slag (GGBFS), and very fine glass powder to the concrete system. Du and Tan [11] reported that mortars combined with 30% FA and glass sand or 60% GGBFS and glass sand exhibited less than 0.1% expansion even at 49 days regardless of glass sand content in ASTM C 1260 test method for potential alkali reactivity of aggregates (mortar-bar method) [15]. Carsana et al. [7] also reported that ground glass shows a similar performance to FA, which improves long-term strength, chloride penetration resistance, and sulfate attack resistance. It was also found that the ASR expansion of water-glass-activated FA was less than 0.1% (the threshold value of ASR expansion by the C 1260 test method) up to 100 % of replacement by glass aggregate [16].
Several researchers have also recently tried to use aggregate residues (powder type) to mitigate the ASR of aggregate. Barros et al. [17] added quartzite residues to the concrete mixture containing reactive aggregate for the ASR. They found that the incorporated quartzite residues help to suppress ASR expansion. Turk et al. [18] reported that ASR expansion was reduced as limestone powder content increased, and its ASR reduction effect is more significant than ASTM Class F fly ash. Wang et al. [19] investigated the effect of FA and LSP on inhibiting ASR of concrete along with various evaluation methods such as the ASTM C 1567 test method for determining the potential alkali-silica reactivity of combinations of cementitious materials and aggregate (an accelerated mortar-bar method) [20], ASTM C 441 test method for the effectiveness of pozzolans or ground blast-furnace slag in preventing excessive expansion of concrete due to the ASR [21], and ASTM C 1293 test method for the determination of length change of concrete due to the ASR, and rock column method [22]. Regardless of different test methods, the ASR expansion of concrete was inhibited when 45% LSP and 15% FA were added to the concrete [23]. They also reported that the combination of FA-LSP was more effective in mitigating the ASR expansion of concrete than the single use of FA and LSP.
As previously stated, the use of solid waste glass as aggregate in cementitious materials is limited because ASR occurs in certain circumstances such as grain size of glass, alkali level and quality of cementitious material, and temperature [10,24,25]. To effectively control ASR for concrete containing waste glass aggregate, the mixture composition of concrete must be optimized by applying low-alkali content to concrete and by the use of SCMs. Though several recent studies demonstrated that LSP could suppress the ASR expansion of cementitious material mixture containing ASR-susceptible aggregates, there are little data available on the effect of FA-LSP combination on inhibiting the ASR expansion of mortar containing waste glass sand (WGS). Moreover, the utilization of FA in construction applications in Kazakhstan is limited because of the quality control issue of FA. The FA produced in Kazakhstan is not fitted to the ASTM class C, or Class F fly ash criterion. Therefore, it is an off-ASTM Class fly ash.
Therefore, this research investigated the effect of off-ASTM Class FFA and LSP combinations on the properties of mortar mixture containing WGS. For this objective, basic material characteristics, flowability, compressive strength, ASR expansion, and scanning electron microscopic (SEM) image of ASR-damaged mortar specimens containing reactive siliceous sand with three different WGS replacement ratios (25%, 50%, and 75%) were evaluated in terms of three different LSP contents (25%, 50%, and 75%), three different FFA contents (15%, 30%, and 45%), and different combinations of FFA-LSP (15–10%, 15–15%, 15–30%, and 15–35%).

2. Experimental Program
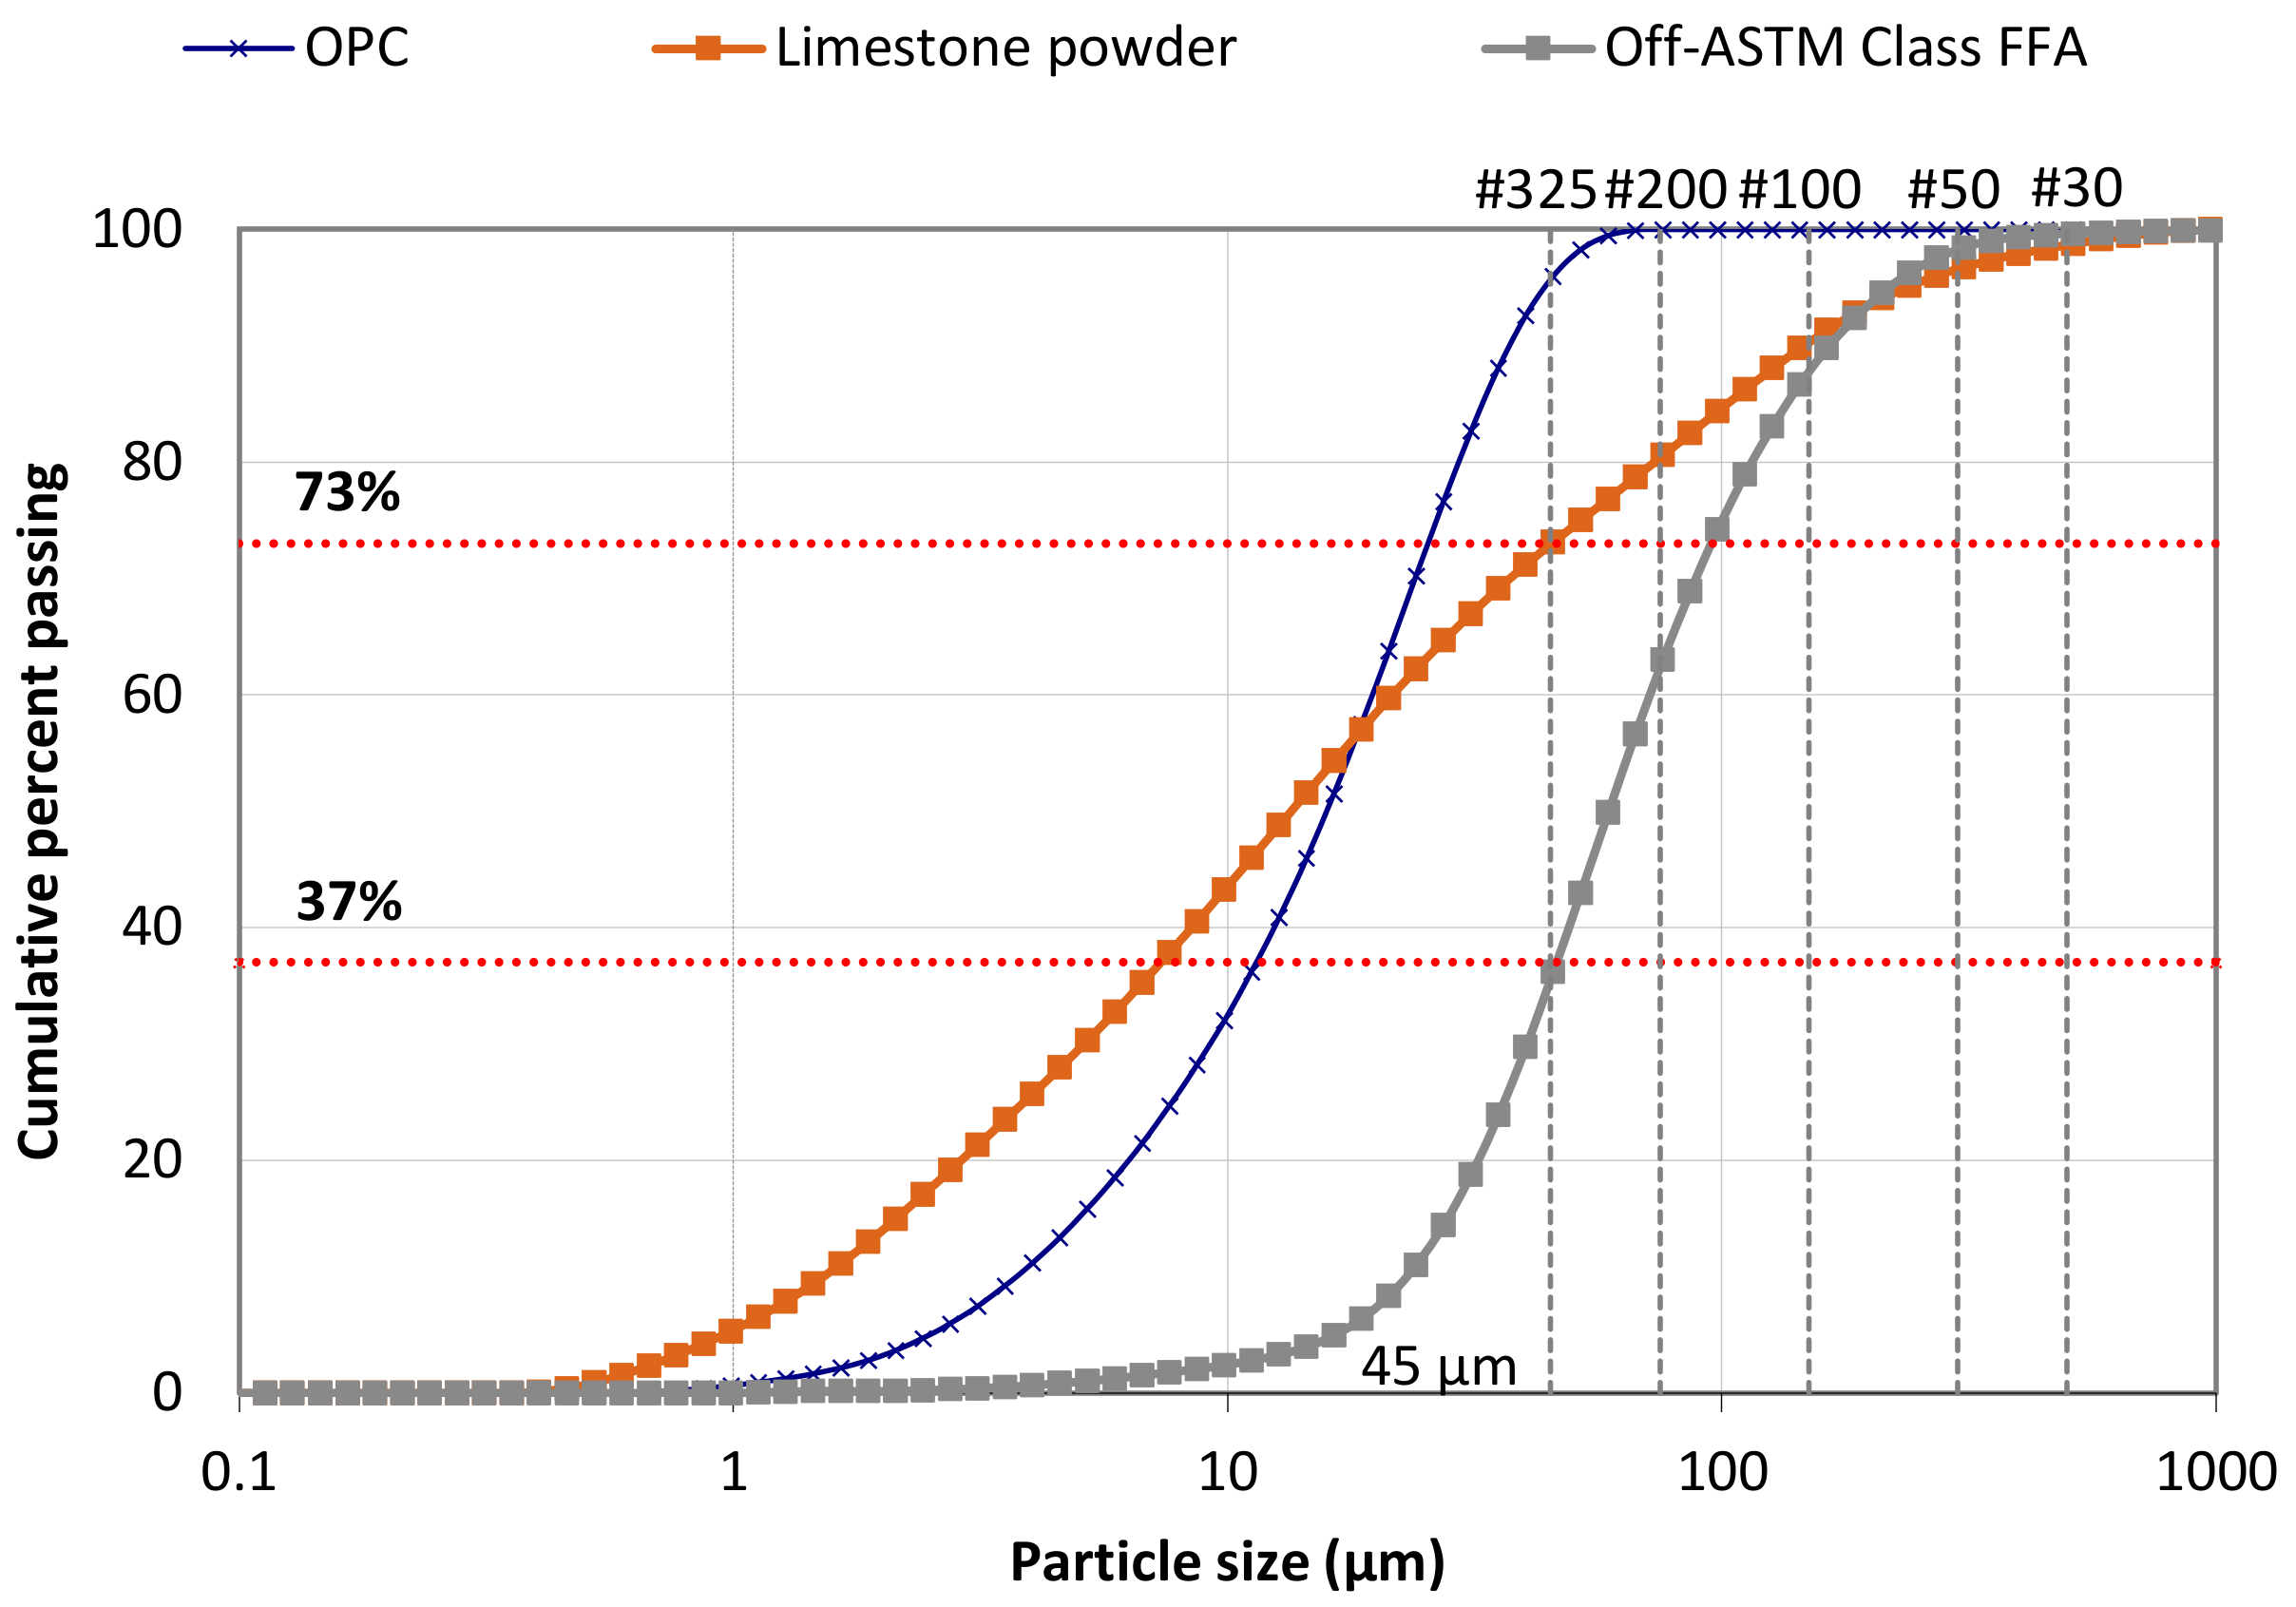
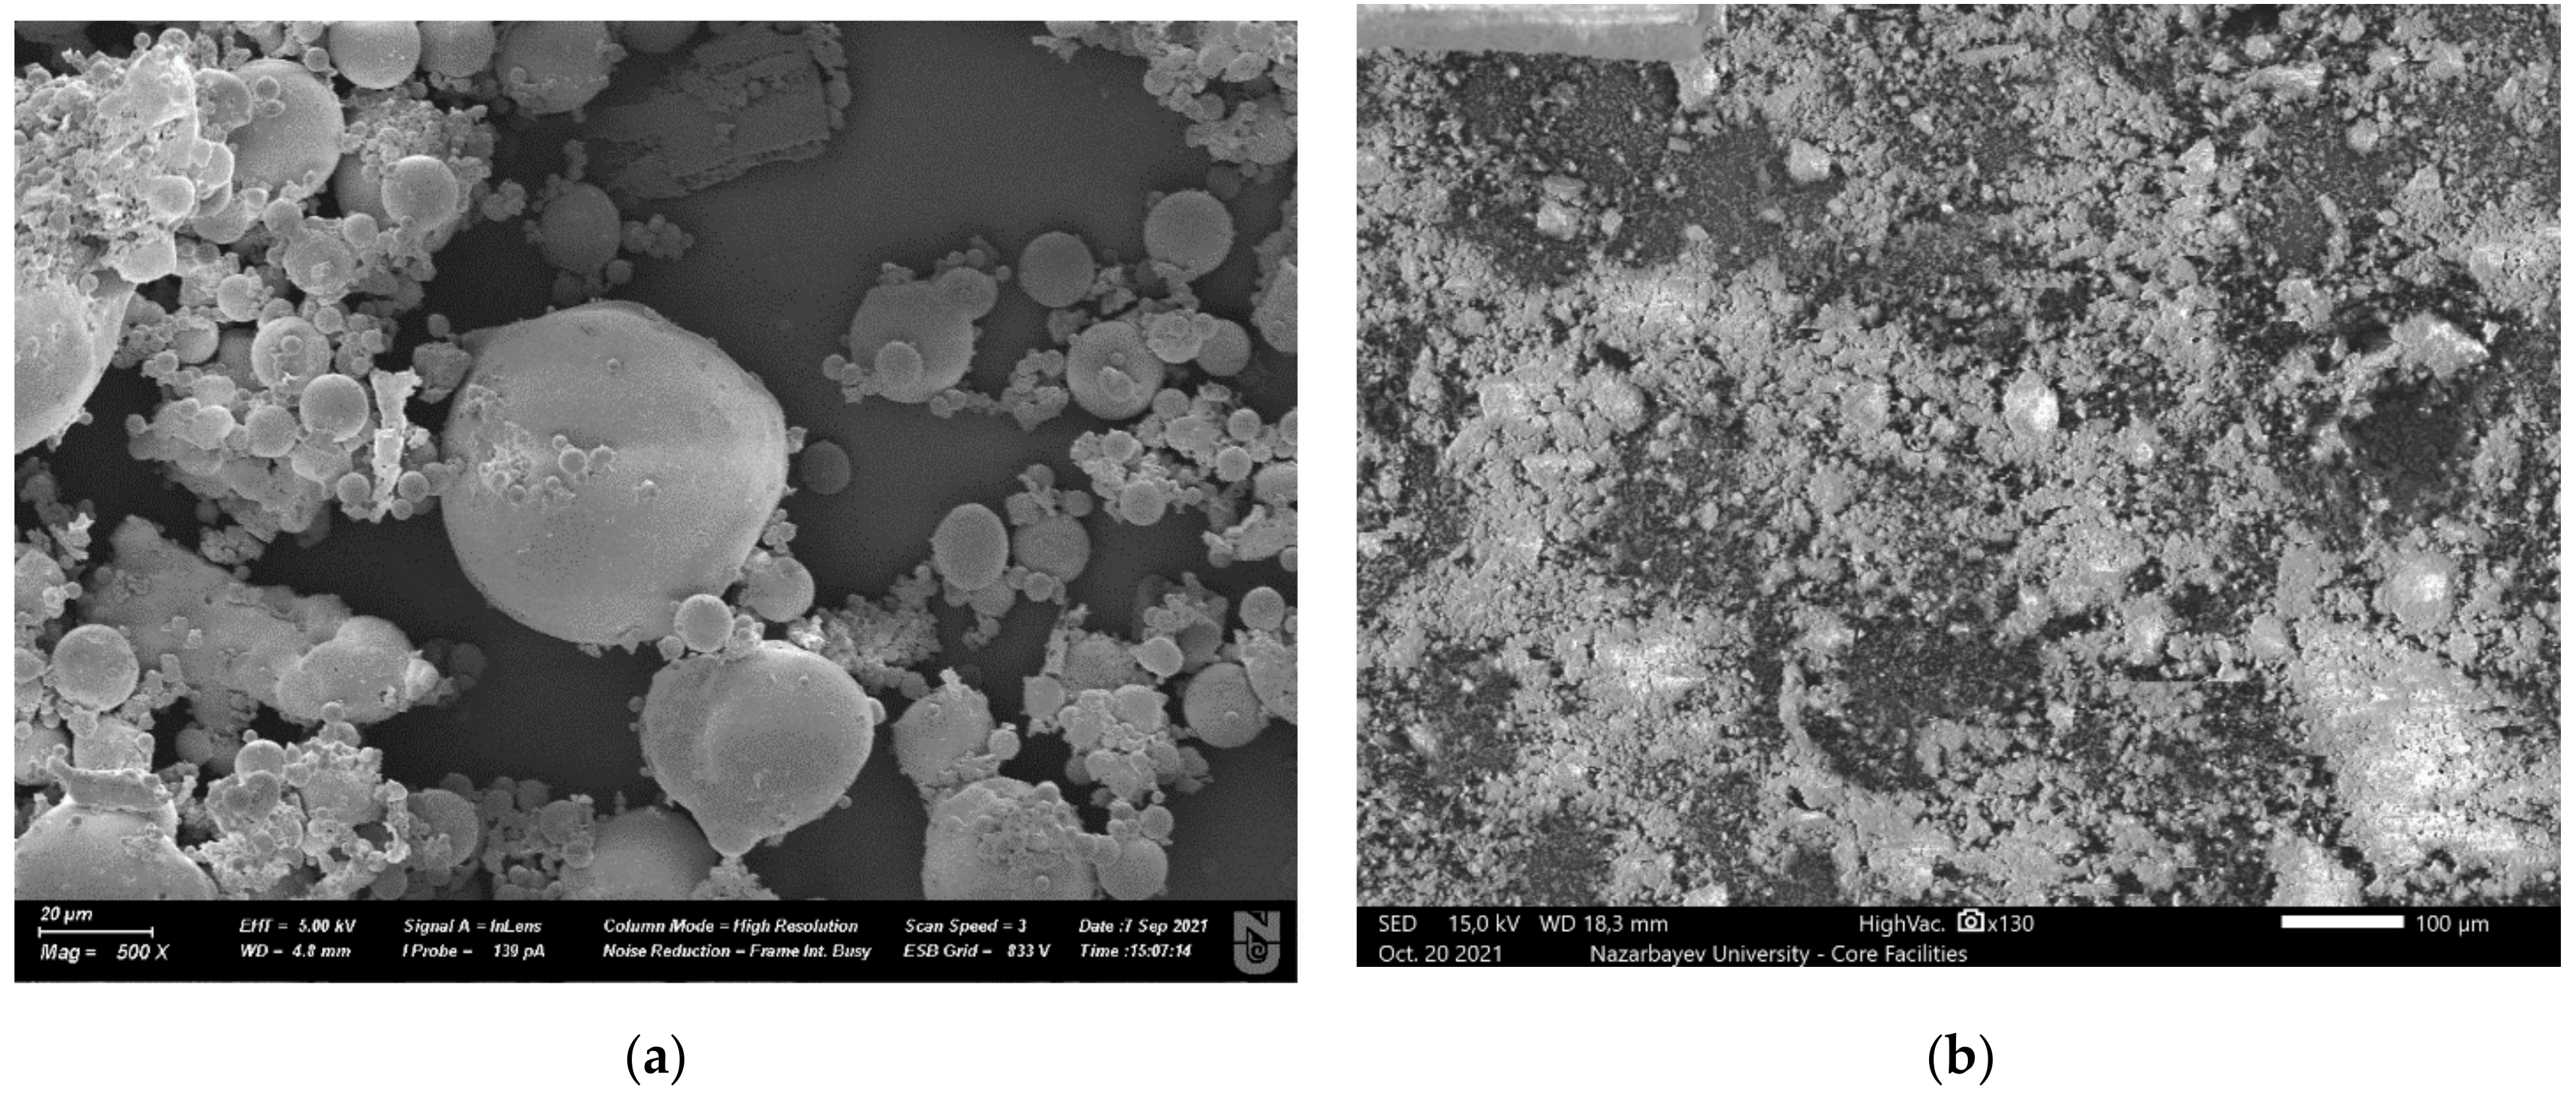
As previously stated, this study aims to evaluate how the combination of off-ASTM Class F fly ash and LSP influences the properties of mortar mixtures containing waste glass sand, especially the ASR expansion of mortar mixture. The framework for the proposed experimental program is summarized in Table 1. The suggested laboratory testing program was mainly set to focus on evaluating the ASR expansion characteristics of the mortar mixture by measuring expansion according to ASTM C 1260/C 1567. Other two areas of interest as supplementary include (i) characterization of materials and (ii) evaluation of basic fresh and hardened properties of mortar mixture. Details of the experimental program are presented in the following subchapters.

2.1. Materials

As shown in Figure 1, the siliceous river sand classified as reactive aggregate (an expansion of 0.24 percent at 14 days according to the C1260 test method) has been used to make a plain mortar mixture. The WGS obtained by crushing and milling glass vessels and bottles (glasses mixed with clean and green glasses in the ratio of 8 to 2 by mass) has been sieved to achieve the grading requirements of the C1260. The WGS replaced reactive sand to 25%, 50%, and 75% of the total aggregate mass.
Binding materials used in this study included ordinary Portland cement (OPC) ASTM Type I cement, off-ASTM Class FFA, and LSP. As illustrated in Figure 2, the FFA has relatively coarse sizes, low CaO content (3.38%), and low strength activity index (73% at 7-day and 66% at 28-day) based on the ASTM C 311 test method. Especially, the average D10, D50, and D90 values obtained from the laser diffraction method for FFA are 25.2 μm, 65.6 μm, and 183 μm. The chemical and physical properties of these cementitious materials are also presented in Table 2. It should be noted that FFA used in this study has a relatively large coarse size compared to the conventional ASTM Class F fly ash because only 37% of FFA is less than 45 μm, and the other 50% of particles occupy between 65.6 μm and 183 μm. The particle size of LSP used in this study is also coarser than OPC. Approximately 73% of LSP is less than 45 μm. The LSP sample’s average D10, D50, and D90 values are 1.74 μm, 15.4 μm, and 174 μm, respectively.
Figure 3 presents scanning electron microscopic images of off-ASTM Class FFA and limestone powder. The FFA consists of spherical particles, whereas LSP is mostly angular to sub-angular in shape. The FFA also has agglomerated globular masses on the surface of some large fly ash particles that primarily represent the amorphous constituents identified as alumino-silicate with small amounts of Na, K, and Ca associated. SEM observation of the present FFA suggests that the surface texture of this amorphous material is not similar to the smooth glassy phased found in conventional FA. Therefore, replacing OPC with these FFA may not improve the flowability of the mortar mixture. Moreover, the mortar mixture incorporating LSP also may be less workable or not improve the flowability.

2.2. Mixture Proportions and ASR Test Method

Since the research mainly aims to investigate the capability of single FFA, LSP, or the combination of FFA-LSP to mitigate deleterious ASR expansion in mortar bar samples containing WGS, the total 14 mixtures with various contents of FFA, LSP, and the combined FFA-LSP were evaluated according to the C1260/C1567 test procedures. The mixtures were prepared in three groups. The first group was the control mixtures containing 100% reactive river sands and three different combinations of river sand and WGS (75% S-25% WGS, 50% S-50% WGS, and 25% S-75% WGS) and were mixed with 100% cement. The next group was binary blend mixtures prepared by the replacement of cement with LSP (25%, 50%, and 75%) and FFA (15%, 30%, and 45%) by the weight of cement at the fixed amount of aggregate with 75% reactive sand and 25% WGS. The combination of 75% sand and 25% WGS was selected for different mixture proportions and further tests because this sand and WGS combination showed the lowest expansion in the expansion test. The last group was a ternary blend mixture that was cast by replacing the cement with the combination of FFA and LSP (15–10%, 15–15%, 15–30%, and 15–35%) by weight of cement. Mortar specimens were prepared at a water to cementitious material ratio (w/cm) of 0.47. The mixture proportions are presented in Table 3.

2.3. Mixing Procedure and Preparation of Testing Specimens

Continuous mixing procedure (5 min) started with the addition of the binder (pure cement or cement with FFA and/or LSP) and water into a bowl mixer with the 5 L capacity. The binder and water were mixed for 60 s. After that, sand was added to the mixer, and then mixing continued to proceed for one additional minute, both at a slow rate. After a 60-s stop period to mix the particles adhered to the mixer’s walls by hand, the machine mixing was continued by finalizing the procedure with a faster mixing rate for 120 s.
At least three specimens for each test were cast. Compressive strength samples were cast using 50 mm × 50 mm × 50 mm cube molds with the fresh mortar, according to ASTM C 109 Standard Test Method for Compressive Strength of Hydraulic Cement Mortars using 50 mm cube specimen [26]. Being cast into two layers with each layer tapped with a rod, the molds were shaken to compact the mortar better. The molds were covered with plastic sheets to avoid moisture evaporation. After 24 h, the samples were demolded and cured in water baths at the conditions as follows: saturated lime solution at 23 ± 2 °C for 7 and 28 days, at which the samples were broken to check the strength development.
In addition, 25 mm × 25 mm × 285 mm molds were used to cast the samples for expansion tests by the C 1260/C 1567 standard tests. After casting the samples into two layers with compaction, the hardened mortar bars were demolded after 24 h. After demolding (pre-reading), the bars were measured and put for 24 h into the water for the next measurement (Day 0). Afterward, the samples were put into containers with 1 N NaOH solution and were measured for 56 days under 80 °C temperature conditions.

2.4. Test Procedures

In order to evaluate the relationship between flowability and compressive strength of mortar mixtures, a flow spread test was conducted [27]. The flowability of each mixture was assessed using ASTM C 1437 mortar flow table test as presented in Figure 4. The measured flow test data based on the deformability relative to the diameter of the mortar mixture before and after a collapse were used to calculate the relative flow area (Гm) using Equation (1) [28]. A larger value of Гm indicates higher deformability of the mortar mixture.
Γ m = d 1 × d 2 d 0 2 d 0 2
where, Γm = relative flow area; d1 and d2 = measured flow diameter after dropping (mm); and d0 = initial flow diameter before dropping (mm).
The alkali-silica reaction test of each mortar mixture was performed following the C 1260/C 1567 and the ASTM C 490 [29]. A digital length comparator of ±0.0001 mm accuracy was used to measure the length change of the longitudinal mortar bars at the following intervals: every 3-day or 4-day up to an age of 28 days, and every 7-day up to 56 days. With the length change data, it was possible to obtain the expansion history using Equation (2):
L = L x L i G × 100
where L = change in the length at x age (%); Lx (mm) = (comparator reading of specimen at x age) − (comparator reading of reference bar at x age); Li (mm) = (initial comparator reading of specimen) − (comparator reading of reference bar at the same time); and G = nominal gauge length (250 mm).

3. Test Results and Discussion

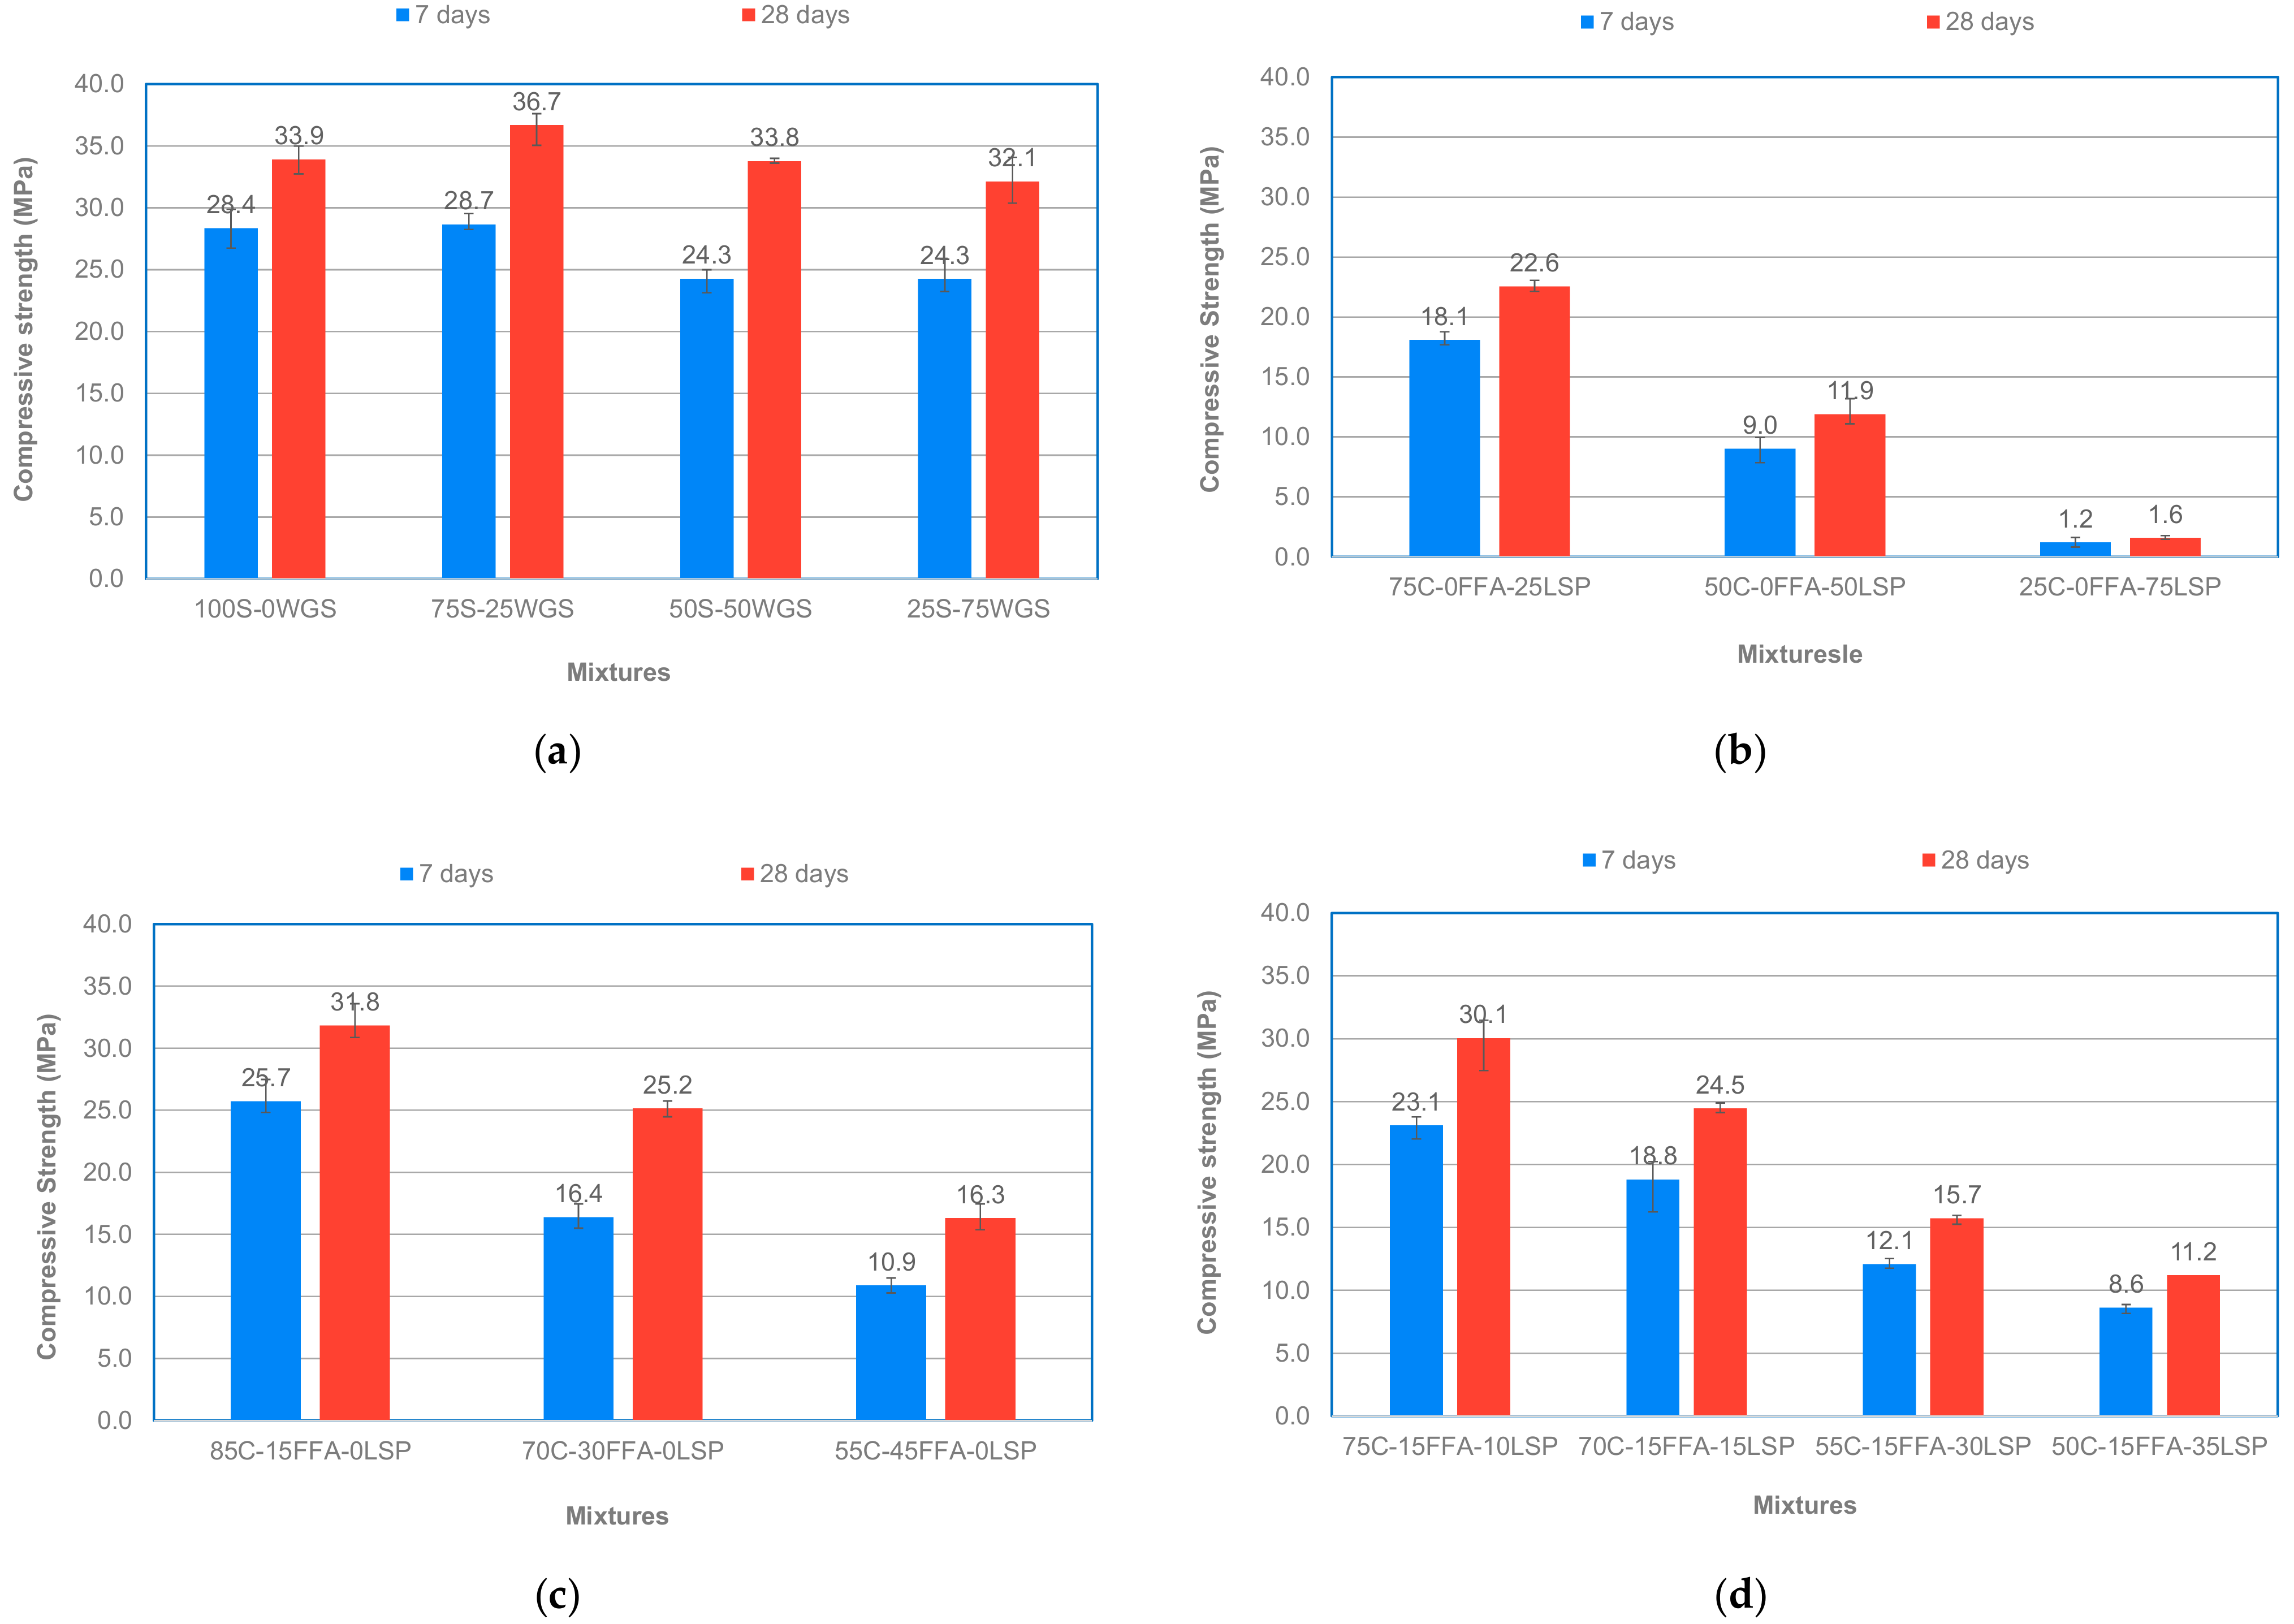
3.1. Compressive Strength Development

Compressive strength development of all moist-cured mixtures is illustrated in Figure 5. As expected, the compressive strength of the mixture increased over curing time. Approximately a 30% increase in the 28-day compressive strength was obtained with the comparison of 7-day strength regardless of the mixture type.
According to Figure 5a, replacing normal sand with a certain amount of WGS increased the strength. For instance, when 25% of WGS was added to the mixture, the 28-day strength of the mortar mixture was increased from 33.9 MPa up to 36.7 MPa. However, the replacement of normal sand with a high amount of WGS lowered the compressive strength of the mixture. The mixtures containing 50% and 75% of WGS had 33.8 and 32.1 MPa compressive strength at 28-day, respectively. The decrease in the compressive strength of the mixture containing the large amount of WGS may be attributed to the poorly bonded mortar matrix that was developed at the Interfacial Transition Zone (ITZ) between the crushed WGS particles and cement paste. It should be noted that the smooth surface and weak angular-shaped edges of the WGS particles cause the weaker bond and poor adhesion at the ITZ, consequently resulting in a lower compressive strength [30].
For the mixtures containing a fixed amount of 75% sand and 25% WGS, the use of LSP and FFA as a substitute for cement in the mortar mixture led to the reduction in the compressive strength (Figure 5b,c). Moreover, with the increase in LSP and FFA contents, the compressive strength of mortar mixtures decreased. For example, the mortar mixtures containing 25% LSP and 15% FFA as cement replacement achieved a 28-day compressive strength of 22.6 MPa and 31.8 MPa, respectively, compared to the initial 36.7 MPa for the mixture not having LSP and FFA. Interestingly, the mixtures containing 50% LSP and 75% LSP yielded in the 28-day compressive strength of 11.9 MPa (3 times dropping in the compressive strength) and led to only the compressive strength of 1.6 MPa where the cube samples were squeezed under a small load. The dilution effect of LSP can explain these results. The incorporation of a large amount of limestone powder mainly initiates the dilution effect of LSP that decreases the rapid formation of hydration products and reduces the compressive strength of the mixture as a result [31].
Finally, ternary mixtures consisting of both FFA and LSP provided higher or comparable strength compared to only LSP or FFA addition (Figure 5d). For example, the 28-day compressive strength in [15% FFA + 10% LSP] and [15% FFA + 15% LSP] mixtures were 30.1 MPa and 24.5 MPa, while the mixture having only 25% LSP and 30% FFA had the strength of 22.6 MPa and 25.2 MPa, respectively. Therefore, it is concluded that the combined use of FFA and LSP provides a synergistic effect on the compressive strength development of the mortar mixture.

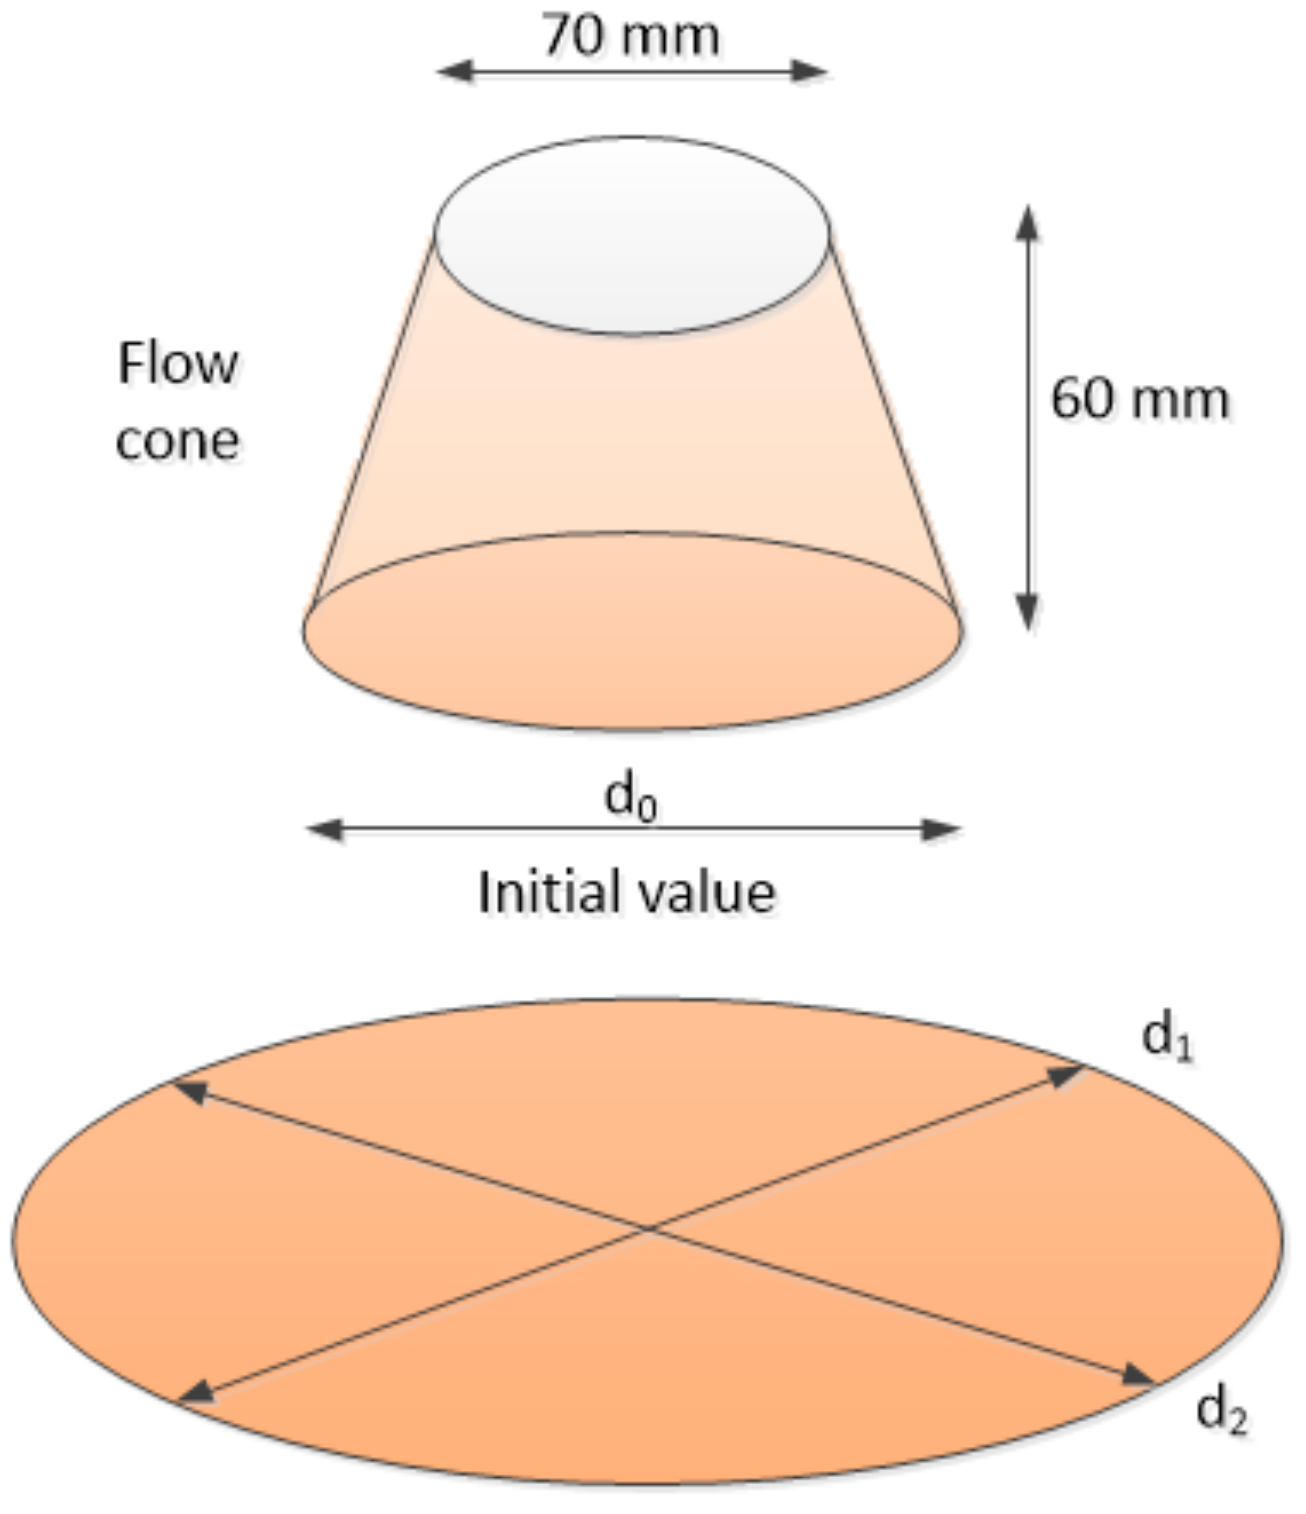
3.2. Relationship between Relative Flowability and 7-Day Compressive Strength

Figure 6 presents the relative flowability and 7-day compressive strength of the mixtures. The Гm for all mixtures was ranged from 1.64 to 4.56 variously. The standard deviation of Гm for each mixture was ranged from 0.01 to 0.67. For control mixtures, the replacement of normal sand with WGS up to 50% did not show much difference in the flowability (the average Гm = 4.48), whereas the 75% replacement with WGS dropped the flowability (Гm = 3.94). For the mixtures containing LSP and FFA, the small amount of cement replacement with LSP and FFA did not influence the flowability. Interestingly, as LSP and FFA’s replacement level increases, the flowability decreases regardless of the type of materials. This result may be attributed to the irregular shape of large particles of LSP and coarse particles of FFA. In general, the use of fly ash in the cementitious system leads to the mixture’s improved flowability due to its spherical particle shape [32]. However, the obtained test results were different from the typical flowability of the mixture containing fly ash. It should be noted that the LSP used in this research was obtained after crushing, milling, and sieving limestone, resulting in angular shapes. The fly ash also is a low-quality one that contains more angular shapes and coarse particles, as shown in Figure 3.
The Гm value of the mixture containing LSP at the 15% fixed amount of FFA also had the same trend: the more LSP replacement the mixture has, the lower flowability the mixture gets. Moreover, it seems that the FFA has a much more significant influence on flowability than LSP. For example, the Γm values of mixtures containing 30% FFA and 45% FFA were 2.91 and 1.64, respectively, whereas those of mixtures containing 15% FFA + 15% LSP and 15% FFA + 30% LSP were 3.05 and 3.10. Because the mixture containing only FFA at the same replacement level had low Γm values, the FFA seems to dominate the mixtures’ flowability. Again, it should be noted that the relatively coarse size of FFA was used in this study.
Figure 6 also shows the relationship between relative flowability and 7-day compressive strength. In general, the 7-day compressive strength of mixtures decreases as the Γm value of the mixtures decreases. This result contributes to less reactive cementitious characteristics of LSP and FFA than cement. It is well documented that the replacement of cement with SCMs such as fly ash, especially in high volumes, reduces the rate of early strength development of cementitious systems due to the lower hydration process than cement [33]. Moreover, Lin et al. [34] reported that the replacement of cement with a higher amount of LSP (more than 10%) had a negative effect on the early age strength development of the mixture because LSP hinders the formation of hydration products required to fill the capillary pores and gel pores, resulting in a microstructure of lower density. Therefore, incorporating a high amount of coarse FFA and LSP into the cement system reduces flowability by consuming more water at an early age, and then eventually inducing greater porosity and looser microstructures leading to lower compressive strength.

3.3. Expansion Characteristics of Mortar Mixtures

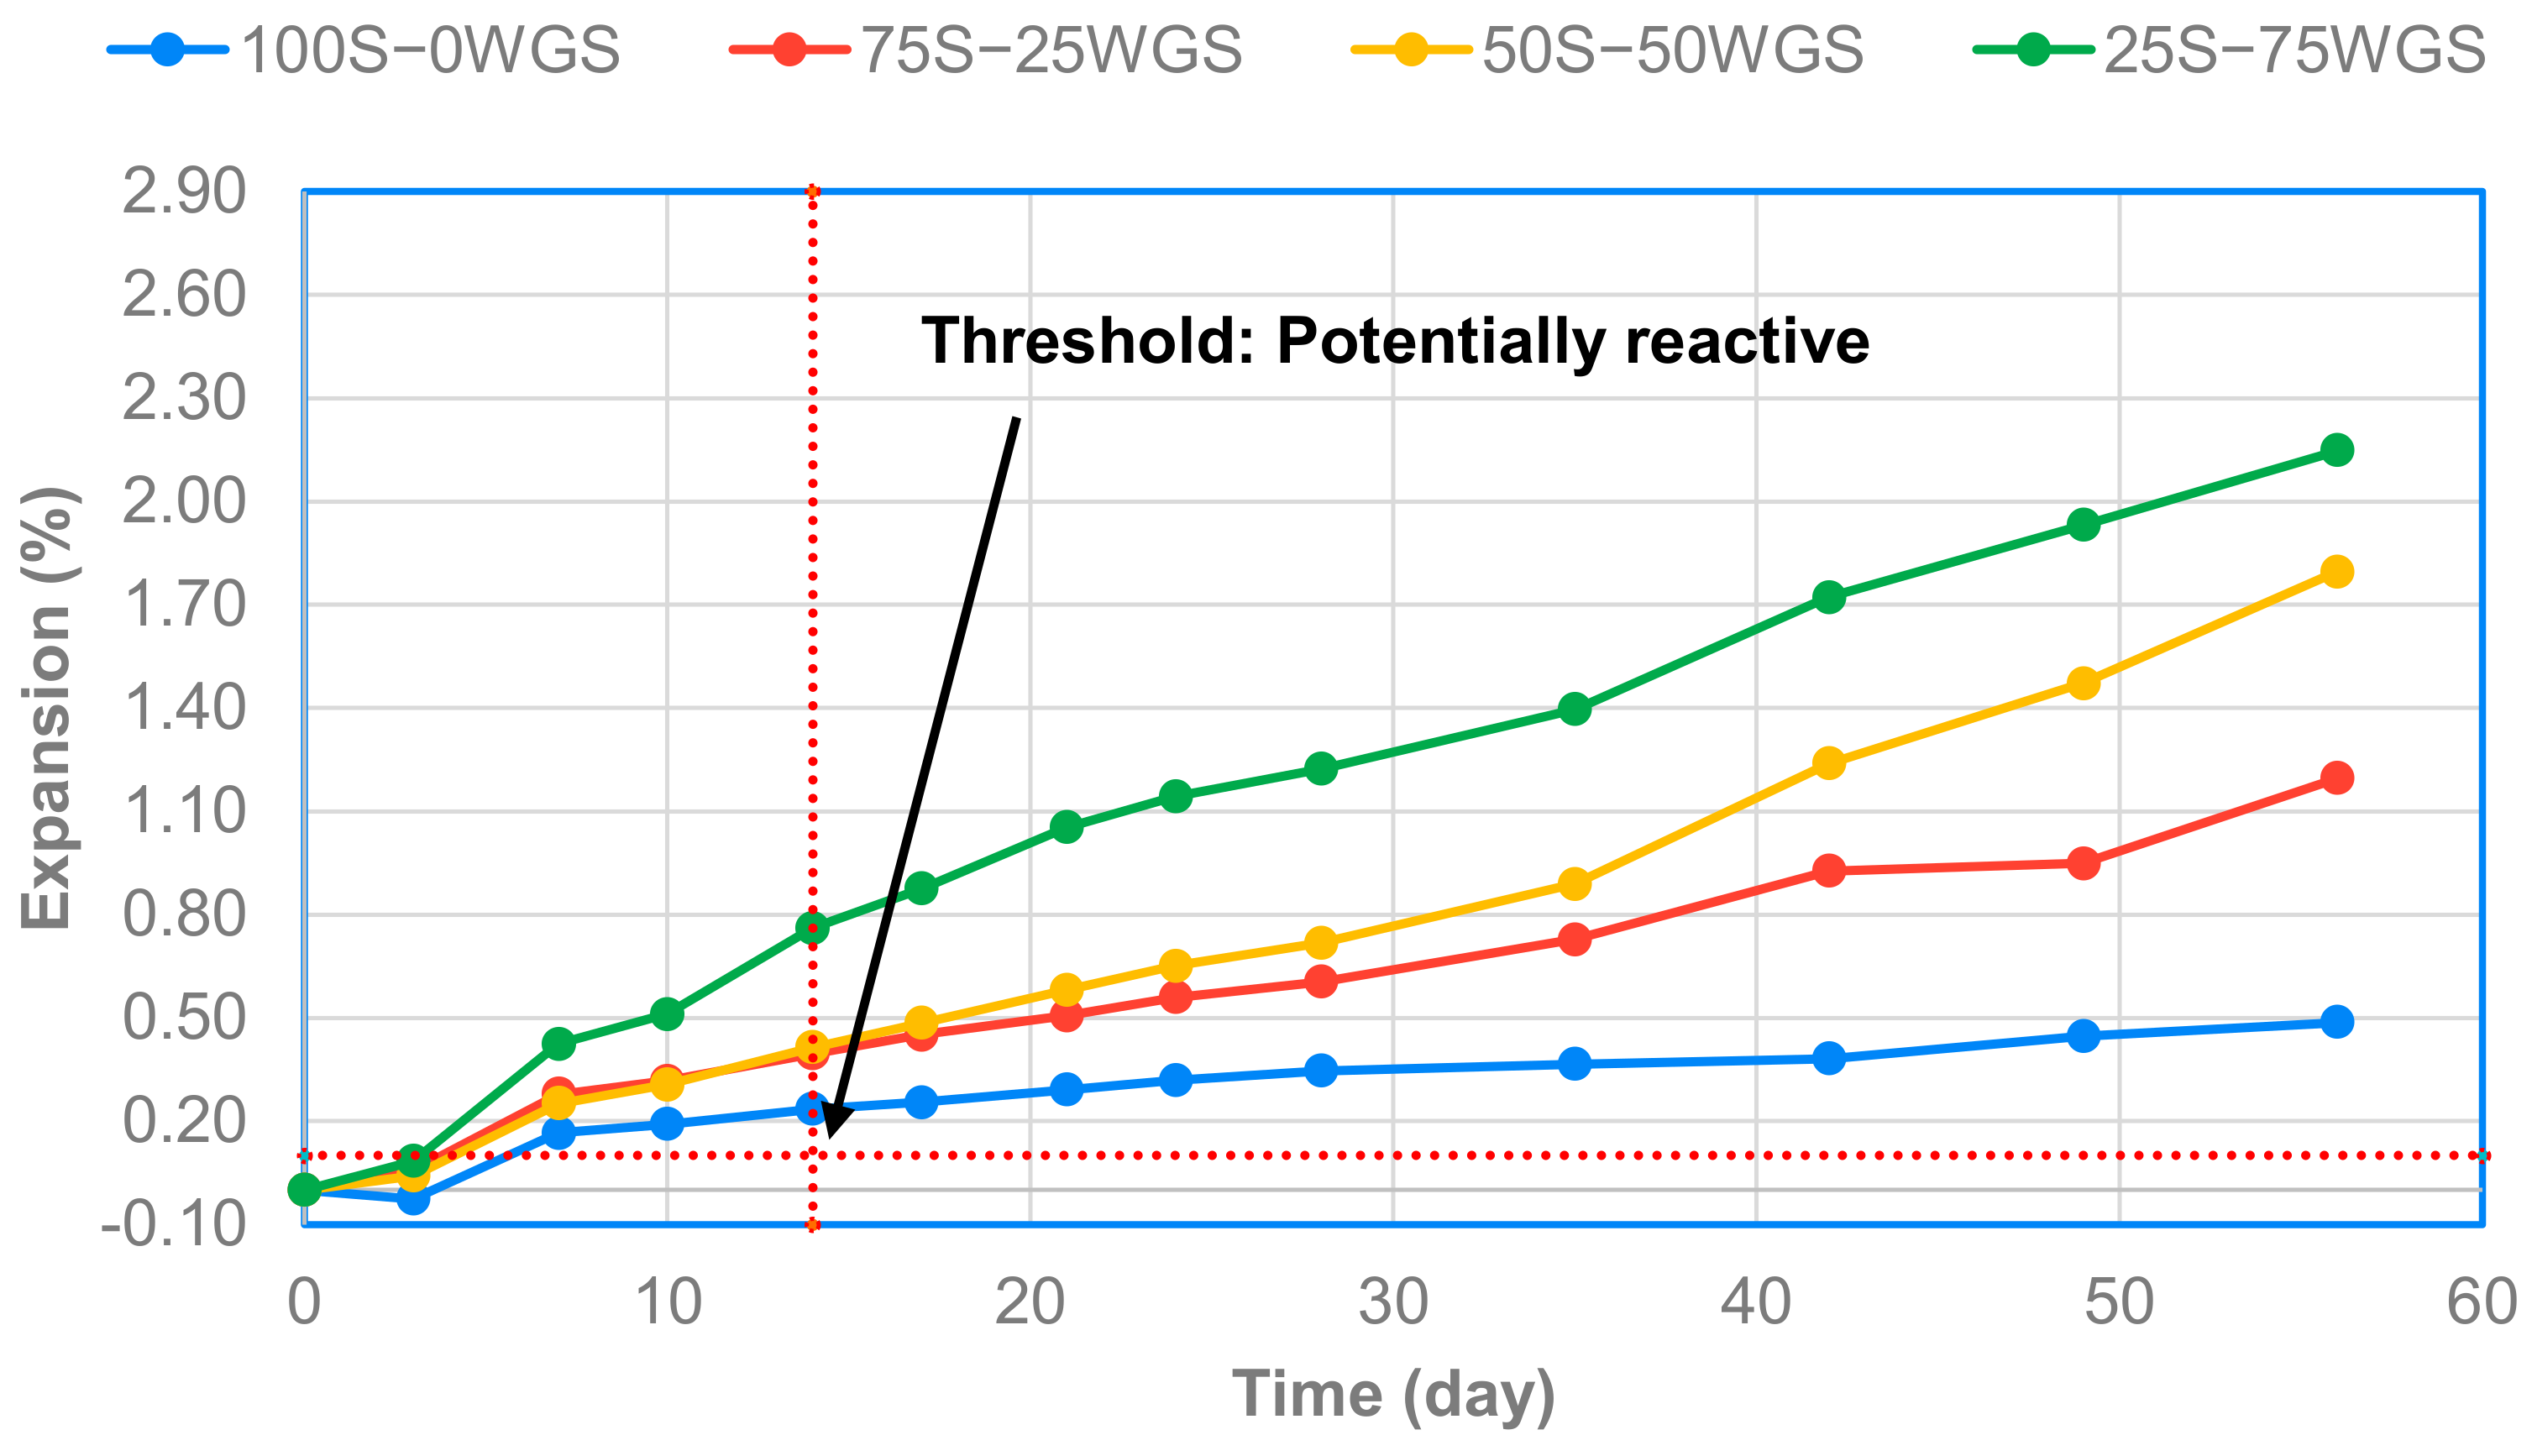
3.3.1. Expansion Characteristics of Control Mixtures

Figure 7 presents the ASR expansion characteristics of control mixtures. The expansion of the control mixtures immersed in 1N NaOH solution at 80 °C was low up to 3-day. However, it exceeded 0.1% after 7-day, which falls in the potentially reactive aggregate criterion (14-day expansion) according to the C 1260/1567 regardless of reactive river sand and sand-WGS combination. For example, the expansion of the mixture containing siliceous reactive sand was 0.24% at 14-day whereas the expansion of the mixture having the combination of 25% sand and 75% WGS was 0.76% at the same age.
The mixture containing WGS showed higher expansion than the mixture made of only reactive sand. Moreover, as the WGS content was increased from 25% to 75%, the expansion of the mixtures was also increased consistently. For instance, the expansion of the mixture containing 25% WGS was 0.40% at 14-day while the mixture incorporating 75% WGS was 0.76% at the same age. This result matches with the previous finding conducted by Rajabipour et al. [35,36]. Since the large quantity of WGS contains more reactive amorphous silica content, more microcracks occur at the interface between cement and aggregates due to the ASR gel formation.
Interestingly, when the test period was extended from 14 days to 56 days, a significant expansion occurred steadily irrespective of river sand and WGS. The 56-day expansion of mixtures was ranged from 0.49% to 2.15%. Especially, the rate of expansion in the mixture containing WGS was increased drastically. For the mortar mixtures produced with 25% GWS and 75% WGS, the 56-day expansion values were 1.20% and 2.15%, respectively. These values are 202% and 182% higher than the expansion achieved at 14-day, respectively. Again, the continuous increase in the expansion for the mixtures containing WGS can be attributed to the increasing amount of reactive amorphous silica content, eventually increasing ASR gel.
Figure 8 presents expanded and cracked samples of control mixtures after a 56-day ASR test and SEM images and energy-dispersive spectroscopy (EDS) analysis of the mixture containing 75% sand and 25% WGS as a representative sample. EDS spot analysis was conducted to identify the chemical composition of ASR gel products. As shown in Figure 8a, all mixtures containing reactive river sand or the combined reactive sand and WGS showed many cracks on the surface of each mixture. The SEM micrographs (Figure 8b,c) present that a lot of ASR gels formed on the surface of WGS, which are more fluffy and thin-skinned reaction products. Moreover, some cracks are filled with ASR gels. These ASR gels absorb much water, resulting in volume expansion and more crack propagation. The EDS analysis confirms the formation of ASR gel in the mixture containing WGS (Figure 8d).

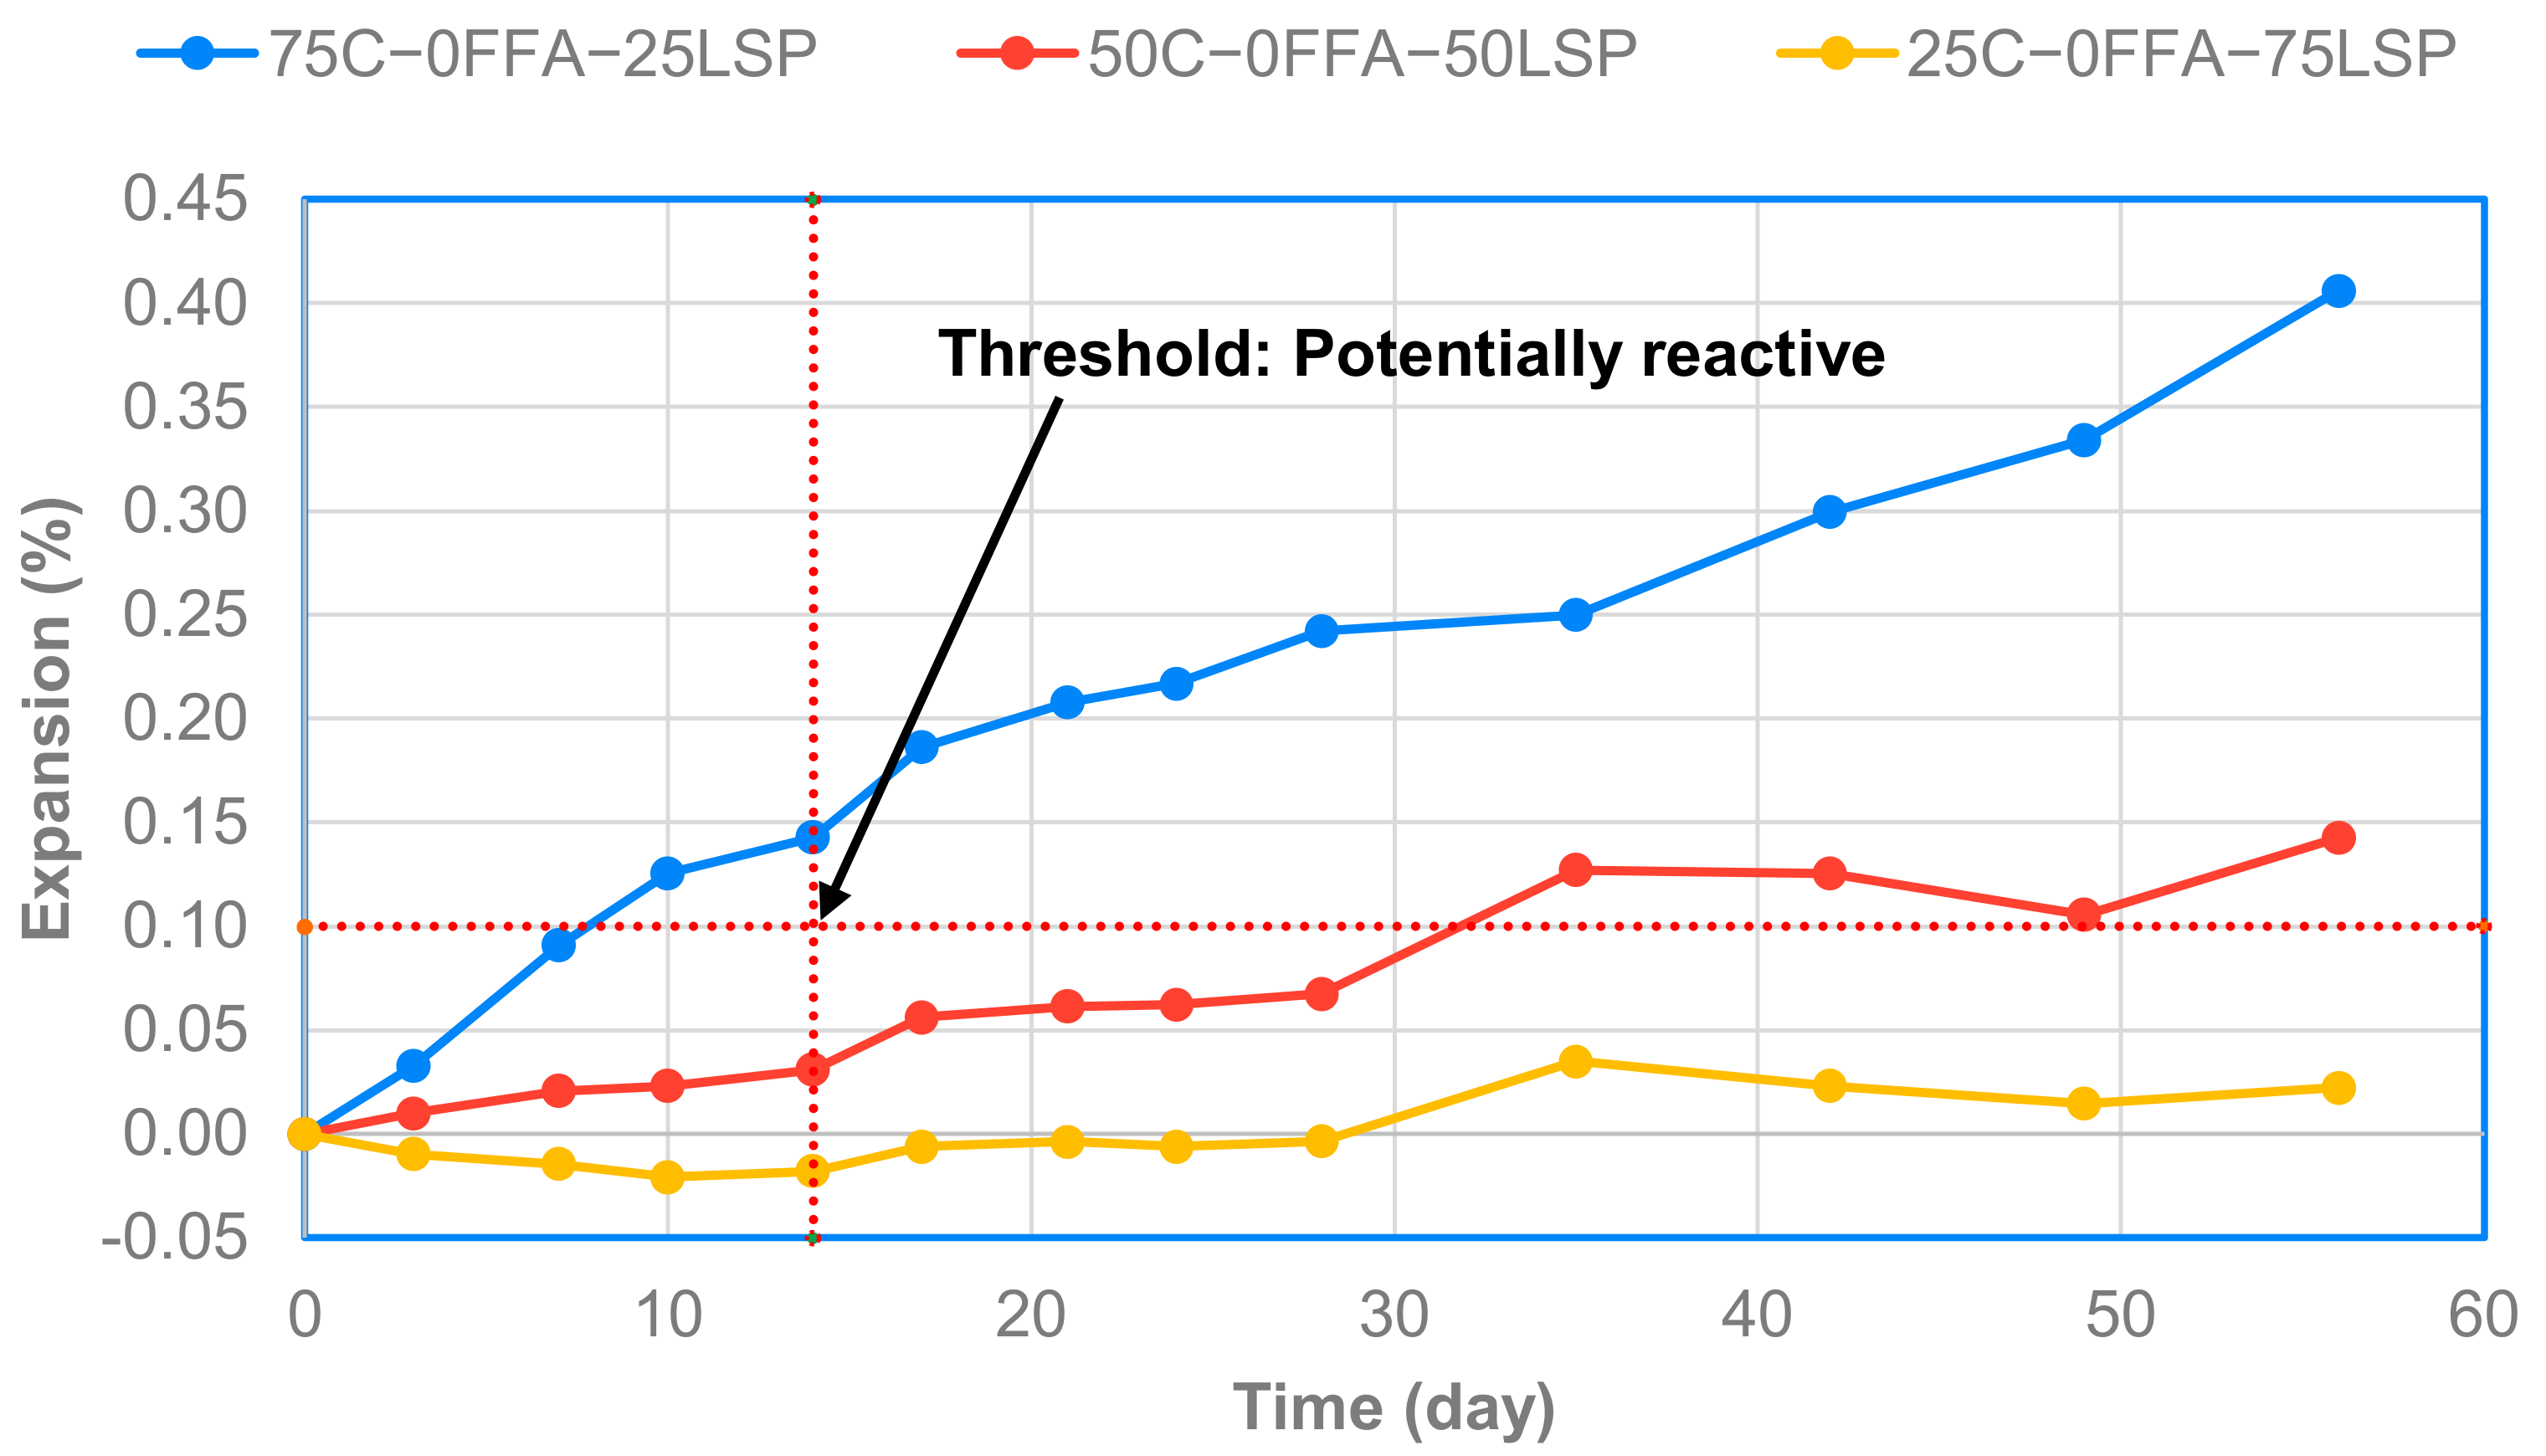
3.3.2. Expansion Characteristics of Binary LSP Mixtures

Figure 9 shows ASR expansion characteristics as a function of LSP replacement at a fixed amount of aggregate (75% reactive sand and 25% WGS). Meanwhile, the expansion of mortar bars incorporating 25% LSP by cement mass was 0.14% at 14 days. Though replacing cement with 25% LSP contributed to a more than two-times reduction in the expansion compared to the control specimen (0.40% expansion for the mixture having 75% sand and 25% WGS), it still exceeded the potentially reactive threshold value. When the test period was extended to 56 days, a significant expansion was taken between 14 and 56 days. The expansion values at 28-day and 56 days were 0.24% and 0.41%, respectively.
When the replacement rate of LSP by mass of cement was increased to 50% and 75%, a distinct reduction in the expansion occurred, resulting in below 0.1% expansion at 14 days. Surprisingly, the mixture containing 75% LSP was shrunk up to 14-day initially. The expansion then started but was negligible even at 28-day. It is not clear why this mixture has a very little expansion and shrinkage trend at an early age, but the mitigation of ASR expansion by the addition of LSP can be explained as follows: when LSP is finer than cement particles and replace cement partially, it works as calcium silicate hydrate (C-S-H) nucleation and growth-inducing agent. As a result, the finer LSP accelerates the degree of hydration and increases the hydration products. Therefore, incorporating LSP increases the autogenous shrinkage at an early age [15]. It should be noted that the LSP passed through no. 100 sieve (150 μm) was used in this study, 50% of LSP materials have a size of 15.4 μm, and 58% of LSP has smaller particle sizes than OPC.
However, when the test period was extended up to 56 days, the expansion for the 50% LSP mixture increased between 14 and 56 days and reached as much as 0.03 to 0.14%. However, there is very little expansion in the 75% LSP mixture. In fact, when LSP is similar to or coarser than cement particles, it is comparatively inert in the cementitious material system. As a result, the coarse LSP reduces the alkali contents in the mortar mixture since LSP becomes a water barrier and thereby delays the ASR expansion. Moreover, both fine and coarse LSP can fill the macro-and micro-pores so that the dense microstructure inhibits the migration of external alkalis into the mortar mixture and further resists the ASR expansion [18,19,37,38]. It should be stated that the LSP materials used in this study contain both fine and coarse particles.

3.3.3. Expansion Characteristics of Binary FFA Mixtures

Figure 10 illustrates the expansion rate for mortar mixtures containing different FFA contents at a fixed amount of aggregate (75% reactive sand and 25% WGS). The mortar bar containing 15% FFA marginally reached 0.1% at 14-day and 0.31% at 56-day, whereas with 30% FFA and 45% FFA replacement, the expansions of mortar bars were lower than 0.1% at both 14 and 56 days. These results support the previous finding [39] that a minimum of 30% ASTM Class F fly ash is generally required to control deleterious expansion with reactive sand in the C1260/C 1567 tests. For example, a mortar bar with 15% FFA experienced 0.31% expansion at 56-day while the mixtures containing 30% FFA and 45% FFA yielded approximately 0.02% and 0.07% expansions at 56-day, respectively. The reduction in ASR with an increase in FFA content may be linked with (i) the increased alkali binding capacity of the hydration products, (ii) the reduced alkalinity in the pore solution, (iii) a denser microstructure, and (iv) the consumption of calcium hydroxide (CH) due to the pozzolanic reaction by using fly ash regardless of FFA or ASTM Class F fly ash [40]. However, the FFA may have less reactivity to reduce the expansion due to ASR compared to conventional ASTM Class F fly ash because it has coarse size particles and less strength activity [41].

3.3.4. Expansion Characteristics of the Ternary Mixtures

Figure 11 represents the expansion behavior of mortar bars containing four different LSP contents when combined at a replacement level of 15% FFA. The expansion of mortar bars incorporating 15% FFA-10% LSP and 15% FFA-15% LSP was below 0.1% at 14-day, but they expanded rapidly up to 56-day and had 0.22 % and 0.18% expansions, respectively. This result confirms that a ternary mortar mixture with the low replacement of SCMs is ineffective in reducing ASR expansion [18]. However, the addition of a relatively large amount of LSP reduced expansion significantly. The mortar bars containing 30% LSP and 35% LSP along with the fixed 15% FFA content had 0.06% and 0.01% expansions at 56-day, respectively.
SEM images and EDS analysis of mortar mixture containing 15% off-ASTM Class FFA and 30% LSP after 56-day ASR test are illustrated in Figure 12. Unlike the mixture containing 75% sand and 25% WGS only, there was no ASR gel on the surface of WGS. Instead of ASE gel, CH layered crystals were observed on the surface of the mortar mixture. Figure 12c shows that many C-S-H gels or calcium aluminosilicate hydrate (C-A-S-H) gels covered the surface of WGS. This is the main difference between the control mixture and the mortar mixture containing FFA and LSP. Adding FFA and LSP leads to the decrease in size and the amount of CH by consuming CH due to the pozzolanic reaction involving glass grain [42,43]. The pozzolanic reaction induces the binding of alkalis in the mortar mixture, making it unavailable for ASR on the surface of WGS. The EDS analysis confirms the formation of C-S-H or C-A-S-H in the mixture containing WGS (Figure 12d).

3.4. Synergistic Effect of the Ternary Mixtures

Figure 13 shows the synergistic effect of combined off-ASTM Class FFA and LSP mixtures on reducing mortar bar expansion at 14, 28, and 56 days. The percentage of reduction in expansion of selected mortar bars containing various LSP contents (10%, 15%, 30%, and 35%) at a fixed 15% FFA was compared to binary mortar mixtures with the same amount of SCM. The reduction in the expansion of mortar mixtures was calculated using the following Equation (3).
R exp % = ε c o n t r o l ε S C M ε c o n t r o l × 100
where Rexp = a reduction percentage in the expansion of the mortar bar, εcontrol = the expansion of the control mortar bar, and εSCM = the expansion of the mortar bar containing SCMs.
The reduction effect in the expansion of cementitious materials was varied with SCM type and amount of replacement. For combination mixtures, the reduction in expansion of mortar bar containing 15% FFA and 10% LSP was approximately 85.5%, 76.6%, and 81.3% at 14, 28, and 56 days. In contrast, mortar bars containing only 25% LSP were 63.9%, 60.0%, and 66.1% at all three ages, respectively. Though this ternary mixture has a higher reduction percentage than a binary mixture, ternary mixtures exceeded the threshold value of potentially reactive aggregate at both 28 and 56 days, not 14 days. However, the binary mixture with the same or less total amount of the SCM (72C-0FFA-25LSP or 85C-15FFA-0LSP) exceeded the threshold value of potentially reactive aggregate at all ages, as shown in the Figure 9 and Figure 10.
When the ternary mixture incorporating 15% FFA and 15% LSP was compared to the binary mixture incorporating only 30% FFA, the binary mixture showed a better reduction percentage. These results indicate that the synergistic effect of the ternary mixture is less effective in reducing the ASR expansion when the combinations of low replacement levels of SCM are used.
However, adding a relatively large amount of LSP to the ternary mixture (30% or more by mass of cementitious material) reduced expansion significantly: 56-day expansion values ranged from 0.06% to 0.02% as shown in Figure 11. Additionally, the mortar bar containing 15% FFA and 30% LSP has a higher reduction percentage (96.3%, 93.4%, and 95.2% at 14, 28, and 56 days) than 45% FFA specimen (94.9%, 91.7%, and 94.0% at 14, 28, and 56 days) regardless of age. The ternary mixture having the highest replacement level of LSP (15% FFA-35% LPS) produced the same result. This result indicates that there possibly exists a threshold beyond which the resistance mechanism becomes effective, and this threshold can be expected to vary from one FFA to another or one LSP to another.
From test results, therefore, it can be concluded that at 15% fixed coarse-size FFA content, the addition of LSP led to the ASR inhibition and its effect increased as the LSP content increased. Moreover, the combined use of FFA-LSP became more effective than the binary mixture of FFA or LSP to mitigate the ASR of the mixture. The mechanism of ASR mitigation of the ternary FFA-LSP mixture can be explained as follows. Although off-ASTM Class FFA cannot provide a pore refinement effect reducing permeability and diffusivity of the mixture due to its relatively coarse particle size, FFA can reduce the pore solution’s alkalinity by replacing cement with SCMs and pozzolanic reaction. Otherwise, because LSP does not include dissolved alkalis, it can reduce the alkali content of the mixture by replacing cement. Mainly coarse particle size LSP and the use of a large amount of LSP provide nucleation and dilution effects. Moreover, finer LSP can fill the voids of the mortar mixture, reduce the porosity, and reduce the permeability of the mixture (filler effect) [19,44]. It should be noted that the average D10, D50, and D90 values of LSP are 1.72 μm, 15.4 μm, and 140.7 μm, which contain both finer and coarser size particles. Therefore, it is conjectured that the increased resistance of ternary mixtures may be a result of pore structure refinements, the increased resistance to the diffusion of alkalis, the overall reduced possibility of ASR gel formation, and ASR gel built up inside pores as stated earlier. However, further testing is needed to elucidate the mechanisms behind the ASR resistance of the off-ASTM Class FFA and LSP combination.
Table 4 summarizes expansion characteristics, percentage of expansion reduction, and strength activity index (SAI) of binary and ternary mixtures. Table 4 also shows the threshold of expansion and the minimum strength activity index required in this study. The binary mixture containing limestone powder, 25C-0FFA-75LSP, satisfied the expansion criterion at all ages, but the SAI was deficient. The binary mixture containing off-ASTM Class FFA, 70C-30FFA-0LSP, met the criteria at both expansion and SAI, whereas 55C-45FFA-0LSP did not satisfy the 7-day SAI. For ternary mixtures, the mixture 55C-15FFA-30LSP also met the criteria at both expansion and SAI, while the other mixtures did not satisfy either expansion threshold or SAI. Therefore, the binary mixture 70C-30FFA-0LSP and ternary mixture 75C-15FFA-30LSP can be the optimum mixture to control ASR and obtain enough strength in this study.

4. Conclusions

The experimental results of the ASTM C 1260/C 1567 standard test on ASR expansion for FFA-LSP combination reveal that the appropriate combination of FFA-LSP provides a favorable effect on reducing the expansion of mortar mixtures containing WGS even at a testing period of 56-day. From the results, the following conclusions are drawn:
  • When the reactive river sand and waste glass sand are used together, the combination of 75S-25WGS had the lowest expansion value up to 56 days.
  • As the ratio of LSP and FFA as a replacement of OPC increases, the compressive strength of the mortar mixture decreases.
  • At 15% fixed FFA content, the addition of LSP led to lower compressive strength, and the reduction in compressive strength increased as the LSP content increased.
  • When a single FFA or LSP was used, a relatively replacement of OPC with FFA (30 or 45%) or LSP (75%) was required to control ASR expansion below the ASTM threshold value of 0.1% when the test period was extended to 56 days.
  • The shortcoming of FFA or LSP needing high levels of replacement rate to control ASR expansion could be compensated by the ternary mixture with the combination of FFA and LSP.
  • Ternary mortar mixture with 30% or 35% LSP at 15% fixed FFA content was more effective than other mixtures in inhibiting ASR expansion.
  • Considering both the ASR mitigation effect and compressive strength development, the binary mixture 70C-30FFA-0LSP or ternary mixture 55C-15FFA-30LSP seems to be the best mixture in this study.
In this study, all test results were obtained from mortar mixtures containing WGS mixed with clean and green glasses in the ratio of 8 to 2 by mass and specific sizes of LSP and FFA. However, previous research results conducted by other researchers indicate that the ASR expansion of mortar mixtures containing WGS is influenced by glass content, color, and particle size. Moreover, it is known that the particle size of LSP and SCMs also influences the ASR expansion and mechanical properties of mortar mixtures. This study noted the negative effect of compressive strength reduction as increasing the coarse-size off-ASTM Class FFA and LSP content. Moreover, the ASR expansion test in this study was conducted at the fixed mixture combined with 75% river sand and 25% WGS for various combinations of FFA and LSP. It may be valuable to perform further testing with increased WGS content. Therefore, it is recommended for future testing that the application of the off-ASTM Class FFA-LSP combination for potential use in mitigating ASR expansion for mixtures containing WGS should be evaluated considering the parameters stated above. To optimize the maximum usage of WGS, FFA, and LSP, the design of experiments (DOE) such as the Taguchi method and response surface methodology may be considered for future tests.

Author Contributions

Conceptualization, C.-S.S. and D.Z.; Data curation, A.T., R.S. and N.K.; Formal analysis, C.-S.S., A.T., R.S. and N.K.; Funding acquisition, D.Z. and J.R.K.; Investigation, C.-S.S., A.T., R.S. and N.K.; Methodology, C.-S.S., A.T., R.S. and D.Z.; Project administration, J.R.K.; Resources, C.-S.S.; Supervision, C.-S.S., D.Z. and J.R.K.; Visualization, C.-S.S., A.T., R.S. and N.K.; Writing–original draft, C.-S.S.; Writing–review & editing, C.-S.S., D.Z. and J.R.K. All authors have read and agreed to the published version of the manuscript.

Funding

Nazarbayev University funded this research under Faculty Development Competitive Research Grant No. 021220FD2151 and No. SOE2017004. The authors are grateful for this support. Any opinions, findings, conclusions, or recommendations expressed in this material are those of the author(s) and do not necessarily reflect the views of Nazarbayev University.

Institutional Review Board Statement

Not applicable.

Informed Consent Statement

Not applicable.

Data Availability Statement

The data used to support the findings of this study are included in the article. The original details of the data presented in this study are available on request from the corresponding author.

Conflicts of Interest

The authors declare no conflict of interest. The funders had no role in the design of the study, in the collection, analyses, or interpretation of data, in the writing of the manuscript, or in the decision to publish the results.

References

  1. Mukangali, I.; Shon, C.S.; Kryzhanovskiy, K.; Zhang, D.C.; Kim, J.R. Effects of waste soda-lime glass sand and glass fiber on physical and mechanical properties of none-autoclaved aerated concrete. In Proceedings of the 9th International Conference on Material Science and Engineering Technology (ICMSET 2020), Kyoto, Japan, 9–12 October 2020. [Google Scholar] [CrossRef]
  2. OECD. Reform of the Mining Sector in Kazakhstan: Investment, Sustainability, Competitiveness, Global Relations Eurasia Competitiveness Programme. 2018. Available online: https://www.oecd.org/eurasia/countries/Kazakhstan_Mining_report_ENG.pdf (accessed on 10 December 2021).
  3. EY. Kazakhstan Mining Tax Guide, Ernst & Young Kazakhstan LLP—KZ. 2021. Available online: https://assets.ey.com/content/dam/ey-sites/ey-com/ru_kz/topics/mining-metals/ey-kazakhstan-mining-tax-guide_2021.pdf (accessed on 10 November 2021).
  4. International Energy Agency. Kazakhstan Energy Profile. 2021. Available online: https://iea.blob.core.windows.net/assets/a398cfb3-4f0b-4b8f-b82e-47b8d7b93d52/KazakhstanEnergyProfile.pdf (accessed on 10 December 2021).
  5. Massalimov, I.; Massalimov, B.; Akhmetshin, B.; Urakaev, F.; Burkitbaev, M. Conversion of limestone-limestone mining waste by impregnation with polysulfide solutions. Nanotechnologies Constr. A Sci. Internet-J. 2020, 12, 77–83. [Google Scholar] [CrossRef]
  6. Du, H.; Tan, K.H. Waste Glass Powder as Cement Replacement in Concrete. J. Adv. Concr. Technol. 2014, 12, 468–477. [Google Scholar] [CrossRef] [Green Version]
  7. Carsana, M.; Frassoni, M.; Bertolini, L. Comparison of ground waste glass with other supplementary cementitious materials. Cem. Concr. Compos. 2013, 45, 39–45. [Google Scholar] [CrossRef]
  8. Aliabdo, A.A.; Abd Elmoaty, A.E.M.; Aboshama, A.Y. Utilization of waste glass powder in the production of cement and concrete. Constr. Build. Mater. 2016, 124, 866–877. [Google Scholar] [CrossRef]
  9. AlMesfer, N.; Ingham, J. Effect of Waste Glass on the Properties of Concrete. J. Mater. Civ. Eng. 2014, 26, 06014022. [Google Scholar] [CrossRef]
  10. Serpa, D.; Silva, A.S.; de Brito, J.; Pontes, J.; Soares, D. ASR of mortars containing glass. Constr. Build. Mater. 2013, 47, 489–495. [Google Scholar] [CrossRef]
  11. Du, H.; Tan, K.H. Use of waste glass as sand in mortar: Part II—Alkali–silica reaction and mitigation methods. Cem. Concr. Compos. 2013, 35, 118–126. [Google Scholar] [CrossRef]
  12. Lee, G.; Ling, T.-C.; Wong, Y.-L.; Poon, C.-S. Effects of crushed glass cullet sizes, casting methods and pozzolanic materials on ASR of concrete blocks. Constr. Build. Mater. 2011, 25, 2611–2618. [Google Scholar] [CrossRef]
  13. Saccani, A.; Bignozzi, M.C. ASR expansion behavior of recycled glass fine aggregates in concrete. Cem. Concr. Res. 2010, 40, 531–536. [Google Scholar] [CrossRef]
  14. Du, H.; Tan, K.H. Effect of particle size on alkali–silica reaction in recycled glass mortars. Constr. Build. Mater. 2014, 66, 275–285. [Google Scholar] [CrossRef]
  15. ASTM C1260-14. Standard Test Method for Potential Alkali Reactivity of Aggregates (Mortar-Bar Method); ASTM In-ternational: West Conshohocken, PA, USA, 2014. [Google Scholar]
  16. Xie, Z.; Xiang, W.; Xi, Y. ASR Potentials of Glass Aggregates in Water-Glass Activated Fly Ash and Portland Cement Mortars. J. Mater. Civ. Eng. 2003, 15, 67–74. [Google Scholar] [CrossRef]
  17. Barros, S.V.A.; Marciano, J.E.A.; Ferreira, H.C.; Menezes, R.R.; Neves, G.A. Addition of quartzite residues on mortars: Analysis of the alkali aggregate reaction and the mechanical behavior. Constr. Build. Mater. 2016, 118, 344–351. [Google Scholar] [CrossRef]
  18. Turk, K.; Kina, C.; Bagdiken, M. Use of binary and ternary cementitious blends of F-Class fly-ash and limestone powder to mitigate alkali-silica reaction risk. Constr. Build. Mater. 2017, 151, 422–427. [Google Scholar] [CrossRef]
  19. Wang, D.; Shi, C.; Farzadnia, N.; Shi, Z.; Jia, H. A review on effects of limestone powder on the properties of concrete. Constr. Build. Mater. 2018, 192, 153–166. [Google Scholar] [CrossRef]
  20. ASTM C1567-13. Standard Test Method for Determining the Potential Alkali-Silica Reactivity of Combinations of Ce-mentitious Materials and Aggregate (Accelerated Mortar-Bar Method); ASTM International: West Conshohocken, PA, USA, 2013. [Google Scholar]
  21. ASTM C441/C441M-17. Standard Test Method for Effectiveness of Pozzolans or Ground Blast-Furnace Slag in Preventing Excessive Expansion of Concrete Due to the Alkali-Silica Reaction; ASTM International: West Conshohocken, PA, USA, 2017. [Google Scholar]
  22. ASTM C1293-20. Standard Test Method for Determination of Length Change of Concrete Due to Alkali-Silica Reaction; ASTM International: West Conshohocken, PA, USA, 2020. [Google Scholar]
  23. Wang, H.; Wu, D.; Mei, Z. Effect of fly ash and limestone powder on inhibiting alkali aggregate reaction of concrete. Constr. Build. Mater. 2019, 210, 620–626. [Google Scholar] [CrossRef]
  24. Chung, S.-Y.; Abd Elrahman, M.; Sikora, P.; Rucinska, T.; Horszczaruk, E.; Stephan, D. Evaluation of the Effects of Crushed and Expanded Waste Glass Aggregates on the Material Properties of Lightweight Concrete Using Image-Based Approaches. Materials 2017, 10, 1354. [Google Scholar] [CrossRef] [PubMed] [Green Version]
  25. Małek, M.; Łasica, W.; Jackowski, M.; Kadela, M. Effect of Waste Glass Addition as a Replacement for Fine Aggregate on Properties of Mortar. Materials 2020, 13, 3189. [Google Scholar] [CrossRef]
  26. ASTM C109/C109M-20b. Standard Test Method for Compressive Strength of Hydraulic Cement Mortars; ASTM International: West Conshohocken, PA, USA, 2020. [Google Scholar]
  27. ASTM C1437-13. Standard Test Method for Flow of Hydraulic Cement Mortar; ASTM International: West Conshohocken, PA, USA, 2020. [Google Scholar]
  28. Shon, C.-S.; Kim, Y.-S. Evaluation of West Texas natural zeolite as an alternative of ASTM Class F fly ash. Constr. Build. Mater. 2013, 47, 389–396. [Google Scholar] [CrossRef]
  29. ASTM C490/C490M-17. Standard Practice for Use of Apparatus for the Determination of Length Change of Hardened Cement Paste, Mortar, and Concrete; ASTM International: West Conshohocken, PA, USA, 2017. [Google Scholar]
  30. Olofinnade, O.M.; Ede, A.N.; Ndambuki, J.M.; Ngene, B.U.; Akinwumi, I.I.; Ofuyatan, O. Strength and microstructure of eco-concrete produced using waste glass as partial and complete replacement for sand. Cogent Eng. 2018, 5. [Google Scholar] [CrossRef]
  31. Wang, D.; Shi, C.; Farzadnia, N.; Jia, H.; Zeng, R.; Wu, Y.; Lao, L. A quantitative study on physical and chemical effects of limestone powder on properties of cement pastes. Constr. Build. Mater. 2019, 204, 58–69. [Google Scholar] [CrossRef]
  32. Shon, C.-S.; Abdigaliyev, A.; Bagitova, S.; Chung, C.-W.; Kim, D. Determination of air-void system and modified frost resistance number for freeze-thaw resistance evaluation of ternary blended concrete made of ordinary Portland cement/silica fume/class F fly ash. Cold Reg. Sci. Technol. 2018, 155, 127–136. [Google Scholar] [CrossRef]
  33. Marsh, B.K.; Day, R.L. Pozzolanic and cementitious reactions of fly ash in blended cement pastes. Cem. Concr. Res. 1988, 18, 301–310. [Google Scholar] [CrossRef]
  34. Lin, W.-T.; Cheng, A.; Černý, R. Effect of limestone powder on strength and permeability of cementitious mortars. MATEC Web Conf. 2020, 322, 01009. [Google Scholar] [CrossRef]
  35. Rajabipour, F.; Giannini, E.; Dunant, C.; Ideker, J.; Thomas, M.D. Alkali–silica reaction: Current understanding of the reaction mechanisms and the knowledge gaps. Cem. Concr. Res. 2015, 76, 130–146. [Google Scholar] [CrossRef]
  36. Rajabipour, F.; Maraghechi, H.; Fischer, G. Investigating the Alkali-Silica Reaction of Recycled Glass Aggregates in Concrete Materials. J. Mater. Civ. Eng. 2010, 22, 1201–1208. [Google Scholar] [CrossRef]
  37. Chen, C.; Yang, W. Mitigation of Alkali-Silica reaction in mortar with limestone addition and carbonation. In Proceedings of the 3rd Inter-national Conference on Sustainable Construction Materials and Technologies, Kyoto, Japan, 18–21 August 2013. [Google Scholar]
  38. Ouyang, X.; Koleva, D.; Ye, G.; Van Breugel, K. Insights into the mechanisms of nucleation and growth of C–S–H on fillers. Mater. Struct. 2017, 50, 213. [Google Scholar] [CrossRef]
  39. Shon, C.-S.; Zollinger, D.G.; Sarkar, S.L. Evaluation of modified ASTM C 1260 accelerated mortar bar test for alkali–silica reactivity. Cem. Concr. Res. 2002, 32, 1981–1987. [Google Scholar] [CrossRef]
  40. Lee, J.-C.; Jang, B.-K.; Shon, C.-S.; Kim, J.-H.; Chung, C.-W. Potential use of borosilicate glass to make neutron shielding mortar: Enhancement of thermal neutron shielding and strength development and mitigation of alkali-silica reaction. J. Clean. Prod. 2018, 210, 638–645. [Google Scholar] [CrossRef]
  41. Wang, Y.; Burris, L.; Hooton, R.D.; Shearer, C.R.; Suraneni, P. Effects of unconventional fly ashes on cementitious paste properties. Cem. Concr. Compos. 2021, 125, 104291. [Google Scholar] [CrossRef]
  42. Matos, A.M.; Sousa-Coutinho, J. Durability of mortar using waste glass powder as cement replacement. Constr. Build. Mater. 2012, 36, 205–215. [Google Scholar] [CrossRef]
  43. Hou, X.; Struble, L.J.; Kirkpatrick, R. Formation of ASR gel and the roles of C-S-H and portlandite. Cem. Concr. Res. 2004, 34, 1683–1696. [Google Scholar] [CrossRef]
  44. Chen, J.; Kwan, A.; Jiang, Y. Adding limestone fines as cement paste replacement to reduce water permeability and sorptivity of concrete. Constr. Build. Mater. 2014, 56, 87–93. [Google Scholar] [CrossRef]
Figure 1. Siliceous river sand and crushed waste glass sand used in the ASR test.
Sustainability 14 00075 g001
Figure 2. Particle size distribution of OPC, limestone powder, and off-ASTM Class FFA.
Sustainability 14 00075 g002
Figure 3. Scanning electron microscopic images of off-ASTM Class F fly ash and limestone powder. (a) Off-ASTM Class FFA; (b) Limestone powder.
Sustainability 14 00075 g003
Figure 4. Flowability measurement.
Sustainability 14 00075 g004
Figure 5. Compressive strength development. (a) Control mixtures; (b) LSP incorporated mixtures; (c) Class F fly ash incorporated mixtures; (d) Ternary mixtures.
Sustainability 14 00075 g005
Figure 6. Relationship between relative flowability and 7-day compressive strength.
Sustainability 14 00075 g006
Figure 7. ASR expansion characteristics of control mixtures.
Sustainability 14 00075 g007
Figure 8. ASR damaged control mixtures after 56-day ASR test: (a) Group 1-control mixture samples (25S-75WGS sample was selected for SEM); (b) SEM image of mixture containing 25S-75WGS; (c) ASR gels on the surface of WGS; and (d) EDS pattern of ASR gels.
Sustainability 14 00075 g008
Figure 9. ASR expansion characteristics of binary LSP mixtures.
Sustainability 14 00075 g009
Figure 10. ASR expansion characteristics of binary FFA mixtures.
Sustainability 14 00075 g010
Figure 11. ASR expansion characteristics of ternary mixtures.
Sustainability 14 00075 g011
Figure 12. SEM micrographs of ternary mixture after 56-day ASR test: (a) ternary mixture containing 55C-15FFA-30LSP; (b) enlarged SEM image of 55C-15FFA-30LSP mixture; (c) C-S-H or C-A-S-H formation on the surface of WGS; and (d) EDS pattern of C-S-H or C-A-S-H.
Sustainability 14 00075 g012
Figure 13. Reduction in ASR expansion of binary and ternary mixtures.
Sustainability 14 00075 g013
Table 1. Experimental program.
Test AttributeMeasured PropertiesSpecification/ReferencesTest Period
Material
characterization
Chemical compositionASTM C 618/C 311
Particle size distributionMastersizer 3000 using the technique of laser diffraction
Scanning electron microscope (SEM)-MorphologyJSM-IT200(LA)
Basic fresh and hardened propertiesFlowabilityASTM C1437
Compressive strengthASTM C 1097 and 28 days
ASR characteristicsASR expansionASTM C 1260/C 1567Periodically up to 56 day
Table 2. Chemical analyses (weight percentage) and physical properties of cementitious materials.
CompositionOPCOff-ASTM Clsss F
Fly Ash
LSPASTM Clsss F
Fly Ash
SiO221.5549.3415.28
Al2O35.5517.554.22
Fe2O34.7019.0713.75
∑(SiO2 + Al2O3 + Fe2O3)31.8085.9633.25min. 70
CaO65.913.3858.80
MgO1.460.060.26
SO31.900.080.07max. 5
a Na2Oequiv.0.65--
b Na2Oequiv.-1.042.02
Loss on Ignition (LOI)0.490.2-max. 5
Physical properties
c Finenessc 3680--
d Fineness (%) 63 max. 34
Specific gravity3.14--
Pozzolanic activity/cement (7- and 28-d) (%) 57 (7-d)
68 (28-d)
min. 75
Initial set time (min.)150--
Final set time (min.)270--
a Available alkali, expressed as Na2Oe, as per ASTM C 150; b Available alkali, expressed as Na2Oe, as per ASTM C 311; c Blaine fineness (cm2/g); d +325 mesh (+45 μm)
Table 3. Mixture Proportion.
MixtureAggregate Content (%)Cementitious Materials (%)
SandWGSCementFFALSP
100S-0WGS100010000
75S-25WGS752510000
50S-50WGS505010000
25S-75WGS257510000
75C-0FFA-25LSP752575025
50C-0FFA-50LSP752550050
25C-0FFA-75LSP752525075
85C-15FFA-0LSP752585150
70C-30FFA-0LSP752570300
55C-45FFA-0LSP752555450
75C-15FFA-10LSP7525751510
70C-15FFA-15LSP7525701515
55C-15FFA-30LSP7525551530
50C-15FFA-35LSP7525501535
75S-25WGS refers to the mixture that consists of 75% sand, 25% waste glass sand, and 100% cement. 75C-15FFA-10LSP refers to the mixture that consists of 75% sand, 25% waste glass sand, 75% cement, 15% off-ASTM Class F fly ash, and 10% limestone powder.
Table 4. Summary of Expansion characteristics, expansion reduction, and strength activity index.
Mixture1 Expansion Threshold (%)Expansion Reduction (%)2 Strength Activity Index (%)
14-Day28-Day56-Day14-Day28-Day56-Day7-Day28-Day
100S-0WGS0.240.350.49
75S-25WGS0.400.611.20 100100
50S-50WGS0.410.721.80
25S-75WGS0.761.222.15
75C-0FFA-25LSP0.140.240.4163.960.066.163.0961.50
50C-0FFA-50LSP0.030.070.1492.288.988.131.4132.38
25C-0FFA-75LSP-0.020.000.02104.5100.698.14.194.32
85C-15FFA-0LSP0.090.200.3176.466.773.889.7386.78
70C-30FFA-0LSP0.010.020.0297.997.398.657.2168.54
55C-45FFA-0LSP0.020.050.0794.991.794.038.0444.48
75C-15FFA-10LSP0.060.140.2285.576.681.380.6581.92
70C-15FFA-15LSP0.040.110.1890.781.484.665.6366.67
55C-15FFA-30LSP0.010.050.0696.393.495.242.1742.84
50C-15FFA-35LSP0.010.020.02102.496.598.530.0830.55
Note: 1. The expansion threshold must be less than 0.1% at all ages; 2. The strength of the 75S-25WGS mixture was used as a denominator to calculate the strength activity index (SAI). The SAI needs more than 40% in this study.
Publisher’s Note: MDPI stays neutral with regard to jurisdictional claims in published maps and institutional affiliations.

