
Assessment of the Interconnection for Multi-Transfer Facilities: A Perspective from Coupling Coordination


1
School of Rail Transport, Soochow University, Suzhou 215006, China
2
School of Geographic Science, Nanjing Normal University, Nanjing 210098, China
*
Author to whom correspondence should be addressed.
Sustainability 2022, 14(10), 5803; https://doi.org/10.3390/su14105803
Submission received: 9 April 2022
/
Revised: 1 May 2022
/
Accepted: 9 May 2022
/
Published: 11 May 2022
(This article belongs to the Topic Sustainable Transportation)
Abstract
:Transfer terminals with a high integration level could provide favorable support to Mobility-as-a-Service, which is essential to sustainable transportation. The interconnection of multiple transfer facilities in terminals would affect travelers’ transfer choices during their trips. Existing research on intermodality lacks an efficient multi-dimension indicator system regarding transfer facilities. To date, the selection of representative indicator systems and the construction of quantitative evaluation models based on these indicators that can reflect the coupling relationship between transfer facilities effectively and comprehensively are still challenging. Aiming at this challenge, this study conducts the work in the following three ways. First, the concept of the degree of coupling coordination of multiple transfer facilities (DCC-MTF) is proposed to evaluate the interaction among multiple transfer facilities. Second, indicators of diversity, selectivity, accessibility, and continuity are designed and used to establish the model by using the entropy weight method. Third, the spatial distribution characteristics of DCC-MTF for each transfer facility are geo-visualized and clustered. Field observation is conducted at Lelylaan Station in the city of Amsterdam, and the indicator analysis derived from the collected data is discussed. Overall, the quantitative evaluation model presented in this study, which is universal and can be applied to similar scenarios, is directly valuable for planners and designers who aim to improve the integration level of transfer terminals.
1. Introduction
With the development of the Internet, intelligence technology, and the sharing economy, the transportation ecosystem needs to be reborn urgently and re-integrated subversively. Mobility-as-a-Service (MaaS) is considered an innovative conception to sustainable transportation, which offers travelers access to a bundle of transportation modes, such as trains, metros, buses, trams, cars, P&R and B&R, and taxis, on a single app [1]. MaaS aims to improve people’s experience of the travel chain. To establish an effective MaaS system, multiple transfer facilities with highly integrated levels should be developed technically as an important support.
Transfer terminals are generally located in the junction points of multiple transit modes, where every mode’s access and egress [2] can be linked and constituted as an integrated transfer channel. Various modes occupy different spatial resources in the station area, by which continuous travel demand of passengers could be satisfied. For a suitable multilayer transfer terminal (as well as have a station square, walking channels, stairs, elevators, and crosswalks at intersections), the complexity comes from stops, platforms, parking lots, pick-up/drop-off points, and entrances to public transport. According to geological conditions, metro and train lines use tracks exclusively as underground, overground, or elevated lines, whereas trams, buses, bicycles, and taxis usually occupy the ground space resource. The interconnection of these transfer facilities has an obvious effect on an individual’s transfer choice in the course of his trip. Poor organization of transfer facilities, which may lead to inconvenient transfers, would deter potential transfer customers, reduce the satisfaction of existing customers, and affect customers’ user experience [3].
The integration problem of transit modes for passengers has attracted the interest of many researchers in recent years. Empirically, the main focus has been on transit behavior and preference [4], the impact between transit modes [5], an integrated route choice for public transport systems [6], and a feeder system between two modes, such as bike–public transit [7]. Currently, considerably less attention has been dedicated to examining the integration status of multiple transfer facilities in the terminal area.
Throughout the past decades, transport planners and practitioners have been challenged with the selection of representative indicator systems and the construction of quantitative evaluation that can reflect the coupling relationship between transfer facilities effectively and comprehensively. This study will address this challenge by building an evaluation method to assess the interconnection for multi-transfer facilities from the perspective of coupling coordination. The contribution of this study can be divided into two parts. First, assessment with the entropy weight method and GIS analysis technology is applied to build a facility node coupling model based on diversity, selectivity, accessibility, and continuity indicators. Second, facility spatial location in terminal areas, crossing in the transfer channel, and concentration of multiple transfer facilities are the three critical factors that affect the coupling coordination degree. The study is conducive to improving the integration level of transfer terminals in practice and essential to the development of sustainable transportation.
The remainder of the paper is structured as follows. Section 2 reviews and summarizes relevant studies from three aspects. Section 3 proposes the conception of the degree of coupling coordination, four indicators, and the entropy weight method to construct the model. In Section 4, Lelylaan and its transfer facility data are used as an example to verify the validity and effectiveness of the model proposed in this study. In Section 5, the relationship with SDGs, the reasonability of the indicators, and the threshold value are discussed. Section 6 provides the conclusion.
2. Literature Review
Relevant studies can be summarized into three main groups: (1) the demand of MaaS development and intermodal transit behavior, (2) the scope of transfer integration and the assessment analysis method, and (3) the coupling relationship and application.
2.1. MaaS and Transit Behavior
Here, we argue that research regarding infrastructure integration for MaaS should be strengthened. Depending on the service offering, up to 46% of the Australian population would be willing to adopt MaaS [8,9]. Intermodal individuals who have no issue switching between modes for a trip if the trip is faster or more efficient overall are willing to pay more for MaaS service [10]. Such large demand for MaaS presents a tighter request for seamless connection of transfer facilities again. So far, studies concerning MaaS, focusing mostly on discussing the viability diversity of the MaaS business model, the policy framework from a government perspective, and opportunities and barriers of MaaS for multimodal cities have been conducted [11]. Feeder services or access/egress modes should be an integral part for MaaS solutions [12].
Multimodal behavior occupies a higher proportion in city dwellers’ trips. Low- and middle-income households expect better transit coordination with other modes to help improve the quality of life and wellbeing [13]. However, multimodal commuters tend to feel less satisfied with trips via alternative modes compared with monomodal commuters [14]. The influential factors that affect transit users’ choices of access and egress modes we investigated. It was shown that passengers are discouraged from using metro transit mainly because of transfers and additional pickups [15,16]. Considering the transit users’ subjective perceptions, the service level of urban rail transfer facilities, which concludes the importance and dissatisfaction with regard to walking distance, was analyzed [17]. The association between a walkability indicator and multimodal travel behavior was tested. Walkability indicators, whether for those who walk, bike, and/or take transit, were connected to multimodal behavior broadly [18].
Thus, special attention is given to the incomplete understanding of reasons as a key contributor to overcoming barriers and identifying promotion mechanisms for intermodal traveling.
2.2. Transfer Integration Assessment
Considering the scope of object properties, integration studies are usually performed from two perspectives, namely, through the internal integration of hubs and external transit network integration. From a microcosmic point of view, a conceptual framework of multimodal integration of the “integration ladder” is established, and the main barriers of multimodal integration inside the hub are identified from a people-centered perspective [19]. It has been shown that the interchange of railway–metro, railway–bus, and railway–private car (e.g., moving walkways to make the interchange more convenient, walking environment, luggage delivery facilities, and time coordination) need improvement. An association rules algorithm and cluster analysis were applied to recognize metro-to-bus transfers using SC data, since transfer points between metro and bus services remain elusive for transportation practitioners [20]. The performance of a multimodal transportation network was evaluated from a macroscopic point of view, whereas access, transfer, waiting, and egress time were considered the most important and complex elements that improve its efficiency and modal share [21]. Nonetheless, few studies have assessed the transfer integration adequately from a medium perspective regarding particular terminal facilities.
Due to the differences in the time sequence of transit mode construction, transfer facilities often develop in an unplanned manner, and most improvements in the facilities come about opportunistically or when the budget allows for change [22]. To identify the gaps of integration, transfer performance was assessed on the basis of passengers’ behavior and operators’ supply ability. A stated preference questionnaire survey [23] for travelers could reflect the traveler’s preference of transfer choice. However, this approach has a downside with regard to the strong subjectivity and the variability of questions in the survey. The policy and quality values [3] of transfer supply often derive from brainstorming from experts in the operation department and investment budget. In general, many aspects of transfers are difficult to quantify, and different management departments of transit modes do not coordinate very well. The latest results show that automatic vehicle location data from an offline framework could be used to check a posterior whether transfers are well planned and/or delivered in public transit network [24].
Accessibility [25,26] is considered a significant indicator to describe intermodal inconvenience, which pertains to the social dimension of sustainability and is beneficial for decision-makers in assessing the interaction between land use and transportation system policies. For example, applying accessibility metrics while examining a system, such as the Integrated Public Transport System in Spanish, which is common among the toolkit of transport planning in cities that seek to improve public transport connectivity, particularly in the Global South, may enrich debates around the contribution of urban transport to social inclusion [27]. However, definitions of accessibility vary [28], and the indicator of accessibility in the station area is not comprehensive enough to explain the coupling relation problem in the intermodal system. That is, analytical tools for evaluating the coordination effect of transfer facilities are still very limited and less developed.
2.3. Application of Coupling Relationship
Coupling, which is a term from physics, represents a paring or connecting phenomenon or relationship in which two or more systems influence each other through various interactions [29]. This concept has been subsequently applied to a wider range of fields, including communication, mechanics, and software, and then expanded to ecology [30], tourism [31], geography, sociology of populations, etc. For instance, according to the hierarchy, there are seven types of coupling: non-direct coupling, data coupling, stamp coupling, control coupling, external coupling, common coupling, and content coupling in the software field. In a few words, the metric of the coupling relationship can be measured to describe how elements interact in a system.
Coupling relationships have been mined with different approaches, such as multi-agent and big data computing models [32]. The evolutionary mechanisms of complex systems, by studying the macroscopic laws of a system by simulating and observing the microscopic behavior of the subjects, are based on multi-agent coupling analysis [33]. Another example is to discover the coupling mechanisms hidden in big data between human activities and nature [34].
A relatively close example would be the coupling analysis between urbanization and the eco-environment [35,36]. Four typical scenarios, namely, economy, resource, environment, and current scenarios, are simulated by adjusting the parameters to show the coupling relationships of factors in the ERE system clearly and eventually provide a few references for other developing cities to achieve sustainable and coordinated urban development [37]. Geographically and temporally weighted regression is used to measure the coupling coordination and spatiotemporal heterogeneity between the economic development and ecological environment of 17 tropical and subtropical regions [38]. In contrast, the interaction of multiple transfer facilities produced by individuals’ transfer behavior makes the exploration of the coupling relationship in a multimodal transfer system feasible in this paper.
Combined with the three parts of the literature summary above, multi-mode travel behavior requires further improvement in the connection level of transfer terminals. However, promotion mechanisms for intermodal traveling are still challenging. Analytical perspectives and tools are still limited. Therefore, the coupling relationship approach is worth applying in the field of urban transportation through successful experiences.
3. Methodology
3.1. Conception of DCC-MTF
Each transport mode relies on its own facilities to provide independent transportation services in the terminal area of the transfer station, and the interaction between facilities is generated by the transfer behavior of passengers. Passengers realize the transfer process by using hardware connection carriers, such as the station square, a footpath, a platform, the parking lot, boarding and alighting points, public transport entrances and exits, elevators and escalators, and intersections, and the quality of interaction among transfer facilities promotes, inhibits, or changes the passengers’ transfer preference. This kind of interaction and connection of transfer among different modes of transport, which is realized by passengers that use the facility carrier on foot, is called the coupling connection of transfer facilities.
In this study, the degree of coupling coordination of multiple transfer facilities (DCC-MTF) is aimed at the coupling nodes of various transfer facilities in the terminal area of the transfer station. DCC-MTF refers to the “one-to-many” integration metrics of four indicators within a certain range of reachable distance thresholds when passengers disembark from one type of transport facility and opt for an interchange facility from other types, including the diversity of the types of transfer facilities that can be selected, the selectivity of the same type of transfer facilities, the accessibility of the selected target transfer facilities, and the continuity of the transfer passages traversed from the current transport facilities to the target. DCC-MTF can be divided into two levels. The first level refers to the degree of local coupling and coordination, that is, the degree of coupling and coordination of each transfer facility to other types of transport. The second level corresponds to the degree of global coupling and coordination, that is, the average coupling and coordination degree of multiple types in the transfer terminal area. It is assumed in this paper that passengers do not consider transfer fare costs, transfer waiting time, and other human factor uncertainties.
Among these indicators, diversity is used to measure the impact of the other types of transfer facilities that can be selected within a certain buffer zone when passengers disembark from a transfer facility. In Figure 1a, two types of transfer facilities, namely, high-speed rail station A as the exit and within a buffer zone with a radius of r, can be selected. These two types of transfer facilities determine the diversity of transfer options for passengers. Selectivity can be used to measure the impact of the number of the same types of transfer facilities that can be selected within a certain threshold buffer area after passengers select the type of transfer facilities to be used. As shown in Figure 1b, assuming that the high-speed rail station A is still the exit, within the buffer zone of radius , two alternative transfer facilities, namely, bicycles and buses, are available. However, compared with buses, one more bicycle facility can be selected. Accessibility is used to measure the influence of the walking distance of passengers from the node of alighting to the node of boarding (transfer node) of the target transfer facility where they will be transferred. As shown in Figure 1c, if the target transfer node G is selected by the passenger, then accessibility refers to the walking distance function from exit A to transfer node G. Continuity is used to measure the impact of the types of roads and obstacles that passengers walk through from the node of alighting to the transfer node. As shown in Figure 1d, if the departure station and transfer node of the passengers are the same as those of Figure 1c, the passengers need to pass through the square, sidewalk, and intersection in turn. The number of hardware connection nodes that pass from the entrance of the initial transportation facility to the entrance of the transfer facility affects the continuity of passenger transfer.
3.2. Evaluation Model of DCC-MTF
3.2.1. Indicator of DCC-MTF by the Entropy Weight Method
Currently, there exist two types of mainstream indicator weighting methods. One is subjective weighting, such as expert scoring, and the other is objective weighting, such as the analytic hierarchy process, which starts from subjective judgements and can be converted into objective ones. Overall, the most typical method of object weighting is the entropy method [39,40]. To reduce the impact of human factors on the results, this paper used the entropy weight method, which belongs to the objective weight method, to weight the four core indicators (e.g., diversity, selectivity, accessibility, and continuity) of multiple transport facilities to build the coupling coordination degree evaluation model of multimodal transfer. Entropy measures the uncertainty in information theory, and the smaller the uncertainty, the smaller the entropy. That is, the more effective the amount of information contained is, the greater the weight. The greater the uncertainty is, the greater the entropy is, indicating that less information is contained and the smaller the weight is. Given the indicators proposed in this paper, this objective weighting method was adopted.
The calculation steps are shown in Table 1. Suppose n samples and m indicators are given, then denotes indicator j of sample i:
3.2.2. Child Indicator of DCC-MTF
- (1)
- Diversity
The simplest and most direct way to evaluate the diversity of transfer facilities is to count the number of transfer facilities within a buffer zone, which is associated with a radius. However, to avoid the instability of the diversity indicator of transfer facilities caused by such simple and direct calculation methods and the impact of the number of stations of each type of transfer facility on the diversity indicator, the information entropy method, which is widely used in biodiversity, is introduced. Information entropy is one of the core conceptions in information theory, which was first proposed by Shannon. Information entropy is initially used to describe the uncertainty of information sources [41]. In the context of transfer facility diversity, the smaller the information entropy is, the more certain the category of transfer facilities is, that is, the weaker the diversity is. On the contrary, it means more information, that is, more diversity. In this paper, information entropy was used to measure the diversity indicator of transfer facilities, and the formula is expressed as follows:
where is the diversity indicator of transfer facility node i, and is the ratio of the transfer facility node number of the same type as i to the total number of transfer facility nodes in the buffer zone. If is the transfer facility node number of the same type as i and n is the number of all transfer facility nodes within the buffer zone, then the calculation formula of is expressed as follows:
where , . The larger the is, the stronger the diversity of transfer facilities within the buffer zone is, and vice versa.
- (2)
- Selectivity
In this paper, the selectivity of transfer facilities reflects the number of alternative transfer facilities of the same type after getting off from one mode. The more of the same type of transfer facilities there are, the more optional the transfer facilities are. For each facility node, the number of categories and facilities of other types of transfer facility nodes are the same within the buffer zone of its specified radius, which is the ideal state of transfer facility selectivity. In this ideal state, for each transfer facility node within its buffer zone, the calculation formula of the mean value of the number of transfer facilities node i is expressed as follows:
where denotes the number of transfer facility nodes that are interchangeable with node i in the terminal area, and n denotes the number of transfer facility nodes within the buffer zone.
In the actual calculation, the actual number of a certain type of transfer facilities may have a value of 0. To avoid the problem that the base of the logarithm is 0 in the calculation, the actual number of service facilities is added with 1. The rationality of this processing lies in that when the actual number of transfer facility nodes is 0, the selectivity indicator remains 0, and it does not affect other transfer facility categories whose selectivity indicator is not 0. If is used to denote the comprehensive selectivity indicator of all transfer facilities around a certain transport facility node, then the calculation formula is expressed as follows:
where m is the maximum number of transfer facility node samples by transport modes in the terminal area.
- (3)
- Accessibility
In the terminal area, passengers usually walk from the drop-off point to the transfer point in the process of transfer. The walking access indicator (WAI) method can be used to evaluate accessibility within the buffer zone of the transfer facilities [42]. If n is used to denote the number of types of transfer facilities and W is used to denote the walking indicator of the i-th type node from node i to the k-th type node k within its buffer zone, then the calculation formula is presented as follows:
where k is the transfer facility node index with hardware connection carriers to node i, and denotes the maximum acceptable distance from node i to all nodes of type k. is the average walking distance from node i to all nodes of type k, denotes the ideal distance from node i to all nodes of type k, and is the accessibility indicator of transfer facility node i within the buffer zone. In this study, the maximum acceptable distance of was set to 500 m, and the ideal distance was set to 50 m.
- (4)
- Continuity
The types of hardware connection carriers that passengers pass in the transfer process include crossroads, stairs, turns, platforms, footpaths, squares, parking lots, and pick-up/drop-off points. In this paper, the type and number of these hardware connection carriers were used to quantify the continuity for the walking path of the passenger. In the calculation of continuity, different types of hardware connection carriers were modeled in a weighted way. In addition, we also considered the number of turns in the transfer passage. If T is used to denote the frequency set of each hardware connection carrier that passengers pass through in the same path, and denotes the frequency of the l-th type hardware connection carrier in this path, then T = {}. If is used to denote the continuity indicator of transfer facility nodes i to j, then the calculation formula is presented as follows:
where l is the type index of the hardware connection carrier, and u is the maximum number of hardware connection carrier types to node i. is the number of hardware connection carriers of type l in the path from transfer facility node i to j. denotes the weight value of the l-th type hardware connection carrier, is the number of turn occurrences in the path from transfer facility node i to j, is the weight constant of the cross point of the path, and E is the constant and satisfies , The larger E is, the faster the continuity indicator increases as the value of rises. Therefore, for transfer facility node i, if n is used to denote the total number of nearly all transfer facilities except i, then the calculation formula of its comprehensive continuity indicator can be expressed as follows:
4. Application Example
4.1. Study Area Description
Lelylaan Station, which links CBD and Schiphol Airport of Amsterdam, is a typical transfer terminal that has multimodal transfer facilities, such as train, metro, tram, bus, park and ride (P&R), bike and ride (B&R), kiss and ride (K&R), and taxi facilities. All the accesses of the transfer facilities are allocated compactly and kept in a 1000 × 500 m2 plot in this terminal area. In this paper, the node coupling relationship was investigated on the basis of the transfer interaction among these transport modes. Here, 20 transfer facilities were abstracted as nodes from a spatial perspective (Table 2). Field observation of Lelylaan Station was conducted, from which we gained a plane figure of the ground layer (Figure 2). In the remainder of this section, we present the most interesting observations derived from the collected data.
4.2. Analysis Results
4.2.1. Difference of a Single Indicator among All Transfer Facilities
The 20 nodes of transfer facilities in Lelylaan Station showed differences in numerical values in the four indicators of diversity, selectivity, accessibility, and continuity. Due to the large differences in the numerical distribution of different indicators, drawing trend graphs of all indicators in the same chart was impossible. Hence, they were drawn separately. The abscissa of each figure represents the names of various transfer facility nodes, and the ordinate represents the numerical value of the indicators. The model proposed in this paper quantifies the differences in the four aspects so that different nodes are comparable. By comparing the distribution trends and laws of each indicator among these 20 transfer facility nodes, the rationality of the indicator calculation model proposed in this paper was verified through observation to some extent. Thus, the accuracy of the calculation result for DCC-MTF is guaranteed.
The comparison of the overall trends in Figure 3a–d shows that the diversity and selectivity indicators of different nodes had small differences and were relatively stable. On the contrary, the accessibility and continuity indicators among different nodes varied greatly. Observing the change trend of each indicator of the same node, we found that (1) only slight differences in the continuity values of the five bicycle transfer facility nodes were observed, but the diversity and accessibility indicators of the bicycle facility node BP1 were much lower than those of the four other nodes, and the selectivity of BP1 and BP2 was lower than that of the three other facility nodes; (2) the diversity, selectivity, accessibility, and continuity of the four regional train entrances (i.e., T1–T4) and the four subways (i.e., M1–M4) showed a basically consistent curve trend, among which the indicator values of M4 and T4 were slightly higher than those of the three other entrances and exits, which is related to the parallel distribution of the entrances and exits of the subway and trains; (3) the characteristics of the diversity, selectivity, accessibility, and continuity of B1–B2; and P1–P2 were stable and basically the same; and (4) the characteristics presented by the selectivity, accessibility, and continuity indicators of TC and TP were stable and basically the same, whereas the diversity of TC was slightly lower than that of TP.
Here, the actual scenario of Figure 2 was combined with the above calculation results to evaluate the rationality of the indicators. As shown in Figure 3a,c, the values of BP2, M4, and T4 were slightly higher than those of the other nodes in the diversity and accessibility indicators. In practice, these three nodes are located in the central area of the entire transfer terminal, where the number and types of other site nodes included in the distance range of the buffer zone are concentrative, and the total distance cost to other nodes is lower. Therefore, its diversity and accessibility indicators must be relatively large. Figure 3b shows that the selectivity of BP4 was relatively high, because one side of the BP4 node is the bicycle lane beside the road, and the other side is the square area of the transfer terminal. The purpose of this design is to make it convenient for passengers to park their bicycles nearby or transfer to bicycles from public transit and leave soon via a nearby bicycle lane. This is related to the convenience of transferring access and egress. Furthermore, the continuity values of P1, P2, and PR were relatively low. One reason is that the PR node is located in the right area of the entire transfer terminal. Although the P1 and P2 nodes are located in the central area, conflicts and delays always occur when people cross the signalized intersection for any transfer to trams, thereby indicating that the results of the four indicators constructed in this paper are basically in line with the actual distribution characteristics of multiple facilities of the transfer terminal.
At a more macro level, researchers and planners may pay more attention to the overall diversity, selectivity, accessibility, and continuity of each type of transfer facility rather than the indicators of a single node. For this reason, the average value of each indicator of each type of transfer facility node was calculated by averaging on the basis of the four indicators above, and the chart is shown in Figure 4.
The comparison of the four indicator values of the eight types of transfer facility nodes in Figure 4a–d shows that the difference in selectivity was the smallest, followed by diversity, and the largest difference was accessibility and continuity. The overall diversity, selectivity, and accessibility indicator values of the bicycle transfer facility BP and the bus transfer facility B were all high, and the continuity value was at a medium level. Therefore, the overall diversity, selectivity, accessibility, and continuity of tram transfer facility P were relatively low because the access of the tram station from other transfer nodes is separated by car and bicycle lanes. Moreover, the overall diversity, selectivity, accessibility, and continuity values of the taxi transfer facility and K&R were better than those of P&R to some extent. Expressly, the overall diversity, selectivity, accessibility, and continuity values of metro M and train T were higher, especially for continuity. In summary, the transfer terminal is dominated by the public transport of the metro and regional trains with flexible aided transfer by car, whereas the transfer effect of bicycles and small-volume public transit transfers is higher.
4.2.2. Multivariable Clustering and Spatial Distribution Analysis
The degree of coupling coordination is determined by its diversity, selectivity, accessibility, and continuity. However, for two nodes with similar degrees of coupling coordination, the combined structure of the four indicator values may vary. To explore the differences among them, K-means clustering was used to cluster the four indicators. The pseudo-F test showed that when the number of clusters is 4, the clustering effect is better, so k = 4 was used for clustering, and the clustering results are shown in Figure 5. If clusters 1, 2, 3, and 4 are used to denote the set of transfer facility nodes in each cluster, then the node set of each cluster can be denoted as Cluster1 = (P1, P2, PR, BP1), Cluster2 = (M2, M3, M4, TP, TC), Cluster3 = (B1, B2, B4, B5, BP4), and Cluster4 = (T1, T2, T3, T4), respectively. The clustering results show that the same type of nodes were clustered together in most cases. This phenomenon suggests that the combination structure of the four indicators of the same type of nodes tends to be consistent. From the perspective of spatial location, nodes that belonged to the same clustering pattern also had the characteristics of clustering distribution in space. This shows that the spatial location had a significant impact on the value of the four indicators.
Although the specific nodes and their spatial distribution characteristics in each clustering pattern can be observed intuitively through Figure 5, the structural characteristics of the values of the four indicators in each clustering pattern cannot be judged. To reflect the structural characteristics of the four indicators in each cluster, a box line diagram is provided in Figure 6. Pattern 1 (Div-lowest & Sel-lower &Acc-lowest &Con-Higher) is a pattern wherein almost all indicators were low, and the coupling coordination degree of these transfer facilities was relatively low. The transfer impedance of PR, BP1, P1, and P2 was larger because of position deviation and multiple crossing. Pattern 2 (Div-medium & Sel-medium & Acc- medium & Con-lowest) showed that the values of the four indicators of these transfer points were basically in the middle level, suggesting that the degree of coupling coordination of these facilities was in the upper-middle level. The concentration of facilities makes the access and egress links closer. Pattern 3 (Div-highest & Sel-highest &Acc-highest & Con-lower) presented an obvious peak in diversity, selectivity, and accessibility, and the pattern can be viewed as having the highest CDD-MTF value. The excellent location and convenient road network were the significant influencing factors. Pattern 4 (Div- medium & Sel-lower & Acc- medium & Con-Highest) revealed the coexistence of a peak in continuity and valley in selectivity, and it showed a higher level of DCC-MTF. Critical elements were the sidewalk links in transfer channels.
4.2.3. Difference of the Composite Indicator
The spatial distribution map of the DCC-MTF, which not only reflects the degree of the coupling relationship of multiple transfer facility nodes, but also presents its spatial distribution characteristics, is displayed in Figure 7. The value was divided into five levels, (i.e., the highest, higher, medium, lower, and lowest degrees of coupling coordination), using a proportional cartography method. In addition, the entropy weight value of each indicator is shown in Table 3, and the specific value of DCC-MTF of each node and the average value of DCC-MTF of each type of node are shown in Table 4.
Figure 5 shows that the nodes with the highest degree of coupling and coordination were T4 and BP2. The nodes with a higher degree of coupling and coordination were M4, B1, B2, BP4, BP5, TP, and TC. The nodes with a middle degree of coupling and coordination were M2, M3, and BP3. The nodes with a lower coupling coordination degree were M1, T1, T2, and T3. The nodes with the lowest coupling coordination degree were PR, P1, P2, and BP1.
As shown in Table 3, the entropy weight of selectivity and diversity was larger, followed by accessibility and continuity. By calculating the mean DCC-MTF value of each node, the DCC-MTF of each type could be obtained, as shown in Table 4. The average coupling coordination degree of TC and TP was the highest, followed by T, B, BP, and M, and the average coupling coordination degree of P and PR was the lowest. The difference between the node with the highest (BP2) and lowest (BP1) coupling coordination was 6.51. In general, spatial location in the terminal area, crossing in the transfer channel, and the concentration of multiple transfer facilities were the three most important factors that affected its coupling coordination degree.
As explained in the definition of the degree of coupling coordination, this model can not only calculate the DCC-MTF of a single transfer facility but also evaluate the DCC-MTF of the whole transfer terminal comprehensively. The average DCC-MTF of all transfer facilities in the transfer terminal was calculated as its global indicator, and its value was 8.914. An application scenario that may be widely used for global DCC-MTF is to compare and analyze several transfer terminals to evaluate which ones have high and low coupling coordination, which are crucial in the evaluation of integration.
5. Discussion
The transportation infrastructure industry has always been the focus of green development, which is affecting people’s well-being and the country’s economic prospects [43]. Reliable transport infrastructure is an important support for the economic development of services, and the United Nations Sustainable Development Goals (UNSDGs) call for increasing access to sustainable transport infrastructure in low- and middle-income countries [44,45]. The State Council Information Office of China released a white paper titled “Sustainable Development of China’s Transportation” in December 2020. Initiatives to strengthen transport cooperation were put forward in the second United Nations Global Sustainable Transport Conference in November 2021. Therefore, transfer terminals with a high integration level are fundamental and efforts to build a multi-tiered new urban travel system are being pioneered.
In this study, the selection of indicators as well as the determination of which indicators to construct the coupling coordination degree model of multiple transfer facilities are worthy of discussion. Typically, the choice of indicators depends on the analytical perspective. That is, any number of indicators can be used similar to a hodgepodge if the analytical perspective is not defined. For this problem scenario, at least three different perspectives (e.g., attribute, time, and space) can be considered. For example, from the perspective of attribute, passengers will also consider the cost, travel purpose, safety cost, and other factors when choosing the transfer mode. From the perspective of time, the overlap effect of operational schedule and transfer waiting time are also considered when choosing a transfer type among public transit modes. Instead of these two perspectives, this study observed the problem from a spatial analysis perspective based on GIS technology, which focused on the coupling relationship of nodes. Thus, some rules that are difficult to see from other perspectives could be mined.
Another issue is to illustrate the rationality of using a small distance threshold (150 m) as a buffer space constraint in the calculation of diversity and a selectivity indicator in this paper. In the terminal area of Lelylaan Station, the average straight-line distance from its southernmost side to its northernmost side is 300 m, and the maximum walking distance between transfer facilities is approximately 450 m. Such value of distances is within the acceptable walking distance range of passengers. Within this distance threshold, the distances between all the sites are very short, thereby eliminating the need to calculate coupling coordination. However, we need to be aware that passengers who use transfer services are not walking or exercising. Most of them are commuting, going on business trips and other time-sensitive trips, and some passengers are also carrying luggage. Hence, more efficient connection of transfer facilities is required. Especially when the passenger flow is large during the peak period, transfer channels with smaller distances are conducive to improving transfer efficiency and travel experience. In short, the calculation of indicators such as diversity and selectivity under the buffer threshold of 150 m is feasible and of practical significance. Moreover, a larger buffer distance threshold can be specified in other similar application scenarios depending on the needs.
6. Conclusions
The pros and cons of the coupling relationship among multiple transfer facilities in the terminal area affect the travel efficiency and travel choice of passengers. To evaluate the connection status, the entropy weight method and GIS analysis technology were applied to construct a facility node coupling model based on diversity, selectivity, accessibility, and continuity indicators. Each type of facility and the whole terminal were calculated on the basis of the value of a single DCC-MTF facility. From the case study of Lelylaan Station, it was found that the category facility coupling status of metro, train, bicycle, taxi, K&R, bus, was better, followed by tram and P&R. Among them, the node facility coupling status of M4, T4, T3, BP2, BP5, TC, and TP was better than others. This station is dominated by mass transit, has a higher transfer unity of bicycles and small-volume public transport, and has the most flexible transfer modes by car. Furthermore, the facility’s spatial location in the terminal area, crossing in the transfer channel, and the concentration of multiple transfer facilities are the three most important factors that affected the coupling coordination degree.
A key step in achieving MaaS is to evaluate whether the existing transfer terminals can provide passengers with the application service on the app. If multiple modes for transfer are insufficient, the gap must be addressed. If gaps exist, the quality of intermodality must be determined. Therefore, understanding the coupling relationship of multiple transfer facilities has great significance for promoting integration, which proposes an effective metric to some extent. This model can be widely applied to the evaluation of any other single facility or transfer terminal, which is beneficial to academic and practical implications.
Still, two limitations need to be mentioned. The first limitation is that the model presented in this paper is suitable for microscopic scenarios in a terminal area. It is not applicable for larger-scale (e.g., urban, regional, or even national scale) analysis because the connotation of transfer and the types of transfer facilities may change. For instance, taxis can stop almost everywhere in a city, thereby making it less sensible to consider the coupling relationship of taxis. In a similar way, metros and buses within a city should not be considered when the scale is expanded to the region. The second limitation is that the indicators could be increased or changed with the details of the transfer facilities. For instance, safety indicators that are ignored at the micro scale need to be considered at the urban scale. Future research will focus on the scale effect of the coupling relationship for traffic transfer systems and the relationship with the UNSDGs.
Author Contributions
Conceptualization, L.C.; methodology, L.C. and H.Z.; investigation, L.C. resources, L.C.; visualization, L.C. and H.Z.; validation, L.C.; writing–original draft preparation, L.C. writing–review and editing, L.C. and W.L.; project administration, L.C.; All authors have read and agreed to the published version of the manuscript.
Funding
This research is supported by the National Natural Science Foundation of China (51408386).
Institutional Review Board Statement
Not applicable.
Informed Consent Statement
Not applicable.
Data Availability Statement
Due to confidentiality agreements, supporting data can only be made available to bona fide researchers subject to a non-disclosure agreement.
Conflicts of Interest
The authors declare no conflict of interest.
Glossary
Symbol Implication for the Child Indicator of DCC-MTF.

| Symbol | Implication |
|---|---|
| The diversity indicator of transfer facility node i within the buffer zone | |
| The selectivity indicator of transfer facility node i within the buffer zone | |
| The accessibility indicator of transfer facility node i within the buffer zone | |
| The continuity indicator of transfer facility node i within the buffer zone | |
| The ratio of the number of transfer facility node i to the total number of transfer facility nodes | |
| The number of transfer facility node i by transport modes | |
| The ratio of the number of transfer facility node i to the maximum number of transfer facility nodes that are interchangeable | |
| The number of transfer facility nodes that are interchangeable with node i | |
| The maximum acceptable distance from transfer facility node i to all nodes k | |
| The average walking distance from transfer facility node i to all nodes k | |
| The ideal distance from transfer facility node i to all nodes k | |
| The frequency of the hardware connection carrier in this path for transfer facility node i | |
| The number of hardware connection carriers of type l in the path from transfer facility node i to j | |
| The weight value of the l-th type hardware connection carrier | |
| The number of turn occurrences in the path from transfer facility node i to j | |
| The weight constant of the cross point of the path | |
| i,j | Transfer facility node index, i∈N, j∈N |
| n | The maximum number of transfer facility node samples within the buffer zone |
| m | The maximum number of transfer facility node samples by transport modes within the buffer zone |
| l | The type index of the hardware connection carrier |
| u | The maximum number of hardware connection carrier types to node i |
| k | The transfer facility node index with hardware connection carriers to node i, k∈N |
| N | The total transfer facility nodes set within the buffer zone |
| T | The frequency set of each hardware connection carrier that passengers pass through in the same path |
References
- Makarewicz, C.; Németh, J. Are multimodal travelers more satisfied with their lives? A study of accessibility and wellbeing in the Denver, Colorado metropolitan area. Cities 2018, 74, 179–187. [Google Scholar] [CrossRef]
- Bhandari, K.; Advani, M.; Parida, P.; Gangopadhyay, S. Consideration of access and egress trips in carbon footprint estimation of public transport trips: Case study of Delhi. J. Clean. Prod. 2014, 85, 234–240. [Google Scholar] [CrossRef]
- Guo, Z.; Wilson, N.H.M. Assessing the cost of transfer inconvenience in public transport systems: A case study of the London Underground. Transp. Res. Part A Policy Pract. 2011, 45, 91–104. [Google Scholar] [CrossRef]
- Zhao, J.; Deng, W.; Song, Y. Ridership and effectiveness of bikesharing: The effects of urban features and system characteristics on daily use and turnover rate of public bikes in China. Transp. Policy 2014, 35, 253–264. [Google Scholar] [CrossRef]
- Fishman, E.; Washington, S.; Haworth, N. Bike share’s impact on car use: Evidence from the United States, Great Britain, and Australia. Transp. Res. Part D Transp. Environ. 2014, 31, 13–20. [Google Scholar] [CrossRef] [Green Version]
- Narayan, J.; Cats, O.; van Oort, N.; Hoogendoorn, S. Integrated route choice and assignment model for fixed and flexible public transport systems. Transp. Res. Part C Emerg. Technol. 2020, 115. [Google Scholar] [CrossRef]
- Martin, E.W.; Shaheen, S.A. Evaluating public transit modal shift dynamics in response to bikesharing: A tale of two U.S. cities. J. Transp. Geogr. 2014, 41, 315–324. [Google Scholar] [CrossRef] [Green Version]
- Akshay, V.; Stacey, R. Consumer preferences forMobility-as-a-Service(MaaS) in Australia. Transp. Res. Part A 2020, 117, 1–21. [Google Scholar] [CrossRef]
- Mulley, C.; Ho, C.; Balbontin, C.; Hensher, D.; Stevens, L.; Nelson, J.D.; Wright, S. Mobility as a service in community transport in Australia: Can it provide a sustainable future? Transp. Res. Part A 2020, 131, 107–122. [Google Scholar] [CrossRef]
- Smith, G.; Sochor, J.; Karlsson, I.C.M. Mobility as a Service: Development scenarios and implications for public transport. Res. Transp. Econ. 2018, 69, 592–599. [Google Scholar] [CrossRef]
- Polydoropoulou, A.; Pagoni, I.; Tsirimpa, A. Ready for Mobility as a Service? Insights from stakeholders and end-users. Travel Behav. Soc. 2020, 21, 295–306. [Google Scholar] [CrossRef]
- Tonnesen, A.; Knapskog, M.; Uteng, T.P.; Oksenholt, K.V. The integration of active travel and public transport in Norwegian policy packages: A study on ‘access, egress and transfer’ and their positioning in two multilevel contractual agreements. Res. Transp. Bus. Manag. 2020. [Google Scholar] [CrossRef]
- Oeschger, G.; Carroll, P.; Caulfield, B. Micromobility and public transport integration: The current state of knowledge. Trans. Res. Part D Transp. Environ. 2020, 89, 102628. [Google Scholar] [CrossRef]
- Mao, Z.; Ettema, D.; Dijst, M. Commuting trip satisfaction in Beijing: Exploring the influence of multimodal behavior and modal flexibility. Transp. Res. Part A Policy Pract. 2016, 94, 592–603. [Google Scholar] [CrossRef]
- Azimi, G.; Rahimi, A.; Lee, M.; Jin, X. Mode choice behavior for access and egress connection to transit services. Int. J. Transp. Sci. Technol. 2020. [Google Scholar] [CrossRef]
- Younes, H.; Nasri, A.; Baiocchi, G.; Zhang, L. How transit service closures influence bikesharing demand; lessons learned from SafeTrack project in Washington, D.C. metropolitan area. J. Transp. Geogr. 2019, 76, 83–92. [Google Scholar] [CrossRef]
- Kima, J.; Schmöckera, J.D.; Yu, J.W.; Choi, J.Y. Service quality evaluation for urban rail transfer facilities with Rasch analysis. Travel Behav. Soc. 2018, 13, 26–35. [Google Scholar] [CrossRef]
- Riggs, W.; Sethi, S.A. Multimodal travel behaviour, walkability indices, and social mobility: How neighbourhood walkability, income and household characteristics guide walking, biking & transit decisions. Local Environ. 2020, 25, 57–68. [Google Scholar] [CrossRef]
- Li, L.; Loo, B.P.Y. Towards people-centered integrated transport: A case study of Shanghai Hongqiao Comprehensive Transport Hub. Cities 2016, 58, 50–58. [Google Scholar] [CrossRef]
- Zhao, D.; Wang, W.; Li, C.; Ji, Y.; Hu, X.; Wang, W. Recognizing metro-bus transfers from smart card data. Transp. Plan. Technol. 2018, 42, 70–83. [Google Scholar] [CrossRef]
- Kumar, P.P.; Parida, M.; Swami, M. Performance Evaluation of Multimodal Transportation Systems. Procedia Soc. Behav. Sci. 2013, 104, 795–804. [Google Scholar] [CrossRef] [Green Version]
- MIMIC; European Commission. The Forth Framework Research and Technological Development Programme. Available online: https://cordis.europa.eu/programme/id/FP4 (accessed on 1 April 2022).
- Ho, C.Q.; Mulley, C.; Hensher, D.A. Public preferences for mobility as a service: Insights from stated preference surveys. Transp. Res. Part A Policy Pract. 2020, 131, 70–90. [Google Scholar] [CrossRef]
- Barabino, B.; Di Francesco, M.; Maternini, G.; Mozzoni, S. Offline framework for the diagnosis of transfer reliability by Automatic Vehicle Location Data. IEEE Intelligent Transportation Systems Magazine, 4 March 2021. [Google Scholar] [CrossRef]
- El-Geneidy, A.; Levinson, D.; Diab, E.; Boisjoly, G.; Verbich, D.; Loong, C. The cost of equity: Assessing transit accessibility and social disparity using total travel cost. Transp. Res. Part A Policy Pract. 2016, 91, 302–316. [Google Scholar] [CrossRef] [Green Version]
- Tahmasbi, B.; Kim, I. Multimodal accessibility-based equity assessment of urban public facilities distribution. Sustain. Cities Soc. 2019, 49, 101633. [Google Scholar] [CrossRef]
- Guzman, L.; Oviedo, D.; Cardona, R. Accessibility Changes: Analysis of the Integrated Public Transport System of Bogotá. Sustainability 2018, 10, 3958. [Google Scholar] [CrossRef] [Green Version]
- Cohen, T. Tools for addressing transport inequality: A novel variant of accessibility measurement. J. Transp. Geogr. 2020, 88, 102863. [Google Scholar] [CrossRef]
- Li, Y.; Zhou, Y.; Shi, Y.; Zhu, X. Investigation of a coupling model of coordination between urbanization and the environment. J. Environ. Manag. 2012, 98, 127–133. [Google Scholar] [CrossRef]
- Kai, Y.; Shuran, L.; Jiancun, G.; Lei, P. Research on the coupling degree measurement model of urban gas pipeline leakage disaster system. Int. J. Disaster Risk Reduct. 2017, 22, 238–245. [Google Scholar] [CrossRef]
- Tang, Z. An integrated approach to evaluating the coupling coordination between tourism and the environment. Tour. Manag. 2015, 46, 11–19. [Google Scholar] [CrossRef]
- Liu, W.; Zhan, J.; Zhao, F.; Wei, X.; Zhang, F. Exploring the coupling relationship between urbanization and energy eco-efficiency: A case study of 281 prefecture-level cities in China. Sustain. Cities Soc. 2021, 64, 102563. [Google Scholar] [CrossRef]
- Ducrot, R.; Le Page, C.; Bommel, P.; Kuper, M. Articulating land and water dynamics with urbanization: An attempt to model natural resources management at the urban edge. Comput. Environ. Urban Syst. 2004, 28, 85–106. [Google Scholar] [CrossRef]
- Pijanowski, B.C.; Tayyebi, A.; Doucette, J.; Pekin, B.K.; Braun, D.; Plourde, J. A big data urban growth simulation at a national scale: Configuring the GIS and neural network based Land Transformation Model to run in a High Performance Computing (HPC) environment. Environ. Model. Softw. 2014, 51, 250–268. [Google Scholar] [CrossRef]
- Gan, L.; Shi, H.; Hu, Y.; Lev, B.; Lan, H. Coupling coordination degree for urbanization city-industry integration level: Sichuan case. Sustain. Cities Soc. 2020, 58, 102136. [Google Scholar] [CrossRef]
- Song, Q.; Zhou, N.; Liu, T.; Siehr, S.A.; Qi, Y. Investigation of a “coupling model” of coordination between low-carbon development and urbanization in China. Energy Policy 2018, 121, 346–354. [Google Scholar] [CrossRef] [Green Version]
- Xing, L.; Xue, M.; Hu, M. Dynamic simulation and assessment of the coupling coordination degree of the economy-resource-environment system: Case of Wuhan City in China. J. Environ. Manag. 2019, 230, 474–487. [Google Scholar] [CrossRef]
- Shi, T.; Yang, S.; Zhang, W.; Zhou, Q. Coupling coordination degree measurement and spatiotemporal heterogeneity between economic development and ecological environment—Empirical evidence from tropical and subtropical regions of China. J. Clean. Prod. 2020, 244, 118739. [Google Scholar] [CrossRef]
- Weijs-Perrée, M.; Dane, G.; van den Berg, P.; van Dorst, M. A Multi-Level Path Analysis of the Relationships between the Momentary Experience Characteristics, Satisfaction with Urban Public Spaces, and Momentary-and Long-Term Subjective Wellbeing. Int. J. Environ. Res. Public Health 2019, 16, 3621. [Google Scholar] [CrossRef] [Green Version]
- Gao, P.; Wang, X.; Wang, H.; Cheng, C. A correction to the entropy weight coefficient method by Shen et al. for accessing urban sustainability. Cities 2020, 103, 102742. [Google Scholar] [CrossRef]
- Charles, C. Calculating the information content of an information process for a domain expert using Shannon’s mathematical theory of communication. Inf. Processing Manag. 1997, 33, 715–726. [Google Scholar]
- Saghapour, T.; Moridpour, S. The role of neighbourhoods accessibility in residential mobility. Cities 2019, 87, 1–9. [Google Scholar] [CrossRef]
- Arbués, P.; Baños, J.F.; Mayor, M. The spatial productivity of transportation infrastructure. Transp. Res. Part A Policy Pract. 2015, 75, 166–177. [Google Scholar] [CrossRef]
- Janoušková, S.; Hák, T.; Moldan, B. Global SDGs Assessments: Helping or Confusing Indicators? Sustainability 2018, 10, 1540. [Google Scholar] [CrossRef] [Green Version]
- Ochoa-Covarrubias, G.; Grindlay, A.L.; Lizarraga, C. Does the Mass Public Transport System Cover the Social Transport Needs? Targeting SDG 11.2 in Guadalajara, Mexico. Appl. Sci. 2021, 11, 7709. [Google Scholar] [CrossRef]
Figure 1.
Conception of DCC-MTF. (a) Diversity; (b) Selectivity; (c) Accessibility; and (d) Continuity. The letters A–I indicate different transfer facility nodes.
Figure 1.
Conception of DCC-MTF. (a) Diversity; (b) Selectivity; (c) Accessibility; and (d) Continuity. The letters A–I indicate different transfer facility nodes.
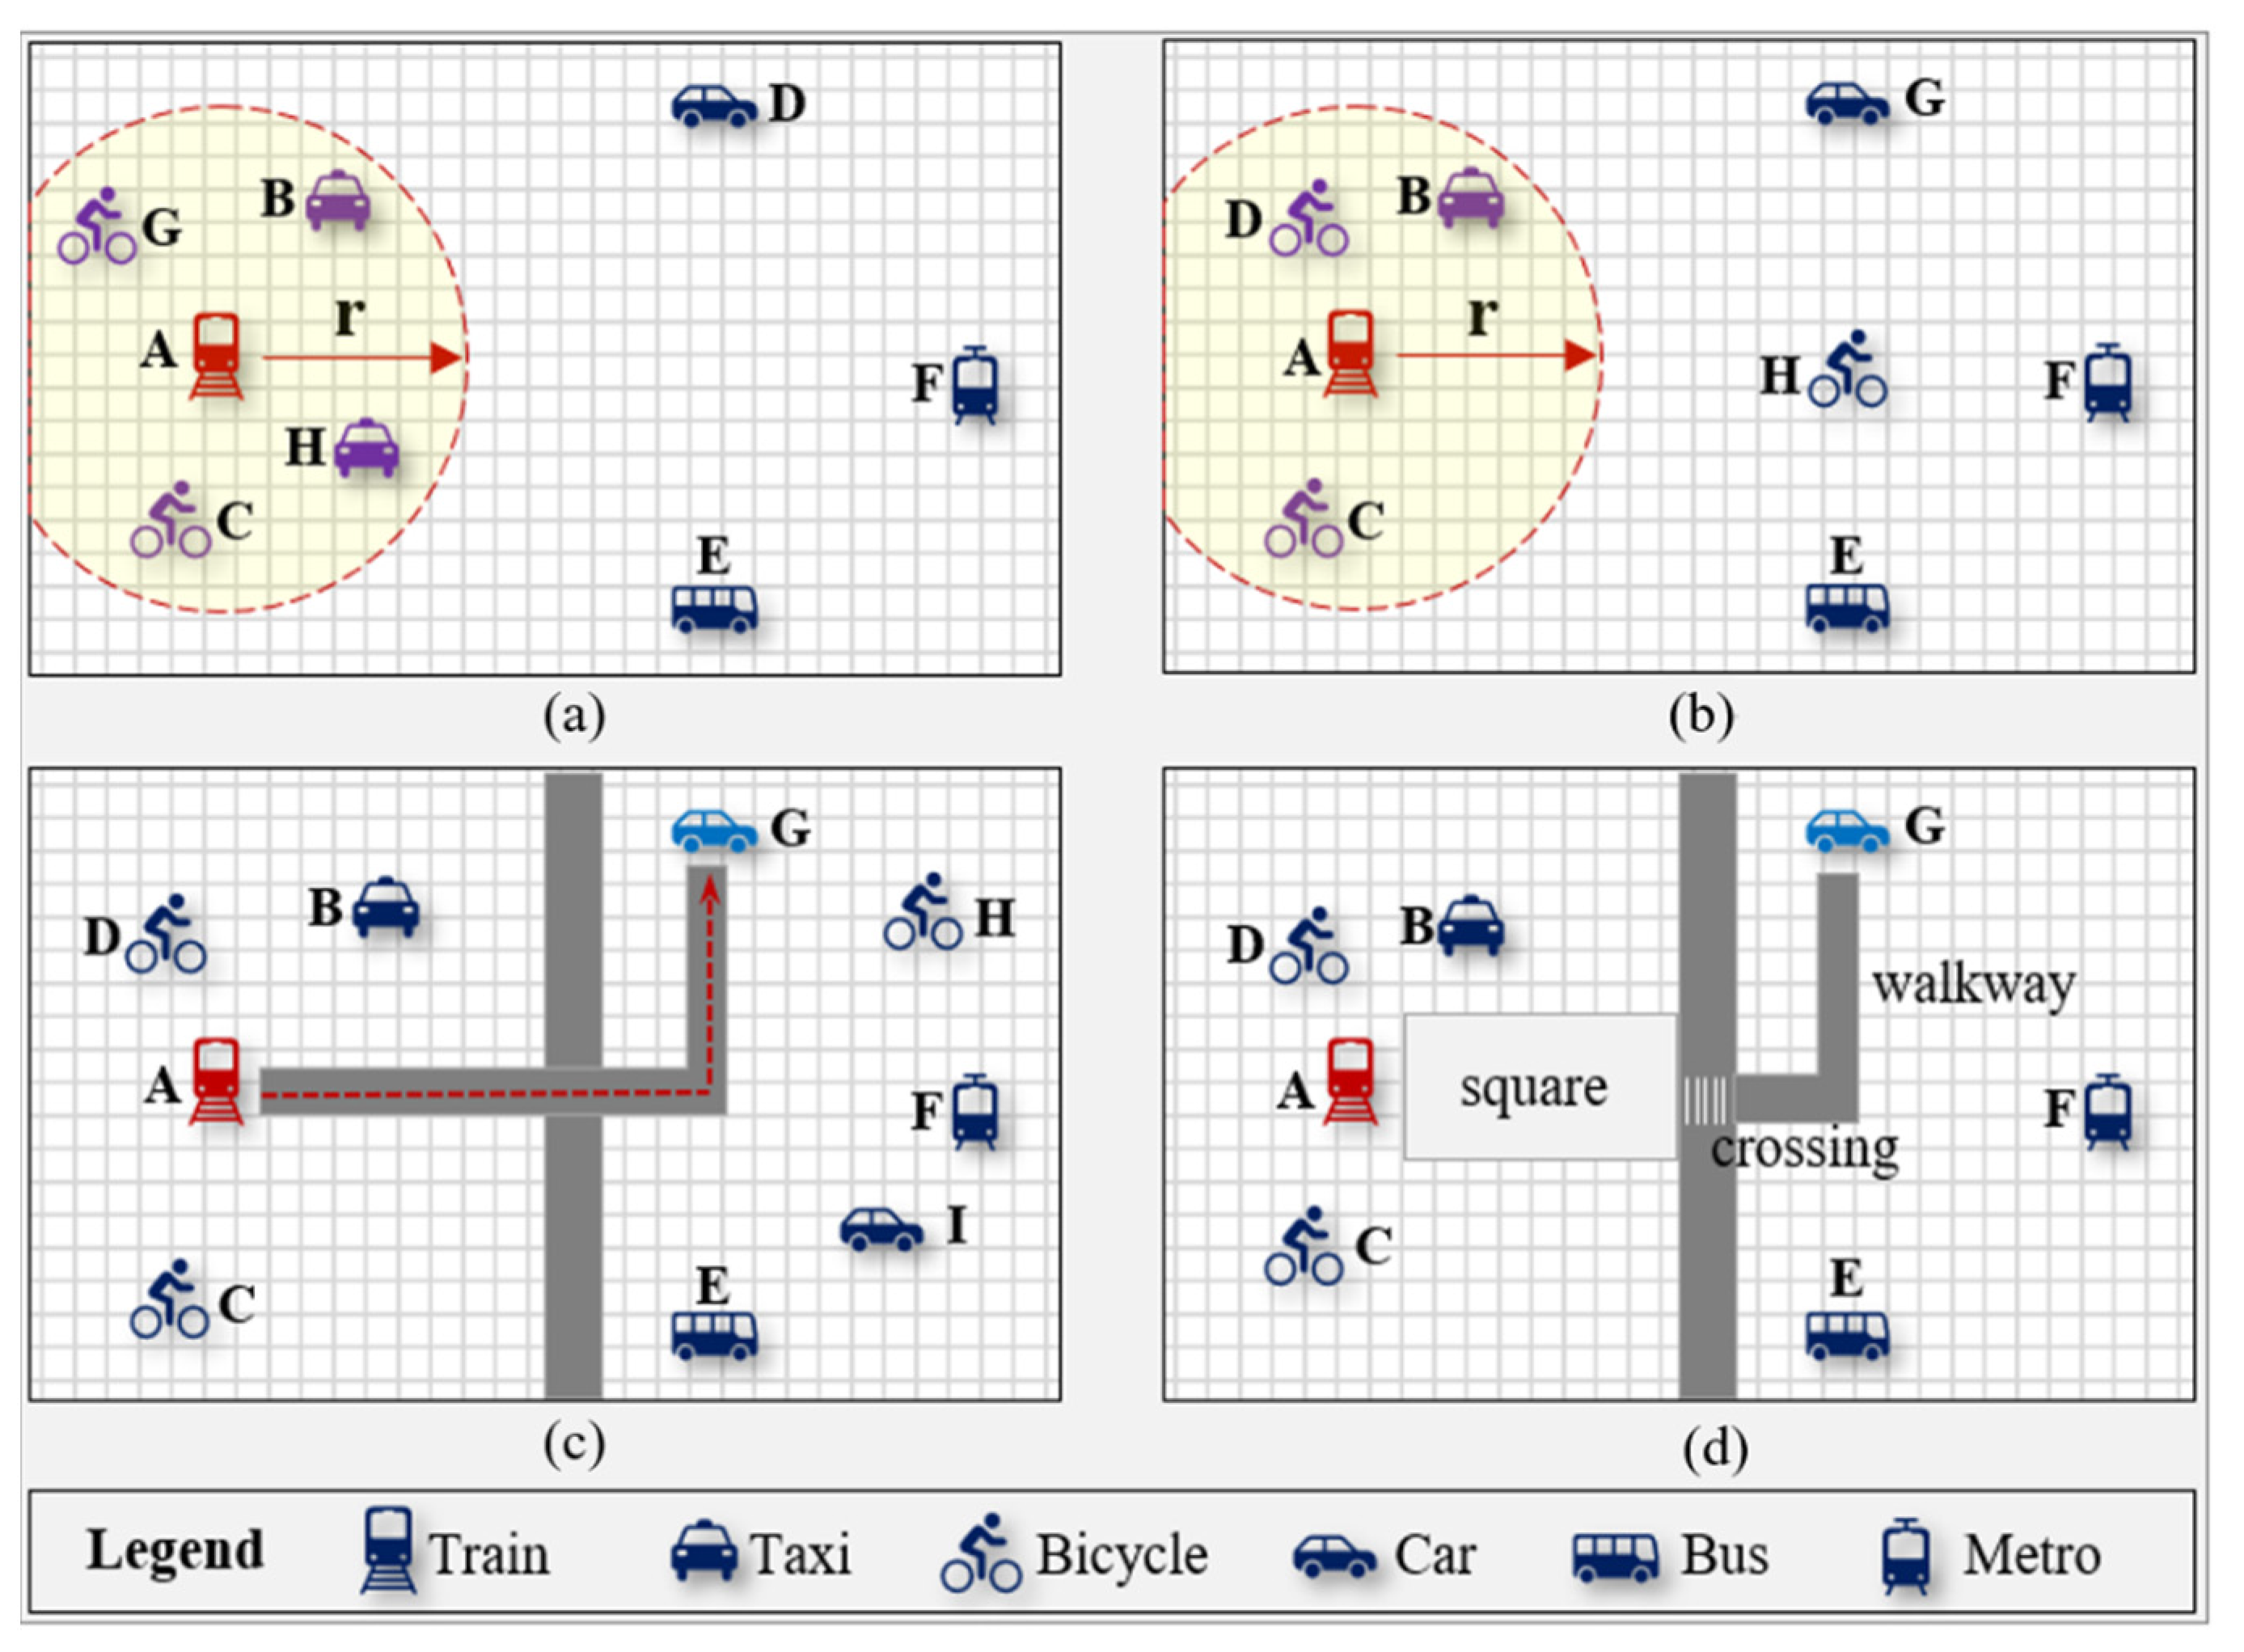
Figure 2.
Location of multiple transfer facility nodes of Lelylaan Station.
Figure 3.
Line chart of individual indicators for each transfer facility. (a) Diversity difference for 20 nodes; (b) Selectivity difference for 20 nodes; (c) Accessibility difference for 20 nodes; (d) Continuity difference for 20 nodes.
Figure 3.
Line chart of individual indicators for each transfer facility. (a) Diversity difference for 20 nodes; (b) Selectivity difference for 20 nodes; (c) Accessibility difference for 20 nodes; (d) Continuity difference for 20 nodes.
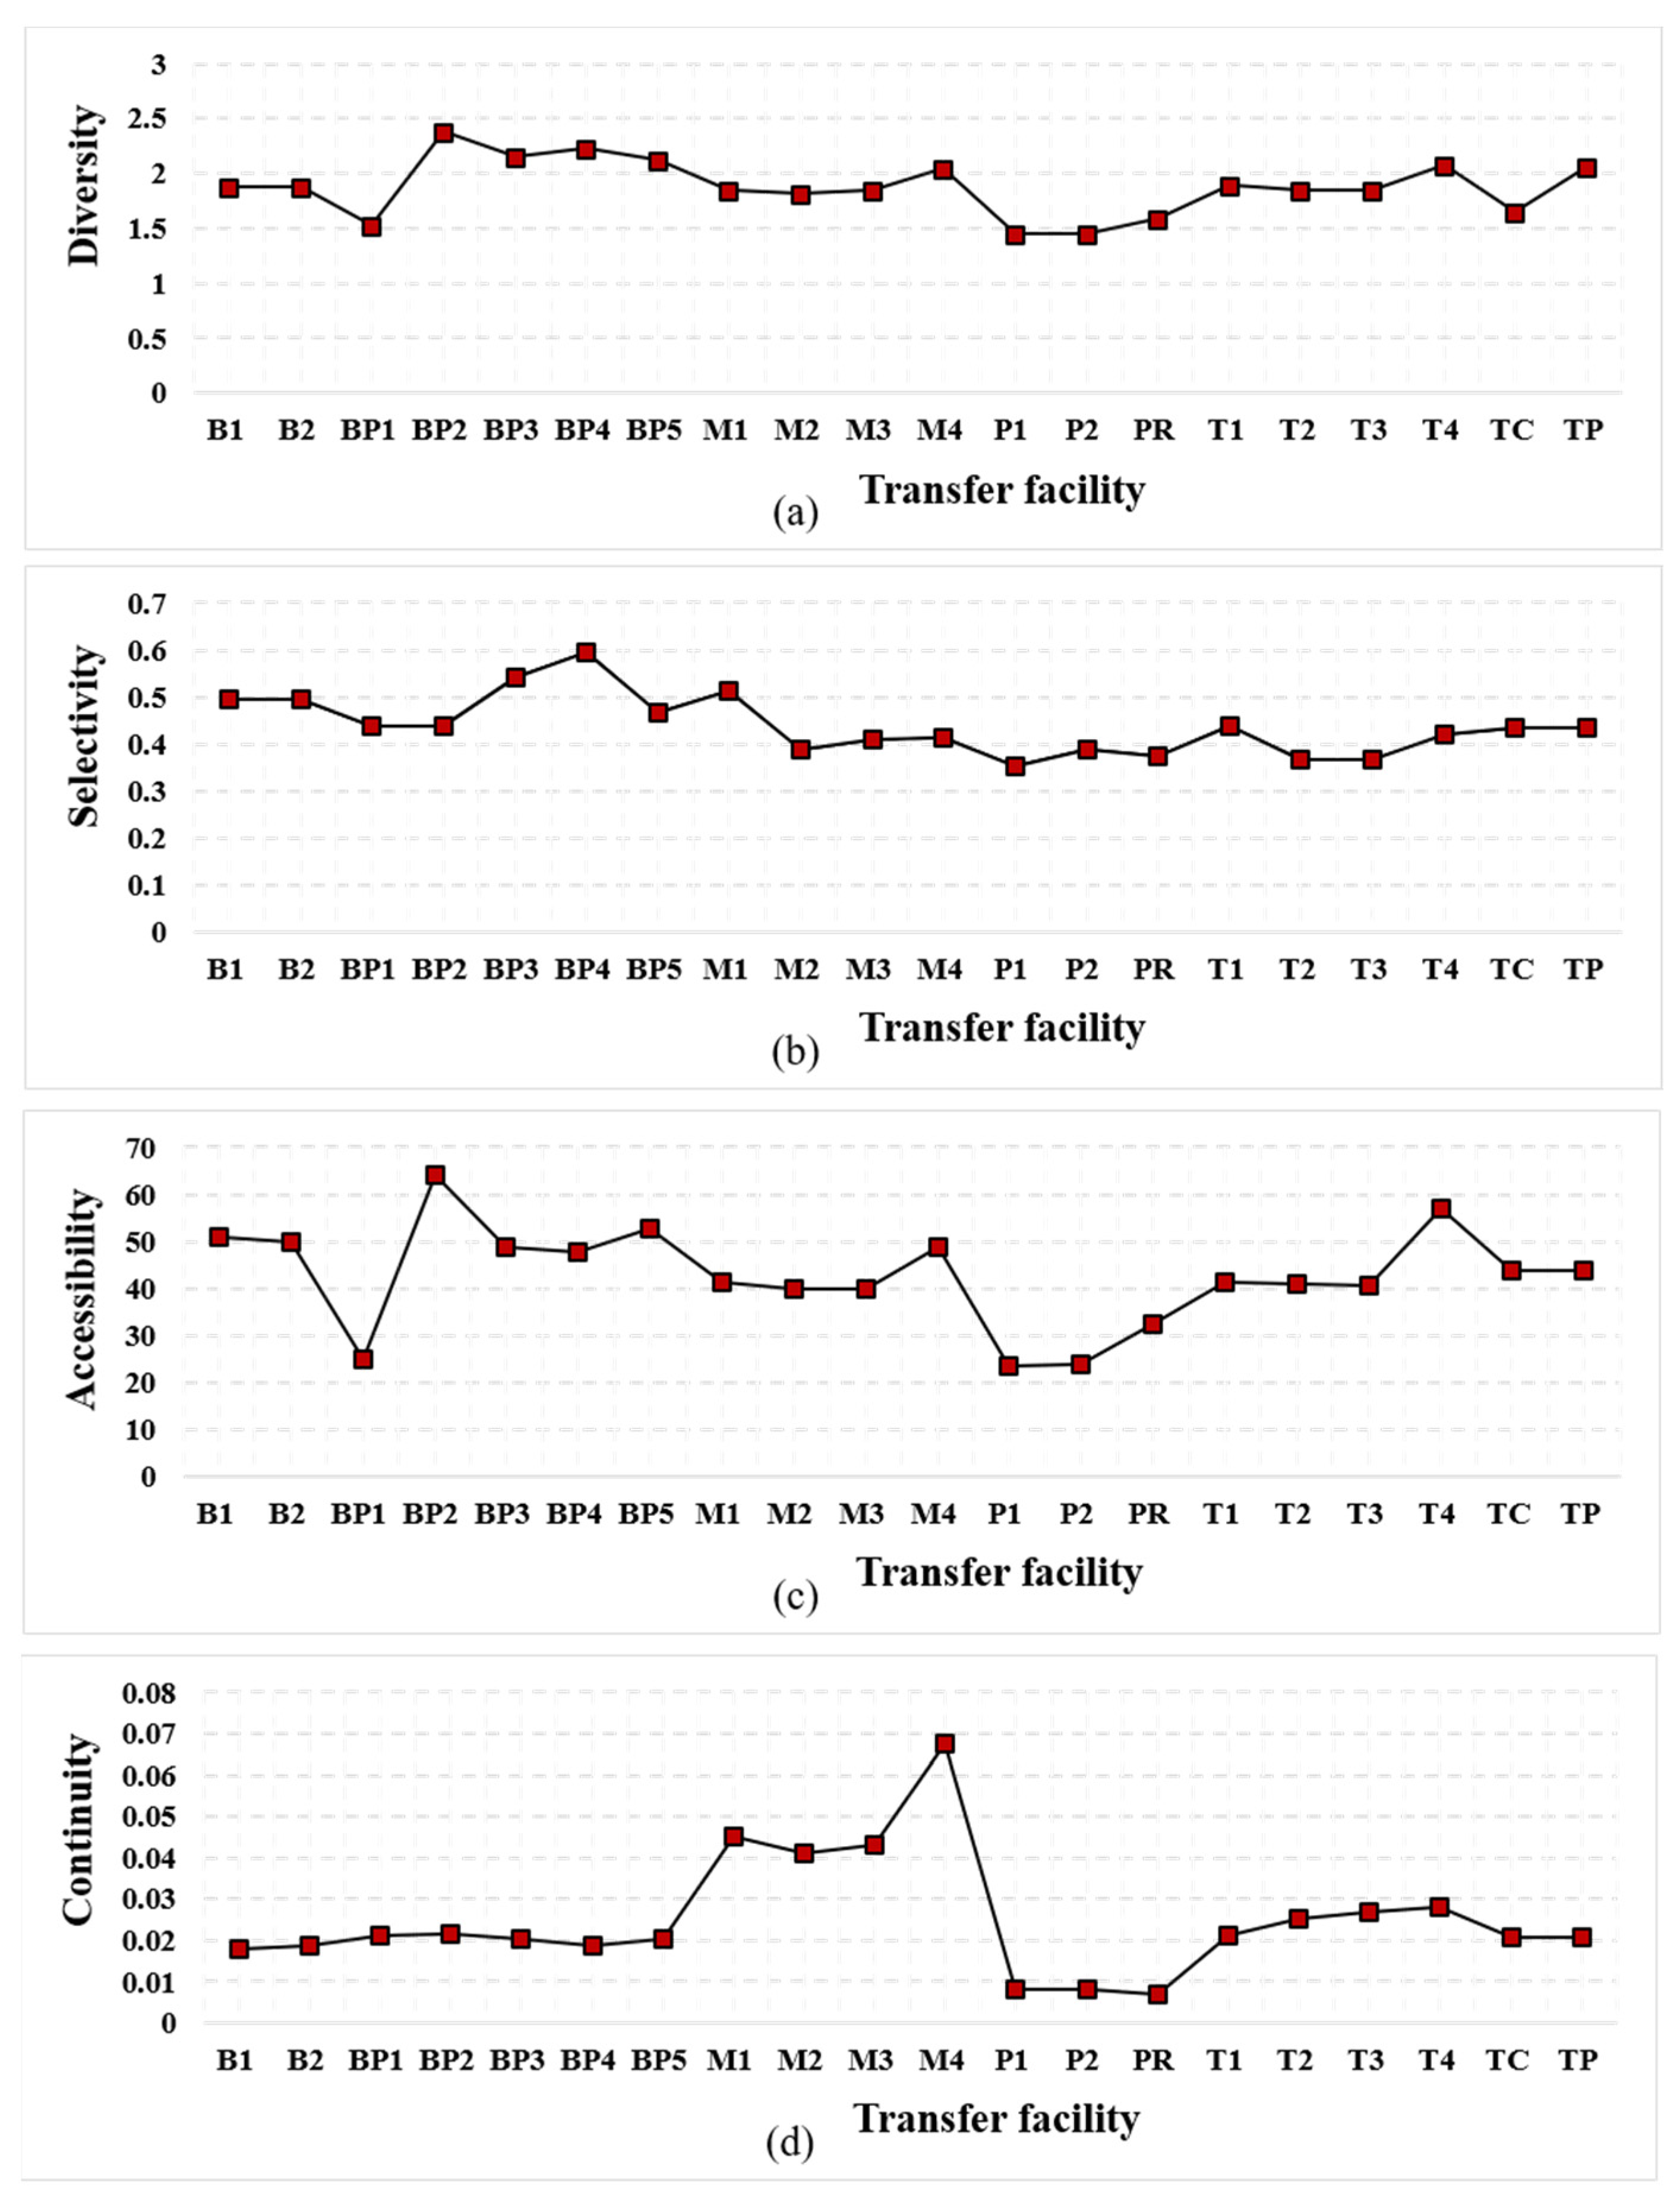
Figure 4.
Line chart of individual indicators for each type of transfer facility. (a) Diversity difference for 8 types of transport facility; (b) Selectivity difference for 8 types of transport facility; (c) Accessibility difference for 8 types of transport facility; (d) Continuity difference for 8 types of transport facility.
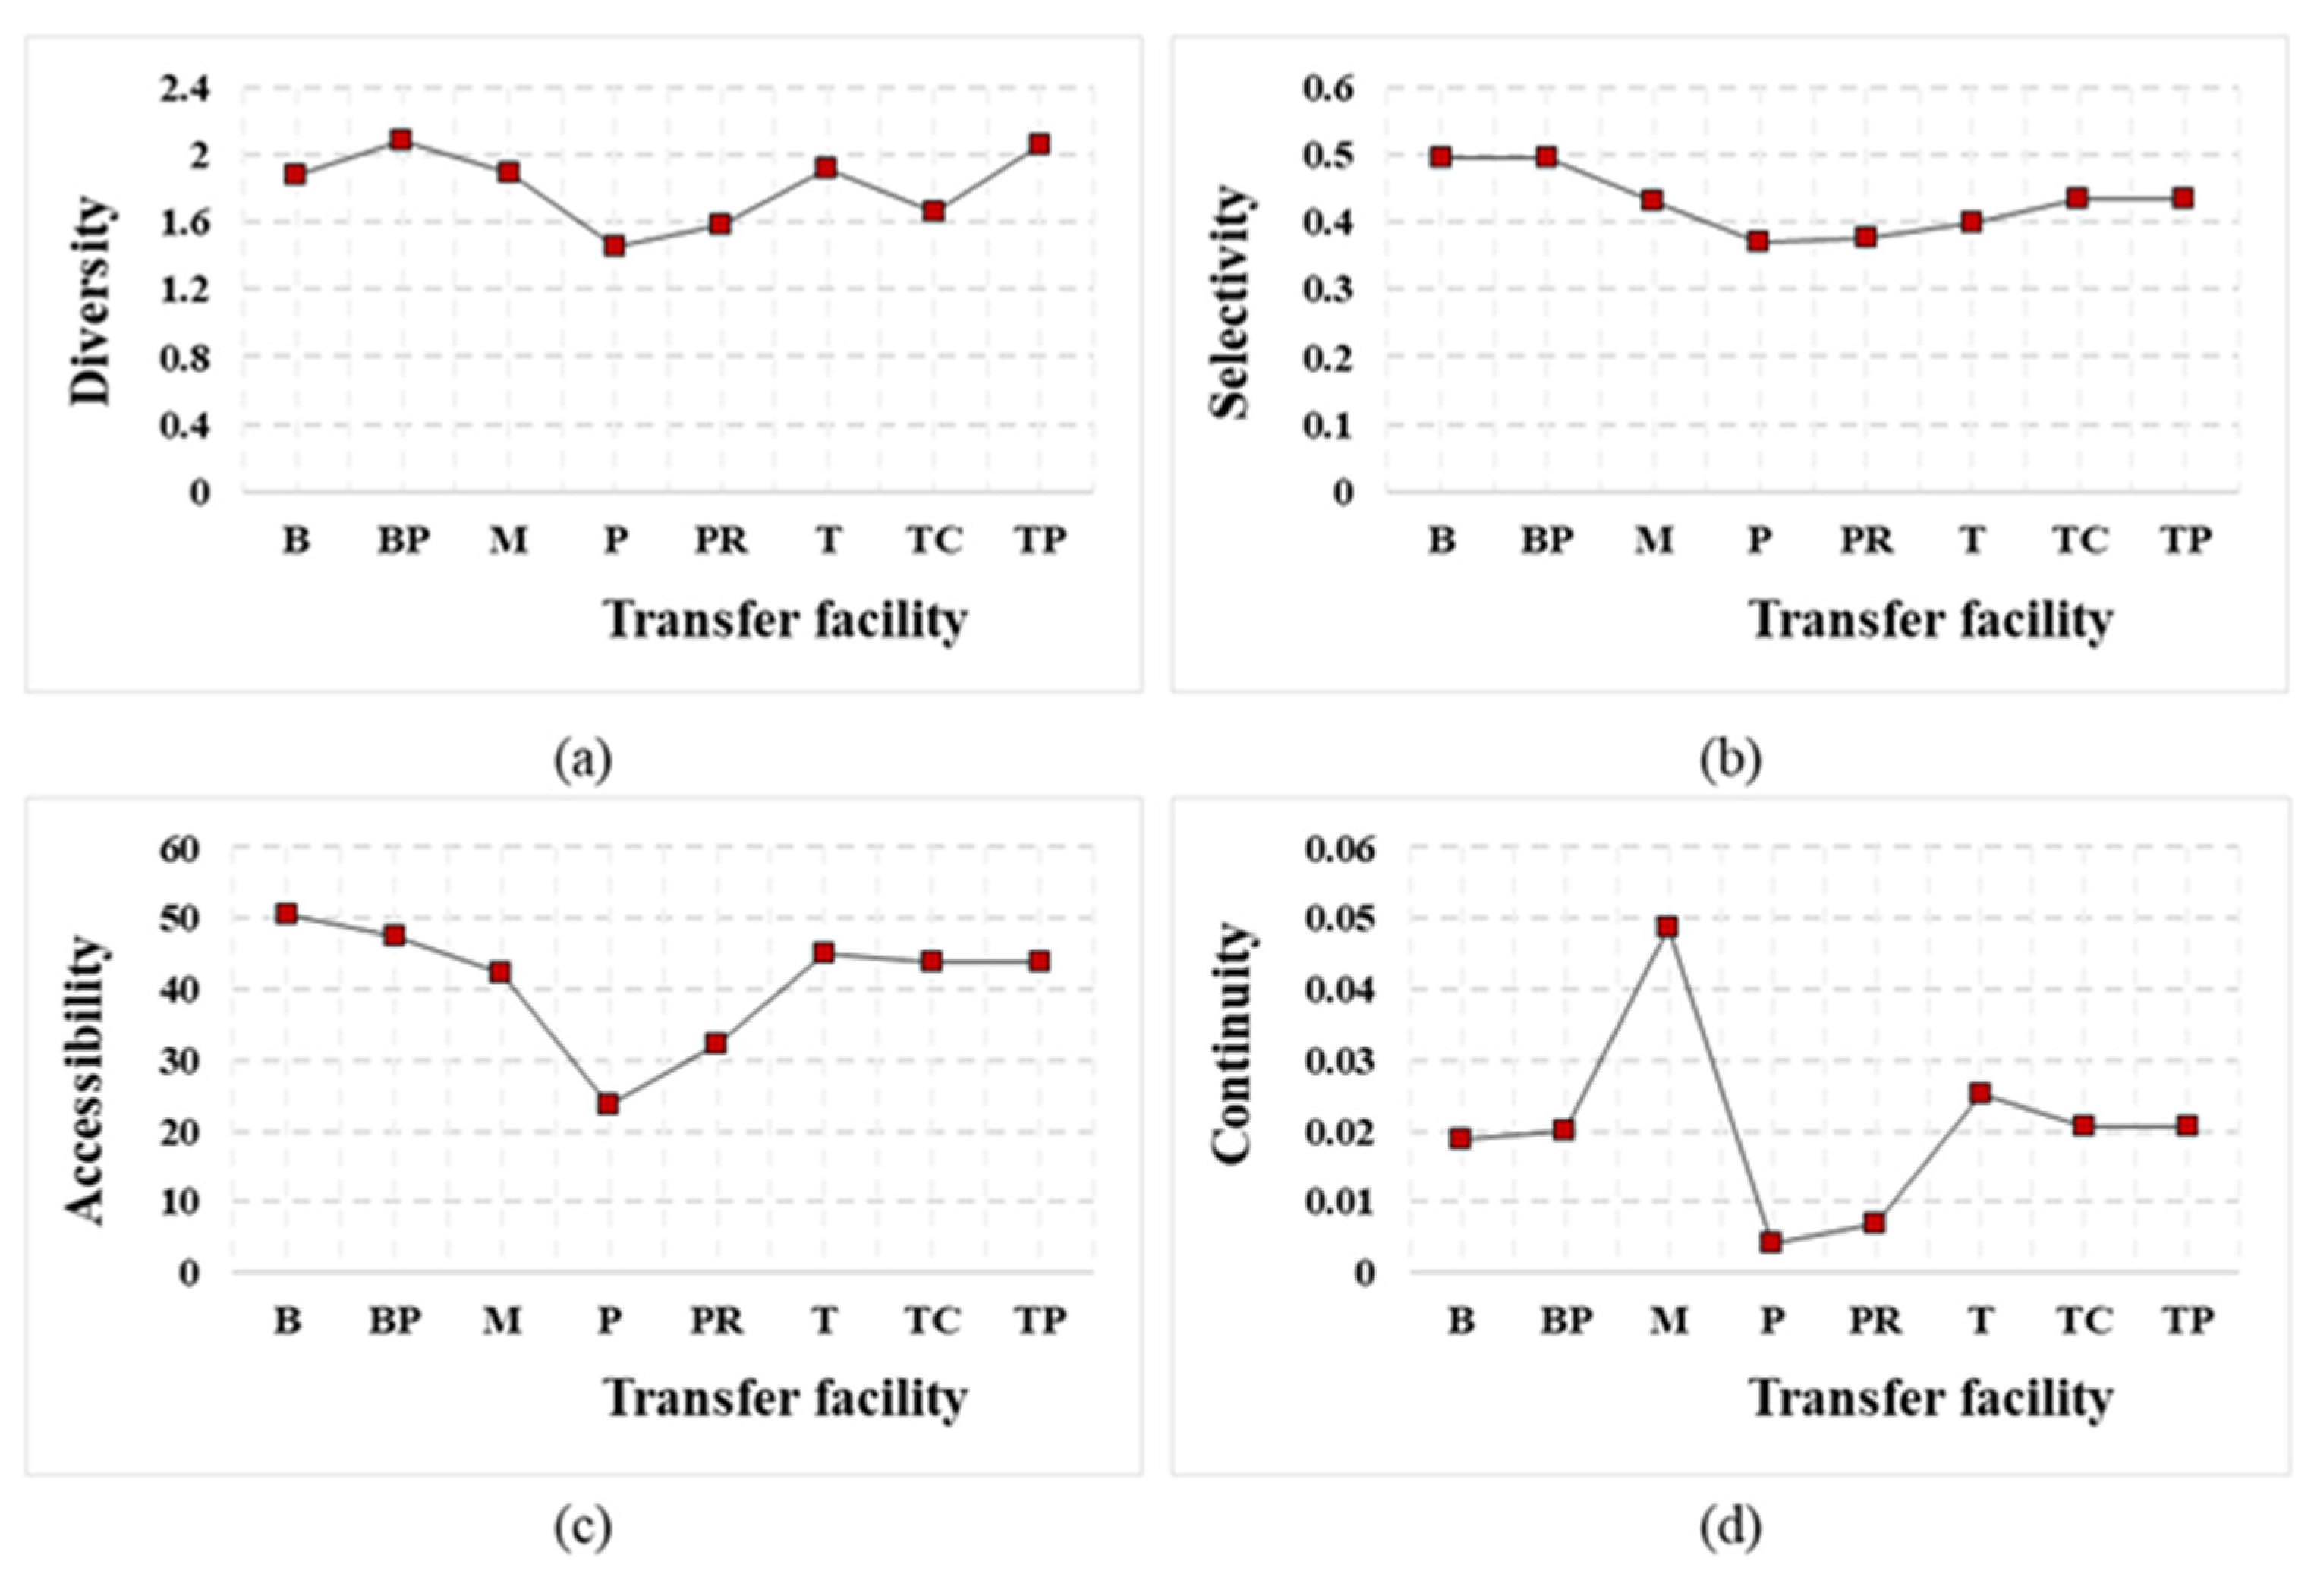
Figure 5.
Cluster analysis results based on the composite indicator.
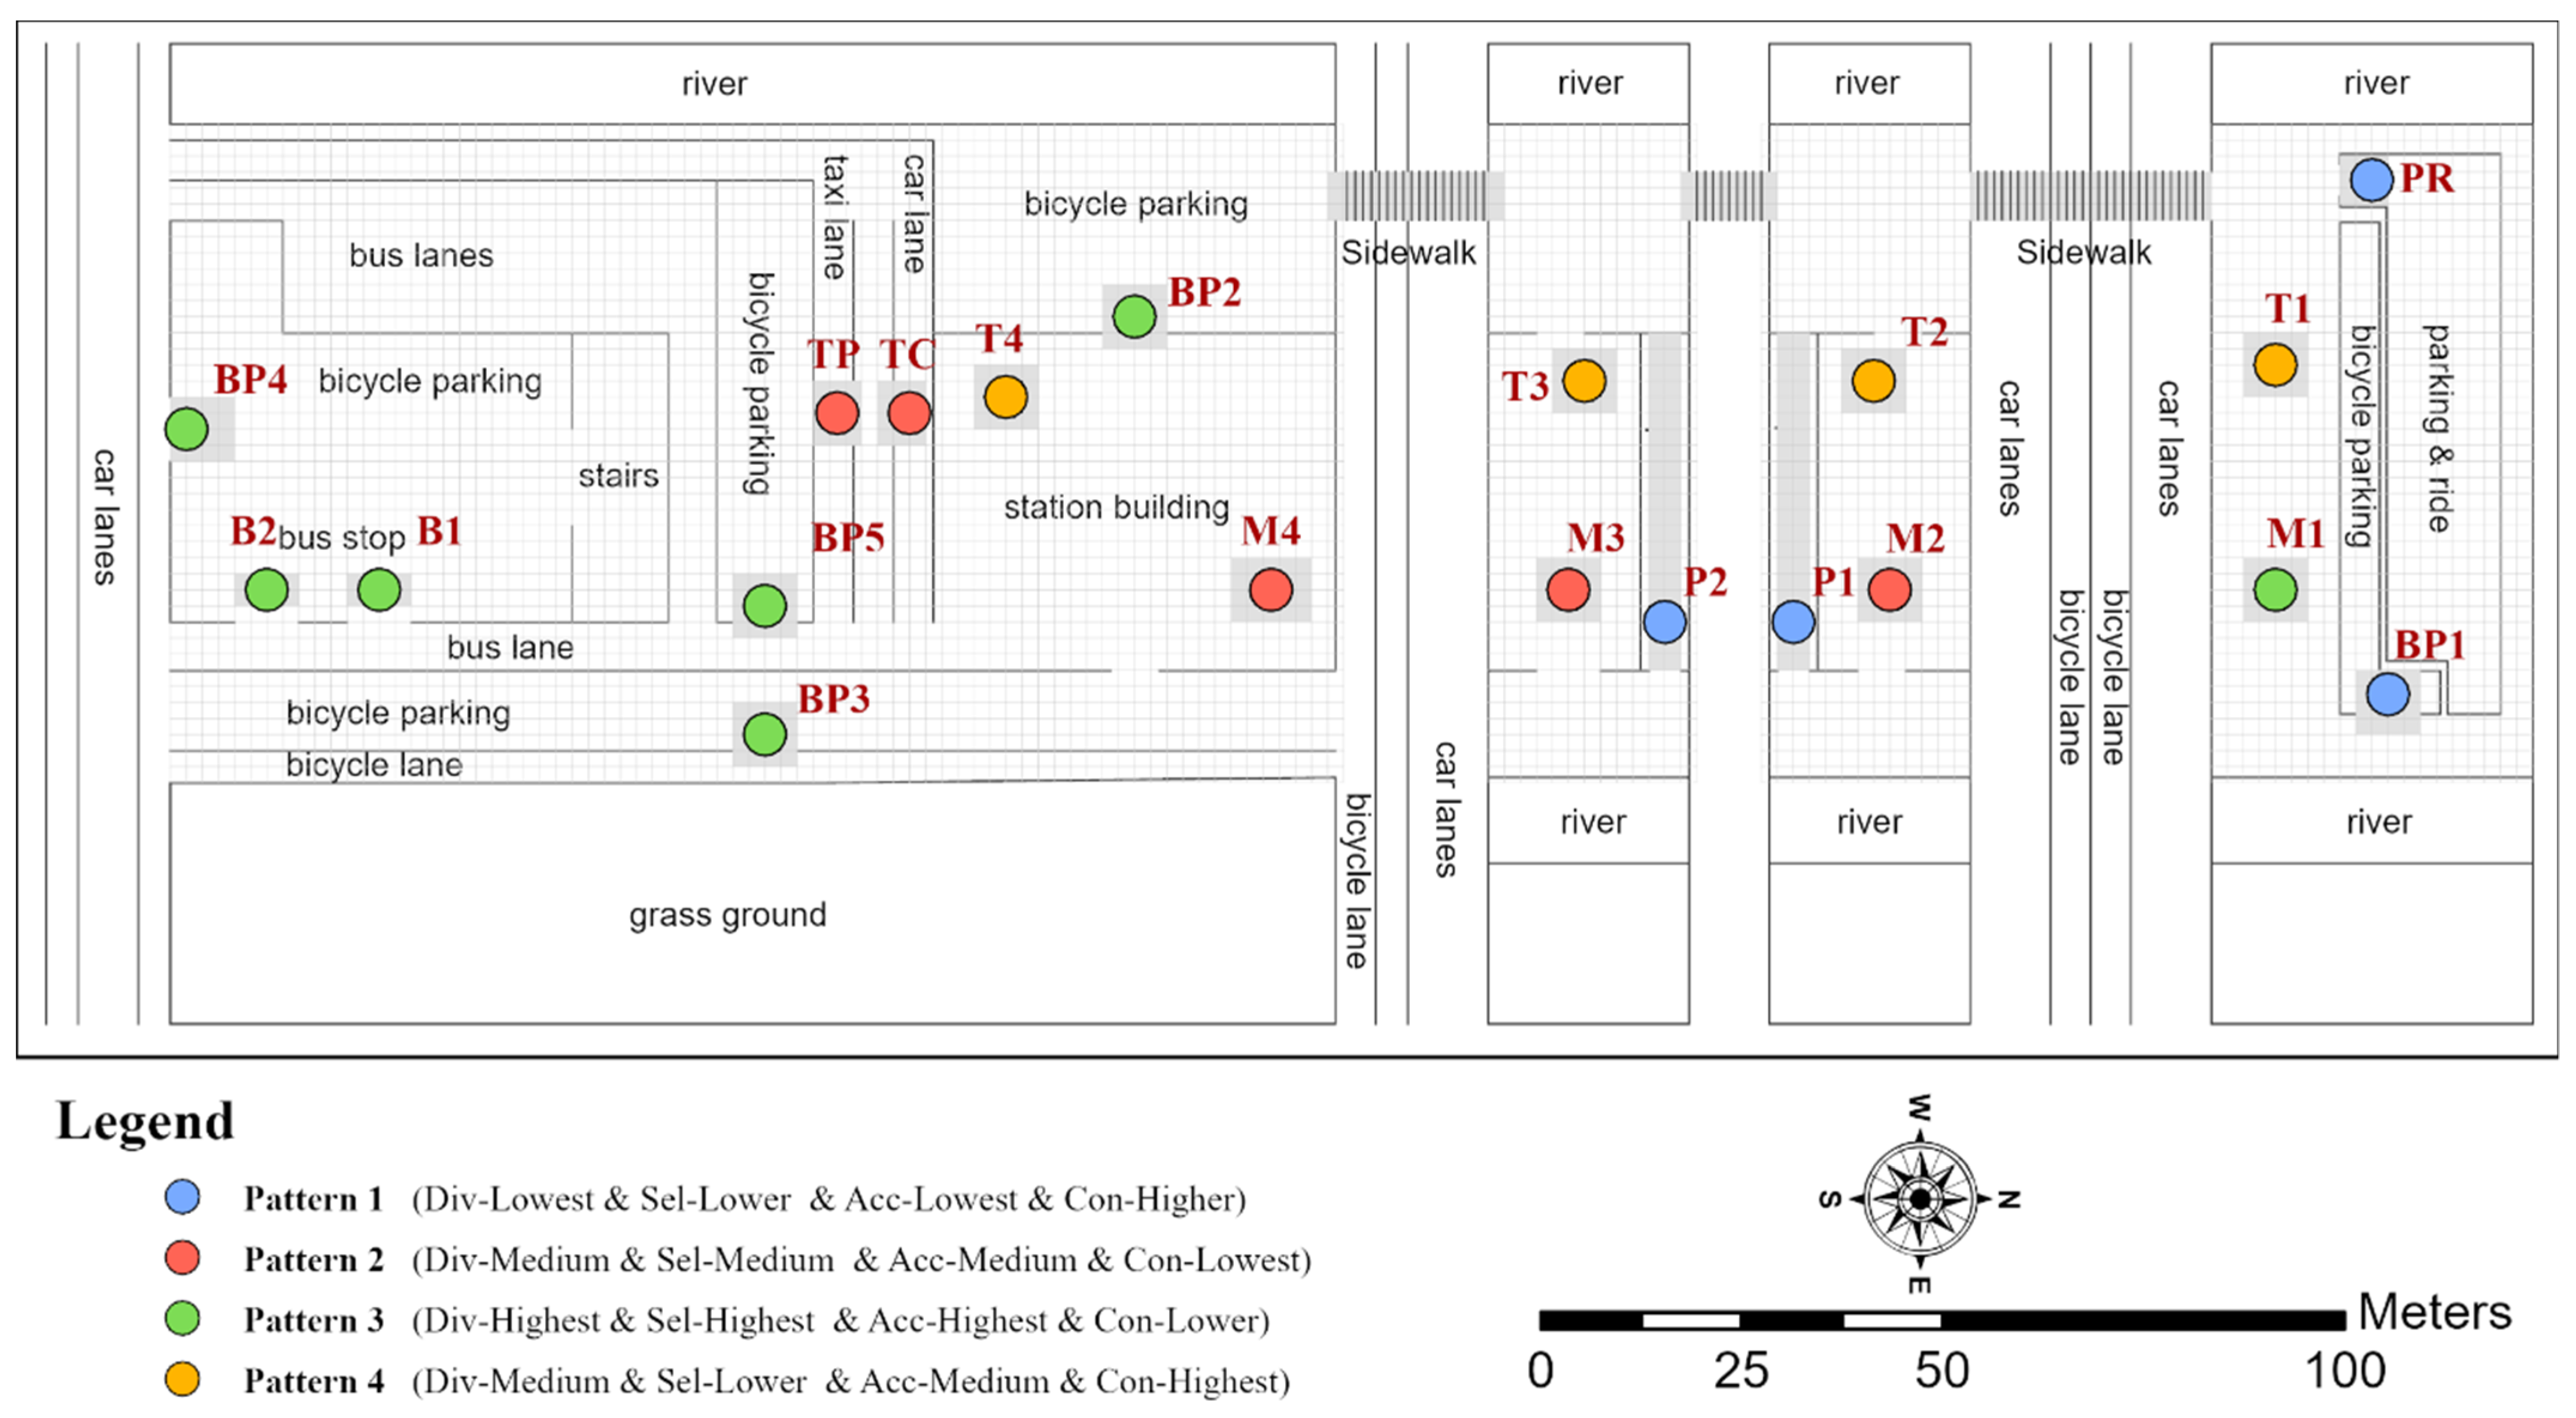
Figure 6.
Line chart of the cluster analysis results.
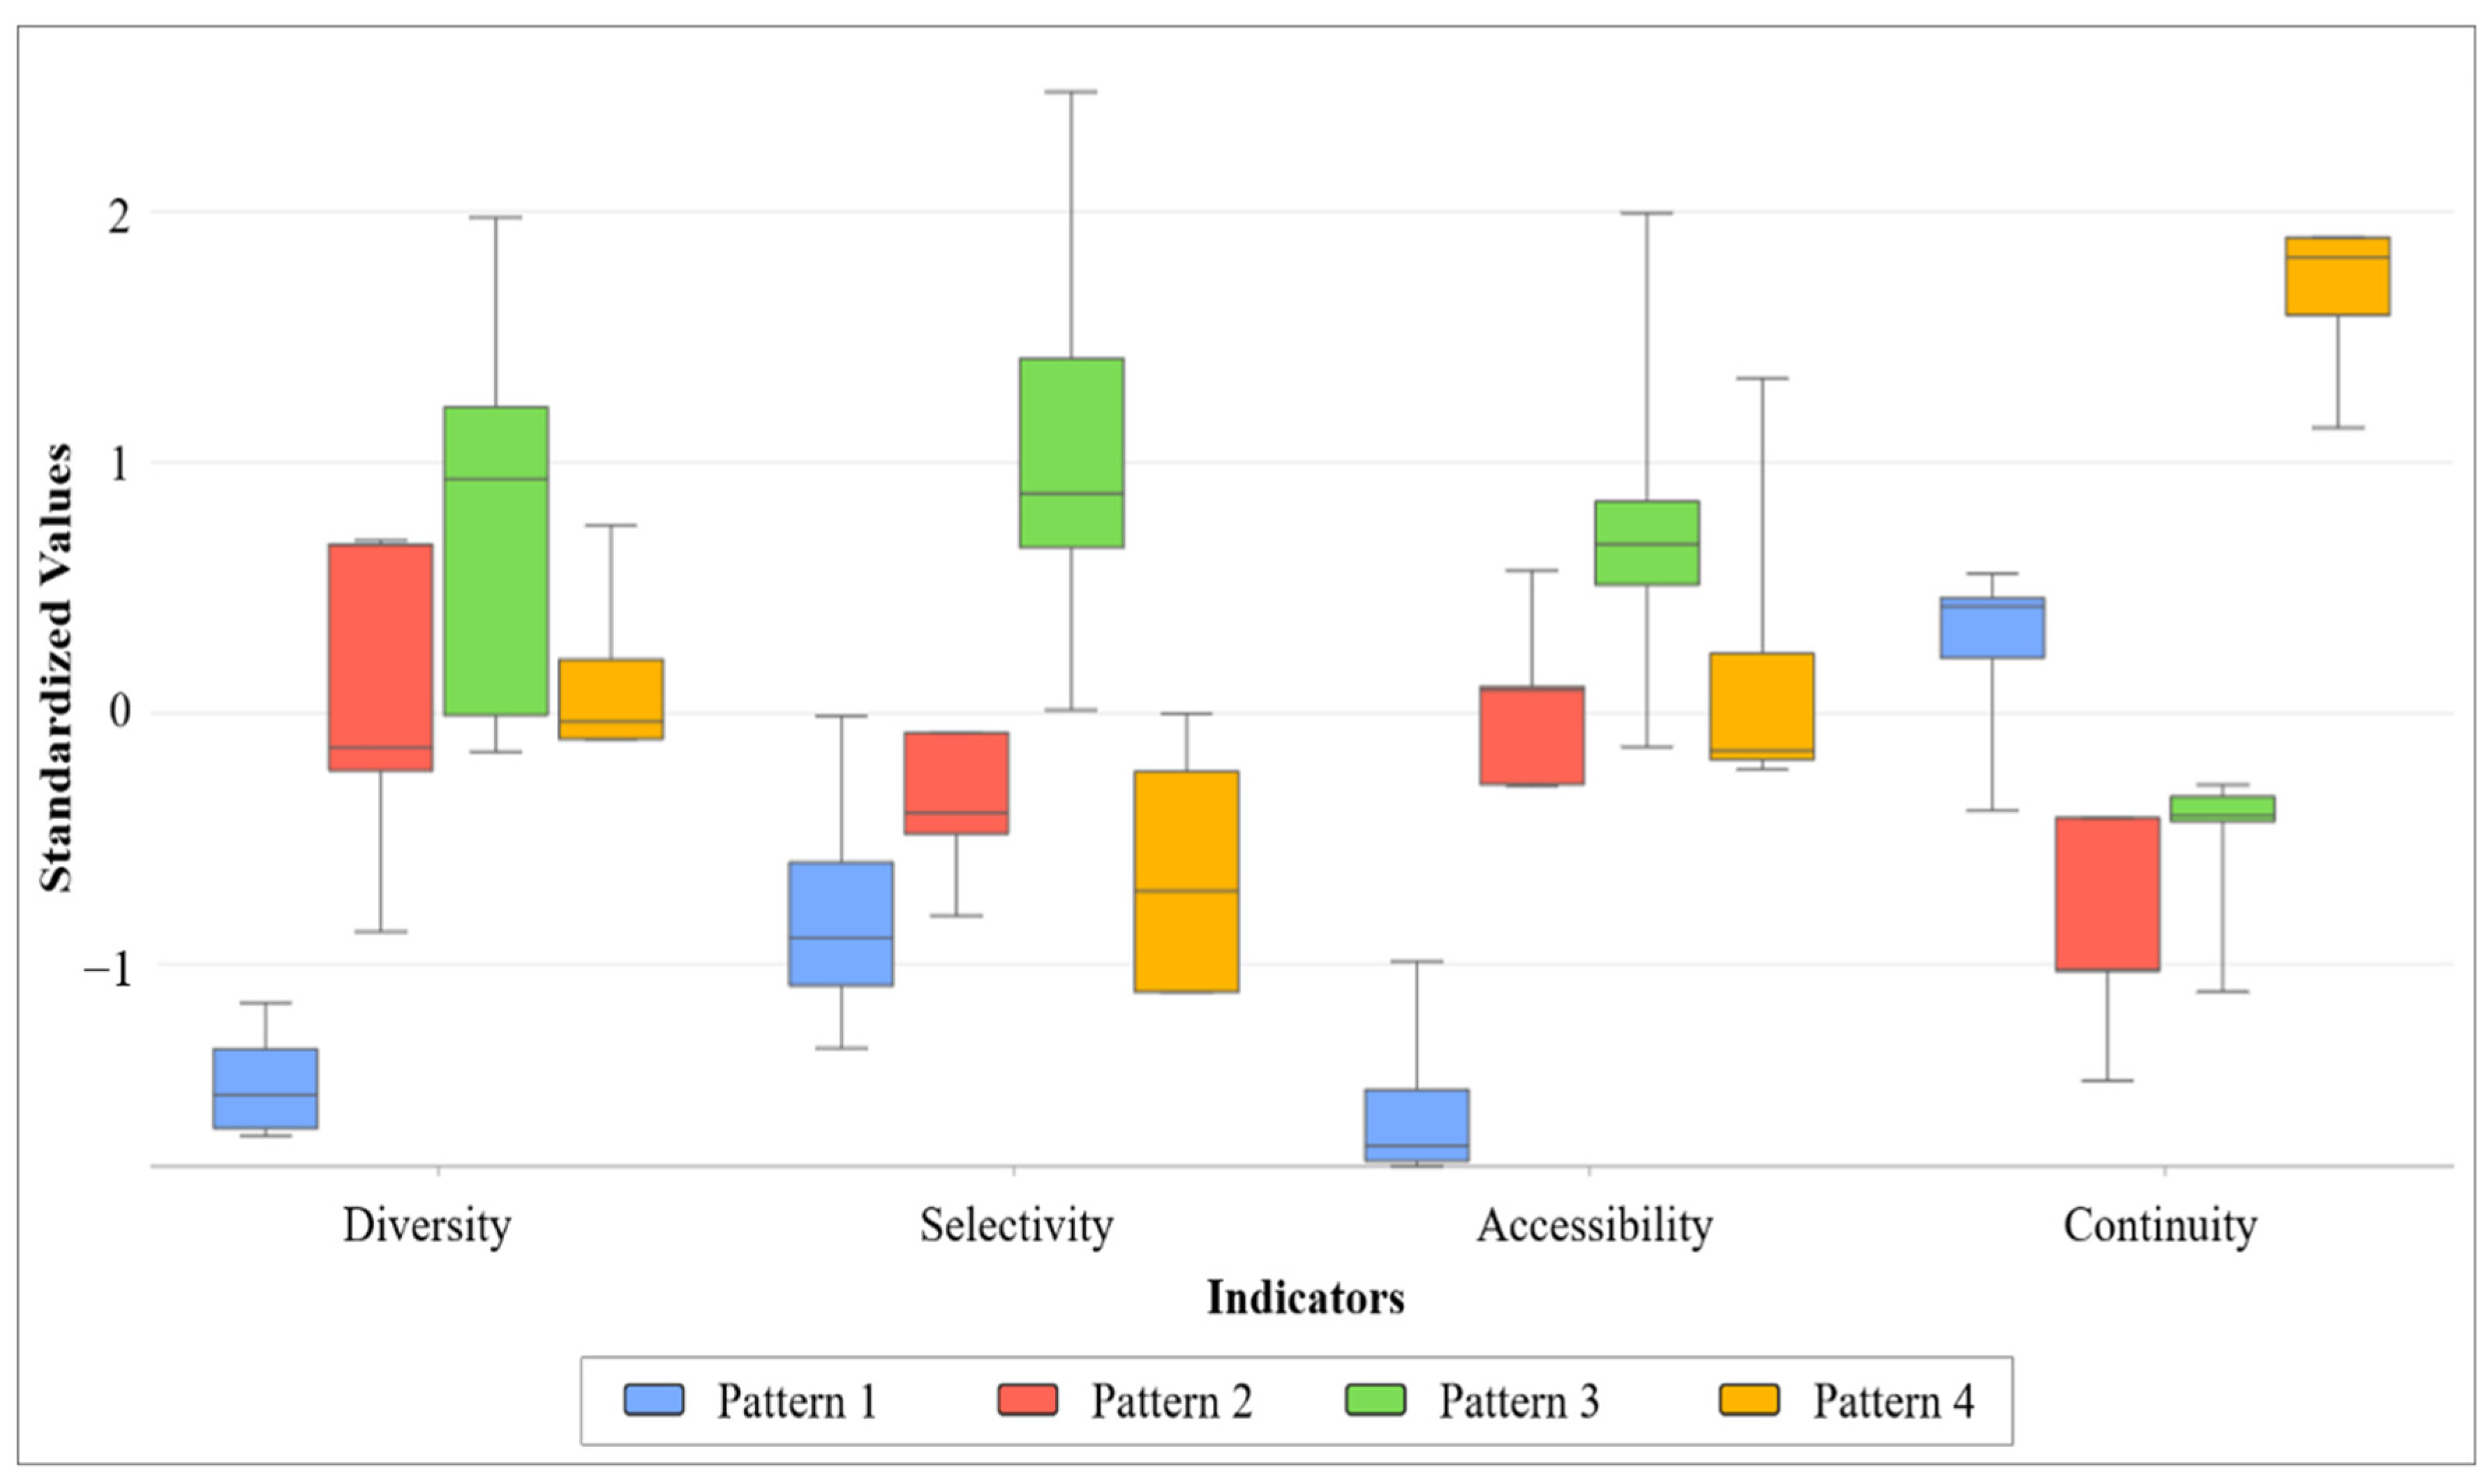
Figure 7.
Spatial distribution characteristics of DCC-MTF for each type of transfer facility.

Table 1.
Calculation of the entropy weight method.
| Step | Formula | Remarks |
|---|---|---|
| 2. The proportion of the sample i value of indicator j | ||
| 3. Calculation of entropy value e of indicator j | ||
| 4. Calculation of information entropy redundancy d | is, the more important the indicator is. | |
| 5. Calculation of the weight w of each indicator | ||
| 6. Calculation of the comprehensive score of each sample |
Table 2.
Abbreviation code of multiple transfer facilities in Lelylaan Station.
| Transfer Facility | Abbreviation Code | Transfer Facility | Abbreviation Code |
|---|---|---|---|
| Metro | M1, M2, M3, M4 | B&R | BP1, BP2, BP3, BP4, BP5 |
| Bus | B1, B2 | P&R | PR |
| Train | T1, T2, T3, T4 | Tram | P1, P2 |
| Taxi | TP | K&R | TC |
Table 3.
Entropy weight of each indicator.
| Indicator Type | Diversity | Selectivity | Accessibility | Continuity |
|---|---|---|---|---|
| Entropy weight | 0.926 | 0.929 | 0.908 | 0.903 |
Table 4.
Degree of coupling coordination for multiple transfer facilities.
| Transfer Facility | B1 | B2 | BP1 | BP2 | BP3 | BP4 | BP5 |
|---|---|---|---|---|---|---|---|
| DCC-MTF | 9.32 | 9.57 | 6.17 | 12.68 | 8.59 | 8.53 | 10.57 |
| Mean DCC-MTF | 9.45 | 9.31 | |||||
| Transfer Facility | M1 | M2 | M3 | M4 | P1 | P2 | PR |
| DCC-MTF | 9.62 | 9.15 | 9.06 | 9.46 | 7.01 | 6.75 | 6.9 |
| Mean DCC-MTF | 9.07 | 6.88 | 6.90 | ||||
| Transfer Facility | T1 | T2 | T3 | T4 | TC | TP | —— |
| DCC-MTF | 5.30 | 7.92 | 10.06 | 10.49 | 10.30 | 10.83 | |
| Mean DCC-MTF | 9.44 | 10.30 | 10.83 | ||||
Publisher’s Note: MDPI stays neutral with regard to jurisdictional claims in published maps and institutional affiliations. |
© 2022 by the authors. Licensee MDPI, Basel, Switzerland. This article is an open access article distributed under the terms and conditions of the Creative Commons Attribution (CC BY) license (https://creativecommons.org/licenses/by/4.0/).
Share and Cite
MDPI and ACS Style
Chen, L.; Zhang, H.; Lu, W. Assessment of the Interconnection for Multi-Transfer Facilities: A Perspective from Coupling Coordination. Sustainability 2022, 14, 5803. https://doi.org/10.3390/su14105803
AMA Style
Chen L, Zhang H, Lu W. Assessment of the Interconnection for Multi-Transfer Facilities: A Perspective from Coupling Coordination. Sustainability. 2022; 14(10):5803. https://doi.org/10.3390/su14105803
Chicago/Turabian StyleChen, Lijun, Haiping Zhang, and Weike Lu. 2022. "Assessment of the Interconnection for Multi-Transfer Facilities: A Perspective from Coupling Coordination" Sustainability 14, no. 10: 5803. https://doi.org/10.3390/su14105803
Note that from the first issue of 2016, this journal uses article numbers instead of page numbers. See further details here.