
A Field Study on the Law of Spatiotemporal Development of Rock Movement of Under-Sea Mining, Shandong, China

1
Key Laboratory of Shale Gas and Geoengineering, Institute of Geology and Geophysics, Chinese Academy of Sciences, Beijing 100029, China
2
Innovation Academy for Earth Science, Chinese Academy of Sciences, Beijing 100029, China
3
University of Chinese Academy of Sciences, Beijing 100049, China
*
Author to whom correspondence should be addressed.
Sustainability 2022, 14(10), 5864; https://doi.org/10.3390/su14105864
Submission received: 17 March 2022
/
Revised: 8 May 2022
/
Accepted: 11 May 2022
/
Published: 12 May 2022
(This article belongs to the Topic Mining Safety and Sustainability)
Abstract
:The phenomenon of rock movement in mining areas has always been a difficult problem in mining engineering, especially under complicated geological conditions. Although the backfilling method mitigates the destruction of the surrounding rock, deformation can still exist in the mining area. In order to ensure the safety of under-sea mining, it is necessary to study the rock movement laws and the mechanisms. This paper focuses on a settlement analysis of the monitoring data of the No. 55 prospecting profile. By analyzing the shape of the settlement curves, the spatial distribution characteristics of settlements of different mining sublevels are summarized. Additionally, the fractal characteristics of the settlement rate under different space–time conditions are studied. We also discuss the relationship between the fractal phenomenon and the self-organized criticality (SOC) theory. The findings are of great theoretical value for the further study of mining settlements to better understand the physical mechanisms of internal movement and rock mass failures through the fractal law of the settlement. Furthermore, elucidating the rock movement law is an urgent task for the safety of seabed mining.
1. Introduction
Rock movement of different degrees often occurs in mining areas due to the disturbance of mining activities [1,2,3,4]. The movement, deformation, and destruction of rock masses caused by underground mining activities may further lead to ground subsidence which has caused growing social stability and ecological problems worldwide [5,6,7]. Therefore, many scholars have been attaching great importance to the study of rock movement phenomena; they have proposed relevant theories and numerical models [8,9,10]. They have conducted much research on rock movement law and relevant profound theories from different perspectives [8,11,12,13]: geometric theory, mechanical theory, and mathematical–statistical theory, for instance, the geometric method [14], the circular integral grid method [15], key strata theory [16,17], random medium theory [18], numerical methods [19,20], and fractal theory [21,22]. In addition, a large number of numerical models have emerged, including the Knothe function model [23], the visco-elastic model [24], the anisotropic material model [25], FDM predictive methodology of subsidence [26], the improved Knothe function [27,28,29], the “four-zone” model [30], and the improved key stratum theory [31]. Regarding fractal theory, the fractal concept was created in 1967 [32]. For the study object, if there is a power-law (or scaling-law) relationship between some of its variables within a certain range, it is considered to have a fractal phenomenon [33,34]. The power-law and fractal theory are closely linked and complement each other. The fractal theory has been widely applied in social sciences [35], agriculture [36], geography [32], geology [37,38], and other fields in recent years. Although the application of fractal theory in geological science started relatively late, it shows strong vitality and broad application prospects due to its powerful expression and concise form. Most geological phenomena are fractal in the statistical sense. In addition, the research and exploration of rock mechanics have also benefited from the development of fractal theory [22,35,36], for instance, in the study of the fractal characteristics of land subsidence [16] and the acoustic emissions of rock mass [37,38,39]. Fractal theory is widely used to guide production practices.
In summary, rock movement theory continues to develop and mature. However, most mining-induced rock movement studies focus on coal mines; the problem of rock movement caused by the mining of high-dip metal deposits on the seabed is little studied, especially in the presence of faults [40,41,42,43,44]. As one of the popular mining methods, backfill mining is increasingly applied in China and other mining countries. The filled materials consolidate and compress together with the surrounding rock, and the stress of the surrounding rock gradually shifts to the filling body over time. Finally, the mine reaches a state of equilibrium. However, the movement of the surrounding rock is inevitable, which is affected by the mining operation, the low-stiffness filling body, the filling method, the existence of unfilled void spaces, and repeated mining activities [10,45,46]. Severe rock movement or even surrounding rock damage can pose a great threat to the safety of mining personnel and mining production activities. Nonlinear scientific theories are increasingly widely used in geological hazard evaluation and prediction [47,48,49,50,51]. Some scholars have used the self-organized criticality (SOC) theory to analyze the progressive failure process of rocks under stress. We know that many natural phenomena exhibit fractal features, and geological phenomena are no exception. As for the physical mechanisms underlying the fractal phenomenon, the self-organized criticality (SOC) theory offers a better explanation of the characteristics of nonlinear complex systems [47,48,51]. Simply put, SOC means that a system will spontaneously evolve to a critical state. The stratum is in a dynamic equilibrium state before excavation. The excavation process breaks the equilibrium and leads to changes in the energy, so the stratum instinctively adjusts itself and organizes itself to reach a new equilibrium through the adjustment of stress and deformation.
In this study, we used the following methods to explore the law of rock movement produced by mining high-dip seabed deposits. We took the No. 55 prospecting line of the Xinli mining area as the study object, summarized the deformation characteristics of various sublevels (−200 m sublevel, −240 m sublevel, −320 m sublevel, −400 m sublevel, −480 m sublevel, and −600 m sublevel), analyzed the vertical settlement rate using fractal theory, and studied the possible deformation mechanism using the self-organized criticality (SOC) theory. Hereafter, further studies on the mechanisms of rock movement phenomena caused by mining high-dip deposits will be conducted, including physical simulation and numerical simulation research.
2. Study Area
2.1. Geographical Environment and Geology
The Xinli mining area of the Sanshandao gold deposit is the first hard rock mine that belongs to the under-sea deposit in Shandong province, China. It is located in Laizhou bay, Laizhou city, bordering the Bohai Sea in the northwest and connected to the land in the southeast (Figure 1). Many scholars have conducted much research on it [52,53,54,55]. The study area belongs to the continental semi-humid climate of the temperate monsoon region. In addition, it has both oceanic and continental climate characteristics. The annual average temperature is 12.5 ℃, and the precipitation is 612.1 mm [56].
The study area is located to the east of the Tan–Lu fault, the north-limb of the Qixia anticlinorium, and the northeastern part of the Sanshandao–Cangshang fault zone. As for the Xinli mining area, the gold-bearing alteration zone is 1300 km long in the strike, and its width varies from 70 to 185 m. It is produced in a relatively simple large vein shape, with a stable occurrence and good mineralization continuity. The altered rocks are zoned along the strike and inclination. From top to bottom, the altered rocks are pyrite sericite granite, pyrite sericite granitic cataclysm, fault gouge (existing below the main fracture), pyrite sericite cataclysm, pyrite sericite granitic cataclysm, and pyrite sericite granite. The pyrite-sericite cataclysm zone in the range of 0–35 m below the main fracture has the strongest alteration and gold mineralization, and it is also the location of the main ore body. The quaternary sediments are distributed in the shallow part of the surface, exposed in the southeast, with a thickness of 16–46 m, with sandy clay, fine sand, medium-coarse sand, and coarse gravel. The sedimentary sequence is diverse, and the regularity is poor [57]. The direction of the maximum principal stress is roughly the horizontal direction (NWW), and its value is greater than the self-weight stress of the rock mass [7]. There are three main faults (F1, F2, and F3) and some typical secondary joints in the study area (Figure 2). The gold ore body is an altered rock type gold deposit controlled by the F1 fault (a reverse fault), whose strike is 40° and the dip angle is about 38°. The F2 fault (a normal fault) lies west of the F1 fault, with a strike of 15° and a dip angle of 80°. The F3 fault (a strike-slip fault) stretches northwest to the sea and southeast to the continent, with a strike of 300° and a dip angle of 90°.
2.2. Mining Situation
The Xinli mining area of the Sanshandao gold deposit began its basic construction in 2005, with a designed production capacity of 1500 t/d. The Xinli mining area adopted the mechanical upward horizontal slice stopping-filling method with pointed pillars. In order to improve production efficiency, simultaneous upward mining in several sublevels has been designed. The mining activities are conducted from bottom to top by slicing and filling at a slice height of 2.5 m. After the excavation, the mined-out area is immediately backfilled with hardened solids mixed with mineral tailings and cement slurry (binder). The stope length is 100 m, and its width is the thickness of the ore body. Three vertical shafts and one return air shaft have been established in the mining area, and several sublevels (−200 m, −240 m, −320 m, −400 m, −480 m, and −600 m.) have been developed (Figure 3). In addition, a transportation roadway was developed at −440 m; a water silo, pump room, and power distribution room at −600 m; and a fine ore recovery roadway at −667 m.
3. Methodology
3.1. Displacement Monitoring of the Roadway
In August 2015, a settlement monitoring system was established in the Xinli mining area. In the whole mine, only the No. 55 prospecting profile line passes through the ore body vertically from the hanging wall, that is, perpendicular to the mining direction, forming the most favorable monitoring space conditions (Figure 2). Compared with other profiles, the monitoring network of the No. 55 prospecting profile is relatively complete, covering several sublevels of different depths. The monitoring network is mainly deployed in several sublevels of the No. 55 prospecting profile and other roadways, and the number of monitoring points exceeds 250 (Figure 4); the monitoring intervals are usually one or two months. All of the monitoring uses the fourth-level leveling method. A leveling survey is a method used to determine the height difference between different points on the ground by using instruments (such as level and leveling staff) that provide level realization. It is a vital technique of classical geodetic surveying [58,59,60]. This method played a positive role in China’s height measurement campaign of Mount Qomolangma from 2019 to 2020 [61]. The total length of the leveling route is 7100 m. In the early stage, the monitoring interval was one month. Later, due to the increased monitoring workload and relatively stable settlement data in the study region, the monitoring interval was adjusted to two months after 2017. In order to ensure the efficiency of the monitoring work and to save costs, the distance between the monitoring points was nearly 50 m, and it became smaller in the area close to the ore body, where the deformation is intense. The density of the monitoring points depends on the deformation degree of surrounding rock; areas of intense deformation often require more detailed monitoring data. It should be noted that the deformation of the roadway caused by the mining disturbance is composed of the convergence displacement of the roadway itself and the displacement of the rock mass. When considering the time effect, it can be assumed that the convergence displacement of the roadway itself is close to zero. Therefore, the monitoring data of the roadway were taken as the results of the rock movement.
3.2. Fractal Theory
Regarding fractal theory, the capacity dimension is also called the box-counting dimension, and its definition is based on coverage [62]. The functional model is expressed as N (r) = C × r−D. In the equation, r represents characteristic scale; C represents the proportional factor; D represents the fractal dimension; and N (r) represents the number or sum of the scale greater than or equal to r. According to the different meanings of N (r), it can be divided into two function models of the capacity dimension: the content–number method and the content-sum method [63]. In order to obtain the fractal dimension value D, the value of r is constantly changed, and a series of corresponding N (r) values are obtained. The two series of data obtained are projected onto a logarithmic coordinate graph. If there is a straight line in a log–log plot, it indicates that the data conform to the fractal distribution. In order to analyze the fractal characteristics of settlement rate evolution in the Xinli mining area, we adopted long-term monitoring data of the −200 m, −320 m, −400 m, and −480 m sublevels from May 2016 to November 2021.
4. Results
4.1. Settlement Monitoring Curve
Although it is well known that the backfilling mining method is an effective method used to control the severe deformation of surrounding rock [64,65,66,67], the rock movement phenomenon still exists in the mining region. Furthermore, the strength of the surrounding rock has decreased due to mining disturbance. We reorganized the monitoring results of several sublevels of the No. 55 prospecting profile from May 2016 to November 2021. The monitoring curves are displayed in Figure 5, Figure 6 and Figure 7. It should be noted that different colors imply different monitoring dates, and we only present some of the monitoring dates in order to keep the figures more concise and readable. Due to the arrangement of the administrative staff, the monitoring of the −240 m sublevel was interrupted in April 2019, and the monitoring of the −600 m sublevel was started in December 2017. In addition, the settlement value increased by 1000 times in the following figures, and the horizontal distance is the real value. From the final form of the settlement monitoring curves, the backfilling method cannot completely constrict rock movement and deformation of the surrounding rock. According to the years of the monitoring results, we found that the vertical settlement curves can be divided into two categories based on the shape of the curves: (1) a “pan”-type curve. The upper sublevels (−200 m and −240 m) of the No. 55 prospecting profile tend to show “pan” type curves (Figure 5). Most monitoring points have similar settlement values, and the curves are smooth. (2) a “funnel”-type curve. The lower sublevels (−320 m, −400 m, −480 m, −600 m) of the No. 55 prospecting profile tends to show “funnel”-type curves (Figure 6 and Figure 7). The settlement values of most of the monitoring points have obvious differences, and the curves are somewhat rough. Although there are also some differences between the two curves, there are some similarities, regardless of the sublevels of the No. 55 prospecting profile; the monitoring points on the left side of the monitoring line have a slight upward trend. After mining, the surrounding rock moves and deforms as a result of disturbance, and the closer the monitoring point is to the mining area, the larger the displacement is. Moreover, the maximum settlements of the six monitoring sublevels from top to bottom are 296 mm, 146 mm, 308.5 mm, 332.5 mm, 268.5 mm, and 82.5 mm, respectively. In the −200 m, −320 m, −400 m, and −480 m sublevels, the horizontal distances between the monitoring points reaching a 150 mm settlement are 341.6 m, 251.3 m, 152.3 m, and 97.9 m, respectively.
4.2. Fractal Character of the Settlement Rate
Studies have shown that the dynamic settlement curve of the ground surface points caused by mining has statistical fractal characteristics [22,68].
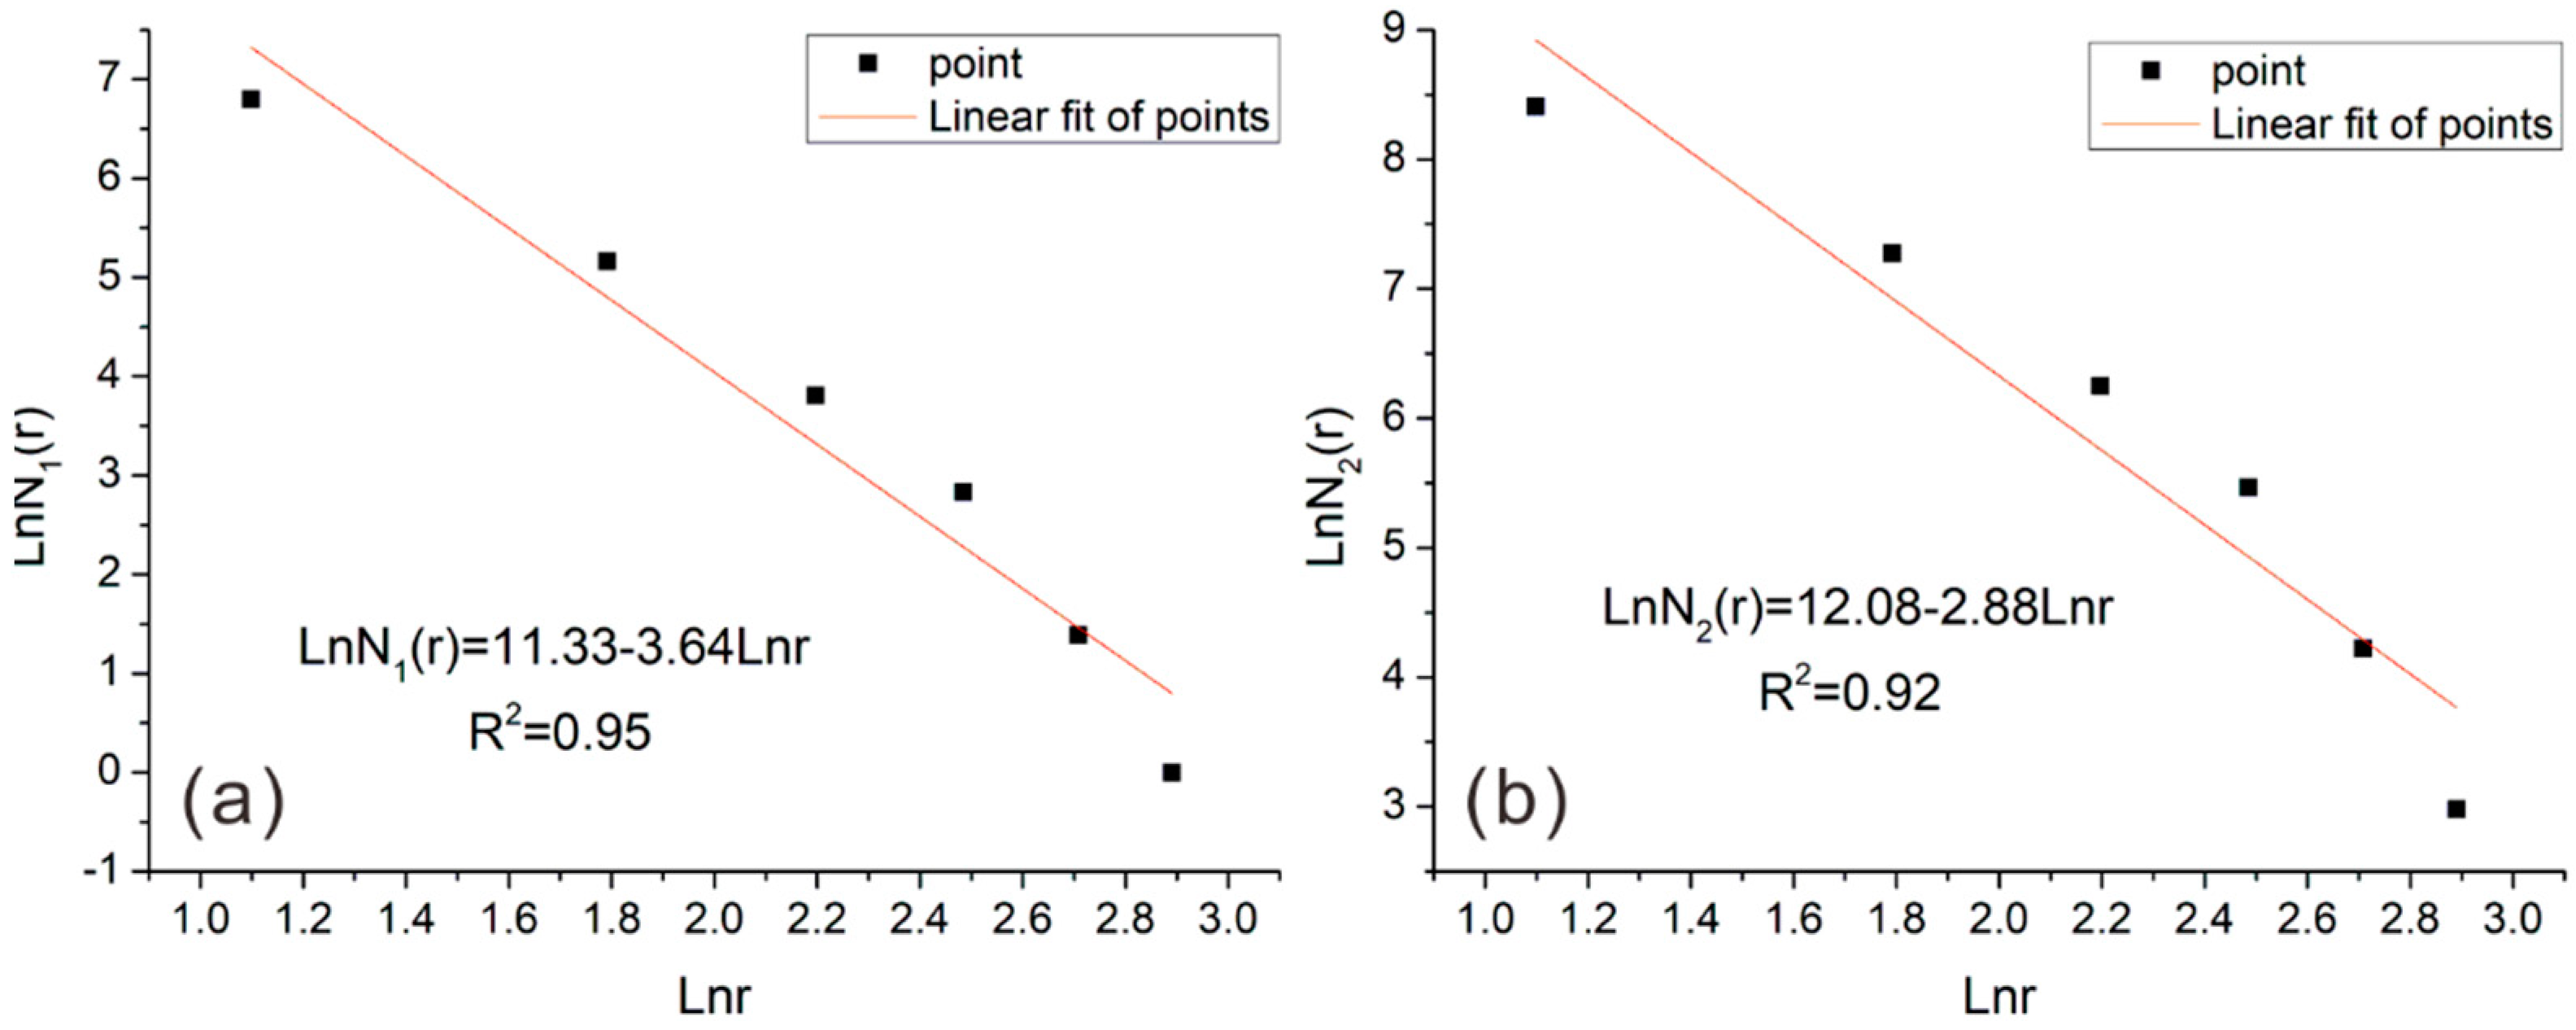
We used two function models of the capacity dimension to analyze the monitoring data (Table 1 and Table 2). The value of r (settlement rate) was constantly changed, and a series of corresponding N (r) values were obtained. It should be noted that the absolute values of the settlement are used here for convenience.
The two series of data obtained were projected onto a logarithmic coordinate graph, respectively (Figure 8). For the content-number method, there is a straight line that was fitted by the least square method in a log–log plot, with an R2 value of 0.95. For the content-sum method, there is a straight line that was fitted by the least square method in a log–log plot, with an R2 value of 0.92. Whichever method we used, they both indicated that the data conformed to the fractal distribution.
The settlement rate data of any provided monitoring sublevel from May 2016 to November 2021 also showed a fractal character. When taking the −400 m sublevel as an example, the settlement rate data also have an obvious fractal character (Table 3 and Figure 9). There is a straight line that was fitted by the least square method in a log–log plot, with an R2 value of 0.97. In addition, the settlement rate data of the −400 m sublevel from June 2016 to September 2019 also showed a fractal character (Table 4 and Figure 10). The settlement events over different space–time scales both show fractal characteristics. The settlement events reflect the scale invariance of the settlement system.
5. Discussion
The subsidence monitoring curves at different depths have distinct characteristics. As the depth increases, the difference in settlement values between the monitoring points becomes larger. As mentioned earlier, the horizontal distance between the monitoring points reaching 150 mm subsidence is decreasing. There are many factors that could contribute to this result: the mining depth, the thickness of the ore body, the mining history, the mining method, backfilling effect, and tectonic geological conditions. Furthermore, the spatial accumulative effect may be another factor. Tectonic stress, hydrogeological conditions, and temperature vary at different mining depths; the thickness of the ore body determines the excavation scale; the mining history determines the original disturbance and deformation of the surrounding rock; the mining method and backfilling method also affect the settlement of the surrounding rock; and ore-controlling fractures have a significant influence on the deformation of mining areas [41]. All of these factors could lead to the result that the upper part may suffer more severe disturbances. Dynamic disturbances often cause local instability of the surrounding rock and goaf, which further lead to different degrees of settlement. When the lower surrounding rock is disturbed by mining, deformation occurs, and the filling is not sufficient to form goaf. The upper part tends to deform by the influence of the excavation of the lower part. This is a natural occurrence that happens under the influence of gravity. Moreover, the upper part can deform when mining activities are implemented in the upper rock mass. This means that the uppermost sublevel is the most affected by the spatial accumulative effect.
Based on the results of settlement monitoring curves, we also found apparent asymmetric characteristics, similar to other scholars who have conducted much research on subsidence [69,70,71,72]. The steep geometry of the orebody and the existence of the fault both have potential effects on rock movement phenomena. The steep geometry of an orebody and the existence of a fault can affect rock movement by forming different stress conditions. In this paper, the monitoring points on the right side of the monitoring line have a downward trend; the monitoring points on the left side of the monitoring line have a slight upward trend. We hold that the flexural cantilever beam model [73,74] is suitable to explain this phenomenon. Figure 11 is the schematic diagram. At first, the inclined orebody and the surrounding rock are under prominent horizontal tectonic stress [75]. Due to mining disturbance and tectonic stress, the deep rock mass produces a trend of upward bending, and the shallow rock is pulled; then, the fault activation of the shallow surrounding rock under tensile stress leads to the formation of a sedimentary basin. The hanging wall and footwall fault blocks can be regarded as two bending cantilevers interacting with each other. The equilibrium force generated by extension causes cantilever uplift of the footwall fault block and settlement of the footwall fault block.
The rock mass is heterogeneous and consists of rock blocks and structural planes. Because of the difference in the physical and mechanical properties of rock block, as well as the complexity of the structural plane, mining-induced rock mass failures are strongly nonlinear, and the dynamic settlement curve of the surrounding rock is fluctuant. Taking the “J12” monitoring point in the −400 m sublevel as an example, the settlement rates show obvious fluctuation characteristics. (Figure 12). Mining-induced rock mass failures show a strong nonlinearity, which makes the dynamic settlement curves of the No. 55 prospecting profile show a non-smooth shape (Figure 5, Figure 6 and Figure 7). The evolution process of rock movement is essentially a self-organizing evolution process, from disorder to order and from low levels to high levels under the action of certain external conditions and internal nonlinear mechanisms [49]. Underground mining activities may cause movement of the surrounding rock due to the advance of the excavation fronts and the progressive closure or collapse of the mineral extraction galleries. During this excavation process, the stress balance of the rock mass was disturbed, and stress redistribution occurred. The rock movement system of the mining area is an open system because the exchange of material and energy is always occurring between the rock movement system and the outside. The surrounding rock stress field, rock mass structure, and other factors all change with respect to two scales: time and space; and the nonlinear interaction between them makes this system very complicated. Thus, the rock movement system remains far from being an equilibrium, although it may have stable statistical properties [75]. The fractal character of subsidence is related to the SOC of the rock movement system. Thus, the internal movement and failure mechanisms of the rock mass are still unexplained problems. This paper reveals the fractal characteristics of rock movement, similar to other natural phenomena. According to the fractal characteristics and the SOC theory, we may find rock movement anomalies in time. In addition, it is necessary to use fractal theory to conduct in-depth studies on rock movement mechanisms.
6. Conclusions
We used several years’ worth of monitoring data of the No. 55 prospecting profile of the Xinli mining area to study the deformation characteristics. The results show that the dynamic settlement curves of the monitoring sublevels have interesting differences. The vertical settlement curves can be divided into two categories based on the shape of the curves: (1) a “pan”-type curve (−200 m and −240 m sublevels) and (2) a “funnel”-type curve (−320 m, −400 m, −480 m, and −600 m sublevels). This phenomenon is not only related to the basic geological and mining conditions but also to the cumulative effect. The upper part may deform as a result of the mining activities in this part as well as due to the deformation of lower sublevels. This is a natural occurrence that happens under the influence of gravity.
Mining-induced rock mass failures are strongly nonlinear due to the randomness of rock mass structure, which is reflected in the fluctuating settlement curves. In addition, the settlement rates of the monitoring points of the No. 55 prospecting profile have good statistical fractal characteristics. The settlement events at different spatial and temporal scales all have fractal characteristics, which reflects the scale invariance of the settlement system. Based on the above information, the self-organized criticality (SOC) theory offers a better explanation of the fractal characteristics of nonlinear complex systems. In this paper, the physical mechanisms of rock movement have been preliminarily investigated through the collection and analysis of the monitoring data, and the findings have theoretical value for the further study of mining settlements.
Author Contributions
Conceptualization, J.L. and F.M.; methodology, J.L. and J.G.; formal analysis, J.L. and F.M.; investigation, J.G. and G.L.; resources, Y.W.; data curation, Y.S.; writing—original draft preparation, J.L.; writing—review and editing, F.M.; supervision, J.G.; project administration, G.L. and Y.W.; funding acquisition, F.M. All authors have read and agreed to the published version of the manuscript.
Funding
This research was funded by The National Natural Science Foundation of China (Grants number 41831293, 42072305).
Institutional Review Board Statement
Not applicable.
Informed Consent Statement
Not applicable.
Data Availability Statement
Not applicable.
Acknowledgments
The authors would like to express their sincere gratitude to the Sanshandao Gold Mine for their data support. In addition, the authors are grateful to the assigned editor and the anonymous reviewers for their enthusiastic help and valuable comments, which have greatly improved this paper.
Conflicts of Interest
The authors declare no conflict of interest.
References
- Li, N.; Nguyen, H.; Rostami, J.; Zhang, W.G.; Bui, X.N.; Pradhan, B. Predicting rock displacement in underground mines using improved machine learning-based models. Measurement 2022, 188, 110552. [Google Scholar] [CrossRef]
- Zhao, H.J.; Ma, F.S.; Xu, J.M.; Guo, J. In situ stress field inversion and its application in mining-induced rock mass movement. Int. J. Rock Mech. Min. Sci. 2012, 53, 120–128. [Google Scholar] [CrossRef]
- Li, G.; Ma, F.S.; Guo, J.; Zhao, H.J.; Liu, G. Study on deformation failure mechanism and support technology of deep soft rock roadway. Eng. Geol. 2020, 264, 105262. [Google Scholar] [CrossRef]
- Zeng, C.L.; Zhou, Y.J.; Zhang, L.M.; Mao, D.G.; Bai, K.X. Study on overburden failure law and surrounding rock deformation control technology of mining through fault. PLoS ONE 2022, 17, e0262243. [Google Scholar] [CrossRef] [PubMed]
- Guillaume, M.; Cecile, D.; Frederic, M. Time evolution of mining-related residual subsidence monitored over a 24-year period using InSAR in southern Alsace, France. Int. J. Appl. Earth Obs. Geoinf. 2021, 102, 102392. [Google Scholar]
- Helm, P.R.; Davie, C.T.; Glendinning, S. Numerical modelling of shallow abandoned mine working subsidence affecting transport infrastructure. Eng. Geol. 2013, 154, 6–19. [Google Scholar] [CrossRef] [Green Version]
- Liu, J.; Ma, F.S.; Li, G.; Guo, J.; Wan, Y.; Song, Y.W. Evolution assessment of mining subsidence characteristics using SBAS and PS interferometry in Sanshandao gold mine, China. Remote Sens. 2022, 14, 290. [Google Scholar] [CrossRef]
- Brady, B.H.G.; Brown, E.T. Rock Mechanics for Underground Mining; Kluwer: Dordrecht, The Netherlands, 2004. [Google Scholar]
- Szurgacz, D.; Brodny, J. Analysis of the influence of dynamic load on the work parameters of a powered roof support’s hydraulic leg. Sustainability 2019, 11, 2570. [Google Scholar] [CrossRef] [Green Version]
- Li, X.; Wang, S.J.; Liu, T.Y.; Ma, F.S. Engineering geology, ground surface movement and fissures induced by underground mining in the Jinchuan Nickel Mine. Eng. Geol. 2004, 76, 93–107. [Google Scholar] [CrossRef]
- Indraratna, B.; Nemcik, J.A.; Gale, W.J. Review and interpretation of primary floor failure mechanism at a longwall coal mining face based on numerical analysis. Geotechnique 2000, 50, 547–557. [Google Scholar] [CrossRef]
- Wang, Y.H.; Deng, K.Z.; Wu, K.; Guo, G.L. On the dynamic mechanics model of mining subsidence. Chin. J. Rock Mech. Eng. 2003, 22, 352–357. [Google Scholar]
- Coulthard, M.A. Applications of numerical modeling in underground mining and construction. Geotech. Geol. Eng. 1999, 17, 373–385. [Google Scholar] [CrossRef]
- Institute of Scientific and Technical Information of China. Ground Building in Polish Mined-Out Area; China Science Press: Beijing, China, 1978. [Google Scholar]
- Brauner. Subsidence due to Underground Mining; Bureau of Mines: Raleigh, NC, USA, 1973. [Google Scholar]
- Qian, M.G.; Liao, X.X.; Xu, J.L. Research on key strata theory in rock strata control. J. China Coal Soc. 1996, 3, 6. [Google Scholar]
- Xu, J.L.; Qian, M.G. Study on the influence of key strata movement on subsidence. J. China Coal Soc. 2000, 2, 122–126. [Google Scholar]
- Guo, Z.Z.; Yin, Z.R.; Wang, J.Z. Random medium shiver movement probability and surface subsidence. J. China Coal Soc. 2000, 3, 264–267. [Google Scholar]
- Wu, K.; Wang, Y.H.; Deng, K.Z. Application of dynamic mechanics model of overlying strata movement and damage above goaf. J. China Univ. Min. Technol. 2000, 29, 34–36. [Google Scholar]
- Gong, Y.Q.; Guo, G.L.; Wang, L.P.; Zhang, G.J.; Zhang, G.X.; Fang, Z. Numerical study on the surface movement regularity of deep mining underlying the super thick and weak cementation overburden, a case study in Western China. Sustainability 2022, 14, 1855. [Google Scholar] [CrossRef]
- Bagde, M.N.; Raina, A.K.; Chakraborty, A.K.; Jethwa, J.L. Rock mass characterization by fractal dimension. Eng. Geol. 2002, 63, 141–155. [Google Scholar] [CrossRef]
- Yu, G.M.; Sun, H.Q.; Zhao, J.F. The fractal increment of dynamic subsidence of the ground surface point induced by mining. Chin. J. Rock Mech. Eng. 2001, 20, 34–37. [Google Scholar]
- Knothe, S. Time Influence on Formation of a Subsidence Surface; Archiwum Gornictwa I Hutnictwa: Krakow, Polish, 1952; Volume 1, p. 1. [Google Scholar]
- Singh, R.P.; Yadav, R.N. Prediction of subsidence due to coal mining in Raniganj coalfield, West Bengal, India. Eng. Geol. 1995, 39, 103–111. [Google Scholar] [CrossRef]
- McNabb, K.B. Three dimensional numerical modelling of surface subsidence induced by underground mining Div. Geomech. Tech. Rep. 1987, 146, 20. [Google Scholar]
- Alejano, L.; Ramrez-Oyanguren, P.; Taboada, J. FDM predictive methodology for subsidence due to flat and inclined coal seam mining. Int. J. Rock Mech. Min. Sci. 1999, 36, 475–491. [Google Scholar] [CrossRef]
- Chang, Z.Q.; Wang, J.Z. Study on time function of surface subsidence: The improved Knothe time function. Chin. J. Rock Mech. Eng. 2003, 22, 1496–1499. [Google Scholar]
- Wu, L.X.; Wang, J.Z. Study of deformation model of a controlling holding-plate when large area is extracted continuously. J. China Coal Soc. 1994, 19, 233–242. [Google Scholar]
- Tomaž, A.; Goran, T. Prediction of subsidence due to underground mining by artificial neural networks. Comput. Geosci. 2003, 29, 627–637. [Google Scholar]
- Gao, Y.F. “Four-zone” model of rock movement and inverse analysis of dynamic displacement. J. China Coal Soc. 1996, 1, 6. [Google Scholar]
- Sun, Y.J.; Zuo, J.P.; Karakus, M.; Wang, J.T. Investigation of movement and damage of integral overburden during shallow coal seam mining. Rock Mech. Min. Sci. 2019, 119, 63–75. [Google Scholar] [CrossRef]
- Mandelbrot, B.B. The Fractal Geometry of Nature; WH Freeman and Company: New York, NY, USA, 1982; pp. 25–50. [Google Scholar]
- Delsanto, P.P.; Gliozzi, S.A.; Bruno, L.E.C.; Pugno, N.; Carpinteri, A. Scaling laws and fractality in the framework of a phenomenological approach. Chaos Solitons Fractals 2009, 41, 2782–2786. [Google Scholar] [CrossRef]
- Wang, R.D.; Yang, M.G. Some problems in fractal statistical research on geological phenomenon. Geoscience 1998, 12, 6. [Google Scholar]
- Shen, G.Q. Fractal dimension and fractal growth of urbanized areas. Int. J. Geogr. Inf. Sci. 2002, 16, 419–437. [Google Scholar] [CrossRef]
- Ioelovich, M. Fractal dimensions of cell wall in growing cotton fibers. Fractal Fract. 2020, 4, 6. [Google Scholar] [CrossRef] [Green Version]
- Xie, H.P.; Pariseau, W.G. Fractal character and mechanism of rock bursts. Chin. J. Rock Mech. Eng. 1993, 30, 28–37. [Google Scholar] [CrossRef]
- Biancolini, M.E.; Brutti, C.; Paparo, G.; Zanini, A. Fatigue cracks nucleation on steel, acoustic emission and fractal analysis. Int. J. Fatigue 2006, 28, 1820–1825. [Google Scholar] [CrossRef]
- Wu, X.Z.; Liu, X.X.; Liang, Z.Z.; You, X.; Yu, M. Experimental study of fractal dimension of AE serials of different rocks under uniaxial compression. Rock Soil Mech. 2012, 33, 3561–3569. [Google Scholar]
- Xie, H.P.; Yu, G.M.; Yang, L.; Zhou, H.W. The influence of proximate fault morphology on ground subsidence due to extraction. Int. J. Rock Mech. Min. Sci. 1998, 35, 1107–1111. [Google Scholar] [CrossRef]
- Bruneau, G.; Hudyma, M.R.; Hadjigeorgiou, J.; Potvin, Y. Influence of faulting on a mine shaft a case study part II—Numerical modelling. Int. J. Rock Mech. Min. Sci. 2003, 40, 113–125. [Google Scholar] [CrossRef]
- Zhao, H.J.; Ma, F.S.; Li, G.Q.; Ding, D.M.; Wen, Y.D. Fault effect due to underground excavation in hangingwalls and footwalls of faults. Chin. J. Geotech. Eng. 2008, 30, 1372–1375. [Google Scholar]
- Yan, S.; Bai, J.B.; Li, W.F.; Chen, J.G.; Li, L. Deformation mechanism and stability control of roadway along a fault subjected to mining. Int. J. Min. Sci. Technol. 2012, 22, 559–565. [Google Scholar] [CrossRef]
- Sun, Q.H.; Ma, F.S.; Guo, J.; Li, G.; Feng, X.L. Deformation failure mechanism of deep vertical shaft in Jinchuan mining area. Sustainability 2020, 12, 2226. [Google Scholar] [CrossRef] [Green Version]
- Cao, W.H.; Wang, X.F.; Li, P.; Zhang, D.S.; Sun, C.D.; Qin, D.D. Wide strip backfill mining for surface subsidence control and its application in critical mining conditions of a coal mine. Sustainability 2018, 10, 700. [Google Scholar] [CrossRef] [Green Version]
- Cai, W.Y.; Chang, Z.C.; Zhang, D.S.; Wang, X.F.; Cao, W.H.; Zhou, Y.Z. Roof filling control technology and application to mine roadway damage in small pit goaf. Int. J. Min. Sci. Technol. 2019, 29, 477–482. [Google Scholar] [CrossRef]
- Bak, P.; Tang, C.; Wiesenfeld, K. Self-organized criticality an explanation of the 1/f noise. Phys. Rev. Lett. 1987, 59, 381–394. [Google Scholar] [CrossRef] [PubMed]
- Hergarten, S.; Neugebauer, H.J. Self-organized criticality in a landslide model. Geophys. Res. Lett. 1998, 25, 801–804. [Google Scholar] [CrossRef] [Green Version]
- Qin, S.Q. Catastrophe model and chaos mechanism of ramp instability. Chin. J. Rock Mech. Eng. 2000, 19, 486–492. [Google Scholar]
- Xu, Q.; Huang, R.Q. Systematic analysis principles of geological hazards. Mt. Res. 2000, 3, 272–277. [Google Scholar]
- Iwahashi, J.; Watanabe, S.; Furuya, T. Mean slope-angle frequency distribution and size frequency distribution of landslide masses in Higashikubiki area, Japan. Geomorphology 2003, 50, 349–364. [Google Scholar] [CrossRef]
- Li, Z.S.; Miao, S.J.; Ren, F.H. Research on comprehensive prediction of rock burst in Sanshandao Gold Mine. Appl. Mech. Mater. 2012, 170, 1612–1617. [Google Scholar]
- Liu, G.; Ma, F.S.; Zhao, H.J.; Li, G.; Cao, J.Y.; Guo, J. Study on the fracture distribution law and the influence of discrete fractures on the stability of roadway surrounding rock in the Sanshandao coastal Gold Mine, China. Sustainability 2019, 11, 2758. [Google Scholar] [CrossRef] [Green Version]
- Chen, Y.; Zhao, G.Y.; Wang, S.F.; Wu, H.; Wang, S.W. A case study on the height of a water-flow fracture zone above undersea mining: Sanshandao Gold Mine, China. Environ. Earth Sci. 2019, 78, 122. [Google Scholar] [CrossRef]
- Song, M.C.; Ding, Z.J.; Zhang, J.J.; Song, Y.X.; Bo, J.W.; Wang, Y.Q.; Liu, H.B.; Li, S.Y.; Li, J.; Li, R.X.; et al. Geology and mineralization of the Sanshandao supergiant gold deposit (1200 t) in the Jiaodong Peninsula, China: A review. China Geol. 2021, 4, 686–719. [Google Scholar] [CrossRef]
- Liu, G.W.; Ma, F.S.; Liu, G.; Zhao, H.J.; Guo, J.; Cao, J.Y. Application of multivariate statistical analysis to identify water sources in A coastal Gold Mine, Shandong, China. Sustainability 2019, 11, 3345. [Google Scholar] [CrossRef] [Green Version]
- Ma, F.S.; Zhao, H.J.; Guo, J. Investigating the characteristics of mine water in a subsea mine using groundwater geochemistry and stable isotopes. Environ. Earth Sci. 2015, 74, 6703–6715. [Google Scholar] [CrossRef]
- Kersten, T.; Kobe, M.; Gabriel, G.; Timmen, L.; Schön, S.; Vogel, D. Geodetic monitoring of subrosion-induced subsidence processes in urban areas. J. Appl. Geod. 2017, 11, 21–29. [Google Scholar] [CrossRef]
- Li, S.M.; Wang, Z.M.; Yuan, L.W.; Li, X.X.; Huang, Y.Z.; Guo, R. Mechanism of land subsidence of plateau lakeside Kunming city cluster (China) by MT-InSAR and leveling survey. J. Coast. Res. 2020, 115, 666–675. [Google Scholar] [CrossRef]
- Nojo, M.; Waki, F.; Akaishi, M.; Muramoto, Y. The investigation of a new monitoring system using leveling and GPS. Proc. Int. Assoc. Hydrol. Sci. 2015, 372, 539–542. [Google Scholar] [CrossRef] [Green Version]
- Dang, Y.M.; Guo, C.X.; Jiang, T.; Zhang, Q.T.; Chen, B.; Jiang, G.W. 2020 height measurement and determination of Mount Oomolangma. Acta Geod. Et Cartogr. Sin. 2021, 50, 556–561. [Google Scholar]
- Xie, Y.S.; Tan, K.X. Fractal research on fracture structures and application in geology. Earth Environ. 2002, 1, 71–77. [Google Scholar]
- Guo, C.Y.; Gao, B.F.; Xing, X.W. Comparison of lower limit value determined by two fractal methods. Gold 2008, 3, 13–17. [Google Scholar]
- Nooshin, F.; Michel, A.; Li, L. Numerical investigation of the geomechanical response of adjacent backfilled stopes. Can. Geotech. J. 2015, 52, 1507–1525. [Google Scholar]
- Zhang, J.X.; Zhou, N.; Huang, Y.L.; Zhang, Q. Impact law of the bulk ratio of backfilling body to over-lying strata movement in fully mechanized backfilling mining. Miner. Min. Technol. 2011, 47, 73–84. [Google Scholar]
- Liu, Z.X.; Lan, M.; Xiao, S.Y.; Guo, H.Q. Damage failure of cemented backfill and its reasonable match with rock mass. Trans. Nonferrous Met. Soc. China 2015, 25, 954–959. [Google Scholar] [CrossRef]
- Deveci, H.; Ercikdi, B.; Kesimal, A. Cemented paste backfill of sulphide-rich tailings: Importance of binder type and dosage. Cem. Concr. Compos. 2009, 31, 268–274. [Google Scholar]
- Zhang, D.M.; Yin, G.Z.; Wei, Z.A.; Zhang, W.Z. Fractal characteristics and prediction of rock layer movement in coal mining. J. Min. Saf. Eng. 2003, 2, 98–100. [Google Scholar]
- Donnelly, L.J.; Culshaw, M.G.; Bell, F.G. Longwall mining-induced fault reactivation and delayed subsidence ground movement in British coalfields. Q. J. Eng. Geol. Hydrogeol. 2008, 41, 301–314. [Google Scholar] [CrossRef]
- Jiang, J.P.; Zhang, Y.S.; Yan, C.H.; Luo, G.Y. Discussion on fault effect of rock movement in underground engineering. Chin. J. Rock Mech. Eng. 2002, 8, 1257–1262. [Google Scholar]
- Wang, H.; Qin, Y.; Wang, H.B.; Chen, Y.; Liu, X.C. Process of overburden failure in steeply inclined multi-seam mining: Insights from physical modeling. R. Soc. Open Sci. 2021, 2, 75. [Google Scholar] [CrossRef]
- Das, A.J.; Mandal, P.K.; Bhattacharjee, R.; Tiwari, S.; Kushwaha, A.; Roy, L.B. Evaluation of stability of underground workings for exploitation of an inclined coal seam by the ubiquitous joint model. Int. J. Rock Mech. Min. Sci. 2017, 93, 101–114. [Google Scholar] [CrossRef]
- Kusznir, N.J.; Marsden, G.; Egan, S.S. A Flexural-Cantilever Simple-Shear/Pure-Shear Model of Continental Lithosphere Extension: Applications to the Jeanne d’Arc Basin, Grand Banks and Viking Graben, North Sea; Special Publications; Geological Society: London, UK, 1991. [Google Scholar]
- Ren, J.Y.; Lei, C.; Yang, H.Z.; Yin, X.Y. Lithosphere stretching model of deep water in Qiongdongnan basin, northern continental margin of south China sea, and controlling of the post-rift subsidence. Earth Sci. 2009, 34, 963–974. [Google Scholar]
- Hui, X.; Ma, F.S.; Zhao, H.J.; Xu, J.M. Monitoring and statistical analysis of mine subsidence at three metal mines in China. Bull. Eng. Geol. Environ. 2018, 78, 3983–4001. [Google Scholar] [CrossRef]
Figure 1.
The study area (indicated in the red circle).

Figure 2.
Three main faults and the Xinli mining area.

Figure 3.
The simplified geological condition of the No. 55 prospecting profile (the green lines show the plot range of the following settlement curves).
Figure 3.
The simplified geological condition of the No. 55 prospecting profile (the green lines show the plot range of the following settlement curves).

Figure 4.
The monitoring network of the No. 55 prospecting profile.

Figure 5.
The “pan”-type curve (a): −200 m sublevel (b): −240 m sublevel.

Figure 6.
The “funnel” type curve (a): −320 m sublevel (b): −400 m sublevel.

Figure 7.
The “funnel” type curve (a): −480 m sublevel (b): −600 m sublevel.

Figure 8.
The settlement rate distribution of the whole No. 55 prospecting profile from May 2016 to November 2021. (a) Content-number method; (b) content-sum method.
Figure 8.
The settlement rate distribution of the whole No. 55 prospecting profile from May 2016 to November 2021. (a) Content-number method; (b) content-sum method.

Figure 9.
The log–log plot of the settlement rate distribution of the −400 m sublevel from May 2016 to November 2021.
Figure 9.
The log–log plot of the settlement rate distribution of the −400 m sublevel from May 2016 to November 2021.

Figure 10.
The log–log plot of the settlement rate distribution of the −400 m sublevel from June 2016 to September 2019.
Figure 10.
The log–log plot of the settlement rate distribution of the −400 m sublevel from June 2016 to September 2019.

Figure 11.
Schematic diagram of settlement development.

Figure 12.
The settlement rates of the “J12” monitoring point in the −400 m sublevel.


Table 1.
Content-number method.
| r/(mm/month) | 3 | 6 | 9 | 12 | 15 | 18 |
| N1 (r) | 894 | 175 | 45 | 17 | 4 | 1 |
Table 2.
Content-sum method.
| r/(mm/month) | 3 | 6 | 9 | 12 | 15 | 18 |
| N2 (r) | 4473.7 | 1441.7 | 517.0 | 236.8 | 68.1 | 19.7 |
Table 3.
The settlement rate distribution of the −400 m sublevel from May 2016 to November 2021 (content-number method).
Table 3.
The settlement rate distribution of the −400 m sublevel from May 2016 to November 2021 (content-number method).
| r/(mm/month) | 3 | 6 | 9 | 12 | 15 |
| N3 (r) | 287 | 59 | 12 | 3 | 1 |
Table 4.
The settlement rate distribution of the −400 m sublevel from June 2016 to September 2019 (content-number method).
Table 4.
The settlement rate distribution of the −400 m sublevel from June 2016 to September 2019 (content-number method).
| r/(mm/month) | 3 | 6 | 9 | 12 | 15 |
| N4 (r) | 208 | 46 | 12 | 3 | 1 |
Publisher’s Note: MDPI stays neutral with regard to jurisdictional claims in published maps and institutional affiliations. |
© 2022 by the authors. Licensee MDPI, Basel, Switzerland. This article is an open access article distributed under the terms and conditions of the Creative Commons Attribution (CC BY) license (https://creativecommons.org/licenses/by/4.0/).
Share and Cite
MDPI and ACS Style
Liu, J.; Ma, F.; Guo, J.; Li, G.; Song, Y.; Wan, Y. A Field Study on the Law of Spatiotemporal Development of Rock Movement of Under-Sea Mining, Shandong, China. Sustainability 2022, 14, 5864. https://doi.org/10.3390/su14105864
AMA Style
Liu J, Ma F, Guo J, Li G, Song Y, Wan Y. A Field Study on the Law of Spatiotemporal Development of Rock Movement of Under-Sea Mining, Shandong, China. Sustainability. 2022; 14(10):5864. https://doi.org/10.3390/su14105864
Chicago/Turabian StyleLiu, Jia, Fengshan Ma, Jie Guo, Guang Li, Yewei Song, and Yang Wan. 2022. "A Field Study on the Law of Spatiotemporal Development of Rock Movement of Under-Sea Mining, Shandong, China" Sustainability 14, no. 10: 5864. https://doi.org/10.3390/su14105864
Note that from the first issue of 2016, this journal uses article numbers instead of page numbers. See further details here.