
Spatiotemporal Pattern Differentiation and Influencing Factors of Cultivated Land Use Efficiency in Hubei Province under Carbon Emission Constraints


Abstract
:1. Introduction
2. Materials and Methods
2.1. Study Area
2.2. Research Methods
2.2.1. Super SBM Undesirable Model
2.2.2. Kernel Density Estimating
2.2.3. ESDA Correlation Model
2.2.4. Tobit Regression Analysis
2.3. Indicator System and Data Source
2.3.1. Index System of CLUE
2.3.2. Influencing Factor Index System
2.3.3. Data Source
3. Results
3.1. Time Variation of CLUE
3.2. Spatial Distribution of CLUE
3.3. Spatial Autocorrelation Analysis of CLUE
3.3.1. Global Spatial Differentiation Pattern of CLUE
3.3.2. Spatial Differentiation Efficiency of Cultivated Land
3.4. Analysis of Influencing Factors of CLUE
4. Discussion
4.1. Limitations and Future Directions
4.2. Policy Enlightenment
5. Conclusions
Author Contributions
Funding
Institutional Review Board Statement
Informed Consent Statement
Data Availability Statement
Conflicts of Interest
Appendix A

| County | Terrain | 2005 | 2010 | 2015 | 2020 | Increases (2005–2020) | Rank |
|---|---|---|---|---|---|---|---|
| Wuhan distinct | plain | 0.2194 | 0.2536 | 1.0055 | 0.3046 | 0.0852 | 43 |
| Caidian | plain | 0.3588 | 0.3967 | 0.4815 | 0.55 | 0.1912 | 30 |
| Jiangxia | plain | 0.4772 | 0.5308 | 1.0513 | 1.1074 | 0.6302 | 8 |
| Huangpi | plain | 0.4097 | 0.4007 | 0.6731 | 1.007 | 0.5973 | 10 |
| Xinzhou | plain | 0.3458 | 0.361 | 0.5055 | 0.4895 | 0.1437 | 35 |
| Shiyan | mountain | 0.315 | 0.4032 | 0.4958 | 0.4069 | 0.0919 | 41 |
| Huangshi distinct | plain | 0.3419 | 0.3851 | 0.5522 | 1.1368 | 0.7949 | 6 |
| Daye | hill | 0.4631 | 0.3579 | 0.446 | 0.4582 | −0.0049 | 49 |
| Yangxin | mountain | 0.5906 | 0.4405 | 0.492 | 0.3836 | −0.207 | 68 |
| Jingzhou distinct | plain | 0.5624 | 0.5045 | 0.44 | 0.7144 | 0.152 | 33 |
| Jiangling | plain | 1.5332 | 0.6688 | 0.3681 | 1.017 | −0.5162 | 72 |
| Songzi | hill | 0.4687 | 0.4085 | 1.0052 | 0.7391 | 0.2704 | 23 |
| Gong’an | plain | 0.4436 | 0.5119 | 0.5004 | 1.0729 | 0.6293 | 9 |
| Shishou | plain | 0.4635 | 0.4749 | 0.2724 | 0.5193 | 0.0558 | 44 |
| Jianli | plain | 0.4586 | 0.7354 | 0.3319 | 0.6898 | 0.2312 | 25 |
| Honghu | plain | 0.4911 | 0.5381 | 0.2727 | 0.7156 | 0.2245 | 26 |
| Yichang distinct | mountain | 0.217 | 0.192 | 0.0833 | 0.339 | 0.122 | 38 |
| Yidu | mountain | 0.5877 | 0.4747 | 0.6006 | 1.0787 | 0.491 | 17 |
| Zhijiang | plain | 0.3718 | 0.325 | 0.4951 | 0.5378 | 0.166 | 32 |
| Dangyang | hill | 0.3881 | 0.479 | 1.0002 | 0.6342 | 0.2461 | 24 |
| Yuan’an | mountain | 0.3822 | 0.4322 | 0.5318 | 0.5194 | 0.1372 | 37 |
| Xingshan | mountain | 0.3458 | 0.4402 | 0.3158 | 0.3315 | −0.0143 | 50 |
| Zigui | mountain | 0.2942 | 0.2682 | 0.2975 | 0.4344 | 0.1402 | 36 |
| Changyang | mountain | 0.4714 | 0.5311 | 1.0426 | 1.0026 | 0.5312 | 14 |
| Wufeng | mountain | 1.0182 | 1.1381 | 1.0708 | 1.1675 | 0.1493 | 34 |
| Xiangyang | hill | 0.3356 | 0.3058 | 0.7419 | 1.1615 | 0.8259 | 5 |
| Laohekou | hill | 0.4447 | 0.5316 | 0.702 | 1.4395 | 0.9948 | 2 |
| Zaoyang | hill | 0.5606 | 1.0271 | 0.4032 | 0.4552 | −0.1054 | 59 |
| Yicheng | hill | 0.489 | 0.4955 | 0.5254 | 1.0059 | 0.5169 | 15 |
| Nanzhang | mountain | 0.4489 | 0.5729 | 0.6445 | 0.656 | 0.2071 | 29 |
| Gucheng | mountain | 0.5025 | 0.37 | 1.0379 | 1.045 | 0.5425 | 13 |
| Baokang | mountain | 0.4481 | 0.4122 | 1.0134 | 1.3331 | 0.885 | 3 |
| Ezhou | plain | 0.4135 | 0.4968 | 0.5948 | 0.3957 | −0.0178 | 51 |
| Jingmen distinct | plain | 0.4772 | 0.5524 | 0.6707 | 1.1949 | 0.7177 | 7 |
| Shayang | hill | 0.5247 | 0.5184 | 0.6305 | 0.6162 | 0.0915 | 42 |
| Zhongxiang | hill | 0.6219 | 1.1327 | 1.0035 | 0.5096 | −0.1123 | 61 |
| Jingshan | hill | 0.8389 | 1.0989 | 1.0299 | 0.5695 | −0.2694 | 70 |
| Xiaogan distinct | plain | 0.4363 | 0.3778 | 0.3396 | 1.9554 | 1.5191 | 1 |
| Xiaochang | hill | 0.5541 | 0.3949 | 0.4601 | 0.446 | −0.1081 | 60 |
| Dawu | hill | 0.7178 | 0.593 | 0.6539 | 1.0102 | 0.2924 | 22 |
| Anlu | hill | 0.8014 | 1.0847 | 0.8138 | 0.7567 | −0.0447 | 55 |
| Yunmeng | plain | 0.6282 | 0.693 | 0.9543 | 1.0557 | 0.4275 | 19 |
| Yingcheng | hill | 0.617 | 0.8414 | 0.8316 | 1.0856 | 0.4686 | 18 |
| Hanchuan | plain | 0.2927 | 0.454 | 0.4369 | 0.4017 | 0.109 | 39 |
| Huanggang distinct | plain | 0.2654 | 0.2008 | 0.2785 | 0.2401 | −0.0253 | 53 |
| Tuanfeng | hill | 0.4288 | 0.2982 | 0.2863 | 0.3009 | −0.1279 | 63 |
| Hongan | mountain | 0.4131 | 0.3813 | 0.2818 | 0.2152 | −0.1979 | 67 |
| Macheng | mountain | 0.8005 | 0.5063 | 0.722 | 0.8191 | 0.0186 | 46 |
| Luotian | mountain | 0.9514 | 0.6372 | 1.0477 | 1.0577 | 0.1063 | 40 |
| Yingshan | mountain | 0.6369 | 0.6557 | 0.4499 | 0.4165 | −0.2204 | 69 |
| Xishui | hill | 0.6299 | 0.3925 | 0.6273 | 0.5639 | −0.066 | 57 |
| Qichun | hill | 0.4828 | 0.3339 | 0.4289 | 1.0498 | 0.567 | 12 |
| Wuxuan | hill | 0.4586 | 0.4127 | 0.5118 | 0.4366 | −0.022 | 52 |
| Huangmei | plain | 0.3795 | 0.3192 | 0.4224 | 0.7294 | 0.3499 | 20 |
| Xianning distinct | plain | 0.586 | 0.4328 | 0.6734 | 0.396 | −0.19 | 66 |
| Jiayu | plain | 0.4421 | 1.0472 | 1.2484 | 0.7496 | 0.3075 | 21 |
| Chibi | mountain | 0.6231 | 0.5417 | 1.0305 | 1.4614 | 0.8383 | 4 |
| Tongcheng | mountain | 1.0671 | 1.0718 | 0.5587 | 1.0079 | −0.0592 | 56 |
| Chongyang | mountain | 0.7016 | 0.5811 | 0.4664 | 1.1938 | 0.4922 | 16 |
| Tongshan | mountain | 0.5959 | 0.4246 | 0.7808 | 1.1709 | 0.575 | 11 |
| Suizhou | plain | 0.4931 | 1.0126 | 0.4685 | 0.4504 | −0.0427 | 54 |
| Enshi | mountain | 0.666 | 0.5407 | 0.5072 | 0.5957 | −0.0703 | 58 |
| Jianshi | mountain | 0.6274 | 0.6577 | 0.4777 | 0.4867 | −0.1407 | 64 |
| Badong | mountain | 1.0094 | 1.0205 | 0.4949 | 1.0049 | −0.0045 | 48 |
| Lichuan | mountain | 0.8148 | 1.0279 | 0.5785 | 1.001 | 0.1862 | 31 |
| Xuanen | mountain | 0.5749 | 0.3391 | 0.3486 | 0.4561 | −0.1188 | 62 |
| Xianfeng | mountain | 0.8312 | 0.493 | 0.5087 | 0.47 | −0.3612 | 71 |
| Laifeng | mountain | 0.8665 | 0.4387 | 0.5225 | 0.7168 | −0.1497 | 65 |
| Hefeng | mountain | 1.001 | 0.4715 | 0.4007 | 1.0122 | 0.0112 | 47 |
| Xiantao | plain | 0.2856 | 0.2729 | 0.3321 | 0.3234 | 0.0378 | 45 |
| Tianmen | plain | 0.3233 | 0.3852 | 0.4817 | 0.5384 | 0.2151 | 28 |
| Qianjiang | plain | 0.2881 | 0.2712 | 0.3833 | 0.5057 | 0.2176 | 27 |
References
- Xiao, P.; Zhao, C.; Zhou, Y.; Feng, H.; Li, X.; Jiang, J. Study on Land Consolidation Zoning in Hubei Province Based on the Coupling of Neural Network and Cluster Analysis. Land 2021, 10, 756. [Google Scholar] [CrossRef]
- Liu, C.; Wang, P.; Xu, M.; Liu, P. Analysis on spatial difference of cultivated land use efficiency in multi-ethnic mountainous areas of Western Hunan. J. Glaciol. Geocryol. 2013, 35, 1308–1318. [Google Scholar]
- Jin, G.; Deng, X.; Zhao, X.D.; Guo, B.; Yang, J. Spatio-temporal patterns of urban land use efficiency in the Yangtze River Economic Zone during 2005–2014. Acta Geogr. Sin. 2018, 73, 1242–1252. [Google Scholar]
- Chen, Y.; Li, S.; Cheng, L. Evaluation of Cultivated Land Use Efficiency with Environmental Constraints in the Dongting Lake Eco-Economic Zone of Hunan Province, China. Land 2020, 9, 440. [Google Scholar] [CrossRef]
- Guo, L.; Lin, E. Carbon sink in cropland soils and the emission of greenhouse gases from paddy soils: A review of work in China. Chemosphere Glob. Change Sci. 2001, 3, 413–418. [Google Scholar]
- Ying, L.; Huang, X.; Feng, Z. Analysis of carbon emission effects of different land use modes in Jiangsu Province. Trans. Chin. Soc. Agric. Eng. 2008, 24, 102–107. [Google Scholar]
- Bo, L.; Zhang, J. Study on Carbon Effects and Spatial Differences Based on Changes in China’s Agricultural Land Use. Econ. Geogr. 2012, 32, 135–140. [Google Scholar]
- Wang, Y.; Luo, G.P.; Zhao, S.B.; Han, Q.F.; Li, C.F.; Fan, B.B.; Chen, Y.L. Effects of arable land change on regional carbon balance in Xinjiang. Acta Geographica Sin. 2014, 69, 110–120. [Google Scholar]
- Kong, X.; Dao, T.H.; Qin, J.; Qin, H.; Li, C.; Zhang, F. Effects of soil texture and land use interactions on organic carbon in soils in North China cities’ urban fringe. Geoderma 2009, 154, 86–92. [Google Scholar] [CrossRef]
- Feng, Y.G.; Peng, J.; Deng, Z.B.; Wang, J. Spatial-temporal Variation of Cultivated Land’ s Utilization Efficiency in China Based on the Dual Perspective of Non-point Source Pollution and Carbon Emission. China Popul. Resour. Environ. 2015, 25, 18–25. [Google Scholar]
- Lu, Y.; Wu, P. Analysis on the utilization efficiency of agricultural total factor cultivated land and its influencing factors in China during the transition period. J. Finance Res. 2011, 7, 114–127. [Google Scholar]
- He, D.; Yang, R.; Zhan, Z. Evaluation of cultivated land use efficiency based on DEA model. Jiangsu Agric. Sci. 2018, 46, 327–330. [Google Scholar]
- Liu, Y.; Zhang, L. Cultivated land productivity and total factor cultivated land use efficiency—Comparison of provincial data based on sbm-dea method. J. Agrotech. Econ. 2012, 6, 47–56. [Google Scholar]
- Xu, Q.; Lei, G.; Yang, H. Study on temporal and spatial differences and influencing factors of cultivated land use efficiency in Heilongjiang Province. Chin. J. Agric. Resour. Reg. Plan. 2017, 17, 33–40. [Google Scholar]
- Liang, L.; Qu, F.; Wang, C. Analysis of cultivated land use efficiency based on DEA method. Resour. Environ. Yangtze Basin 2008, 2, 242–246. [Google Scholar]
- Yang, S.; Yu, W.; Li, S. Study on the Non-effective Improvement of Productive Efficiency of Cultivated Land in Shaanxi Province Based on DEA. China Land Sci. 2013, 27, 62–68. [Google Scholar]
- Gong, P.; Han, Z. Study on input-output efficiency of cultivated land in Shandong Province Based on DEA model. Chin. J. Agric. Resour. Reg. Plan. 2015, 36, 123–131. [Google Scholar]
- Jing, Y.; Ye, Z. Analysis of cultivated land use efficiency and influencing factors in Jiangxi Province Based on DEA. Res. Soil Water Conserv. 2015, 22, 257–261. [Google Scholar]
- Jing, H.; Ma, B.; Xue, D. Land use efficiency and Optimization Countermeasures of Xi’an Based on SE-DEA model. Arid. Zone Res. 2015, 32, 630–636. [Google Scholar]
- Sun, Y.; Tu, W. Analysis on utilization efficiency of cultivated land resources in Jingzhou City Based on DEA model. Resour. Environ. Yangtze Basin 2017, 38, 93–97. [Google Scholar]
- Zhao, Z.; Bai, Y.; Hu, Z.; Chen, J.; Deng, X. Ecological efficiency evaluation and influencing factors analysis of grassland and animal husbandry in Hulunbuir area based on super efficiency DEA. Acta Ecol. Sin. 2018, 38, 7968–7978. [Google Scholar]
- Bai, Z.; Chen, Y.; Xie, B.; Wu, W. Study on the relationship between landscape fragmentation and cultivated land use efficiency supported by ArcGIS—A case study of Kangle County, Gansu Province. J. Arid. Land Resour. Environ. 2014, 28, 42–47. [Google Scholar]
- Li, X.; Ou, M.; Ma, X. Study on the impact of fragmentation on cultivated land use efficiency based on landscape index—A case study of Lixiahe area in Yangzhou City. J. Nat. Resour. 2011, 26, 1758–1767. [Google Scholar]
- Li, S.; Xu, L.; Fang, M.; Rui, W.; Ju, X.; Lu, Z.; Wan, K. Analysis of Correlation Between Farmland Landscape Fragmentation and Utilization Efficiency in Manas River Basin, Xinjiang Uygur Autonomous Region. Res. Soil Water Conserv. 2017, 24, 311–316. [Google Scholar]
- Zu, J.; Zhang, B.; Kong, X. Characteristics of cultivated land fragmentation and its utilization efficiency in mountainous and hilly areas of Southwest China—A case study of Caohai village, Guizhou Province. J. China Agric. Univ. 2016, 21, 104–113. [Google Scholar]
- Huang, S.; Chen, Y.; Zhang, R.; Wu, W.; Wei, C. Spatial correlation analysis between cultivated land fragmentation and agricultural economic level based on landscape index. Agric. Res. Arid. Areas 2015, 33, 238–244. [Google Scholar]
- Xu, Y.; Yang, G.; Wen, G. The impact of cultivated land fragmentation on cultivated land use efficiency—An Empirical Analysis Based on farmers with different business scales. Res. Agric. Mod. 2017, 38, 688–695. [Google Scholar]
- Zhang, Y.; Chen, Y.; Liu, Y.; Lu, Z. Influence of farmers’ land values on cultivated land use efficiency. J. Arid. Land Resour. Environ. 2017, 31, 19–25. [Google Scholar]
- Zhou, D.; Shao, J.; Liu, J.; Wang, J. Study on the difference of cultivated land use efficiency among different types of farmers—A case study of Wulong, Chongqing. J. Southwest Univ. (Nat. Sci. Ed.) 2017, 39, 141–149. [Google Scholar]
- Wang, Y.; Hao, H.; Zhang, H.; Zhai, R.; Zhang, Q. Farmers’ livelihood differentiation and its impact on cultivated land utilization in the agro pastoral ecotone—A case study of Yanchi County, Ningxia. J. Nat. Resour. 2018, 33, 302–312. [Google Scholar]
- Ma, C.; Liu, L.; Yuan, C.; Ren, G. Evaluation of cultivated land use intensity of farmers with different livelihood types in rapid urbanization area—A case study of Qingpu District, Shanghai. China Land Sci. 2017, 31, 69–78. [Google Scholar]
- Li, H.; Cai, Y.; Wang, Y. Evaluation of functional heterogeneity and individual differences in household cultivated land use—A case study of typical areas in Hubei Province. J. Nat. Resour. 2016, 31, 228–240. [Google Scholar]
- Yang, J.; Yang, G.; Hu, X. The impact of agricultural labor age on Farmers’ cultivated land use efficiency—An Empirical Study from regions with different levels of economic development. Resour. Sci. 2011, 33, 1691–1698. [Google Scholar]
- Yang, Z.; Li, P.; Wang, Y. The impact of rural labor aging on Farmers’ cultivated land use efficiency. Areal Res. Dev. 2015, 34, 167–171. [Google Scholar]
- Wang, Y.; Liu, X. Study on the impact of rural labor price change on the sustainable use of cultivated land—Based on the analysis of county-level panel data in Hubei Province. Price Theory Pract. 2016, 2, 85–87. [Google Scholar]
- Dan, Y.; Zhu, F.; Ke, X. Temporal and spatial differentiation of cultivated land use efficiency and differential regulation of agricultural labor force in Hubei Province. J. Appl. Sci. 2015, 33, 419–428. [Google Scholar]
- Long, K.; Chen, L.; Zhan, X. Comparative analysis of input-output efficiency of different land use types -a case study of cultivated land and industrial land in Jiangsu Province. China Popul. Resour. Environ. 2008, 5, 174–178. [Google Scholar]
- Wang, H.; Han, G.; Xie, X. Temporal and spatial pattern evolution and influencing factors of cultivated land use efficiency in Southwest China based on DEA model. Resour. Environ. Yangtze Basin 2018, 27, 2784–2795. [Google Scholar]
- Zhou, X.; Lu, G. Study on industrial ecological efficiency in arid area based on super efficiency DEA Model—A case study of Xinjiang. Arid. Zone Res. 2019, 36, 1–10. [Google Scholar]
- Zhang, L.; Zhu, D.; Xie, B.; Du, T.; Wang, X. Temporal and spatial pattern evolution and influencing factors of cultivated land use efficiency in China’s main grain producing areas—An Empirical Study Based on 180 prefecture level cities. Resour. Sci. 2017, 39, 608–619. [Google Scholar]
- Yang, Y.; Deng, X.; Li, Z.; Feng, W.; Li, X. Impact of land use change on grain production efficiency in North China Plain during 2000–2015. Geogr. Res. Aust. 2017, 36, 2171–2183. [Google Scholar]
- Wang, L.; Hui, L. Cultivated land use efficiency and the regional characteristics of its influencing factors in China: By using a panel data of 281 prefectural cities and the stochastic frontier production function. Geogr. Res. Aust. 2014, 33, 1995–2004. [Google Scholar]
- Ma, X.; Wang, C.; Yu, Y.; Li, Y.; Dong, B.; Zhang, X.; Niu, X.; Yang, Q.; Chen, R.; Li, Y.; et al. Ecological efficiency in China and its influencing factors-a super-efficient SBM metafrontier-Malmquist-Tobit model study. Environ. Sci. Pollut. Res. Int. 2018, 25, 20880–20898. [Google Scholar] [CrossRef] [PubMed]
- Huang, Y.; Liu, S. Efficiency evaluation of a sustainable hydrogen production scheme based on super efficiency SBM model. J. Clean Prod. 2020, 256, 120447. [Google Scholar] [CrossRef]
- Zanboori, E.; Rostamy-Malkhalifeh, M.; Jahanshahloo, G.R.; Shoja, N. Calculating super efficiency of DMUs for ranking units in data envelopment analysis based on SBM model. Sci. World J. 2014, 2014, 382390. [Google Scholar] [CrossRef] [Green Version]
- Zhou, X.; Yuan, L. Evaluation on Cultivated Land Use Efficiency in Zuojiang River Basin Based on MODIS EVI. Res. Soil Water Conserv. 2010, 17, 79–81, 86. [Google Scholar]
- Zhou, Y.; Chen, W.; Zhu, L. Spatial Econometric Analysis on the Effect of Urbanization on the Cultivated Land Use Efficiency in He’nan Province. Res. Soil Water Conserv. 2018, 25, 274–280, 287. [Google Scholar]
- Fetzel, T.; Niedertscheider, M.; Haberl, H.; Krausmann, F.; Erb, K. Patterns and changes of land use and land-use efficiency in Africa 1980–2005: An analysis based on the human appropriation of net primary production framework. Reg. Environ. Change 2016, 16, 1507–1520. [Google Scholar] [CrossRef]
- Matthews, K.B.; Buchan, K.; Sibbald, A.R.; Craw, S. Combining deliberative and computer-based methods for multi-objective land-use planning. Agr. Syst. 2004, 87, 18–37. [Google Scholar] [CrossRef]
- Herzig, A.; Nguyen, T.T.; Ausseil, A.E.; Maharjan, G.R.; Dymond, J.R.; Arnhold, S.; Koellner, T.; Rutledge, D.; Tenhunen, J. Assessing resource-use efficiency of land use. Environ. Modell. Softw. 2018, 107, 34–49. [Google Scholar] [CrossRef]
- Nosov, V.V.; Kozin, M.N.; Andreev, V.I.; Surzhanskaya, I.Y.; Murzina, E.A. Increasing the Efficiency of Land Resources Use for an Agricultural Enterprise. Res. J. Pharm. Biol. Chem. Sci. 2016, 7, 382–385. [Google Scholar]
- Onaindia, M.; Peña, L.; de Manuel, B.F.; Rodríguez-Loinaz, G.; Madariaga, I.; Palacios-Agúndez, I.; Ametzaga-Arregi, I. Land use efficiency through analysis of agrological capacity and ecosystem services in an industrialized region (Biscay, Spain). Land Use Policy 2018, 78, 650–661. [Google Scholar] [CrossRef]
- Quaye, A.K.; Hall, C.A.S.; Luzadis, V.A. Agricultural land use efficiency and food crop production in Ghana. Environ. Dev. Sustain. 2010, 12, 967–983. [Google Scholar] [CrossRef]
- Yerseitova, A.; Issakova, S.; Jakisheva, L.; Nauryzbekova, A.; Moldasheva, A. Efficiency of using agricultural land in Kazakhstan. Entrep. Sustain. Issues 2018, 6, 558–576. [Google Scholar] [CrossRef] [Green Version]
- Moutinho, V.; Madaleno, M.; Macedo, P.; Robaina, M.; Marques, C. Efficiency in the European agricultural sector: Environment and resources. Environ. Sci. Pollut. R 2018, 25, 17927–17941. [Google Scholar] [CrossRef]
- Raheli, H.; Rezaei, R.M.; Jadidi, M.R.; Mobtaker, H.G. A two-stage DEA model to evaluate sustainability and energy efficiency of tomato production. Inf. Process. Agric. 2017, 4, 342–350. [Google Scholar] [CrossRef]
- Souza, G.D.S.E.; Gomes, E.G. Improving agricultural economic efficiency in Brazil. Int. T Oper. Res. 2015, 22, 329–337. [Google Scholar] [CrossRef] [Green Version]
- Yilmaz, B.; Yurdusev, M.A.; Harmancioglu, N.B. The Assessment of Irrigation Efficiency in Buyuk Menderes Basin. Water Resour. Manag. 2009, 23, 1081–1095. [Google Scholar] [CrossRef]
- Ray, S.C.; Ghose, A. Production efficiency in Indian agriculture: An assessment of the post green revolution years. Omega 2014, 44, 58–69. [Google Scholar] [CrossRef]
- Mailena, L.; Shamsudin, M.N.; Radam, A.; Latief, I. Rice Farms Efficiency and Factors Affecting the Efficiency in MADA Malaysia. J. Appl. Sci. 2014, 14, 2177–2182. [Google Scholar] [CrossRef] [Green Version]
- Han, H.; Zhang, X. Static and dynamic cultivated land use efficiency in China: A minimum distance to strong efficient frontier approach. J. Clean Prod. 2020, 246, 119002. [Google Scholar] [CrossRef]
- Zhang, C.; Su, Y.; Yang, G.; Chen, D.; Yang, R. Spatial-Temporal Characteristics of Cultivated Land Use Efficiency in Major Function-Oriented Zones: A Case Study of Zhejiang Province, China. Land 2020, 9, 114. [Google Scholar] [CrossRef]
- Luan, J.; Jiao, L.; Zhu, Q. Study on temporal and spatial differences and influencing factors of cultivated land use efficiency- Based on Rural Revitalization Strategy. J. Shanxi Agric. Univ. (Soc. Sci. Ed.) 2018, 17, 45–53. [Google Scholar]
- Liao, L.W.; Gao, X.L.; Long, H.L.; Tang, L.S.; Chen, K.Q.; Ma, E.P. A comparative study of farmland use morphology in plain and mountainous areas based on farmers’ land use efficiency. Acta Geogr. Sin. 2021, 76, 471–486. [Google Scholar]
- Wang, X.; Li, C.; Liu, Y.; Ji, Z.; Li, L.; Lin, Y. Zoning and Improving Path of Cultivated Land Use Efficiency Based on Evaluation of Cultivated Land Suitability. Trans. Chin. Soc. Agric. Mach. 2021, 52, 212–218. [Google Scholar]
- Ji, Z.X.; Wang, X.L.; Li, L.; Guan, X.K.; Yu, L.; Xu, Y.Q. The evolution of cultivated land utilization efficiency and its influencing factors in Nanyang Basin. J. Nat. Resour. 2021, 36, 688–701. [Google Scholar] [CrossRef]
- Tone, K. A slacks-based measure of efficiency in data envelopment analysis. Eur. J. Oper. Res. 2001, 130, 498–509. [Google Scholar] [CrossRef] [Green Version]
- Wang, S.; Gao, S.; Huang, Y.; Shi, C. Temporal and spatial evolution pattern and prediction of China’s urban carbon emission performance based on super efficiency SBM model. Acta Geogr. Sin. 2020, 75, 1316–1330. [Google Scholar]
- Zhou, C.; Shi, C.; Wang, S.; Zhang, G. Estimation of eco-efficiency and its influencing factors in Guangdong province based on Super-SBM and panel regression models. Ecol. Indic. 2018, 86, 67–80. [Google Scholar] [CrossRef]
- Wang, J.; Wang, S.; Li, S.; Cai, Q.; Gao, S. Evaluating the energy-environment efficiency and its determinants in Guangdong using a slack-based measure with environmental undesirable outputs and panel data model. Sci. Total Environ. 2019, 663, 878–888. [Google Scholar] [CrossRef]
- Lu, J.; Wang, X. Temporal and spatial characteristics and influencing factors of urban green innovation efficiency in the Yangtze River Economic Belt. Sci. Technol. Manag. Res. 2021, 41, 224–232. [Google Scholar]
- Zhang, J.; Zeng, W.; Wang, J.; Yang, F.; Jiang, H. Regional low-carbon economy efficiency in China: Analysis based on the Super-SBM model with CO2 emissions. J. Clean Prod. 2017, 163, 202–211. [Google Scholar] [CrossRef]
- Qin, Z.; Li, W.; Xiong, X. Estimating wind speed probability distribution using kernel density method. Electr. Power Syst. Res. 2011, 81, 2139–2146. [Google Scholar] [CrossRef]
- Dehnad, K. Density Estimation for Statistics and Data Analysis. Technometrics 1987, 29, 495. [Google Scholar] [CrossRef]
- Kuang, B.; Lu, X.H.; Zhou, M. Dynamic Evolution of Urban Land Economic Density Distribution in China. China Land Sci. 2016, 30, 47–54. [Google Scholar]
- Luo, X.; Ao, X.; Zhang, Z.; Wan, Q.; Liu, X. Spatiotemporal variations of cultivated land use efficiency in the Yangtze River Economic Belt based on carbon emission constraints. J. Geogr. Sci. 2020, 30, 535–552. [Google Scholar] [CrossRef]
- Tobin, J. Estimation of Relationships for Limited Dependent Variables. Econometrica 1958, 26, 24. [Google Scholar] [CrossRef] [Green Version]
- Cui, N.; Wang, X.; Yu, Z. Analysis Ecological Efficiency Evaluation and Influencing Factors of Cultivated Land of Grain Production in Northeast Main Production Area. Ecol. Econ. 2021, 37, 104–110. [Google Scholar]
- Peng, J.; Wen, L.; Fu, L.; Yi, M. Total factor productivity of cultivated land use in China under environmental constraints: Temporal and spatial variations and their influencing factors. Environ. Sci. Pollut. R 2020, 27, 18443–18462. [Google Scholar] [CrossRef]
- Zhang, L.; Zhu, D.; Xie, B.; Du, T.; Wang, X. Spatiotemporal pattern evolvement and driving factors of cultivated land utilization efficiency of the major grain producing area in China. Resour. Sci. 2017, 39, 608–619. [Google Scholar]
- Zhang, R.; Jia, H. Spatial-temporal pattern differentiation and its mechanism analysis of using efficiency for provincial cultivated land in China. Trans. Chin. Soc. Agric. Eng. 2015, 31, 277–287. [Google Scholar]
- Yang, S.; Li, S.; Lie, L. Study on cultivated land use efficiency and its influencing factors in Shaanxi Province. China Land Sci. 2011, 25, 47–54. [Google Scholar] [CrossRef]
- You, H.; Wu, C. Analysis of carbon emission efficiency and optimization of low carbon for agricultural land intensive use. Trans. Chin. Soc. Agric. Eng. 2014, 2, 224–234. [Google Scholar]
- Wang, B.; Zhang, W. Study on measurement and temporal and spatial difference of agricultural ecological efficiency in China. China Popul. Resour. Environ. 2016, 26, 11–19. [Google Scholar] [CrossRef]
- West, T.O.; Marland, G. A synthesis of carbon sequestration, carbon emissions, and net carbon flux in agriculture: Comparing tillage practices in the United States. Agric. Ecosyst. Environ. 2002, 91, 217–232. [Google Scholar] [CrossRef]
- Post, W.M.; Kwon, K.C. Soil carbon sequestration and land-use change: Processes and potential. Glob. Change Biol. 2000, 6, 317–327. [Google Scholar] [CrossRef] [Green Version]
- Bo, L.; Zhang, J.; Li, H. Research on Spatial-temporal Characteristics and Affecting Factors Decomposition of Agricultural Carbon Emission in China. China Popul. Resour. Environ. 2011, 21, 80–86. [Google Scholar]
- Kuang, B.; Lu, X.; Zhou, M.; Chen, D. Provincial cultivated land use efficiency in China: Empirical analysis based on the SBM-DEA model with carbon emissions considered. Technol. Forecast. Soc. 2020, 151, 119874. [Google Scholar] [CrossRef]
- Yun, T.; Wang, M. Temporal and spatial differences and influencing factors of agricultural carbon emission efficiency in Hubei Province. Sci. Agric. Sin. 2020, 53, 5063–5072. [Google Scholar]
- Xiao, L.; Shandong, N.; Guozheng, G.; Wenlong, P. Sustainable intensification of cultivated land use in China from the perspective of ‘new agriculture, rural areas and farmers’: Conceptual cognition and research framework. J. Nat. Resour. 2020, 35, 2029–2043. [Google Scholar]
- Xin, Z.; Xiao, L.; Peng, W.; Niu, S. Hot spots and trends of intensive research on cultivated land use in China—Knowledge map analysis based on CiteSpace. Chin. J. Soil Sci. 2020, 51, 986–995. [Google Scholar]
- Xie, H.; Zhang, Y.; Choi, Y. Measuring the Cultivated Land Use Efficiency of the Main Grain-Producing Areas in China under the Constraints of Carbon Emissions and Agricultural Nonpoint Source Pollution. Sustainability 2018, 10, 1932. [Google Scholar] [CrossRef] [Green Version]
- Wen, G.; Hu, R.; Tang, X.; Tang, Y.; Zheng, J.; Meng, J. Spatiotemporal Characteristics of Carbon Emission and Ecological Efficiency of Cultivated Land Use in Dongting Lake Region. Ecol. Econ. 2021, 1–15. [Google Scholar]
- Shi, Y.; Xiao, L.; Guo, G.; Chen, G. Study on temporal and spatial pattern and driving mechanism of cultivated land use transformation based on GIS and spatial measurement. China Land Sci. 2019, 33, 51–60. [Google Scholar]
- Chebochakov, E.Y. Efficiency of the Erosion Protection Methods Involving Biologizing Agriculture in the Steppe and Forest-steppe Areas of Cultivated Land in Siberia. Int. J. Nutr. Food Sci. 2020, 9, 6–9. [Google Scholar] [CrossRef]
- Ge, S.; Zhang, H. Cultivated Land Use Layout Adjustment Based on Crop Planting Suitability: A Case Study of Typical Counties in Northeast China. Land 2021, 10, 107. [Google Scholar]
- Xiao, P.; Zhou, Y.; Li, X.; Xu, J.; Zhao, C. Assessment of Heavy Metals in Agricultural Land: A Literature Review Based on Bibliometric Analysis. Sustainability 2021, 13, 4559. [Google Scholar] [CrossRef]
- Han, H.; Zhang, X. Exploring environmental efficiency and total factor productivity of cultivated land use in China. Sci. Total Environ. 2020, 726, 138434. [Google Scholar] [CrossRef]
- Zhang, S.; Hu, W.; Huang, L.; Du, H. Exploring the Effectiveness of Multifunctional Cultivated Land Protection Linking Supply to Demand in Value Engineering Theory: Evidence from Wuhan Metropolitan Area. Sustainability 2019, 11, 6229. [Google Scholar] [CrossRef] [Green Version]
- Huang, X. Study on cultivated land use efficiency in Jiangxi Province from the perspective of non-point source pollution. Chin. J. Agric. Resour. Reg. Plan. 2018, 39, 177–183. [Google Scholar]
- Feng, Y.; Jue, P.; Deng, Z.; Ju, W. Temporal and spatial differentiation of cultivated land use efficiency in China from the perspective of non-point source pollution and carbon emission. China Popul. Resour. Environ. 2015, 25, 18–25. [Google Scholar]
- Pang, Y.; Wang, X. Land-Use Efficiency in Shandong (China): Empirical Analysis Based on a Super-SBM Model. Sustainability 2020, 12, 10618. [Google Scholar] [CrossRef]
- Tran, D.; Vu, H.T.; Goto, D. Agricultural land consolidation, labor allocation and land productivity: A case study of plot exchange policy in Vietnam. Econ. Anal. Policy 2022, 73, 455–473. [Google Scholar] [CrossRef]
- Barati, A.A.; Azadi, H.; Scheffran, J. Agricultural land fragmentation in Iran: Application of game theory. Land Use Policy 2021, 100, 105049. [Google Scholar] [CrossRef]
- Li, L.; Qi, Z.; Xian, S.; Yao, D. Agricultural Land Use Change in Chongqing and the Policy Rationale behind It: A Multiscale Perspective. Land 2021, 10, 275. [Google Scholar] [CrossRef]
- Luis, S.S.; de Vasconcelos Ana Carolina, F.; Michelle, B.; Stefan, S.; Alexandre, S.; Marcos, L. Agricultural land use dynamics in the Brazilian part of La Plata Basin: From driving forces to societal responses. Land Use Policy 2021, 107, 105519. [Google Scholar]
- Anne, S.E.; Simon, S.; Kevin, M. Agricultural land use management responses to a cap and trade regime for water quality in Lake Taupo catchment, New Zealand. Land Use Policy 2021, 102, 105200. [Google Scholar]
- Joseph, O.A.; Williams, A.D.; Augustus, K.S.; Daniel, K. Analysing patterns of forest cover change and related land uses in the Tano-Offin Forest Reserve in Ghana: Implications for forest policy and land management. Trees For. People 2021, 5, 100105. [Google Scholar]
- Xu, W.; Jin, X.; Liu, J.; Zhou, Y. Analysis of influencing factors of cultivated land fragmentation based on hierarchical linear model: A case study of Jiangsu Province, China. Land Use Policy 2020, 101, 105119. [Google Scholar] [CrossRef]
- Yao, Z.; Wang, B.; Huang, J.; Zhang, Y.; Yang, J.; Deng, R.; Yang, Q. Analysis of Land Use Changes and Driving Forces in the Yanhe River Basin from 1980 to 2015. J. Sens. 2021, 2021, 6692333. [Google Scholar] [CrossRef]
- Fang, H. Changes in Cultivated Land Area and Associated Soil and SOC Losses in Northeastern China: The Role of Land Use Policies. Int. J. Environ. Res. Public Health 2021, 18, 11314. [Google Scholar] [CrossRef]
- Emmanuel, A.I.; William, N.; Miroslava, B.; Yakubu, M.M. Effects of Agricultural Programmes and Land Ownership on the Adoption of Sustainable Agricultural Practices in Nigeria. Sustainability 2021, 13, 7249. [Google Scholar]
- Ge, S.; Yue, W.; Ke, Z.; Zhou, C. Simulation of security pattern of cultivated land use system in Northeast China and determination of its threshold. Geogr. Res. Aust. 2015, 34, 555–566. [Google Scholar]
- Lu, X.; Zhang, Y.; Zou, Y. Evaluation the effect of cultivated land protection policies based on the cloud model: A case study of Xingning, China. Ecol. Indic. 2021, 131, 108247. [Google Scholar] [CrossRef]
- Zhou, Y.; Yang, Z. Analysis on the temporal and spatial characteristics of China’s provincial grain green total factor productivity from the perspective of ecological value. Chin. J. Eco Agric. 2021, 29, 1786–1799. [Google Scholar]
- Lu, X.; Zhang, Y.; Zou, Y. Evolutionary Game and Numerical Simulation of Cultivated Land Protection Policies Implementation in China. Discret. Dyn. Nat. Soc. 2021, 2021, 5600298. [Google Scholar] [CrossRef]
- Nam, P.P.; Huyen, P.T.T.; Van Ha, P. Factors affecting the management of public agricultural land fund in Gia Lam District, Hanoi City, Vietnam. Land Use Policy 2020, 101, 105151. [Google Scholar] [CrossRef]
- Lin, W.; Huang, J. Impacts of agricultural incentive policies on land rental prices: New evidence from China. Food Policy 2021, 104, 102125. [Google Scholar] [CrossRef]


| Index | Indicators | Symbol | Variable | Unit | Data Source |
|---|---|---|---|---|---|
| Input | Land input | Sown area of farm crops | 103 hm2 | Hubei Rural Statistical Yearbook | |
| Labor input | Rural population 1 | 104 people | Hubei Rural Statistical Yearbook | ||
| Capital input | Total power of agricultural machinery 2 | 104 kw | Hubei Rural Statistical Yearbook | ||
| Material input | Consumption of chemical fertilizers | 104 t | Municipal Statistical Yearbook | ||
| Consumption of pesticides | 104 t | Municipal Statistical Yearbook | |||
| Consumption of plastic film for farm use | 104 t | Municipal Statistical Yearbook | |||
| Effective irrigation area | 103 hm2 | Hubei Rural Statistical Yearbook | |||
| Output | Desirable output | Gross agricultural production | 104 CNY | Hubei Rural Statistical Yearbook | |
| Output of grain | 104 t | Hubei Rural Statistical Yearbook | |||
| Undesirable output | Carbon emissions | 104 t | Municipal Statistical Yearbook |
| Category | Carbon Emission Coefficient | Unit | Reference | Data Sources |
|---|---|---|---|---|
| Chemical fertilizer | 0.896 | kg/kg | West et al. [85] | Municipal Statistical Yearbook |
| Pesticides | 4.934 | kg/kg | Post et al. [86] | Municipal Statistical Yearbook |
| Agricultural film | 5.180 | kg/kg | Bo, L. et al. [87] | Municipal Statistical Yearbook |
| Total mechanical power | 0.180 | kg/kW | West et al. [85] | Hubei Rural Statistical Yearbook |
| Effective irrigation area | 20.5 | kg/hm2 | Bo, L. et al. [87] | Hubei Rural Statistical Yearbook |
| Ploughing (sown area of crops) | 3.126 | kg/hm2 | Bo, L. et al. [87] | Hubei Rural Statistical Yearbook |
| Index | Index Calculation |
|---|---|
| Farmers’ income level | Per capita disposable income of farmers (CNY 10,000) |
| Urbanization level | Urban population/total population (10,000 people/10,000 people) |
| Agricultural industrial structure | Total output value of planting industry/total output value of agriculture, forestry, animal husbandry and fishery (CNY 10,000/CNY 10,000) |
| Rural power consumption | Rural power consumption/rural population (10,000 kwh/10,000 people) |
| Scale of arable land per capita | Planting area/rural population (Ha/person) |
| Mechanization level | Total power of agricultural machinery/planting area (10,000 kW/HA) |
| Urban-rural income gap | Per capita disposable income of urban residents/average annual disposable income of rural residents (CNY 10,000/CNY 10,000) |
| Year | Model | Plain Area | Hilly Area | Mountain Area | Total Average |
|---|---|---|---|---|---|
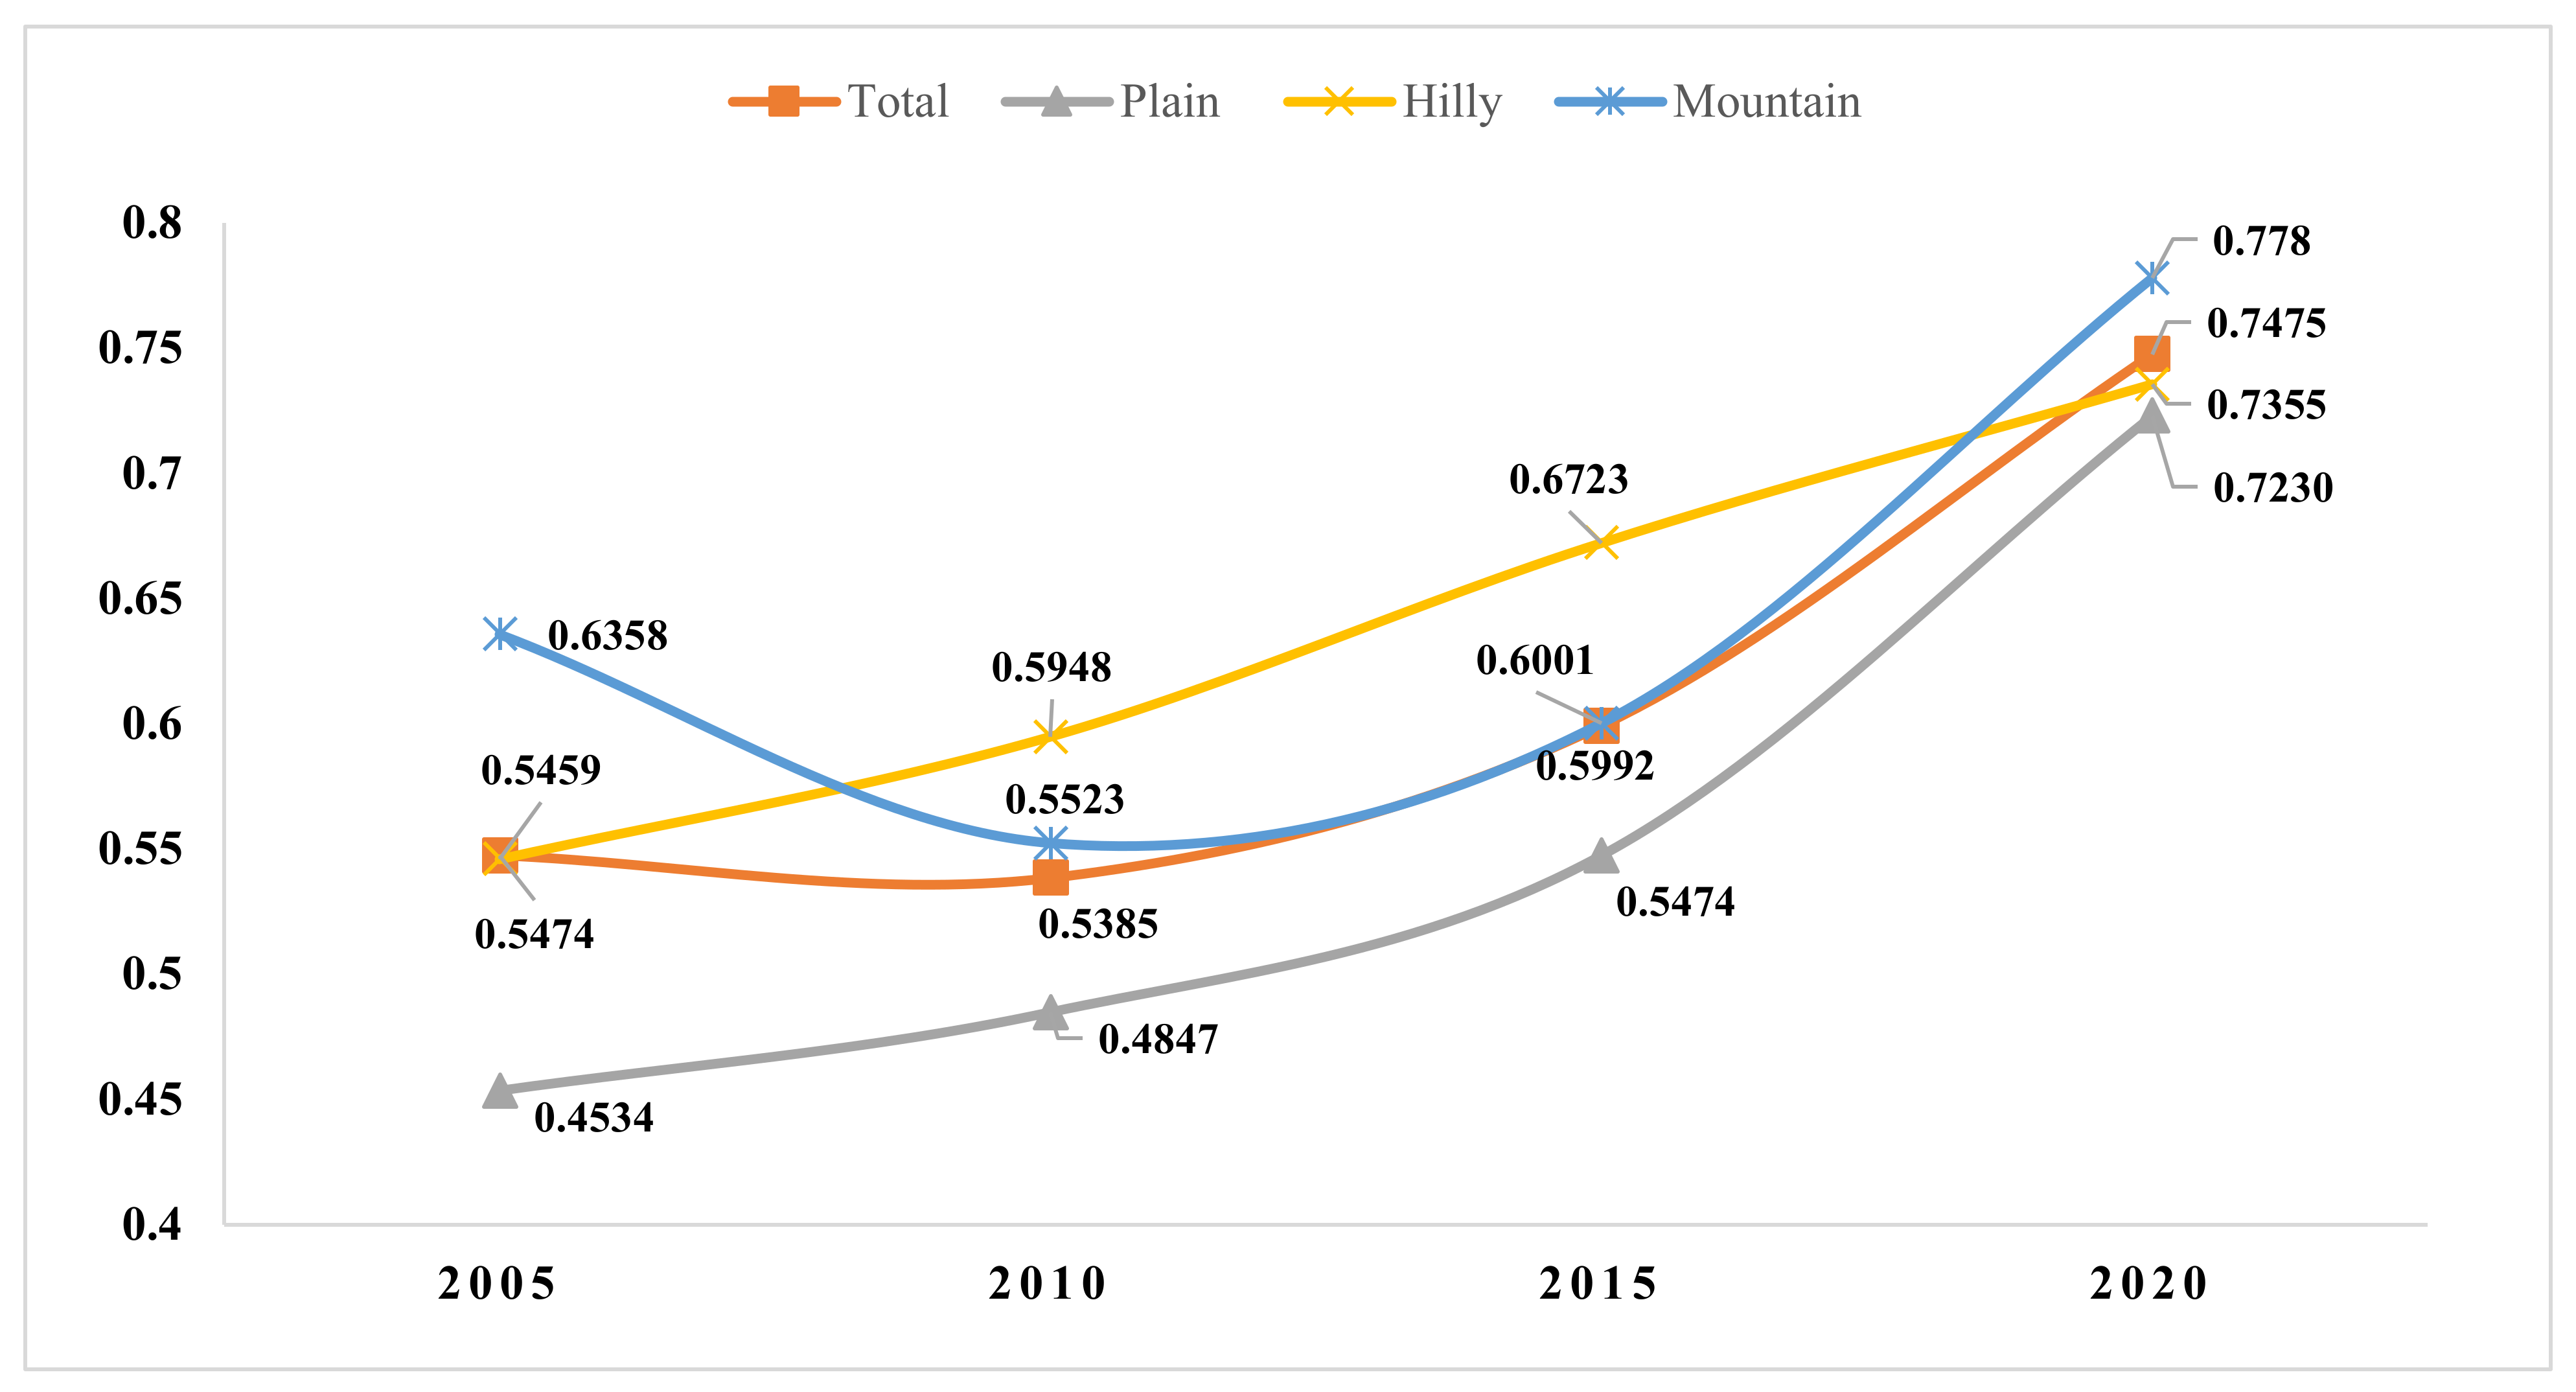
| 2005 | Super SBM-U | 0.4534 | 0.5459 | 0.6358 | 0.5474 |
| Super SBM | 0.4956 | 0.5729 | 0.6785 | 0.5860 | |
| 2010 | Super SBM-U | 0.4847 | 0.5948 | 0.5523 | 0.5385 |
| Super SBM | 0.5141 | 0.5978 | 0.5813 | 0.5611 | |
| 2015 | Super SBM-U | 0.5474 | 0.6723 | 0.6001 | 0.5992 |
| Super SBM | 0.5714 | 0.6631 | 0.6836 | 0.6379 | |
| 2020 | Super SBM-U | 0.7230 | 0.7355 | 0.7780 | 0.7475 |
| Super SBM | 0.7400 | 0.7419 | 0.8337 | 0.7769 | |
| 2005–2010 | Super SBM-U | 0.0313 | 0.0489 | −0.0835 | — |
| Super SBM | 0.0185 | 0.0249 | −0.0972 | ||
| 2010–2015 | Super SBM-U | 0.0627 | 0.0775 | 0.0478 | — |
| Super SBM | 0.0573 | 0.0653 | 0.1023 | ||
| 2015–2020 | Super SBM-U | 0.1756 | 0.0632 | 0.1778 | — |
| Super SBM | 0.1686 | 0.0788 | 0.1501 | ||
| 2005–2020 | Super SBM-U | 0.2696 | 0.1896 | 0.1421 | — |
| Super SBM | 0.2444 | 0.1690 | 0.1552 | ||
| Average (2005–2020) | Super SBM-U | 0.5521 | 0.6371 | 0.6415 | 0.6103 |
| Super SBM | 0.5803 | 0.6439 | 0.6943 | 0.6395 |
| City | 2005 | 2010 | 2015 | 2020 | 2005–2020 | Rank | |||||
|---|---|---|---|---|---|---|---|---|---|---|---|
| Super SBM | Super SBM-U | Super SBM | Super SBM-U | Super SBM | Super SBM-U | Super SBM | Super SBM-U | Super SBM | Super SBM-U | ||
| Wuhan | 0.4242 | 0.3622 | 0.4417 | 0.3885 | 0.7895 | 0.7434 | 0.7086 | 0.6917 | 0.2844 | 0.3295 | 4 |
| Shiyan | 0.3369 | 0.3150 | 0.4197 | 0.4032 | 0.5610 | 0.4958 | 0.4600 | 0.4069 | 0.1231 | 0.0919 | 11 |
| Huangshi | 0.5030 | 0.4652 | 0.3899 | 0.3945 | 0.5355 | 0.4967 | 0.6869 | 0.6595 | 0.1839 | 0.1943 | 8 |
| Jingzhou | 0.6413 | 0.6316 | 0.5517 | 0.5489 | 0.4486 | 0.4558 | 0.7912 | 0.7812 | 0.1499 | 0.1496 | 9 |
| Yichang | 0.5144 | 0.4529 | 0.4983 | 0.4756 | 0.6446 | 0.6042 | 0.7178 | 0.6717 | 0.2035 | 0.2188 | 5 |
| Xiangyang | 0.5083 | 0.4613 | 0.5419 | 0.5307 | 0.7729 | 0.7241 | 1.0351 | 1.0138 | 0.5268 | 0.5524 | 1 |
| Ezhou | 0.5331 | 0.4135 | 0.6295 | 0.4968 | 0.7191 | 0.5948 | 0.4968 | 0.3957 | −0.0363 | −0.0178 | 14 |
| Jingmen | 0.6631 | 0.6157 | 0.8583 | 0.8256 | 0.8386 | 0.8336 | 0.9968 | 0.7225 | 0.3337 | 0.1068 | 10 |
| Xiaogan | 0.6132 | 0.5782 | 0.6632 | 0.6341 | 0.6670 | 0.6415 | 1.0009 | 0.9588 | 0.3877 | 0.3805 | 2 |
| Huanggang | 0.5719 | 0.5447 | 0.4276 | 0.4138 | 0.5401 | 0.5057 | 0.6071 | 0.5829 | 0.0352 | 0.0382 | 12 |
| Xianning | 0.6849 | 0.6441 | 0.7503 | 0.7303 | 0.8571 | 0.7930 | 1.0396 | 0.9966 | 0.3546 | 0.3525 | 3 |
| Suizhou | 0.5430 | 0.4931 | 1.0126 | 1.0126 | 0.5005 | 0.4685 | 0.4735 | 0.4504 | −0.0695 | −0.0427 | 15 |
| Enshi | 0.8280 | 0.7989 | 0.6685 | 0.6236 | 0.5677 | 0.4799 | 0.7679 | 0.7179 | −0.0601 | −0.0810 | 16 |
| Xiantao | 0.2655 | 0.2856 | 0.2375 | 0.2729 | 0.2936 | 0.3321 | 0.2703 | 0.3234 | 0.0048 | 0.0378 | 13 |
| Tianmen | 0.3545 | 0.3233 | 0.3751 | 0.3852 | 0.4888 | 0.4817 | 0.5674 | 0.5384 | 0.2128 | 0.2151 | 7 |
| Qianjiang | 0.3154 | 0.2881 | 0.2703 | 0.2712 | 0.3553 | 0.3833 | 0.4763 | 0.5057 | 0.1609 | 0.2176 | 6 |
| Average | 0.5172 | 0.4787 | 0.5460 | 0.5255 | 0.5987 | 0.5646 | 0.7091 | 0.6673 | — | — | — |
| Year | Moran’s I | Z Value | p-Value |
|---|---|---|---|
| 2000 | 0.1775 | 3.7561 | 0.0001 |
| 2005 | 0.0982 | 2.2630 | 0.0236 |
| 2010 | 0.1578 | 3.4028 | 0.0006 |
| 2015 | 0.0582 | 1.4200 | 0.1555 |
| 2020 | 0.0582 | 1.4259 | 0.1538 |
| Variable | Total Sample | Plain County | Hilly County | Mountain County |
|---|---|---|---|---|
| Model (1) | Model (2) | Model (3) | Model (4) | |
| Farmers’ income level | 0.2135 *** | 0.1792 *** | 0.1330 * | 0.2770 *** |
| (0.0370) | (0.0605) | (0.0794) | (0.0737) | |
| Urbanization level | −0.2534 * | 0.0060 | 0.1090 | −0.6410 ** |
| (0.1324) | (0.2140) | (0.2710) | (0.2445) | |
| Agricultural industrial structure | −0.0060 | −0.0080 | −0.5387 | 0.2327 |
| (0.0097) | (0.0103) | (0.3778) | (0.3169) | |
| Rural power consumption | −0.0867 *** | −0.0544 | −0.0959 * | −0.0639 |
| (0.0265) | (0.0483) | (0.0494) | (0.0444) | |
| Per capita cultivated land scale | 1.1381 *** | 1.1391 ** | 1.2720 * | 1.0295 |
| (0.3480) | (0.5473) | (0.6517) | (0.6633) | |
| Mechanization level | −0.0177 ** | −0.0138 * | −0.0141 | −0.0579 ** |
| (0.0069) | (0.0076) | (0.0593) | (0.0224) | |
| Income gap between urban and rural areas | 0.0228 | 0.0389 | −0.0542 | −0.0225 |
| (0.0313) | (0.0963) | (0.0703) | (0.0490) | |
| Intercept | 0.0762 *** | −0.0092 | 0.0185 | 0.0977 ** |
| β | (0.0278) | (0.0655) | (0.0731) | (0.0474) |
| N | 288 | 104 | 72 | 112 |
Publisher’s Note: MDPI stays neutral with regard to jurisdictional claims in published maps and institutional affiliations. |
© 2022 by the authors. Licensee MDPI, Basel, Switzerland. This article is an open access article distributed under the terms and conditions of the Creative Commons Attribution (CC BY) license (https://creativecommons.org/licenses/by/4.0/).
Share and Cite
Xiao, P.; Xu, J.; Yu, Z.; Qian, P.; Lu, M.; Ma, C. Spatiotemporal Pattern Differentiation and Influencing Factors of Cultivated Land Use Efficiency in Hubei Province under Carbon Emission Constraints. Sustainability 2022, 14, 7042. https://doi.org/10.3390/su14127042
Xiao P, Xu J, Yu Z, Qian P, Lu M, Ma C. Spatiotemporal Pattern Differentiation and Influencing Factors of Cultivated Land Use Efficiency in Hubei Province under Carbon Emission Constraints. Sustainability. 2022; 14(12):7042. https://doi.org/10.3390/su14127042
Chicago/Turabian StyleXiao, Pengnan, Jie Xu, Zupeng Yu, Peng Qian, Mengyao Lu, and Chao Ma. 2022. "Spatiotemporal Pattern Differentiation and Influencing Factors of Cultivated Land Use Efficiency in Hubei Province under Carbon Emission Constraints" Sustainability 14, no. 12: 7042. https://doi.org/10.3390/su14127042