
Stabilization Strategy of a Novel Car-Following Model with Time Delay and Memory Effect of the Driver

1
Faculty of Maritime and Transportation, Ningbo University, Ningbo 315211, China
2
Jiangsu Province Collaborative Innovation Center for Modern Urban Traffic Technologies, Nanjing 210096, China
3
National Traffic Management Engineering and Technology Research Centre, Ningbo University Sub-Center, Ningbo 315211, China
*
Author to whom correspondence should be addressed.
Sustainability 2022, 14(12), 7281; https://doi.org/10.3390/su14127281
Submission received: 12 May 2022
/
Revised: 10 June 2022
/
Accepted: 12 June 2022
/
Published: 14 June 2022
(This article belongs to the Special Issue Application of Emerging Simulation Technologies in Achieving Sustainable Transportation Systems)
Abstract
:In this paper, a novel car-following model is established integrating the drivers’ memory of previous information. The drivers’ memory of the vehicle ahead is introduced as an influencing factor on the drivers’ expected behavior. The time delay feedback control term is added to the model to increase the stability interval of the system. By comparing the stability intervals of the controlled and uncontrolled models, the necessity of adding a delay feedback control item is demonstrated. The validity and feasibility of the time delay feedback control strategy are proved by numerical simulations. In this paper, the stability interval of the system is determined by the definite integral stability method (DISM) and the Hopf bifurcation analysis method. According to the number of unstable eigenvalues derived from the system eigenvalue equation, the appropriate time delay feedback control parameters are set. By choosing the optimal parameters, the new model can optimize the traffic flow to the maximum extent, eliminate the stop-and-go of vehicles, and make the traffic stable. Numerical examples close to actual traffic conditions are given to verify the feasibility of the control strategy using the verified design steps. Next generation simulation (NGSIM) measurements are used to conduct parameter calibration of the new model.
1. Introduction
With the development of society, the scale of urbanization and industrialization is flourishing, which is making the number of vehicles on urban roads increase rapidly. Too many cars put enormous pressure on road safety. For many years, a large number of researchers have participated in the study of traffic flow dynamic characteristics. In today’s traffic field, traffic flow models can be divided into microscopic models [1,2,3], mesoscopic models [4,5], and macroscopic models [6,7,8].
To study the interaction between vehicles, the first car-following model was proposed by Pipes in 1953 [9]. This model ignored the influence of headway spacing on the following behavior. To solve the problem of Pipes’ model, a nonlinear model considering speed was proposed by Newell in 1961 [10]. Following the Newell model, the optimal velocity model (OVM) was proposed by Bando [11]. As one of the most widely used car-following traffic flow models, the OVM describes stop-and-go traffic flow characteristics and real traffic jams. The OVM is as follows:
where represents the sensitivity coefficient of the driver; represents the headway between the vehicle and the vehicle ; represents the speed of vehicle at time . The OVM not only solves the problem of infinite acceleration of the Newell model, but also reproduces many phenomena, such as traffic instability, stopping, and walking in real traffic.
Regarding the drivers’ memory rule, the research mainly focused on the attenuation rule of drivers’ short-term memory of traffic signs, drivers’ professionalism, age, and other factors. However, drivers’ memory was not considered in the OVM. In real traffic, a driver’s behavior depends not only on the current traffic information, but also on historical information. During driving, the driver will retain the information from the previous period and make a simple prediction of the next period, that is, the driver’s memory is very important to the stability of traffic flow. Zhang [12] established the drivers’ memory by considering the tendency to resist sudden changes in speed and the speed of the previous and next time. The drivers’ memory traffic flow model was proposed. The drive speed at the previous time affects the speed at the later time, which we call memory. Zhang did not study the drivers’ memory models from a micro-perspective. Therefore, the research on the relationship between vehicles is shallow. Yu et al. [13] improved the following model based on Zhang’s model to study the effect of driver memory on traffic flow stability.
Time delay [14] has a significant impact on the evolution of traffic flow and driving performance. In the vehicle-following model, time delay mainly comes from three aspects [15,16]. One is physiological time delay, which is the period between the driver realizing the change in front of their vehicle and controlling the vehicle. The second is mechanical time delay, which refers to the time needed for the driver to take control until the vehicle executes the command. Thirdly, the time delay of movement is the period from when the vehicle executes the driver’s command to when the vehicle reaches the defined state of safety. In 1958, Chandler [17] first proposed a car-following model with time delay based on the classical car following model. The model is as follows:
where represents the speed of the vehicle; is the acceleration; is used to represent the sensitivity coefficient of the driver. represents the delay time of driver to stimulate. Through the asymptotic stability analysis of the model, it is found that when traffic is evenly unstable, which further shows that delay has a significant impact on traffic flow stability. There are two deficiencies in the above model. First, the nonlinear relationship between velocity and density in uniform flow is unclear. Second, there will be a state of excessive traffic flow acceleration. Therefore, Gazis et al. [18] proposed a GHR model, in which the sensitivity coefficient is nonlinearly related to the current speed and the front distance. The GHR model is as follows:
where indicates headway spacing; is response time delay; are constants. The study of vehicle-following models with time delay mainly focuses on the stability analysis of uniform flow and the nonlinear dynamic behavior after instability. The above-mentioned time delay following model mainly studies the static independent relationship among the variables in traffic flow, but the dynamic evolution process in real life can better reflect the real situation. Moreover, the above studies show that time delay has a negative impact on traffic flow. Therefore, how to suppress the effect of time delay on traffic flow is a critical issue. Bifurcation theory can reasonably explain some mechanisms of traffic instability due to time delay [19,20]. Most traffic flow models are nonlinear equations with parameters. The qualitative state of the traffic system changes intrinsically when the parameter changes and crosses some critical value in the model. From a theoretical perspective, this is named bifurcation, which causes transitions between traffic states such as free flow and stop-and-go. The stability of traffic flow is an external manifestation of the bifurcation of the traffic system. Bifurcation is the essential cause of traffic system instability. Gasser et al. [21] summarized the bifurcation phenomena in traffic flow models, but their work did not focus on the important impact of time delay. Orosz et al. [22] particularly emphasized the bifurcation analysis of delay differential equations. Orosz et al. first used the bifurcation theory of time delay dynamic systems to discuss the bifurcation phenomenon in the time delay optimal speed model. It was found that a subcritical Hopf bifurcation occurs after unstable uniform flow, resulting in a bistable region. It was also pointed out that the presence of driver response time delay makes the bistable coexistence region more robust. Jin et al. [23,24] proposed the stability analysis of time delay feedback control following model by bifurcation method. The response of the expected acceleration shows the upper limit of the delay time, and the traffic congestion was suppressed by appropriate feedback gain and time delay. Zhang et al. [25] studied the effect of delay speed on traffic flow through bifurcation analysis. Delay could significantly delay the occurrence of Hopf bifurcations as shown by numerical simulation. Time delay can induce or delay the occurrence of bifurcation.
The above studies show that it is possible to set reasonable controls to eliminate the negative effects of time delay. In recent years, a very popular trajectory tracking control method has emerged. In Wang et al. [26], a symplectic pseudospectral optimal control method is proposed to generate a feasible reference trajectory offline with constraints. At each sampling time, the trajectory tracking controller works by solving the open-loop optimal control problem. Peng et al. [27] proposed a symplectic instantaneous optimal control method based on controlled robot trajectory tracking with input saturation. This method provides a unified framework for solving the trajectory tracking control problem of a multi-body dynamic system of a robot. Shi et al. [28] established the optimal control problem of a motion-driven mechanical system. A symplectic preservation method is presented to solve the optimal control problem of motion-driven systems. Li et al. [29] set control items based on headway spacing and speed difference. The delay changes caused by traffic instability suppress the drivers’ response. Chen et al. [30] proposed an improved model by taking the historical speed difference between the front and rear vehicles as the control term. However, the above studies did not specifically design the control parameters. In summary, previous studies have the following deficiencies: (1) Low concern with the design of control parameters; (2) Ignoring the effect of driver memory on traffic flow; (3) Ignoring the effect of time delay on simulating driver behavior; (4) The delay of the drivers’ response is ignored when modeling the drivers’ behavior. This delay time is unavoidable, which has a huge impact on the control effect of the system; (5) The design of control parameters is difficult to apply in actual scenarios due to redundant iterations.
The specific contributions of this article are as follows:
- (1)
- Driver memory is considered on the basis of OVM, and it is pointed out that drivers’ memory of previous traffic will have a significant impact on subsequent follow-up behavior.
- (2)
- This study comprehensively designs control term parameters to mitigate delay-induced unstable traffic flow.
- (3)
- The control strategy of this study considers the influence of multiple time delays on the traffic flow, which is closer to the actual traffic situation.
- (4)
- The IDISM and Hopf bifurcation analysis methods are used to determine the stability interval of the system. Thus, an appropriate combination of parameters for a drivers’ memory model with time delay feedback control is determined.
The rest of the article is structured as follows: in Section 2, a novel car-following model considering time delay and drivers’ memory is proposed. In Section 3, the uncontrolled model considering drivers’ memory is introduced, and the neutral stability condition of the model is obtained. In Section 4, the specific steps of the delayed feedback control are given, which is prepared for further optimizing the parameter combination. In Section 5, the optimal parameters are numerically simulated to determine their reliability, and a variety of control combinations are tested. The NGSIM [31] data are used for parameter calibration. Finally, some conclusions are drawn in Section 6. The research process and main steps of this paper are shown by the following flowchart (Figure 1):
2. A Novel Time Delayed Car-Following Model
OVM is one of the most widely applied traffic flow models. Based on the OVM, this paper presents the effect of driver memory on traffic flow. Consideration of driver memory can improve traffic flow stability when building a model of following behavior. The effect of drivers’ memory of previous traffic information on subsequent car-following behavior is considered, and the magnitude of the impact on different drivers is distinguished. Relative to vehicle speed, changes in drivers’ memory of the vehicle ahead and current vehicle speed are referenced in the model as influencing factors of driver behavior. A model considering drivers’ memory is proposed as follows:
where is a dimensionless parameter describing the sensitivity of driver’s memory of the previous traffic information; is the sensitivity coefficient; is the memory step with a unit in seconds; is the optimal speed at time; is the actual velocity at ; is the driver memory term, which represents the proportional difference between the optimal speed and the actual speed at the time .
On the basis of the above model, which considers the drivers’ memory, we add control items to the model. The control item takes into account the effect of time delay, and the new model is as follows:
where is the feedback gain representing the velocity difference; represents the time delay of the delayed feedback control signal corresponding to the velocity. is the optimal velocity function [32] which is expressed as follows:
when , Equation (4) is reduced to the OVM. Therefore, the OVM is a special case of the delay feedback control car-following model.
For convenience for stability analysis, we converted the expression (5) to the following expression:
3. Stability Analysis
In this section, the linear stability analysis method is used to analyze the system without time delay feedback control and the stability state of the model is obtained. First, let represent the number of vehicles and the length of the road. Traffic flow stability is defined as all vehicles traveling at optimal speeds and all vehicles having the same headway spacing. The car following model with memory effect is as follows:
In order to analyze the linear stability of the traffic model (8), we considered a scenario where a road is a one-lane, circular road with cars. When the whole system remains stable, the corresponding equilibrium solution is as follows:
where is the average interval of vehicles; represents the number of vehicles; is the steady state speed; represents steady-state headway distance.
Applying small disturbances to a steady-state is as follows:
where is the deviation of velocity and is the deviation of distance.
By inserting Equation (10) into Equation (8) and linearizing it, we can obtain the following:
and will be converted into Fourier form as follows:
By inserting Equation (12) into Equation (11), we can obtain the following:
By expanding , and inserting them into Equation (13), the following equation can be derived:
The values of and are given by:
Obviously, if , the system is unstable. Combining Equation (8) and Equation (15) when , the neutral stability condition is obtained as follows:
Thus, the linear stability condition is derived as follows:
4. The Design of Control Parameters in the Car-Following Model
In this section, the stability of the driver memory model with time delay feedback control is analyzed. In order to design a reasonable time delay feedback strategy to suppress the bifurcation behavior, the DISM is proposed to select an appropriate combination of time delay parameters and feedback coefficients. DISM is a key step for time delay feedback. The stability interval of the system is obtained by the definite integral method. In the obtained stability interval, the safety index is used to filter out the safe and reliable parameters, and a safe and stable time delay feedback control model is established. The first part of this section uses bifurcation analysis to analyze the stability of the model. The second part of this section designs a delayed feedback control strategy.
4.1. Control Strategy for Stability
In this section, stability analysis is used to analyze driver memory models with time delay feedback control to study their bifurcation characteristics. When the whole system is stable, the equilibrium condition of Equation (9) is adopted. The model considering time delay feedback control and drivers’ memory is as follows:
where represents the feedback gain of the velocity difference and represents the time delay of the delay feedback control signal corresponding to the speed difference.
Let us use the balance conditions in Section 3 and bring Equation (10) into Equation (18), we can then obtain:
Reduce Equation (19) to a matrix as follows:
where matrix is represented as follows:
The corresponding characteristic equation can be obtained:
For ease of calculation, and . The above formula can be reduced to (21):
Solving (22):
where denotes the number of waves in oscillation.
Inserting and separating the real part from the imaginary part yields the following:
where , , , , , , , , and , .
When , we can get the following formula:
When , there are two solutions, one is , the other is , where depends on , and . When we take and , we can obtain the distribution of real and imaginary parts of the eigenvalues of formula (23) as shown in Figure 2. Figure 2a describes the eigenvalue distribution of a drivers’ memory model with no controls, . Eigenvalues on the real axis when , as increases, each eigenvalue diffuses from the real axis to both sides. When is small enough, all the eigenvalues are on the left half of the complex plane, which indicates that the system is asymptotically stable. However, as increases, the eigenvalues pass through the imaginary axis and the system loses its stability. The intersection of the eigenvalue’s path with the imaginary axis is called the Hope bifurcation point. From the graph, we can see that the eigenvalues of and pass through the imaginary axis first, then and , and finally and . Figure 2b describes the eigenvalue distribution of a drivers’ memory model for time delay control.
After adding the control, it can be seen that it takes longer for two eigenvalue curves of and to go through the virtual axis. The tracks of two eigenvalue curves, and , are opposite to those in Figure 2a. The tracks of this eigenvalue are all on the left half complex plane; therefore there is no Hopf bifurcation point. It is shown that the controlled driver memory model can suppress or delay the occurrence of Hopf bifurcations. In other words, the appropriate selection of time delay can delay or eliminate the impact of Hopf bifurcation, improve the system stability, and avoid traffic congestion in traffic flow.
When a pair of pure imaginary root appears, Hopf bifurcation branches occur in the system. Putting into Equation (23), we can obtain the critical condition of Hopf bifurcation:
When , the above formula can be converted to the following:
The stability conditions can be simplified as follows:
where in Equation (26). For convenience of calculation, the critical condition described by the equation can be reduced to . It can be seen that changing the stability condition is consistent with the stability condition of the drivers’ memory model in Section 3.
4.2. Design of Delay Feedback Control Strategy
In the past, Nyquist criterion has been used in the definite integral stability method, but Nyquist criterion has great limitations and is only effective in some specific applications. The improved definite integral stability method proposed by Xu et al. [33] can analyze the number of eigenvalues of the right half complex plane. The stability judgment can be solved in the case of multiple time delays. By calculating a definite integral, the method solves the root of the positive real part of the function associated with a transcendent real function. The number calculated from this result is the number of characteristic roots of the right half complex plane. However, one drawback to this method is that there is no general rule for estimating the upper bound of this definite integral. Xu et al. added an algorithm to this method to solve the problem that there is no upper limit on the integral. The steps to improve the definite integral method are as follows:
Write Equation (22) in the following form, which is used for the stability analysis of the DISM:
Step 1: Bring into Equation (28) and separate the real part, we then get:
where the highest power of the eigenvalue is represented by .
Step 2: According to Equation (29), let find all the positive roots. Represents all positive roots as a set, expressed as . Take as the maximum value in set and as the definite upper limit of the integral.
Step 3: Write the following formula from Equation (10):
where is the real part and is the imaginary part, its expressions are as follows:
can be obtained from Equations (31) and (32), and its expression are as follows:
Step 4: in step 2 and in step 3 can be obtained by using the following definite integral:
when , the eigenvalue with positive real part is expressed by the following formula:
Sum up the Equation (36) formula:
If , the system (17) is stable, otherwise, bifurcation occurs.
To better understand these processes, an example is provided below to illustrate how to determine the stability of the system. To illustrate the effectiveness of time-delay feedback control, we first simulate the uncontrolled driver memory model and compare it with the controlled model. The following example is illustrated by choosing , and , , , . From Figure 3a,b, it is known that the stability interval increases with the increase of , reflecting that the system promotes stability by increasing the control items. It also reflects that the appropriate parameters can make the time delay feedback control system more stable, and select the time delay parameters through the stability interval to suppress traffic congestion. The above operations can determine the stability interval of the system, and select the applicable stability interval by choosing the appropriate control parameters. Figure 3a has an approximate stability interval of , the stability range is approximately with the increase of .
To verify the stability within this region, the influence of each parameter on the system is verified by controlling the variables. Because the drivers’ reaction time is usually between , select in the following simulation. In Figure 3b, multiple groups of control parameter combinations are selected by stable interval. In Figure 3a, the delay time of the delay feedback control is changed while the driver remembers the delay time and the feedback control parameters are unchanged. To reflect the control performance of the delay feedback control strategy, the following simulation chooses an uncontrolled driver memory model to correspond to the unstable state, that is, . In the figure , the control item fails, the speed of the car is unstable, and the fluctuation increases gradually, with increasing, the speed fluctuation of the vehicle decreases gradually until it is stable. Figure 3b shows that the control item delay time is not positively related to the stability when the drivers’ memory time is determined. The delay time of the control item has a stable interval under the corresponding control parameter , system stability within this interval and system instability conversely.
According to Figure 4, when we keep the time delay constant, the system oscillation decreases with the increase of control parameters. The whole system becomes stable because of the control strategy. When the control parameters are unchanged, the system fluctuation is very small when the delay is within the range of Figure 3, and the system will soon stabilize. Next, select and , bring it into Equation (27), and let find all the positive roots, select the largest positive root , and get the upper limit of definite integral . Continue to select headway spacing , optimal acceleration , and number of vehicles in the following simulation.
Four groups of parameters were selected, of which two groups were stable parameters ; , a special point located on a stable boundary is selected, and three groups were unstable parameters . Level in Figure 5 indicates different stability states. The system is stable when . The larger the level, the faster the oscillation, and the more unstable the system.
Figure 6 depicts the speed fluctuations of a vehicle in different parameter combinations. Parameters in Figure 6a are located in the unstable area in the lower left corner of Figure 5, therefore the resulting velocity–time graph fluctuates, making the system unstable. Figure 6b,c is a parameter located in a stable region, so the resulting velocity–time graph produces small fluctuations and eventually stabilizes. Figure 6d is located at the boundary of a stable and unstable region, therefore the velocity oscillates but the amplitude is not large, although the system remains unstable. Figure 6e,f shows that as the colors in Figure 5 approach yellow, they become less stable until they become uncontrollable. These six pictures also verify the accuracy of Figure 5. It is also proved that the system will be stable only when the control feedback gain and the delay term of the delay feedback control are combined reasonably. It is not that the larger the control feedback gain the more stable the system.
We set up 8 cars to drive on open roads. The first one travels at a steady speed. The speed of the first vehicle decreases to 2 m/s, 5 m/s, and 8 m/s respectively in the three time periods of 65–70 s, 90–100 s, and 120–125 s, and it has been running at a steady speed for the rest of the time. As can be seen from Figure 7, the controlled system speed fluctuation is smaller than that of the uncontrolled system and the controlled system can restore stability faster.
Furthermore, in Figure 8a it can be seen that the uncontrolled system oscillates in the platoon when the head car decelerates and some cars are too close in some time periods. The overall fluctuation of the controlled system is small and there is no phenomenon that the vehicles are too close to each other.
The above numerical simulation verifies the feasibility of DISM in stability analysis and also reflects the validity of the design delay control strategy.
5. Case Studies
To further verify the feasibility of the above operations and the validity of the control item design, we expanded the experimental data to increase the number of vehicles from just 7 to 100 to better simulate real roads. Parameters are calibrated using NGSIM measurement data to calibrate parameters.
5.1. Verification of Control Strategy
Assume that the initial state is uniform flow and that all vehicles travel on a loop of m without overtaking behavior. The following small disturbances are added to the system under the above conditions:
The dark blue color in Figure 9 indicates that the rest of the stable area is unstable. There are also several different colors in unstable areas, indicating that the magnitude of velocity fluctuations in these areas is not the same. The greater the oscillation of velocity near the yellow area, the smaller the oscillation of velocity near the dark blue area. We selected the following points to test the stability of the system, such as , in the stable region and , ; in the unstable region. It can be seen from Figure 10 that the velocity of the two points in the dark blue region fluctuates slightly at the beginning and then tends to stabilize gradually. In Figure 10b–d, the speed starts with a small fluctuation, then stabilizes for a period of time and then starts with a large fluctuation. In Figure 10e, speed fluctuates greatly from beginning to end, there is a large fluctuation in time to 60 s, and the feedback control effect is very poor. Therefore, the light color has a smaller amplitude than the yellow one. The figure above shows that, except for the dark blue area, the feedback control of other areas has a certain control effect on the system, however, the elimination of velocity fluctuations is not obvious. In the above parameter combination, we selected to effectively control traffic instability and eliminate abnormal fluctuations in speed. The combination of other parameters mentioned above has a control effect on the system.
To verify the authenticity and feasibility of the fourth part of the numerical simulation, we extended the numerical simulation to 100 vehicles. This setting is closer to actual traffic operation. We continued to use the previously calibrated parameters to simulate a platoon of 100 vehicles.
In Figure 11a, it can be seen that the uncontrolled system is still affected after 200 s. The controlled system can restore stability faster. The feasibility and practicability of the control strategy are fully proven.
Figure 12 is the hysteresis loop of the controlled system. Hysteresis loop is an important reason for the instability and stagnation of traffic flow. In addition, the stronger the hysteresis effect, the greater the interference with stable traffic flow. The smaller the size of the hysteresis loop, the less the influence of the disturbance received by the system will be. The hysteresis loop of the controlled system is drawn by selecting the parameters in Figure 10a,c,d. It can be seen from the velocity trend graph of Figure 10 that the time lag loop is also consistent with the fluctuation trend. As the steady speed fluctuation of the system becomes smaller and smaller, the hysteresis loop becomes smaller and smaller. The hysteresis loop is reduced to one point under Figure 12 parameters. From Figure 13, we can see that uncontrolled drivers have a memory model of stopping and walking waves in traffic. Figure 14 is the speed chart of any vehicle in the selected vehicle platoon. However, when feedback control is added, stopping wave attenuation and traffic stability are restored, which proves the feasibility and validity of time delay feedback control.
5.2. Parameter Calibration
In this section, some measurement data from NGSIM is used to calibrate the model parameters. NGSIM dataset is an open and authoritative dataset. The selected datasets are divided into datasets A and B, each containing 550 sets of data. We validated the remaining parameters of the model using the genetic algorithm. The genetic algorithm uses the following objective functions:
where is the total number of samples; is an indicator of each set of data; is the actual acceleration measured as ; is the test acceleration labeled . PI represents the fitness, and the smaller the fitness value, the better the fit.
The models that need to be calibrated in this paper are as follows:
The optimal speed function [34] is expressed as follows:
Table 1 is the genetic algorithm configuration and Table 2 shows the result of parameter calibration. In Figure 15, the simulated acceleration and the actual acceleration are well fitted and the results are within the acceptable range. The calibration results are then validated using data from dataset B, and the is acceptable.
6. Conclusions
A novel car-following model is presented with consideration of the effect of driver memory. Time delay feedback control is also considered in the new model to improve the stability of traffic flow. The bifurcation analysis method and the definite integral stability method are used to analyze the stability region of the new model. The key to this method is to find the intervals of delay and feedback gain, and select a reasonable combination of parameters within the intervals. This method overcomes the disadvantage that the previous definite integral method cannot determine the upper limit of stability. In subsequent studies, more vehicles are considered to further validate the rationality of the parameters. Parameter calibration is used to observe the error between the simulation results and the actual results to determine the feasibility of the control strategy. The control strategy indicates that the traffic flow system tends to be stable after adding reasonable control parameters. It can effectively eliminate the stop-and-go phenomenon, make the overall traffic smooth, and avoid traffic congestion. It also indicates that the control strategy has good practical significance and can be used in actual traffic scenes.
Author Contributions
Methodology, Y.P., Y.W.; software, B.M.; validation, R.C., Y.P. and B.M.; writing—original draft preparation, Y.W.; writing—review and editing, R.C.; visualization, Y.P.; supervision, R.C.; funding acquisition, R.C. All authors have read and agreed to the published version of the manuscript.
Funding
This work is supported by the Natural Science Foundation of Zhejiang Province, China (Grant No. LY22G010001) and the Program of Humanities and Social Science of Education Ministry of China (Grant No. 20YJA630008) and the National Key Research and Development Program of China-Traffic Modeling, Surveillance and Control with Connected &Automated Vehicles (Grant No. 2017YFE9134700) and the Ningbo Natural Science Foundation of China (Grant Nos. 202003N4142, 2021J111) and the K.C. Wong Magna Fund in Ningbo University, China.
Conflicts of Interest
The authors declare no conflict of interest.
References
- Sun, Y.; Ge, H.; Cheng, R. An extended car-following model considering driver’s memory and average speed of preceding vehicles with control strategy. Physica A 2019, 521, 752–761. [Google Scholar] [CrossRef]
- Li, X.M.; Oscar, T.; Andry, R.; Yan, X.D. Collision risk management of cognitively distracted drivers in a car-following situation. Transp. Res. Part F 2019, 60, 288–298. [Google Scholar] [CrossRef]
- Li, S.; Wang, T.; Cheng, R.; Ge, H. An Extended Car-Following Model considering the Driver’s Desire for Smooth Driving and Self-Stabilizing Control with Velocity Uncertainty. Math. Probl. Eng. 2020, 2020, 9546012. [Google Scholar] [CrossRef]
- Ge, H.-X.; Cui, Y.; Zhu, K.-Q.; Cheng, R.-J. The control method for the lattice hydrodynamic model. Commun. Nonlinear Sci. Numer. Simul. 2015, 22, 903–908. [Google Scholar] [CrossRef]
- Wang, Q.; Cheng, R.; Ge, H. A novel lattice hydrodynamic model accounting for driver’s memory effect and the difference of optimal velocity on curved road. Physica A 2020, 559, 125023. [Google Scholar] [CrossRef]
- Cheng, R.; Ge, H.; Wang, J. An extended continuum model accounting for the driver’s timid and aggressive attributions. Phys. Lett. A 2017, 381, 1302–1312. [Google Scholar] [CrossRef]
- Huang, K.; Di, X.; Du, Q.; Chen, X. Scalable traffic stability analysis in mixed-autonomy using continuum models. Transp. Res. Part C: Emerg. Technol. 2020, 111, 616–630. [Google Scholar] [CrossRef]
- Ren, W.; Cheng, R.; Ge, H. Bifurcation analysis for a novel heterogeneous continuum model considering electronic throttle angle changes with memory. Appl. Math. Comput. 2021, 401, 126079. [Google Scholar] [CrossRef]
- Pipes, L.A. An Operational Analysis of Traffic Dynamics. J. Appl. Phys. 1953, 24, 274–281. [Google Scholar] [CrossRef]
- Newell, G.F. Nonlinear Effects in the Dynamics of Car Following. Oper. Res. 1961, 9, 209–229. [Google Scholar] [CrossRef]
- Bando, M.; Hasebe, K.; Nakayama, A.; Shibata, A.; Sugiyama, Y. Dynamical model of traffic congestion and numerical simulation. Phys. Rev. E 1995, 51, 1035–1042. [Google Scholar] [CrossRef] [PubMed]
- Zhang, H. Driver memory, traffic viscosity and a viscous vehicular traffic flow model. Transp. Res. Part B Methodol. 2003, 37, 27–41. [Google Scholar] [CrossRef]
- Yu, S.; Shi, Z. An improved car-following model considering relative velocity fluctuation. Commun. Nonlinear Sci. Numer. Simul. 2016, 36, 319–326. [Google Scholar] [CrossRef]
- Treiber, M.; Kesting, A.; Helbing, D. Delays, inaccuracies and anticipation in microscopic traffic models. Physica A 2006, 360, 71–88. [Google Scholar] [CrossRef]
- Pan, D.B.; Zhang, G.; Jiang, S.; Zhang, Y.; Yuan, B. Delay-independent traffic flux control for a discrete-time lattice hydrodynamic model with time-delay. Physica A 2021, 563, 125440. [Google Scholar] [CrossRef]
- Liu, B.; Zhang, G. A double velocity control method for a discrete-time cooperative driving system with varying time-delay. Phys. A 2020, 565, 125579. [Google Scholar] [CrossRef]
- Chandler, R.E.; Herman, R.; Montroll, E.W. Traffic Dynamics: Studies in Car Following. Oper. Res. 1958, 6, 165–184. [Google Scholar] [CrossRef] [Green Version]
- Gazis, D.C.; Herman, R.; Rothery, W. Nonlinear Follow-the-Leader Models of Traffic Flow. Oper. Res. 1961, 9, 545–567. [Google Scholar] [CrossRef]
- Zhang, G. Study on varying time delay on traffic stability in a novel lattice hydrodynamic model. Physica A 2018, 505, 1103–1112. [Google Scholar] [CrossRef]
- Sun, D.; Chen, D.; Zhao, M.; Liu, W.; Zheng, L. Linear stability and nonlinear analyses of traffic waves for the general nonlinear car-following model with multi-time delays. Physica A 2018, 501, 293–307. [Google Scholar] [CrossRef]
- Gasser, I.; Sirito, G.; Werner, B. Bifurcation analysis of a class of ‘car following’ traffic models. Physica D 2004, 197, 222–241. [Google Scholar] [CrossRef]
- Orosz, G.; Krauskopf, B.; Wilson, R. Bifurcations and multiple traffic jams in a car-following model with reaction-time delay. Physica D 2005, 211, 277–293. [Google Scholar] [CrossRef] [Green Version]
- Jin, Y.; Meng, J. Dynamical analysis of an optimal velocity model with time-delayed feedback control. Commun. Nonlinear Sci. Numer. Simul. 2020, 90, 105333. [Google Scholar] [CrossRef]
- Jin, Y.F.; Xu, M. Bifurcation Analysis of the Full Velocity Difference Model. Chin. Phys. Lett. 2010, 27, 040501. [Google Scholar]
- Zhang, Y.; Xue, Y.; Zhang, P.; Fan, D.; di He, H. Bifurcation analysis of traffic flow through an improved car-following model considering the time-delayed velocity difference. Physica A 2018, 514, 133–140. [Google Scholar] [CrossRef]
- Wang, X.; Liu, J.; Zhang, Y.; Shi, B.; Jiang, D.; Peng, H. A unified symplectic pseudospectral method for motion planning and tracking control of 3D underactuated overhead cranes. Int. J. Robust Nonlinear Control 2019, 29, 2236–2253. [Google Scholar] [CrossRef]
- Peng, H.; Li, F.; Liu, J.G.; Ju, Z. A Symplectic Instantaneous Optimal Control for Robot T rajectory T racking With Differential-Algebraic Equation Models. IEEE Trans. Ind. Electron. 2020, 69, 3819–3828. [Google Scholar] [CrossRef] [Green Version]
- Shi, B.; Peng, H.; Wang, X.; Zhong, W. A symplectic direct method for motion-driven optimal control of mechanical systems. Commun. Nonlinear Sci. Numer. Simul. 2022, 111, 106501. [Google Scholar] [CrossRef]
- Li, S.; Yang, L.; Gao, Z.; Li, K. Stabilization strategies of a general nonlinear car-following model with varying reaction-time delay of the drivers. ISA Trans. 2014, 53, 1739–1745. [Google Scholar] [CrossRef]
- Zhou, T.; Chen, D.; Zheng, L.; Liu, W.; He, Y.; Liu, Z. Feedback-based control for coupled map car-following model with time delays on basis of linear discrete-time system. Physica A 2018, 512, 174–185. [Google Scholar] [CrossRef]
- Chai, C.; Zeng, X.; Wu, X.; Wang, X. Evaluation and Optimization of Responsibility-Sensitive Safety Models on Autonomous Car-Following Maneuvers. Transp. Res. Rec. J. Transp. Res. Board 2020, 2674, 662–673. [Google Scholar] [CrossRef]
- Bando, M.; Hasebe, K.; Nakanishi, K. Phenomenological Study of Dynamical Model of Traffic Flow. J. De Phys. I 1995, 5, 1389–1399. [Google Scholar] [CrossRef] [Green Version]
- Xu, Q.; Stepan, G.; Wang, Z. Delay-dependent stability analysis by using delay-independent integral evaluation. Automatica 2016, 70, 153–157. [Google Scholar] [CrossRef]
- Davis, L. Modifications of the optimal velocity traffic model to include delay due to driver reaction time. Physica A 2003, 319, 557–567. [Google Scholar] [CrossRef]
Figure 1.
Research flow chart.

Figure 2.
Eigenvalues of the system for and . (a) the uncontrolled drivers’ memory model ; (b) A time delay feedback control item is added, . (a) the eigenvalue distribution of a drivers’ memory model with no controls. (b) the eigenvalue distribution of a drivers’ memory model with control.
Figure 2.
Eigenvalues of the system for and . (a) the uncontrolled drivers’ memory model ; (b) A time delay feedback control item is added, . (a) the eigenvalue distribution of a drivers’ memory model with no controls. (b) the eigenvalue distribution of a drivers’ memory model with control.
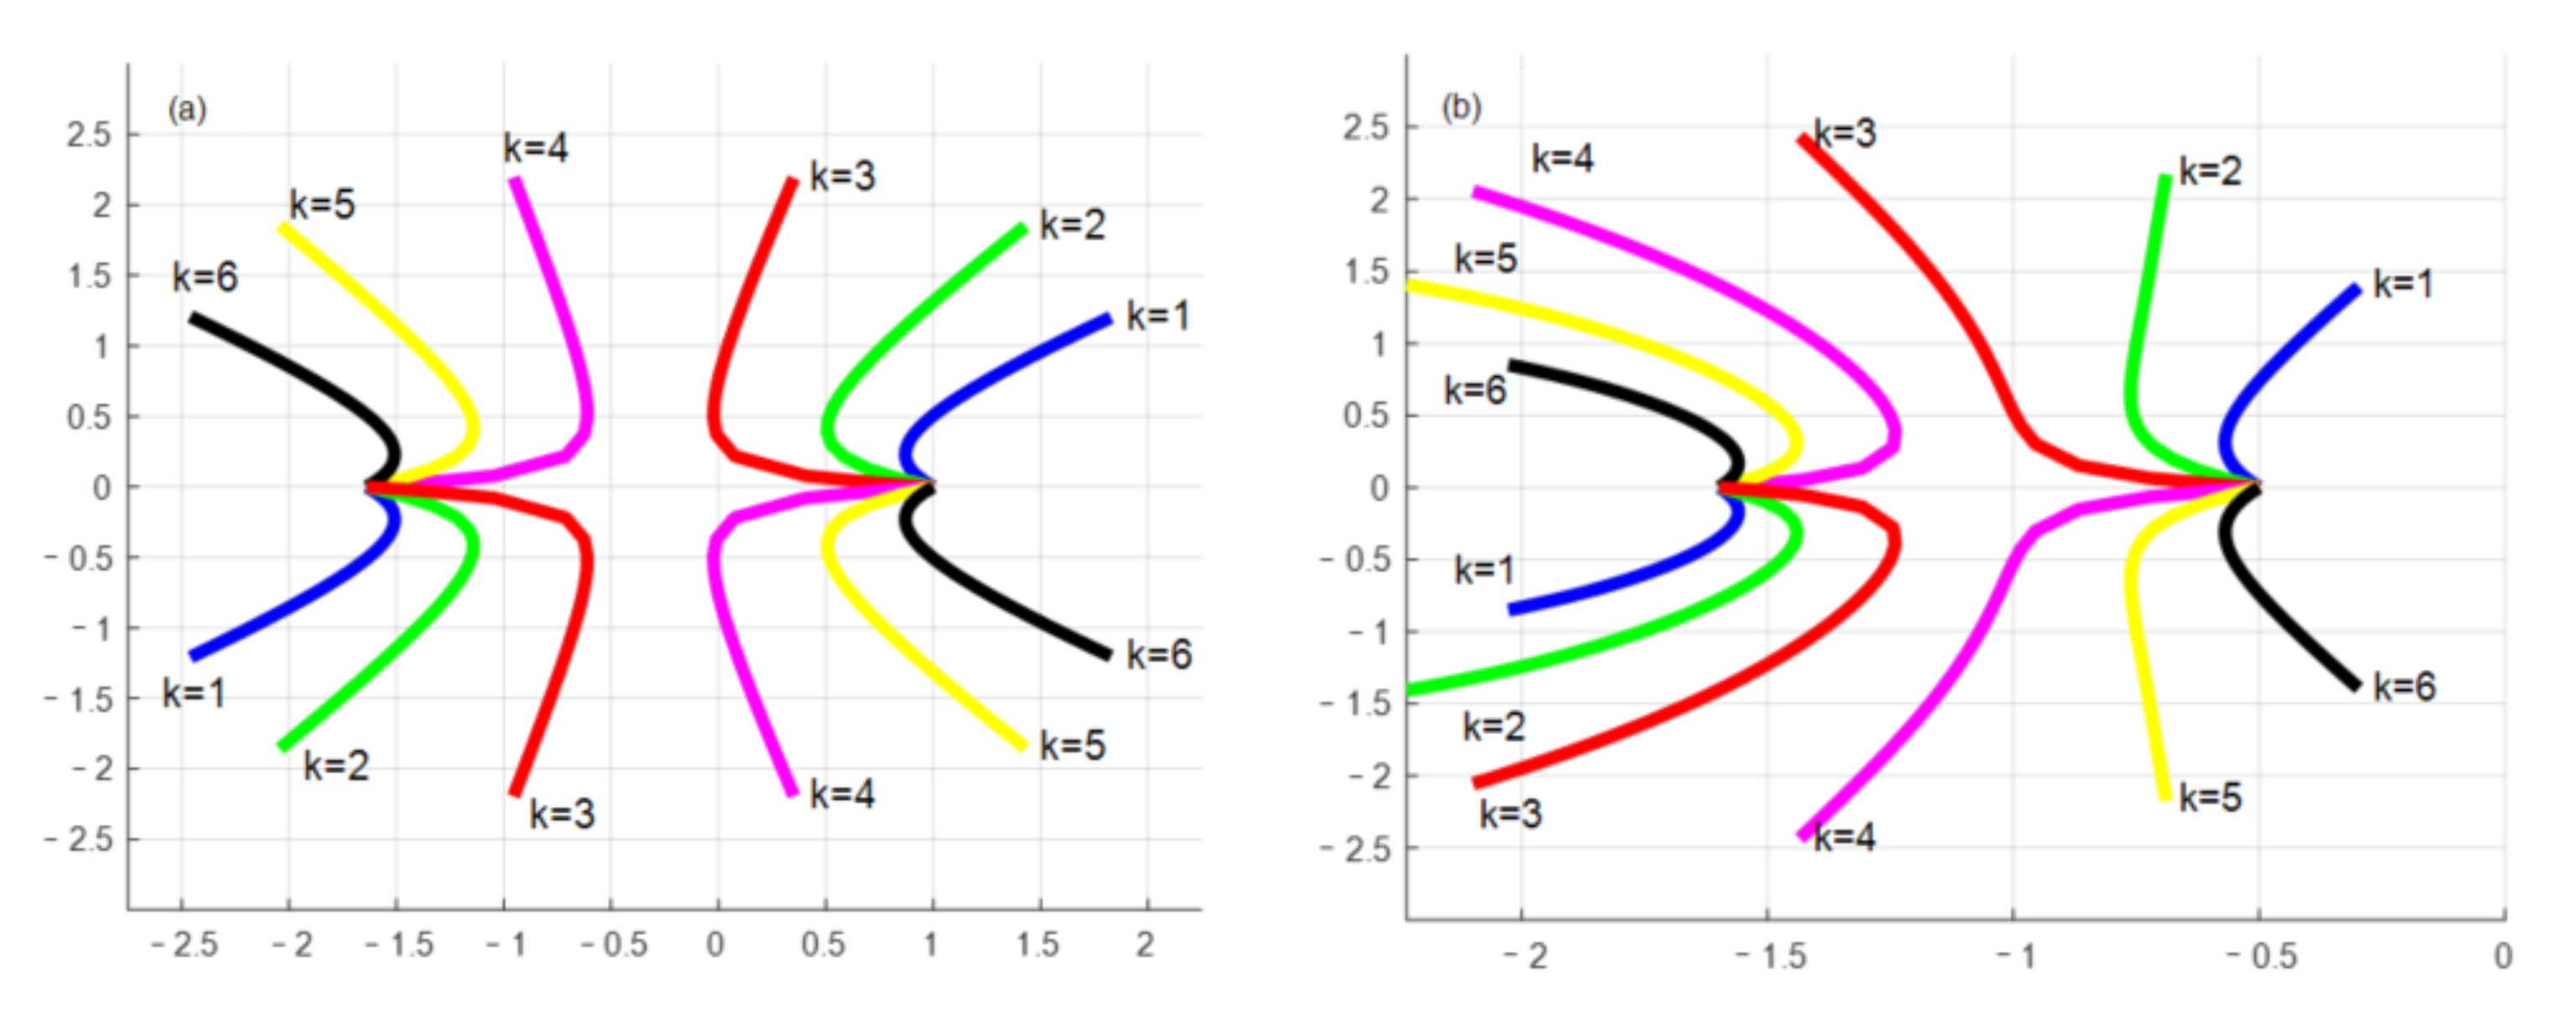
Figure 3.
The stability diagram of different design time delays for control (a) ; (b) . Selecting the number of vehicles , the controlled driver memory model is stable when , and the system is unstable when .
Figure 3.
The stability diagram of different design time delays for control (a) ; (b) . Selecting the number of vehicles , the controlled driver memory model is stable when , and the system is unstable when .
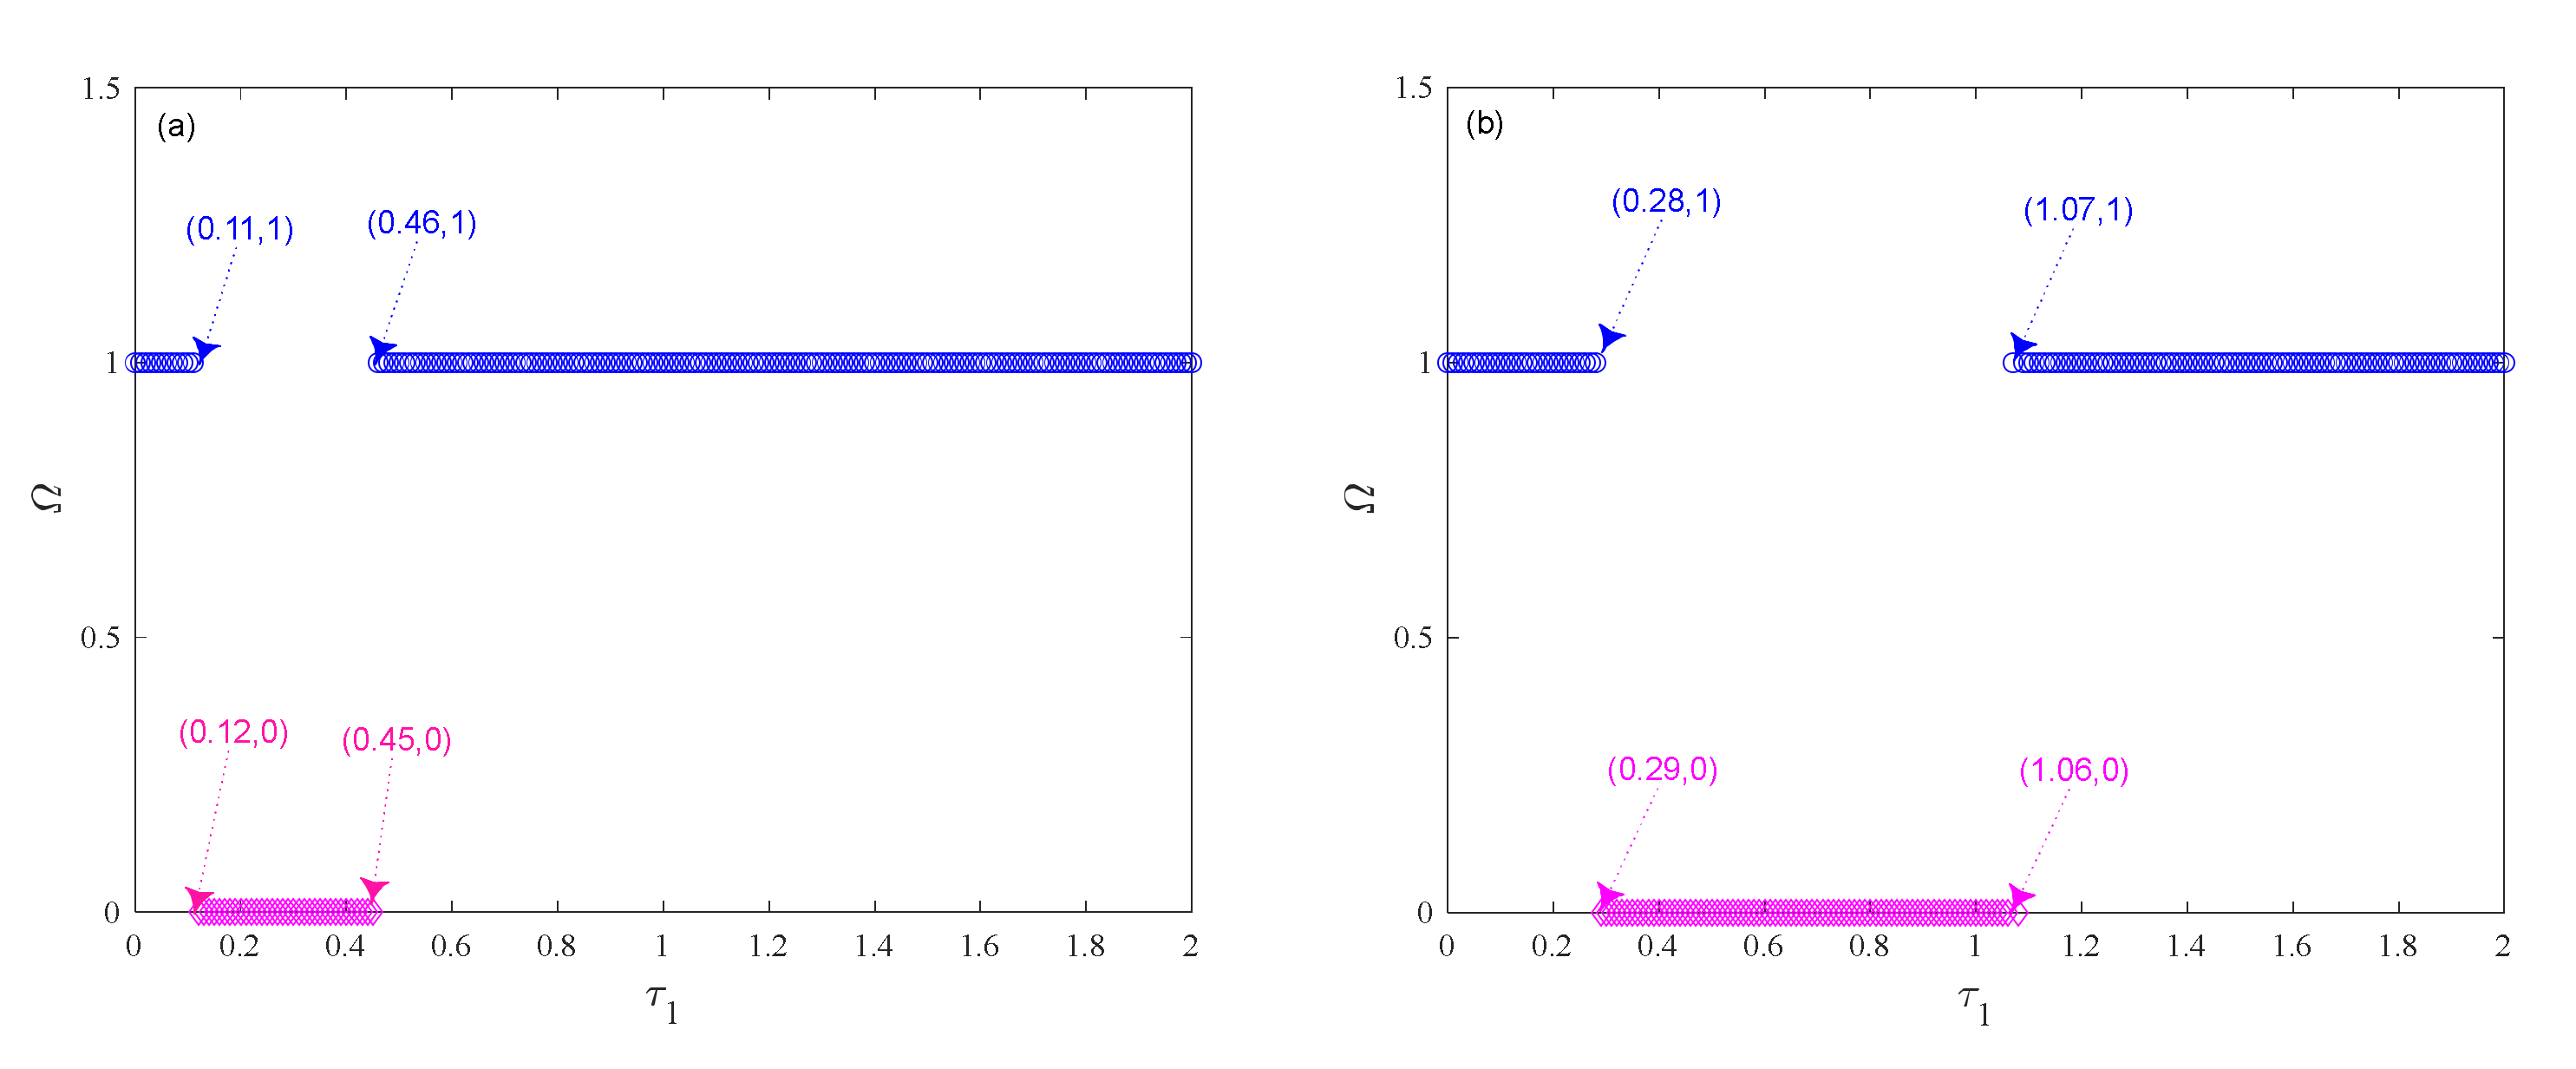
Figure 4.
Choose for the speed chart of the vehicle when and change. (a) . (b) .

Figure 5.
Two-dimensional stability diagram of a controlled drivers’ memory model with respect to , for , , .
Figure 5.
Two-dimensional stability diagram of a controlled drivers’ memory model with respect to , for , , .
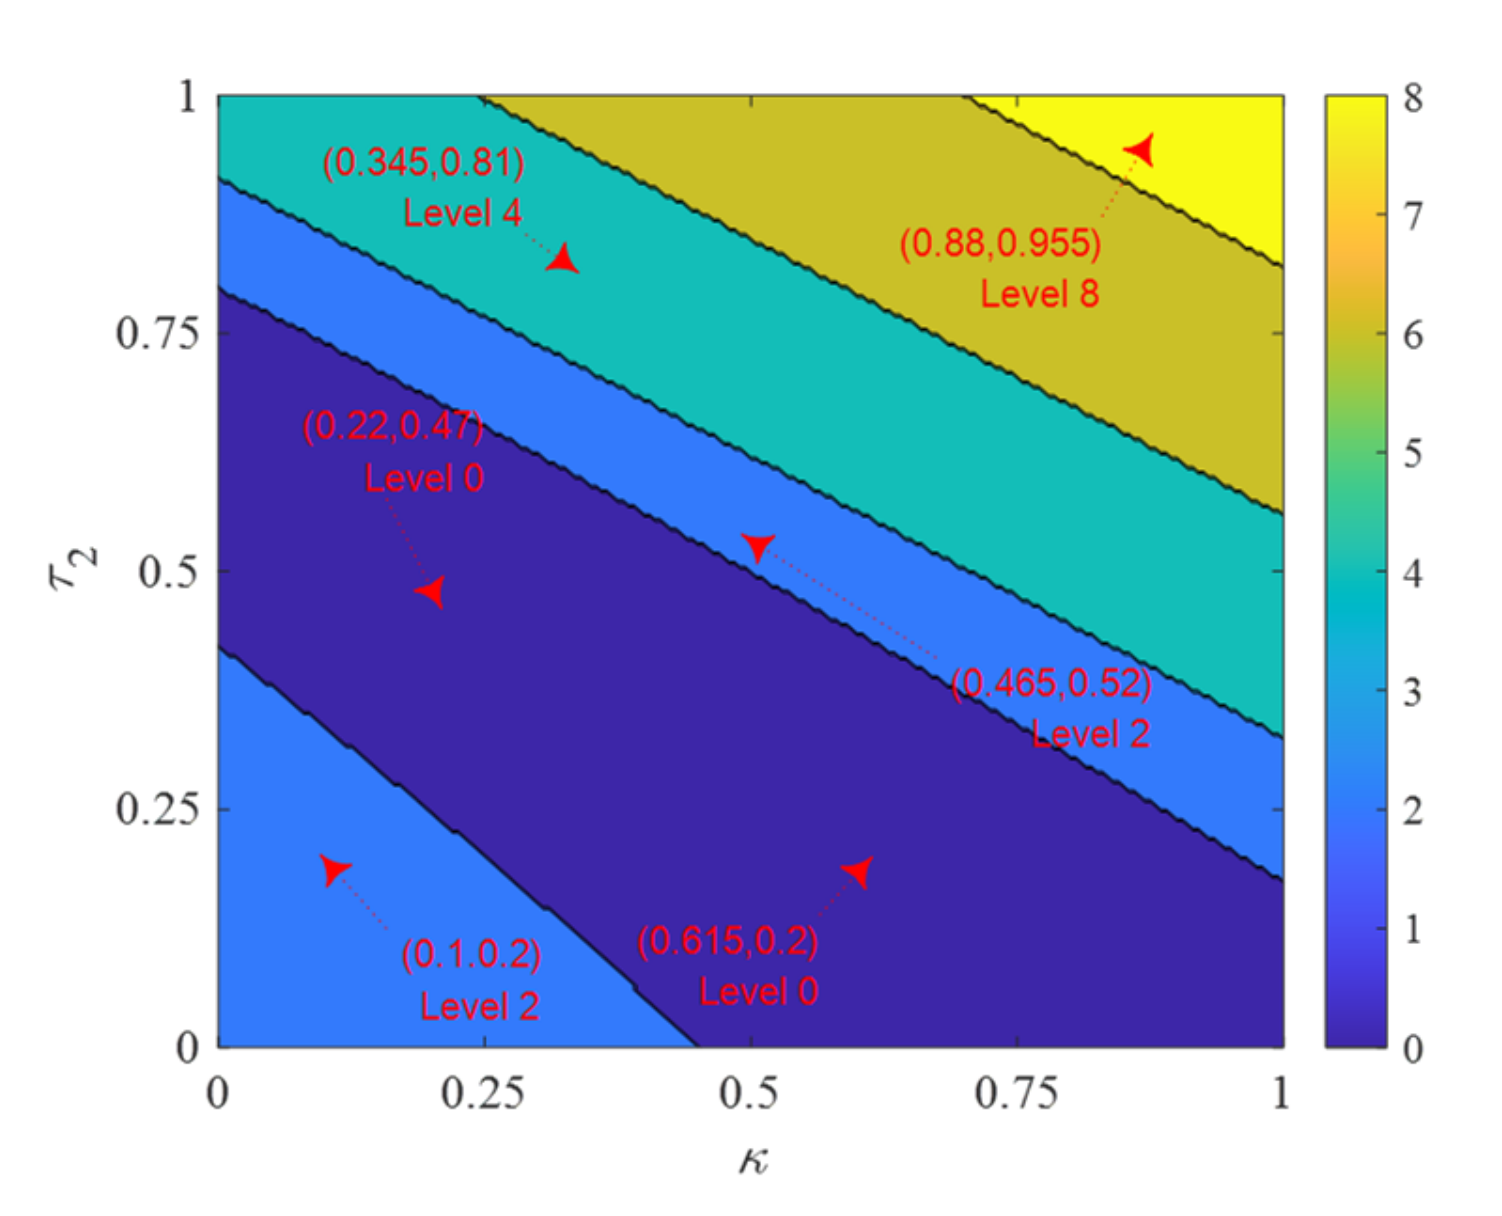
Figure 6.
Vehicle speed diagram with different time delay feedback control parameter combinations. (a) platoon speed diagram (b) platoon speed diagram (c) platoon speed diagram (d) platoon speed diagram (e) platoon speed diagram (f) platoon speed diagram.
Figure 6.
Vehicle speed diagram with different time delay feedback control parameter combinations. (a) platoon speed diagram (b) platoon speed diagram (c) platoon speed diagram (d) platoon speed diagram (e) platoon speed diagram (f) platoon speed diagram.

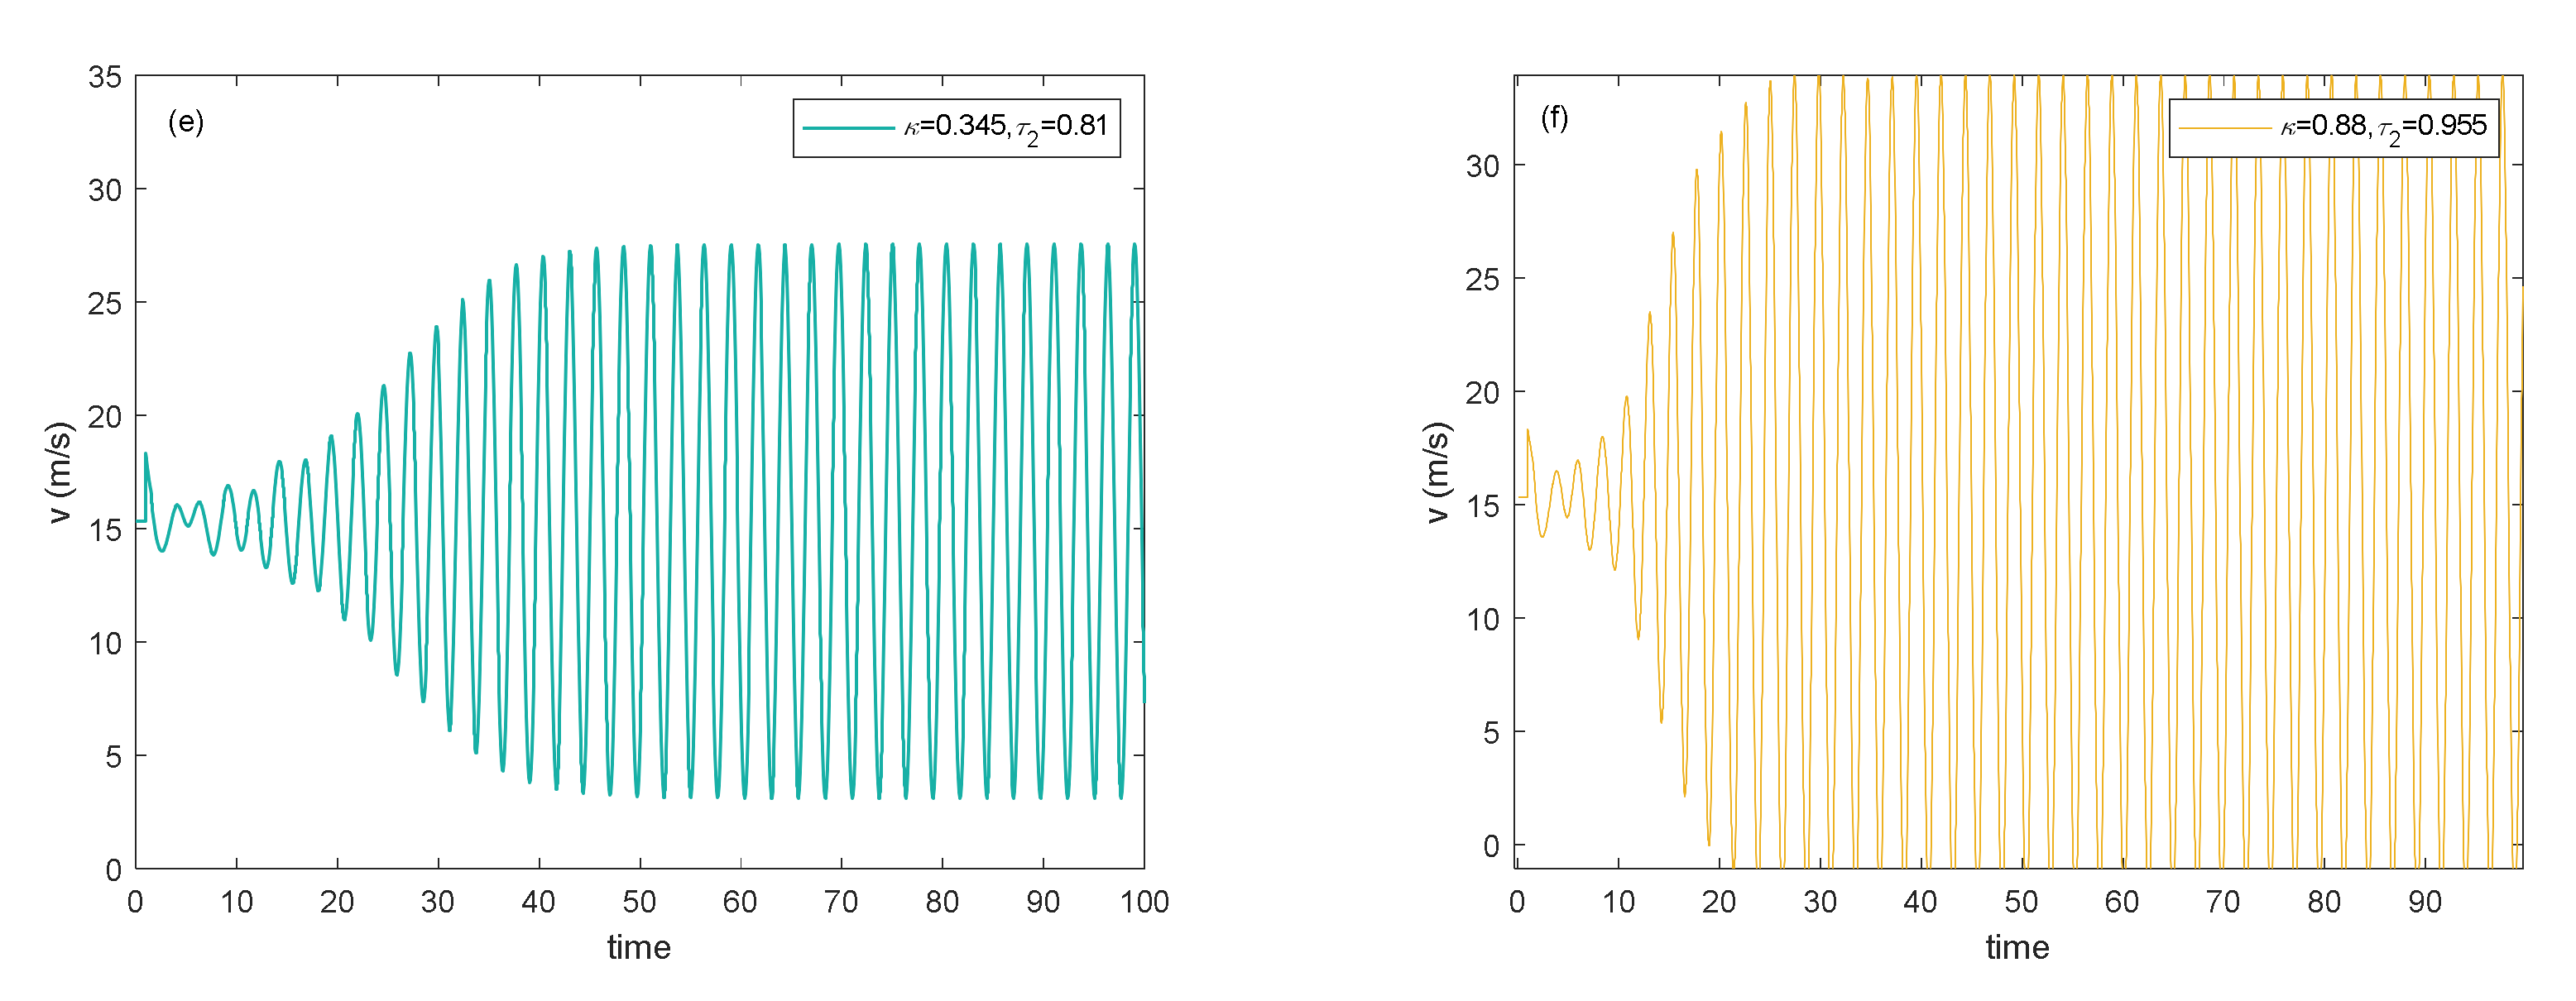
Figure 7.
Vehicle speed with different control strategies. (a) Uncontrolled system. (b) Controlled system.
Figure 7.
Vehicle speed with different control strategies. (a) Uncontrolled system. (b) Controlled system.

Figure 8.
Vehicle trajectory with different control strategies. (a) Uncontrolled system. (b) Controlled system.
Figure 8.
Vehicle trajectory with different control strategies. (a) Uncontrolled system. (b) Controlled system.

Figure 9.
Controlled drivers’ memory model stability diagram relative to and for .

Figure 10.
Time–speed diagram of the first vehicle with different combinations of control parameters. (a) platoon speed diagram (b) platoon speed diagram (c) platoon speed diagram (d) platoon speed diagram (e) platoon speed diagram (f) platoon speed diagram.
Figure 10.
Time–speed diagram of the first vehicle with different combinations of control parameters. (a) platoon speed diagram (b) platoon speed diagram (c) platoon speed diagram (d) platoon speed diagram (e) platoon speed diagram (f) platoon speed diagram.
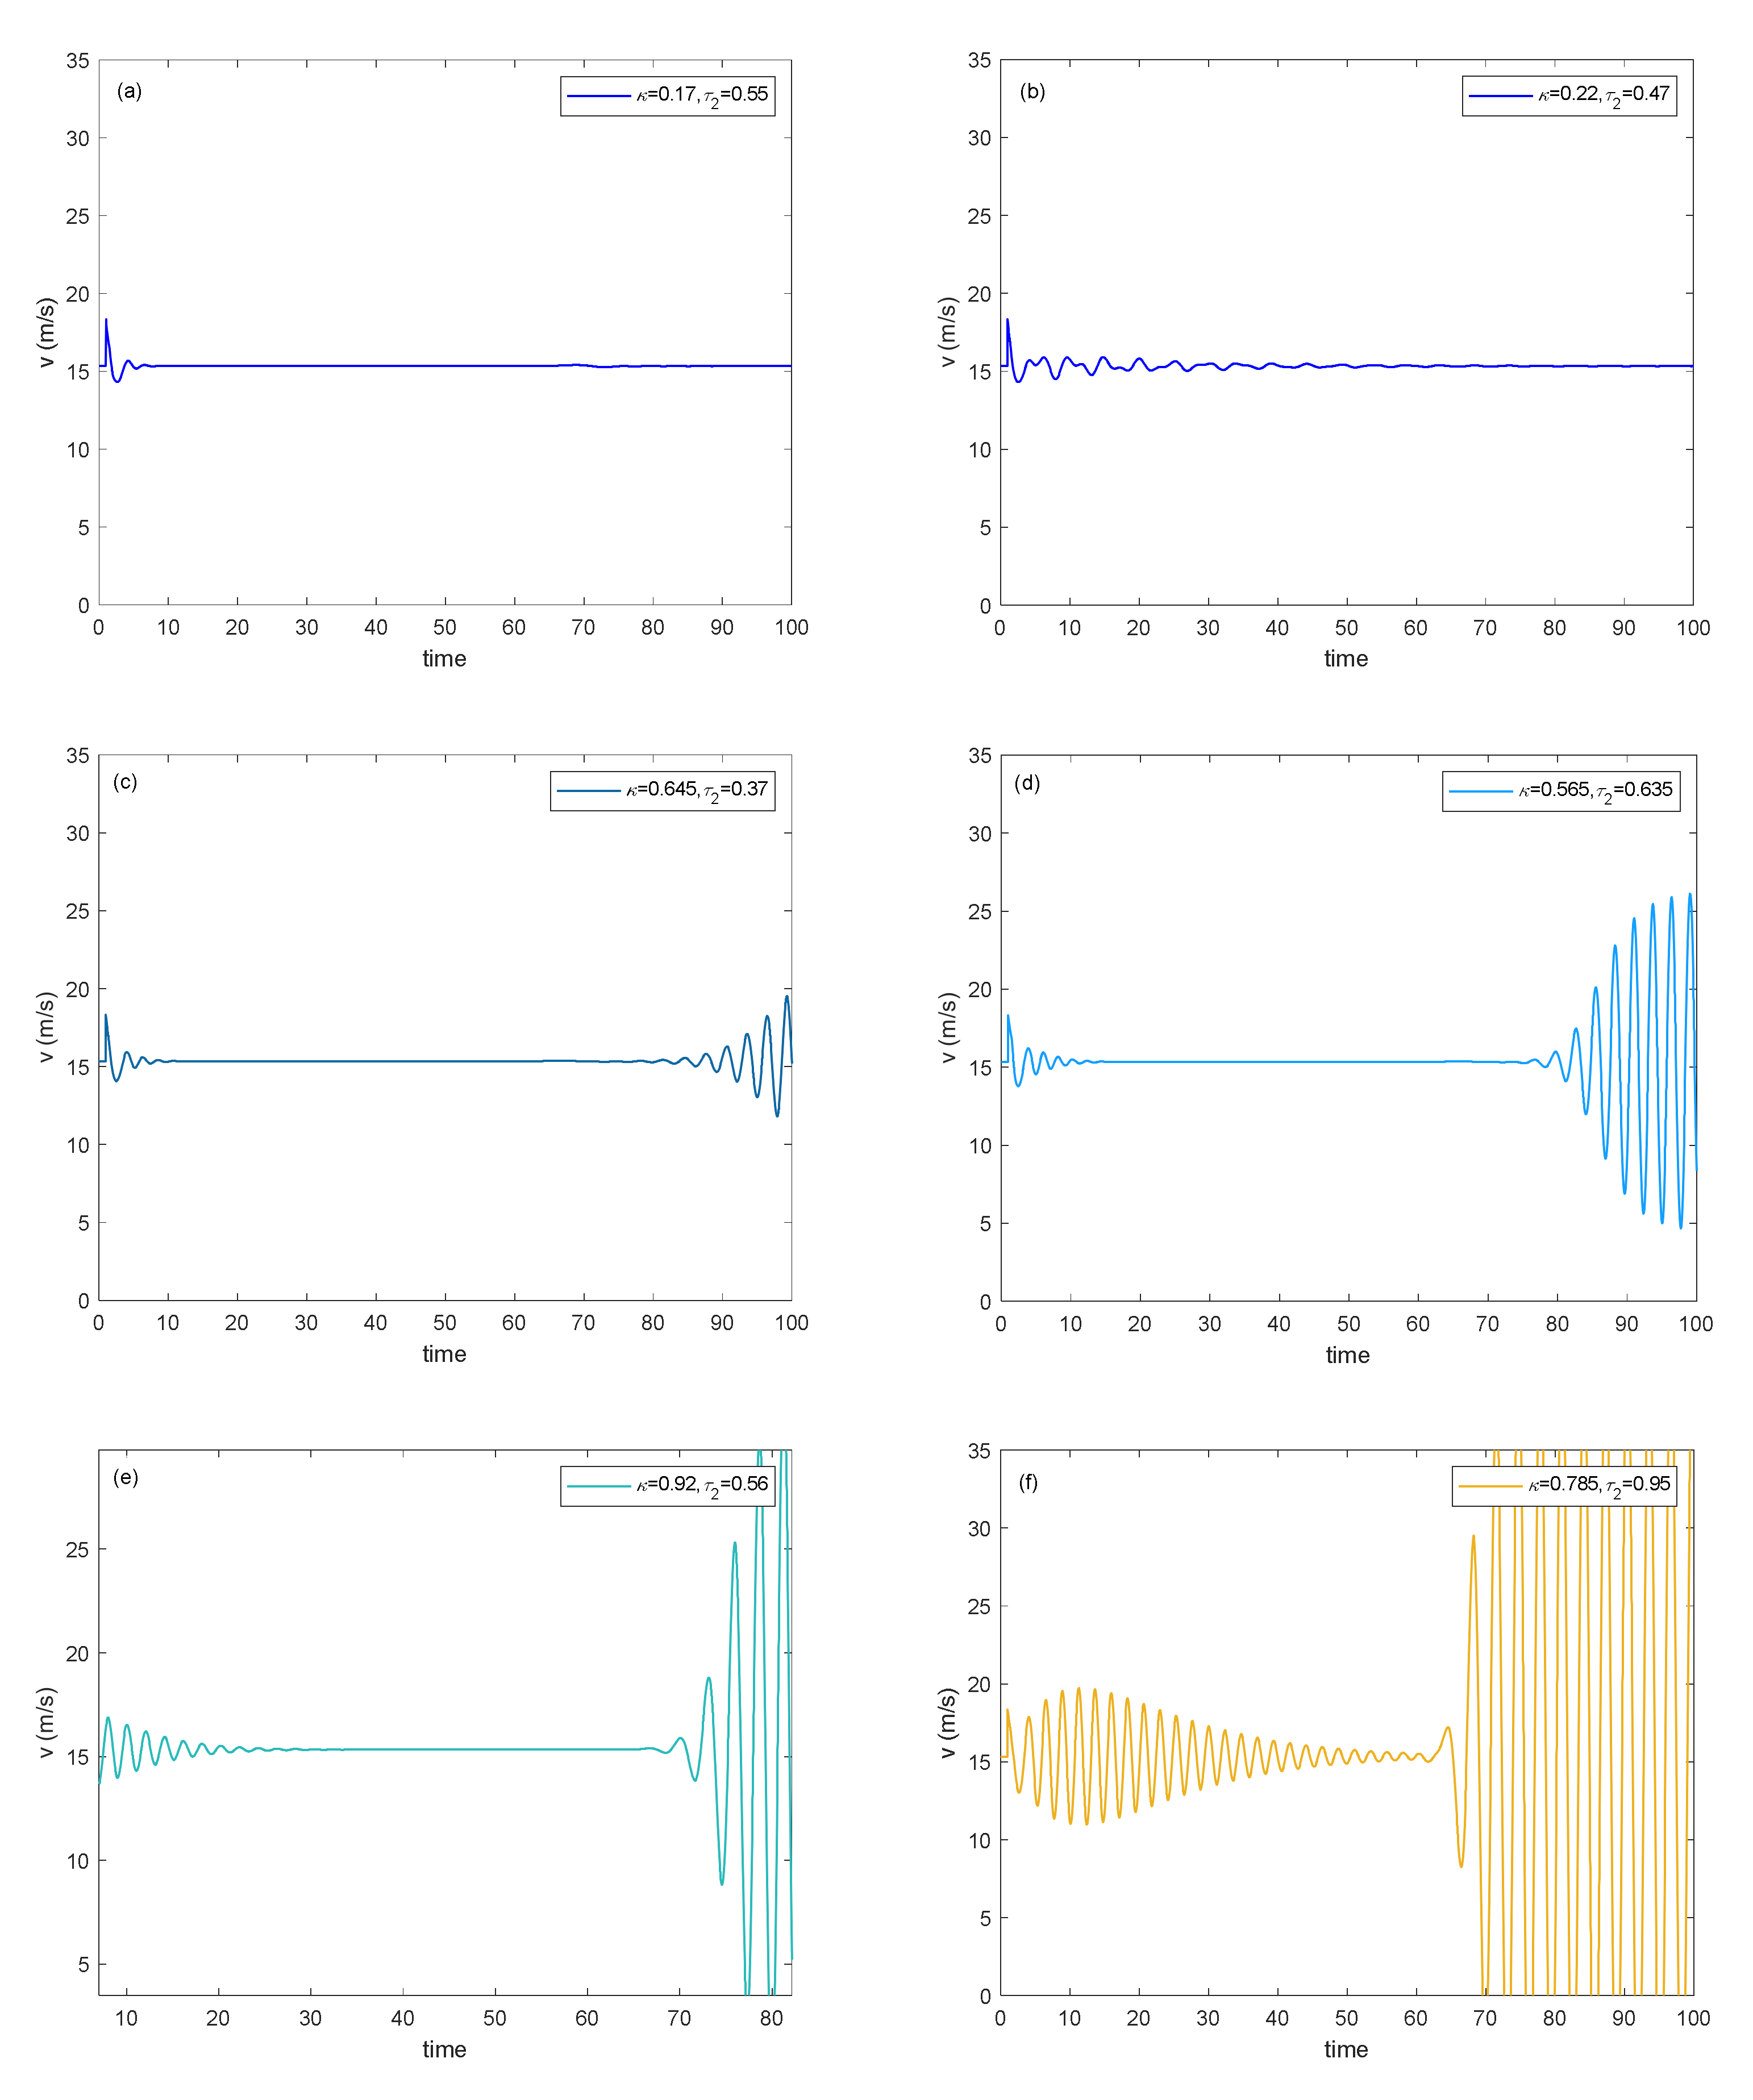
Figure 11.
Vehicle trajectory with different control strategies. (a) Uncontrolled system. (b) Controlled system.
Figure 11.
Vehicle trajectory with different control strategies. (a) Uncontrolled system. (b) Controlled system.

Figure 12.
The hysteresis loop of the controlled driver memory model corresponds to Figure 10.
Figure 12.
The hysteresis loop of the controlled driver memory model corresponds to Figure 10.
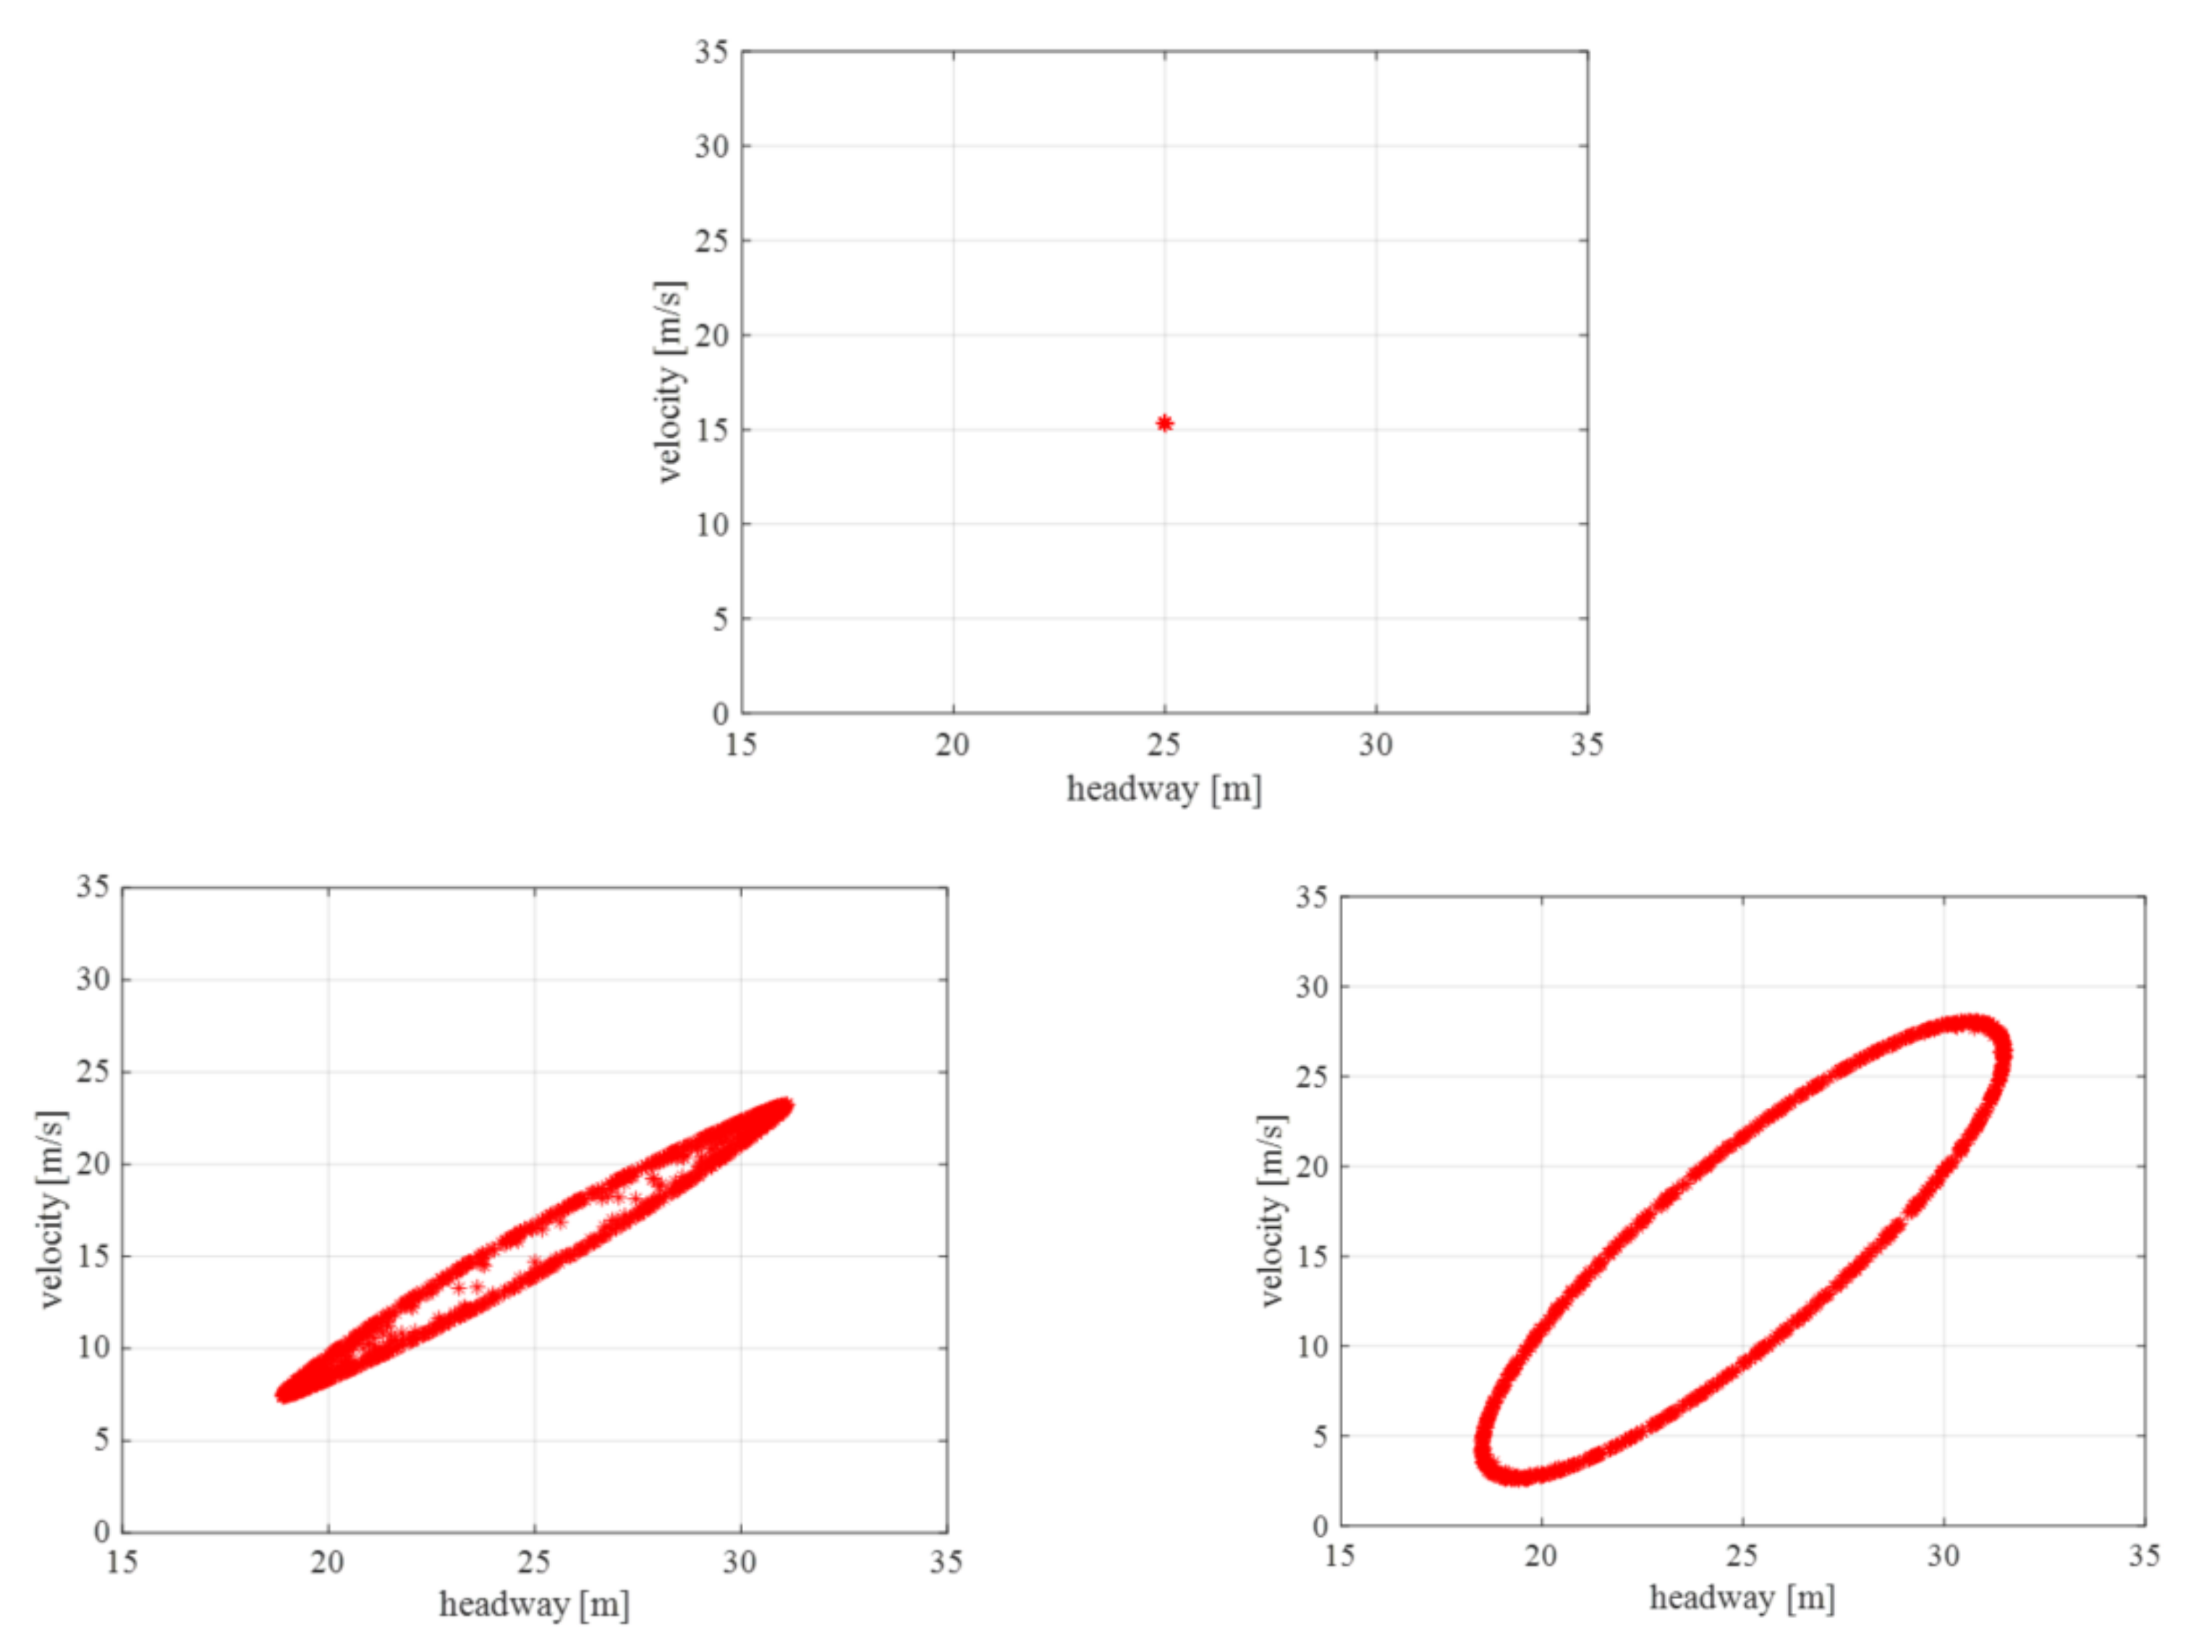
Figure 13.
Velocity comparison diagram of controlled and uncontrolled models. (a) Uncontrolled model considering driver memory. (b) Controlled model considering driver memory.
Figure 13.
Velocity comparison diagram of controlled and uncontrolled models. (a) Uncontrolled model considering driver memory. (b) Controlled model considering driver memory.

Figure 14.
Vehicle Speed Change Graph. (a) Uncontrolled model considering driver memory. (b) Controlled model considering driver memory.
Figure 14.
Vehicle Speed Change Graph. (a) Uncontrolled model considering driver memory. (b) Controlled model considering driver memory.
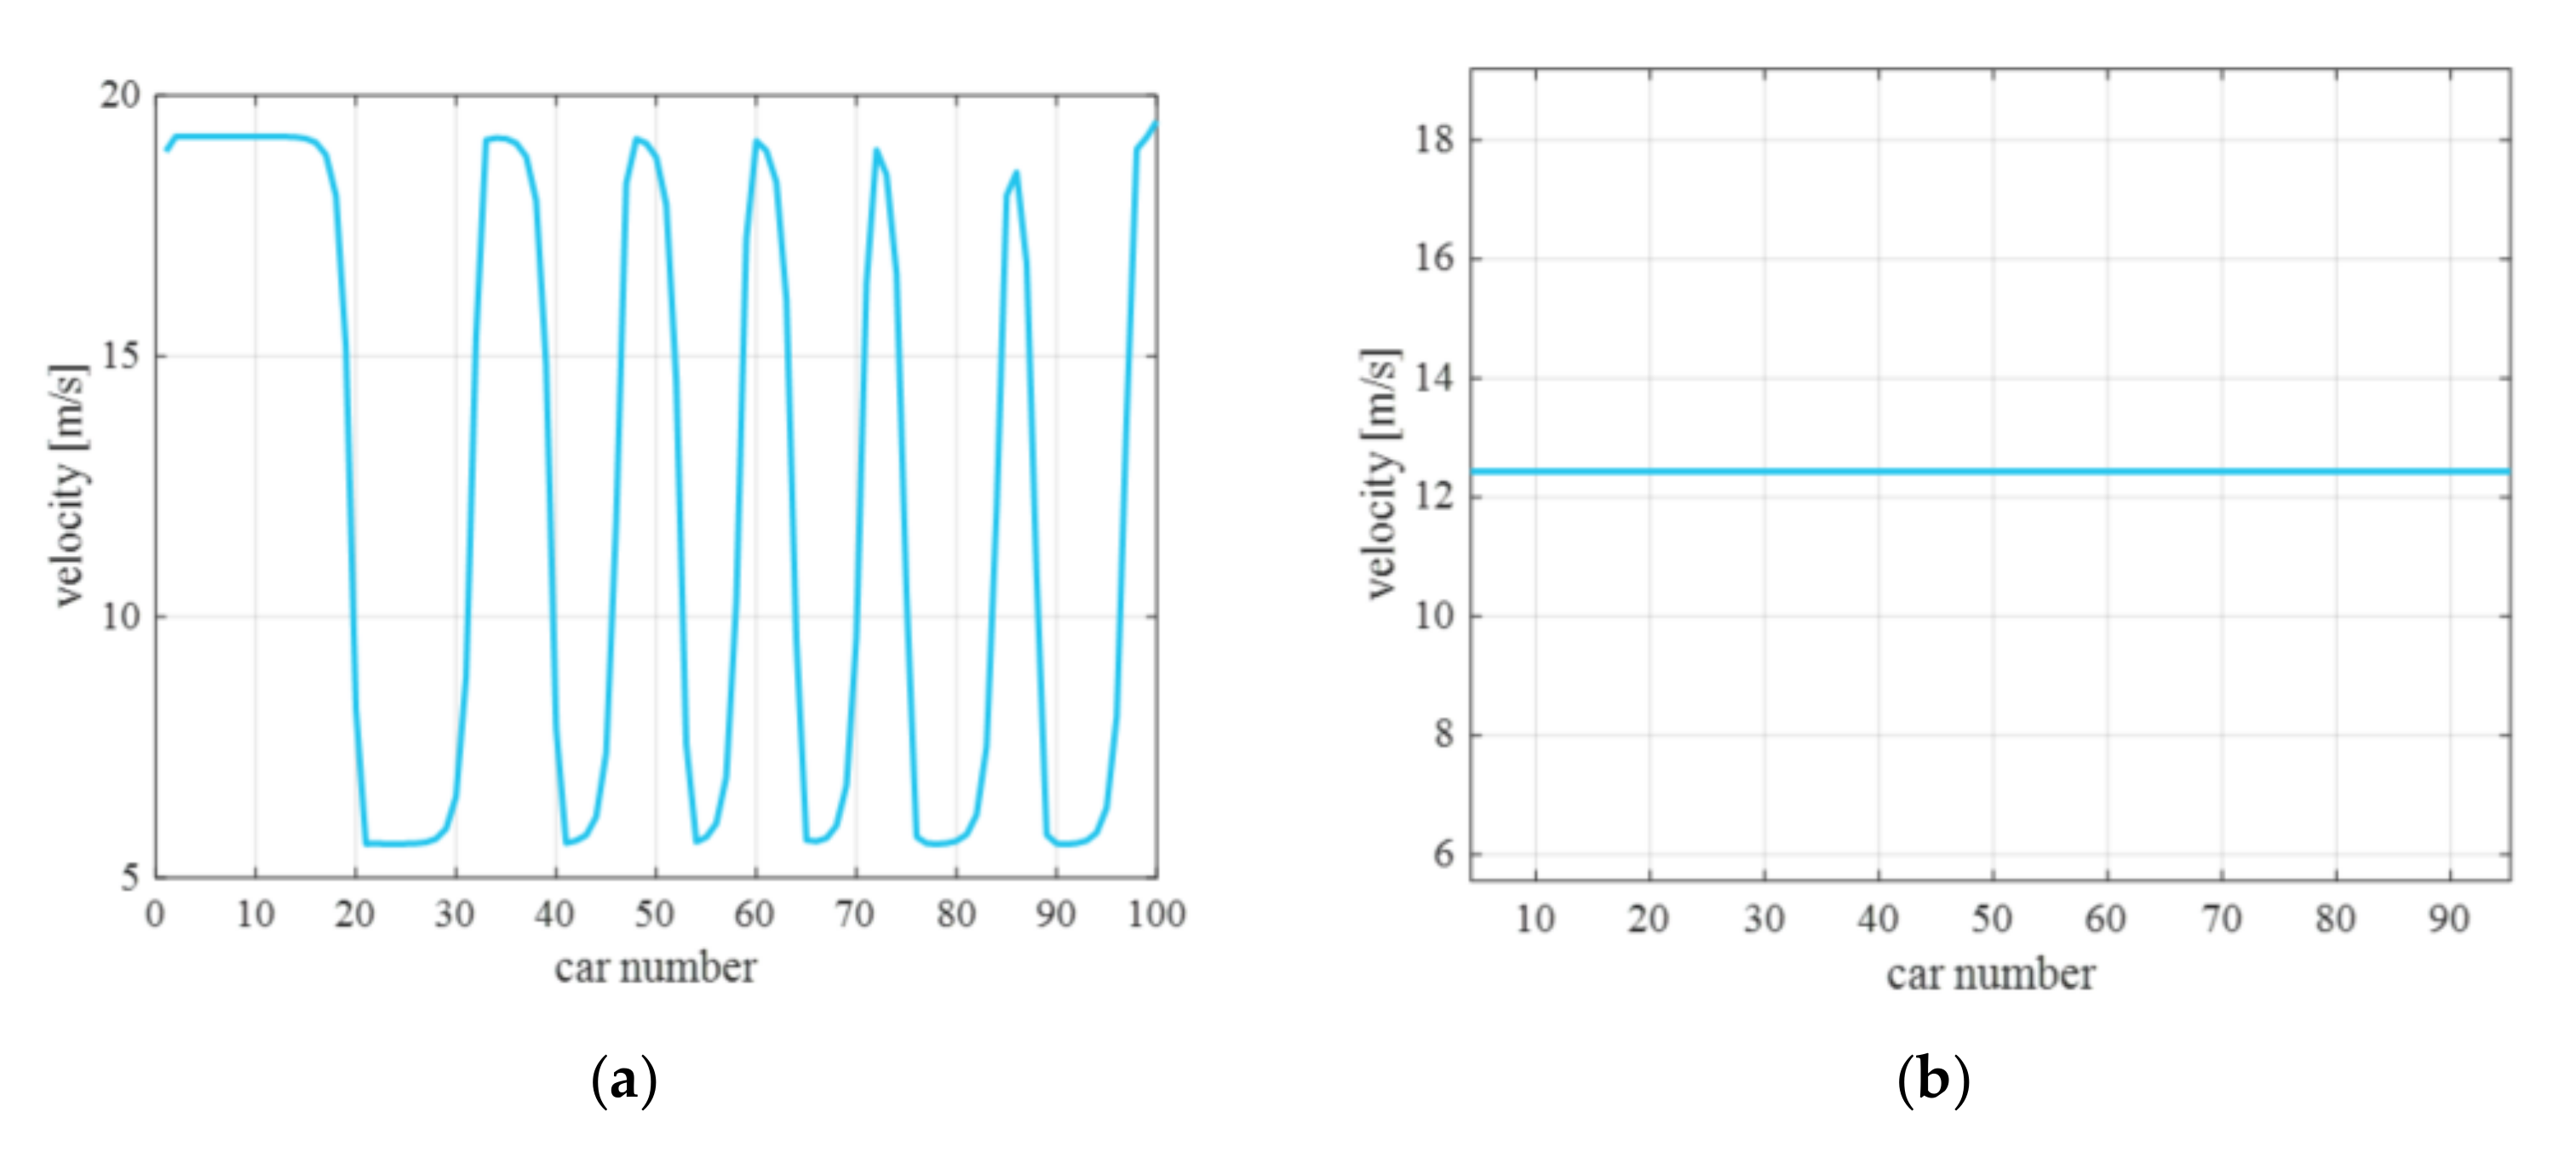
Figure 15.
Acceleration curve of fitting data and measured data.


Table 1.
Configuration of the genetic algorithm.
| Options | Values |
|---|---|
| Population Size | 100 |
| Mutation Rate | 0.1 |
| Crossover Rate | 0.95 |
| Generations | 1000 |
Table 2.
Results of parameter calibration.
| Parameters | Value |
|---|---|
| 0.8334 | |
| 0.9105 | |
| 21.9235 | |
| 32.6472 | |
| 0.0746 | |
| 0.5983 | |
| 0.5007 |
Publisher’s Note: MDPI stays neutral with regard to jurisdictional claims in published maps and institutional affiliations. |
© 2022 by the authors. Licensee MDPI, Basel, Switzerland. This article is an open access article distributed under the terms and conditions of the Creative Commons Attribution (CC BY) license (https://creativecommons.org/licenses/by/4.0/).
Share and Cite
MDPI and ACS Style
Pan, Y.; Wang, Y.; Miao, B.; Cheng, R. Stabilization Strategy of a Novel Car-Following Model with Time Delay and Memory Effect of the Driver. Sustainability 2022, 14, 7281. https://doi.org/10.3390/su14127281
AMA Style
Pan Y, Wang Y, Miao B, Cheng R. Stabilization Strategy of a Novel Car-Following Model with Time Delay and Memory Effect of the Driver. Sustainability. 2022; 14(12):7281. https://doi.org/10.3390/su14127281
Chicago/Turabian StylePan, Yifan, Yongjiang Wang, Baobin Miao, and Rongjun Cheng. 2022. "Stabilization Strategy of a Novel Car-Following Model with Time Delay and Memory Effect of the Driver" Sustainability 14, no. 12: 7281. https://doi.org/10.3390/su14127281
Note that from the first issue of 2016, this journal uses article numbers instead of page numbers. See further details here.