
Does Rapid Urbanization Improve Green Water-Use Efficiency? Based on the Investigation of Guangdong Province, China

School of Economics, Lanzhou University, Lanzhou 730000, China
*
Author to whom correspondence should be addressed.
Sustainability 2022, 14(12), 7481; https://doi.org/10.3390/su14127481
Submission received: 20 May 2022
/
Revised: 14 June 2022
/
Accepted: 15 June 2022
/
Published: 19 June 2022
(This article belongs to the Special Issue GIS in Water Resource Management: Allocation, Contamination, and Ecosystem)
Abstract
:The green water-use efficiency considers the undesired output of water pollution discharge as well as desirable output, pursuing the unification of economic and ecological benefit. In recent years, China has been undergoing a process of rapid urbanization and a dramatic change in the water utilization pattern, while the water pollution discharge is becoming more obvious. Taking Guangdong Province as an example, the largest economy and urbanization pilot area, exploring the impact of different aspects of rapid urbanization on green water-use efficiency is of great significance for promoting new-type urbanization and green development. This study adopts the super efficiency slack-based model (SE-SBM) considering undesirable output to measure the green water-use efficiency of each city in Guangdong Province. On this basis, mixed panel, random panel, and fixed panel models are used to explore the relationship between industrial urbanization, population urbanization, land urbanization, social urbanization, and urban-rural integration on green water-use efficiency. The results reveal that Guangdong’s green water-use efficiency follows a low upward trend. The green water-use efficiency of the Pearl River Delta has improved rapidly, while other regions are maintained at a low level, so regional disparities are also widening. Industrial urbanization and land urbanization have a significant positive effect on green water-use efficiency, while social urbanization and urban-rural integration have a significant negative effect. The effect of population urbanization on the efficiency is not significant. The construction of new-type urbanization should be accelerated, the green transformation and upgrading of industries should be guided, and the urbanization of agricultural migrants should be promoted. It is necessary to rationally plan and utilize urban land resources and comprehensively improve urban functions and livability.
1. Introduction
Over more than the past forty years of reform and opening-up, China has experienced the largest urbanization process in human history. The proportion of the urban population has risen from 17.92% in 1978 to 63.89% in 2020, forming an urban construction and urbanization development model with Chinese characteristics. However, the rapid advancement of the urbanization process is inseparable from the support of resources. Its industrial development and population agglomeration have brought great challenges to regional water environment governance. The new-type urbanization with people at its core has become an essential way to solve the problems of water security and water environment [1]. Many experts have confirmed that the high-intensity development and utilization of water resources has caused the spread of water pollution in urban agglomerations, and the concentrated outbreak of resource and environmental problems has become the main problem hindering the development of urbanization [2]. The national government has also enacted the strict water management regulations and river chief system to prevent the further deterioration of the water environment and the further waste of water resources. As the province with the largest economy and population in China, Guangdong’s urbanization rate reached 71.45% by the end of 2020. It has two first-tier cities, Shenzhen and Guangzhou, and the urban agglomeration of the Pearl River Delta is one of the three mega-city agglomerations in China. As the earliest manufacturing base in China to attract foreign capital in large numbers, the problem of water shortages in the Pearl River Delta has a long history. In recent years, water pollution-intensive industries have shifted significantly to eastern, western, and northern Guangdong. The problems of water resources and water pollution in these regions continue to emerge. Taking Guangdong Province and its four major regions as key cases, it has strong practical significance to explore the green water-use problem of rapid urbanization.
The coordinated development of urbanization and ecological environment is a global scientific problem, while clean water and sanitation is one sustainable development goal for the Food and Agriculture Organization of the World, which will ensure peace and human rights and improve ecosystems [3]. Some studies focus on the coupling interrelationship for specific regions, while other studies focus on their mutual constraints and feedback mechanisms [4,5]. Ariken et al. (2020) used multi-source remote sensing technology and a coupled coordination degree model to evaluate the coupling coordination relationship between urbanization and ecological environment in the Yanqin watershed, a typical arid region in China [6]. Yang et al. (2020) adopted the coupling coordination evaluation model to explore the correlation and coupling degree between the geological ecological environment and urbanization in Chongqing and proposed four sustainable development models [7]. Wang et al. (2021) applied the ecological environment response model and geographic detectors to analyze the spatiotemporal evolution characteristics and driving factors of the urbanization and ecological environment response of the Central Plains urban agglomeration [8]. Liu et al. (2022) constructed a threshold effect model to empirically test the growth trajectory of energy consumption in China’s urbanization process and proposed their nonlinear relation [9]. Dhakal et al. (2010) explored the opportunities for greenhouse gas emissions and urban carbon reduction caused by urbanization [10]. Yilmaz et al. (2021) studied the relationship between eco-urbanization, green areas and air pollution in Erzurum, northeastern Turkey, and proposed that different types of housing have significant impacts on air pollution and the urban heat island effect [11].
In response to the problems of water resources and water environment caused by population and industrial agglomeration, many experts have adopted methods for measurement of green or general water-use efficiency, including stochastic frontier analysis, data envelopment analysis (DEA), fuzzy matter-element analysis, and the PCA-Copula evaluation method [12,13]. Green water-use efficiency is the water-use efficiency considering the undesirable output for reducing water pollution emissions, while it is inaccurate in calculating the efficiency by ignoring environmental pollution [14]. Tong et al. (2019) used the slack-based model (SBM) considering undesirable output to measure the green total factor water-use efficiency in the Yangtze River Economic Belt and analyzed its spatial effect with a spatial econometric model [15]. Wang et al. (2021) adopted a two-stage DEA method considering the game cross-efficiency to evaluate the performance of China’s industrial water resources utilization system to explore the regional differences in water-use efficiency [16]. Many experts conducted investigations on agricultural green water-use efficiency, industrial green water-use efficiency, irrigation water-use efficiency, and watershed water-use efficiency. They focused on exploring the driving factors from water-saving technology, water-use structure, water rights distribution, water resource tax reform, industrial structure, external dependence, and urbanization level [17,18,19]. Gautam T.K. et al. (2020) adopted the Russell measure to estimate the technical efficiency of irrigation water use in soybean production in Louisiana and proposed that an improvement in water management practices can optimize irrigation efficiency [20]. Wu et al. (2021) analyzed the water-use efficiency of crop production in China’s main grain producing areas and defined the ratio of crop output value to the sum of blue water and green water consumption as the generalized water-use economic efficiency of crop production [21]. Njuki et al. (2018) used a stochastic parameter method to measure irrigation water-use and technical efficiency in American agriculture and explained how agricultural technology and environmental regional heterogeneity affect the irrigation efficiency [22].
Regarding the relationship between urbanization and green water-use efficiency, scholars mostly discuss from the perspective of population urbanization. Some scholars chose the perspective of industrial urbanization or land urbanization, and some studies explored water-use efficiency for typical metropolitan circles or urban agglomerations [23,24]. Hai et al. (2018) adopted the super-efficiency DEA model to measure the water-use efficiency of different industries in the Beijing-Tianjin-Hebei urban agglomeration and analyzed the relationship between the urban development level and the water-use efficiency of the three major industries [25]. Ding et al. (2019) discussed regional differences in industrial water-use efficiency from the perspective of urbanization level and urban primacy [26]. Avazdahandeh et al. (2020) evaluated the impact of urbanization on agricultural water-use and production with an extended mathematical programming method [27]. However, related research mostly focuses on one aspect of urbanization, and fails to explore the water-use problem from multiple aspects of urbanization. Some studies only consider the issue of water-use efficiency without the consideration of green water-use. Considering population urbanization, land urbanization, economic urbanization, and urban-rural relations, this study adopts the super efficiency slack-based model (SE-SBM), considering undesirable output to measure the green water-use efficiency of Guangdong, and comprehensively examines the green water-use efficiency of rapid urbanization. This study will identify the weaknesses in urbanization and put forward some suggestions to improve green water efficiency from urbanization construction in order to make it a strong support for improving green water efficiency. It also has strong application value to further explore the heterogeneity of this effect from the level of different city types.
2. Methodology
2.1. Data Envelopment Analysis Model
There are many methods for measuring water-use efficiency, and some studies use composite indicators such as water-use intensity or sewage discharge intensity to represent water-use efficiency. There are some studies that construct related evaluation index systems, but most of them adopt stochastic frontier analysis and the DEA [28]. Stochastic Frontier Analysis (SFA) is a parametric method based on the production frontier. It is mostly used to measure the technical efficiency of single output and multiple inputs. It needs to set a specific functional form in advance [29]. The DEA model is a non-parametric measurement method that does not need to set the function form in advance. It can effectively deal with the efficiency measurement problem of multiple inputs and multiple outputs [30]. The DEA model was first proposed in 1978 by American economists Charnes, Cooper, and Rhodes. The basic model mainly involves the CCR model, BCC model, FDH model, and so on. Technical efficiency is measured by the degree to which output is maximized for a given input. In the case of a given output, it is measured by the degree of input minimization [31]. The SBM model was proposed by Tone Kaoru in 2001, which can improve the relaxation and improvement part of the invalid decision-making DUM of the radial DEA model [32]. Considering the bad output problem that may occur in the SE-SBM model of undesired output, the early model only considers the good output, which is not in line with the reality. This paper adopts the undesirable SE-SBM model (Formula (1)).
In the undesirable SE-SBM model in Formula (1), it is assumed that the production system has decision-making units. Each decision-making unit can be divided into types of inputs (), types of expected outputs (), expected outputs (), and define matrices , , as , , , respectively. Among them, input (), expected (), and undesired output () are all greater than 0. The production set can be expressed as under constant returns to scale. is the slack variable of input and output, is the weight vector, the objective function is about , , , and its value is between 0 and 1. As far as the decision-making unit is concerned, the decision-making unit is valid only when its value is 1, that is, when , , and are equal. Otherwise, the decision (evaluated) unit is invalid or there is an efficiency loss [33].
2.2. Panel Regression Model
Panel data takes into account both the cross-sectional dimension N and the time dimension T. If the panel data T is small and N is large, the panel data is called short panel. According to the actual situation, a static short panel is used. An extreme strategy is to look at cross-sectional data for mixed regression, where the samples all have exactly the same regression equation. At the other extreme is a separate regression equation for each individual. A compromise strategy is to assume that the individual regression equations have the same slope but different intercepts [34]. The basic assumption of mixed regression is that there are no individual effects, and it can be used for OLS regression like cross-sectional data. Individual effects are averaged over the sample population (Formula (2)). Individual effects exist in two different forms: fixed effects and random effects. However, fixed effects can be divided into individual fixed effects and time fixed effects, etc. The individual fixed effect model is the dispersion form of the mixed model minus its average time (Formula (3)). The time fixed effect model can solve the problem of missing variables that do not change with individuals but with time (Formula (4)). The random effect model regards the fixed regression coefficient as a random variable. The feasible generalized least squares method can be used for estimation (Formula (5)). The maximum likelihood estimation of log likelihood function is also feasible, which depends on the circumstances.
In Formula (2), is the explained variable and is the explanatory variable. is the individual characteristic that does not change with time. is the disturbance term that changes with the individual and time. It is assumed that is independent and identically distributed, and it is uncorrelated with . is the intercept term representing individual heterogeneity. If is related to an explanatory variable, it is a fixed-effects model. Formula (3) can eliminate to obtain a consistent estimator, which is the form of dispersion after model conversion by Formula (2). The OLS can be used to consistently estimate , the fixed-effects estimator. In Formula (4), is the unique intercept term of the period, which is the effect of the period on the explained variable. This is the time fixed effect. In Formula (5), is uncorrelated with explanatory variables and . If the random effect estimator is obtained using the generalized feasible least squares method, the disturbance term is no longer auto-correlated. However, which model to use requires further testing.
3. Empirical Estimation
3.1. Evaluation of Green Water-Use Efficiency
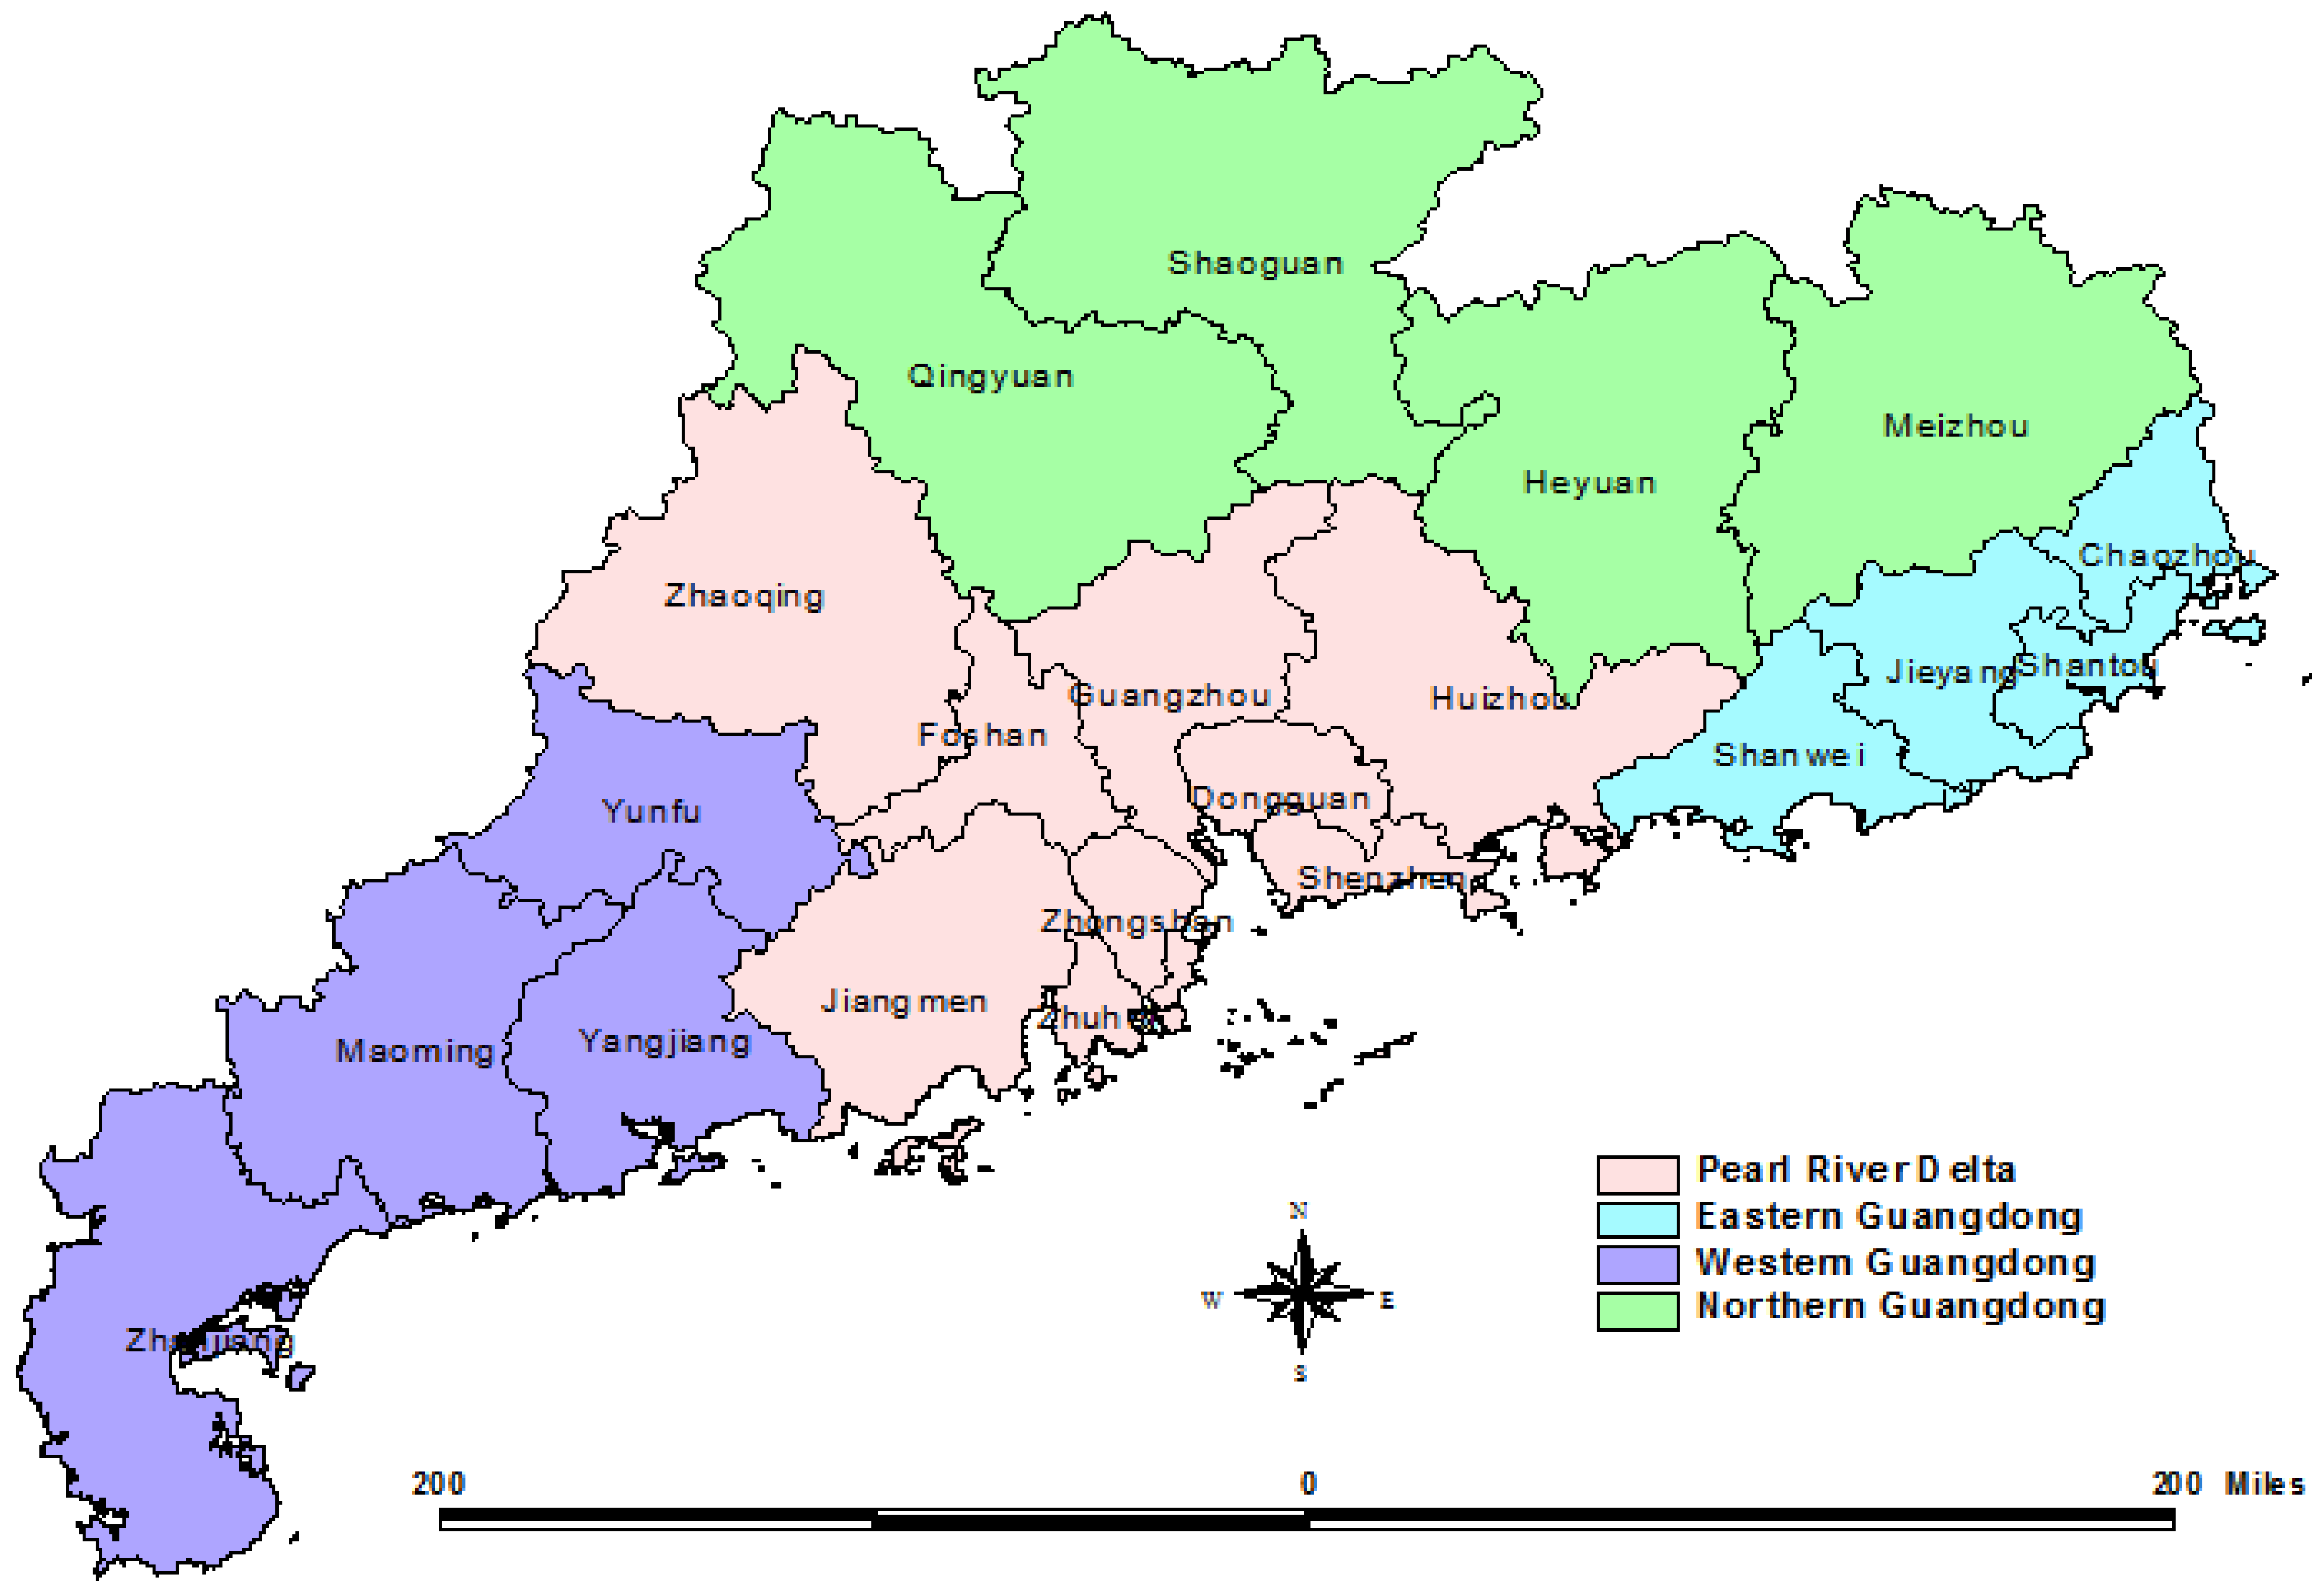
This paper selects capital, labor and water resources as input indicators, selects GDP as desirable output, and selects wastewater discharge as undesired output. The selection of specific indicators and variables is as follows: (1) Capital investment, referring to the Zhang et al. (2004) perpetual inventory method, and taking into account the previous investment depreciation on the basis of new investment [35]. Due to the high update rate of machinery and equipment, the adopted depreciation rate is twice the 9.6% rate. The initial value is 1999 due to data availability. (2) Labor input, the number of employees in each city is used. Guangdong Province is a province with a large concentration of talent, and graduates have had a difficult time finding employment in recent years, so the differences in the education level of the labor force are no longer considered. (3) Total regional water consumption, including production water, domestic water, ecological water, etc. Domestic and ecological water-use is an indispensable part of economic growth. (4) Desirable output indicator GDP. Real GDP indicators are not used for consistency as capital investment and other drivers do not remove price effects. (5) Undesirable output, which is represented by the total amount of wastewater discharge. In order to better analyze the water efficiency of Guangdong Province, this study analyzed 21 cities in efficiency measurement and driving factor testing, respectively. The capital investment, labor, and GDP data are from “Guangdong Statistical Yearbook”, the water consumption data are from “Guangdong Provincial Water Resources Bulletin”, and the wastewater discharge data are from the statistical yearbooks of 21 cities, respectively. The study area of four regions and 21 cities in Guangdong Province can be seen in Figure 1. The input-oriented measurement results can be seen in Table 1.
3.2. Green Water-Use Effect Test of Rapid Urbanization
The process of urbanization is accompanied by changes in industry, population, and construction land, which have profound implications for water utilization patterns and efficiency [36]. So, this paper will explore the impact of Guangdong’s rapid urbanization on green water-use efficiency from the different perspectives of industrial urbanization, population urbanization, land urbanization, social urbanization, and urban-rural integration. The core indicators of urbanization are selected as follows: (1) Industrial urbanization, the proportion of the tertiary industry is selected, which represents the industrial evolution law. During the study period, its share increased from 49.1 percent to 63.8 percent. (2) Population urbanization, the proportion of permanent urban population is selected, which is an important symbol of social development and human progress. The urbanization rate of Guangdong’s permanent population was 71.4 percent, which was the highest in 23 provinces. (3) Land urbanization, the proportion of built-up areas in the total urban area is selected, which is regarded as spread of cities in geographical space and is generally accompanied by the population urbanization [37]. (4) Social urbanization, the urban green space per capita is selected, which represents the livable degree and urban ecological construction. This indicator may be incomplete, but is the core indicator of social urbanization. The per capita green area of parks in Guangdong was 18.13 square meters, which was ranked third in 31 regions of China. (5) Urban-rural integration, the ratio of farmers’ net income to urban residents’ disposable income is adopted, which can reflect the support and feedback of urban areas to rural development. Wang et al. (2020) has verified that the development of urban-rural integration has a positive effect on energy efficiency, however, some experts disagreed and stated that it depended on the development stage of the regional economy [38].
In addition, this paper selects per capita GDP to represent the economic development level and uses the urban sewage treatment rate to represent the environmental regulation level. The ratio of industrial R&D expenditure to industrial added value represents technological innovation, and the ratio of actual foreign investment to GDP is used to represent the foreign investment level. The external dependence is expressed by the proportion of total import and export values to GDP. The regression estimation results can be seen in Table 2.
4. Discussion
4.1. Analysis of Green Water-Use Efficiency
From the perspective of development trends, the overall green water-use efficiency in Guangdong Province has shown a slow rise. The efficiency also declined slightly in individual years, such as 2013. Guangzhou, Shenzhen, and Zhuhai have had the greatest improvement in green water-use efficiency. With the development of the economy, the improvement of production technology and green innovation, the reduction of water consumption and wastewater discharge, green water-use efficiency has been gradually improved. Guangdong is the first region in China to open to the outside world and take off its economy. For many years, it has been the province with the largest share of China’s GDP. In 2020, its industrial pollution control complete investment ranked third in the country with CNY 2.35 billion. However, there are obvious regional differences in the economic development in Guangdong Province. The improvement of green water-use efficiency of cities in the Pearl River Delta is relatively fast, while that in the rest of Guangdong Province is relatively slow. In 2019, the per capita GDP of cities in the Pearl River Delta was more than 3.7 times that of mountainous cities in the north. At the same time as the green transformation of industries in the Pearl River Delta urban agglomeration, in order to achieve rapid economic growth, underdeveloped regions are developing industries with high resource consumption and high pollution emissions.
From the perspective of regional differences, there are significant regional differences in green water-use efficiency in Guangdong Province, which shows a trend of gradual expansion. The phenomenon of spatial agglomeration between high-efficiency and low-efficiency cities is obvious. In 2009, the average green water-use efficiency of cities in the Pearl River Delta was 0.41, while that of northern cities was only 0.2. In 2019, the green water-use efficiency of the two major regions was 0.63 and 0.26, and the regional gap in green water-use efficiency further widened. During the same period, the green water-use efficiency of Guangzhou and Shenzhen was 4.3 times that of Heyuan and Meizhou. This difference is inseparable from economic development and industrial structure. The environmental Kuznets curve theory proposes that there is an inverted U-shaped relationship between environmental pollution and the stage of economic development [39]. Twenty-one cities in Guangdong Province are at different positions on the curve. In addition, the government has introduced relevant policies to encourage industrial transfer. Industrial transfer by official organizations and private sectors is growing in scale, and the industrial undertaking taking place has become a pollution haven for the occurring industrial transfer. Of course, industrial transfer has a pollution halo effect. However, green technology is a judgment relative to the inherent industry. Under the high-quality development, it is impossible to transfer the green industry out of the industrial transfer area.
4.2. Analysis on the Relationship between Rapid Urbanization and Green Water-Use Efficiency
Considering the estimation results of the mixed-effects model, the fixed-effects model, and the random-effects model, combined with the relevant test results, this paper finally adopts the estimation results of the fixed-effects model. Due to the limited space, the relevant inspection process is no longer listed here. Industrial urbanization has a significant positive effect on green water-use efficiency. That is, the larger the proportion of the tertiary industry in GDP, the higher the degree of industrial evolution and the more reasonable the industrial structure, the higher the green water-use efficiency. The upgrading of industrial structures promotes the flow of production factors to industries with high added value and low resource consumption, and transfers from sectors with low production efficiency to sectors with high efficiency. Industrial transformation and upgrading are important parts of high-quality development [40]. Compared with agriculture and manufacturing, the tertiary industry is the most environmentally friendly in terms of resource consumption and pollution discharge. The proportion of the modern service industry in the three industries is getting higher and higher, and it has become an important force supporting the rapid development of the economy. Taking Guangdong Province as an example, Guangzhou and Shenzhen, which have high green water-use efficiency, accounted for 71.6% and 60.9% of the GDP of the tertiary industry in 2019. The proportion of the tertiary industry in the east and west wings of Guangdong Province is 48.4% and 46.9%, respectively. In developed economies such as Japan, urbanization has also undergone a transition from white industry to green service, and modern service industry has replaced traditional manufacturing industry as a new driving force for urbanization and economic development [41].
The impact of population urbanization on green water-use efficiency is not significant. This means that the impact of population agglomeration on green water-use efficiency is still unclear at the provincial level in Guangdong, and the drivers and types of population urbanization in different cities are also different. With economic development and social progress, labor first flows from the primary industry to the secondary industry, and then to the tertiary industry. This is inseparable from the stage of economic development and industrial structure [42]. In the initial stage of urbanization development, labor mainly flows to the industrial production sector, and industrial production coexists with high consumption and high pollution. The development roads of countries such as the United Kingdom and the United States are also polluted first and then treated [43], and many experts have confirmed that there is a threshold effect between urbanization and the ecological environment. In the low-level stage of urbanization, the urbanization generally leads to the deterioration of the ecological environment. As the level of urbanization increases, this negative inhibitory effect will turn into a positive promotion effect, which also fits into the core idea of the environmental Kuznets curve [44]. Of course, the current insignificant relationship needs to be verified at different city levels later.
Land urbanization has a significant positive effect on green water-use efficiency. It shows that the larger the proportion of urban built-up area in the urban area, the higher the urban green water-use efficiency. Compared with rural areas, urban built-up areas have relatively complete water charging systems and wastewater treatment systems. The urban water environment pollution supervision is relatively strict, the residents’ awareness of water-saving and environmental protection is relatively stronger, and the urban land use efficiency is relatively high. The new-type urbanization pays more attention to increasing the output value of unit land, that is, the issue of intensive land development. Some pollution-intensive enterprises are generally located in suburban areas far away from urban areas [45]. Of course, some experts have pointed out that, in the process of urbanization, the excessive pursuit of urban scale and the expansion of urban space caused by a single city-building movement will lead to low resource utilization efficiency and lag in related pollution treatment facilities [46]. In recent years, China’s land urbanization has been significantly faster than population urbanization. Local governments generally use lower land prices to attract investment and increase financial income through real estate development. These will directly or indirectly cause urban land expansion. The core of new-type urbanization lies in the urbanization of people. Local governments should prevent and control the disorderly spread of urban land, pay attention to the quality of urbanization development, and prevent ecological and environmental problems that may be caused by urban expansion.
Social urbanization has a significant negative effect on green water-use efficiency, which may be related to the selection of per capita green area as the indicator of social urbanization. Urban greening will indeed consume a lot of water resources and will not directly increase the regional GDP. It is not only reflected in the urban greening field, but also in the water-use of a large number of public facilities in the urban area. Urban sanitation work will bring some inevitable wastewater discharge problems. Many experts generally use indicators such as the number of middle school students per 10,000 people, the number of beds in health institutions, and the number of mobile phones to measure social urbanization. However, with the development of the social economy, these indicators can no longer reflect urban regional differences. Green area per capita has become the core indicator of urban livability [47]. Urban-rural integration has a significant negative effect on green water-use efficiency. This result is contrary to the general theoretical understanding. However, it can be explained in combination with the development process of Guangdong’s urbanization. With the development of society and the economy, advanced production factors and production methods are concentrated in urban areas, rural development, agricultural production and the number of farmers are relatively shrinking, and the urban-rural income gap will inevitably widen. Farmers’ income will mainly come from migrant workers, which is particularly evident in Guangdong Province. Urban-rural income balance is more of a fair development. The urban-rural income gap is the embodiment of production efficiency and the objective law of economic development.
The level of economic development has a significant positive effect on green water-use efficiency. The higher the level of regional economic development, the higher the level of industrial agglomeration and production management. More resources can be applied to green technology innovation and water environment pollution control, which accords with the basic conclusion of the environmental Kuznets curve theory [48]. The level of foreign investment has a significant negative effect on green water-use efficiency. Except for the Pearl River Delta, most cities in Guangdong are relatively lagging behind. They undertake the transfer of foreign industries and act as a pollution haven for developed countries to a certain extent. The Pearl River Delta has undertaken the transfer of a large number of resource-intensive industries in the course of its development [49]. The level of technological innovation, the level of environmental regulation, and the degree of external dependence have no significant impact on green water-use efficiency. These factors may be significant at city level, but there are significant differences in the development of the four geographic regions in Guangdong Province. Most technological innovations are oriented towards production efficiency. Green technology innovation lacks market application space, and the amount of R&D funding in cities outside the Pearl River Delta is relatively small. Strict environmental regulations can easily lead to inter-regional transfer of polluting industries. The effect of environmental regulations on water-use efficiency also varies with the stage of economic development. The higher the degree of external dependence, the more prosperous the import and export trade with overseas markets, and the import and export of pollution-intensive products will be mixed together and difficult to distinguish.
5. Conclusions
Taking China’s largest economy and rapidly urbanizing province Guangdong as the research area, this paper explores the effect of rapid urbanization on green water-use efficiency from the aspects of industrial urbanization, population urbanization, land urbanization, social urbanization, and urban-rural integration. It is of great practical significance for the realization of high-quality green development in Guangdong. The Undesirable-SE-SBM model is used to measure the green efficiency of Guangdong cities. On this basis, this paper adopts mixed panel, random panel, and fixed panel models to explore the green water-use effect of rapid urbanization and focuses on estimating its effect on green water-use efficiency from industrial urbanization, population urbanization, and land urbanization. Results show: (1) The overall green water-use efficiency in Guangdong shows a slow upward trend. The green water-use efficiency of cities in the Pearl River Delta has improved rapidly. Its northern, eastern, and western cities have low green water-use efficiency and slow improvement. (2) Industrial urbanization and land urbanization have a significant positive effect on Guangdong’s green water-use efficiency. Social urbanization or livable urbanization and urban-rural integration have significant negative effects on green water-use efficiency. The effect of population urbanization on green water-use efficiency is not significant at the provincial level in Guangdong. (3) The improvement of the economic development level is conducive to the improvement of green water-use efficiency. Foreign direct investment has a significant negative effect on green water-use efficiency. Some underdeveloped cities undertake industries with high consumption and high emissions, which is not conducive to the improvement of water-use efficiency.
Based on the above analysis and conclusions, the following policies should be adopted: (1) Continue to promote the green transformation and upgrading of the industry, which implies the optimization of industrial structures from low value-added to high value-added upgrades, upgrading from high resource consumption and pollution to low resource consumption and pollution. Guide the rational agglomeration of advanced manufacturing and modern service industries, and gradually eliminate backward industries with high consumption and high emissions. (2) Guide the population to reasonably gather in urban areas, improve various social securities for migrant workers to work in cities, and encourage the development of individual economies to create more jobs. (3) Control the scale and construction land of megacities, strictly control the land approval system and space planning, improve the utilization efficiency of urban space, and strictly control city-building behaviors such as staking. (4) Strengthen the construction of urban infrastructure and supporting facilities, improve the medical, education, pension, and other conditions of urban residents, improve the livability of cities and towns, and promote the construction of garden cities. (5) Build a harmonious and complementary urban-rural integrated development pattern, prohibit the transfer of pollution-intensive industries to urban suburbs, and guide production factors and social resources to favor rural areas. (6) Develop small and medium-sized cities and towns, promote urbanization in nearby cities, develop industries with local characteristics and promote the integration of industry and city for the improvement the green water efficiency of cities.
Of course, there are still limitations in this study. For example, social and land urbanization can be comprehensively measured by constructing an index system, industrial urbanization can be combined with the process of industrialization, and environmental regulations can be divided into different types. In addition, micro-level analysis of enterprises and farmers was also not promoted, while they are the main body of water utilization. These would be explored and discussed in future research.
Author Contributions
Data curation, Q.Z.; Formal analysis, C.T.; Investigation, Q.Z.; Methodology, Q.Z.; Project administration, C.T.; Supervision, C.T.; Writing—original draft, Q.Z.; Writing—review & editing, C.T. All authors have read and agreed to the published version of the manuscript.
Funding
This research received no external funding.
Institutional Review Board Statement
Not applicable.
Informed Consent Statement
Not applicable.
Data Availability Statement
The data sets generated and analyzed in the current study are available in the “Guangdong Statistical Yearbook”, “Guangdong Provincial Water Resources Bulletin”, and statistical yearbooks of the cities in Guangdong Province.
Conflicts of Interest
The authors declare no conflict of interest.
References
- Cheng, M.Y. Research progress of new urbanization in China from the perspective of geography. Areal Res. Dev. 2022, 41, 46–51. [Google Scholar]
- White, H.; Shah, P. Attention in urban and natural environments. Yale J. Biol. Med. 2019, 92, 115–120. [Google Scholar] [PubMed]
- FAO; UN Water. Progress on Change in Water-Use Efficiency. Global Status and Acceleration Needs for SDG Indicator 6.4.1; FAO; UN Water: Rome, Italy, 2021. [Google Scholar] [CrossRef]
- Geng, N.N.; Shao, X.Y. Research on Coupling Coordination of Ecological Environment-Tourism Industry-Urbanization in the Yellow River Basin. Econ. Probl. 2022, 3, 13–19. [Google Scholar]
- Ahmed, Z.; Asghar, M.M.; Malik, M.N.; Nawaz, K. Moving towards a sustainable environment: The dynamic linkage between natural resources, human capital, urbanization, economic growth, and ecological footprint in China. Resour. Policy 2020, 67, 101677. [Google Scholar] [CrossRef]
- Ariken, M.; Zhang, F.; Liu, K.; Fang, C.L.; Kung, H.T. Coupling coordination analysis of urbanization and eco-environment in Yanqi Basin based on multi-source remote sensing data. Ecol. Indic. 2020, 114, 106331. [Google Scholar] [CrossRef]
- Yang, C.; Zeng, W.; Yang, X. Coupling coordination evaluation and sustainable development pattern of geo-ecological environment and urbanization in Chongqing municipality, China. Sustain. Cities Soc. 2020, 61, 102271. [Google Scholar] [CrossRef]
- Wang, L.L.; Liu, X.J.; Qi, Y.L.; Li, D. Spatio-temporal evolution and drivers of the ecological response of urbanization in central plains urban agglomeration. Resour. Dev. Mark. 2021, 114, 106331. [Google Scholar]
- Liu, Q.R.; Tang, L. Empirical test of the growth trajectory of energy consumption in the process of urbanization. Stat. Decis. 2022, 38, 84–88. [Google Scholar]
- Dhakal, S. GHG emissions from urbanization and opportunities for urban carbon mitigation. Curr. Opin. Environ. Sustain. 2010, 2, 277–283. [Google Scholar] [CrossRef]
- Yilmaz, S.; Sezen, I.; Sari, E.N. The relationships between ecological urbanization, green areas, and air pollution in Erzurum/Turkey. Environ. Ecol. Stat. 2021, 28, 733–759. [Google Scholar] [CrossRef]
- Li, H.X.; Shao, D.G.; Yin, X.; Chen, S.; Xu, B.L. Evolution method for irrigation-water use efficiency based on principle component analysis and Copula function. Trans. Chin. Soc. Agric. Eng. 2015, 31, 96–102. [Google Scholar]
- Nithammer, C.M.; Mahabir, J.; Dikgang, J. Efficiency of South African water utilities: A double bootstrap DEA analysis. Appl. Econ. 2021, 54, 3055–3073. [Google Scholar] [CrossRef]
- Ma, H.L.; Zhang, Y.Q.; Wang, L. Measurement and convergence analysis of green water utilization efficiency. J. Nat. Resour. 2017, 32, 406–417. [Google Scholar]
- Tong, J.P.; Chen, J.; Zhao, L.L. Spatial spillover effects of green total-factor water use efficiency on economic growth in the Yangtze River Economic Zone. Ecol. Econ. 2019, 35, 159–164. [Google Scholar]
- Wang, M.Q.; Huang, Y.; Li, D. Assessing the performance of industrial water resource utilization systems in China based on a two-stage DEA approach with game cross efficiency. J. Clean. Prod. 2021, 312, 127722. [Google Scholar] [CrossRef]
- Chang, M.; Wang, X.Q.; Zhang, X.Y. Influence of management mode of farmland water conservancy on irrigation efficiency of farmers. J. Huazhong Agric. Univ. 2022, 2, 24–35. [Google Scholar]
- Rad, M.H.; Sarkheil, H.; Khojastehpour, R. Analysing water use efficiency and productivity in Iran’s metropolises. Proc. Inst. Civ. Eng.-Water Manag. 2019, 172, 102–108. [Google Scholar] [CrossRef]
- Velasco-Muñoz, J.F.; Aznar-Sánchez, J.A.; Belmonte-Ureña, L.J.; López-Serrano, M.J. Advances in Water Use Efficiency in Agriculture: A Bibliometric Analysis. Water 2018, 10, 377. [Google Scholar] [CrossRef] [Green Version]
- Gautam, T.K.; Paudel, K.P.; Guidry, K.M. An Evaluation of Irrigation Water Use Efficiency in Crop Production Using a Data Envelopment Analysis Approach: A Case of Louisiana, USA. Water 2020, 12, 3193. [Google Scholar] [CrossRef]
- Wu, Z.D.; Zhang, Y.; Wu, Z.L.; Cao, X.C.; Liang, X.Y.; Wu, Y.Z. Study on the spatio-temporal evolution and influencing factors of economic efficiency of generalized water use for crop production in China’s major grain-producing area. Resour. Environ. Yangtze Basin 2021, 30, 2763–2777. [Google Scholar]
- Njuki, E.; Bravo-Ureta, B.E. Irrigation water use and technical efficiencies: Accounting for technological and environmental heterogeneity in U.S. agriculture using random parameters. Water Resour. Econ. 2018, 24, 1–12. [Google Scholar] [CrossRef]
- Kan, D.X.; Lv, L.J. An empirical analysis of the impact of urbanization on water resources security: Based on the space correction system GMM method. Ind. Organ. Rev. 2018, 12, 152–167. [Google Scholar]
- Liang, D.Z.; Lu, H.W.; Feng, L.Y.; Qiu, L.H.; He, L. Assessment of the sustainable utilization level of water resources in the Wuhan Metropolitan Area based on a three-dimensional water ecological footprint model. Water 2021, 13, 3505. [Google Scholar] [CrossRef]
- Hai, X.; Li, W.F.; Wang, C.; Zhou, W.Q.; Han, L.J.; Qian, Y.G. lnteractions between water use efficiency and urbanization level in the Beijing-Tianjin-Hebei megaregion, China. Acta Ecol. Sin. 2018, 38, 4245–4256. [Google Scholar]
- Ding, X.H.; Fu, Z.; Jia, H.W. Study on urbanization level, urban primacy and industrial water utilization efficiency in the Yangtze River Economic Belt. Sustainability 2019, 11, 6571. [Google Scholar] [CrossRef] [Green Version]
- Avazdahandeh, S.; Khalilian, S. The effect of urbanization on agricultural water consumption and production: The extended positive mathematical programming approach. Environ. Geochem. Health 2020, 43, 247–258. [Google Scholar] [CrossRef]
- Cheng, K.M.; Liu, Q.L.; Zhuang, Y.J. Evolution, comparison and prospection of undesirable output processing methods in efficiency evaluation. J. Quant. Tech. Econ. 2021, 38, 154–171. [Google Scholar] [CrossRef]
- Dar, A.H.; Mathur, S.K.; Mishra, S. The efficiency of Indian banks: A DEA, Malmquist and SFA analysis with bad output. J. Quant. Econ. 2021, 19, 41–49. [Google Scholar] [CrossRef]
- Dickson, K.G.; Jin, H.; Magdalene, Z.A.A.; Mohammad, K. Network DEA models for assessing urban water utility efficiency. Util. Policy 2019, 57, 48–58. [Google Scholar] [CrossRef]
- Charnes, A.; Cooper, W.W.; Rhodes, E. Measuring the efficiency of decision making units. Eur. J. Oper. Res. 1978, 2, 429–444. [Google Scholar] [CrossRef]
- Tone, K. A Slacks-Based Measure of Super-Efficiency in data envelopment analysis. Eur. J. Oper. Res. 2002, 143, 32–41. [Google Scholar] [CrossRef] [Green Version]
- Ding, X.H.; Tang, N.; He, J.H. The threshold effect of environmental regulation, FDI agglomeration, and water utilization efficiency under “Double Control Actions”-An empirical test based on Yangtze River Economic Belt. Water 2019, 11, 452. [Google Scholar] [CrossRef] [Green Version]
- Liu, X.L.; Chen, L. The heterogeneity of correlation between cross-section and time series. J. Quant. Tech. Econ. 2011, 28, 96–114. [Google Scholar] [CrossRef]
- Zhang, J.; Wu, G.Y.; Zhang, J.P. The estimation of China’s provincial capital stock: 1952–2000. Econ. Res. J. 2004, 10, 35–44. [Google Scholar]
- Zhang, X.J.; Xu, W.X.; Liu, C.J. Spatio-temporal disparity of coupling coordination of economic-land-population-society urbanization in Guangdong-Hong Kong-Macao Region and its influencing factors. Inq. Into Econ. Issues 2019, 10, 54–64. [Google Scholar]
- Ahmad, M.; Rehman, A.; Shah, S.A.A.; Solangi, Y.A.; Chandio, A.A.; Jabeen, G. Stylized heterogeneous dynamic links among healthcare expenditures, land urbanization, and CO2 emissions across economic development levels. Sci. Total Environ. 2020, 753, 142228. [Google Scholar] [CrossRef]
- Wang, X.Y.; Li, X.M.; Shen, L.; Wang, Y.L. Analysis of the spatial effect of urban-rural integration on energy efficiency in the Yangtze River Economic Belt. J. Geo-Inf. Sci. 2020, 22, 2188–2198. [Google Scholar] [CrossRef]
- Wang, S.W.; Wang, J.C. Nonlinear relationship between municipal solid waste and economic growth: Empirical analysis based on environmental Kuznets curve. China Popul. Resour. Environ. 2022, 32, 63–70. [Google Scholar]
- Gu, J.H.; Wang, Y.Q. Influence of industrial structure change on regional high-quality green development and its spatial spillover effect: An empirical study based on China’s provincial panel data. J. Southwest Univ. 2021, 43, 116–128. [Google Scholar] [CrossRef]
- Liu, J.S.; Nong, B.Z. Green development: The new impetus of urbanization in Japan. Contemp. Econ. Jpn. 2015, 6, 34–41. [Google Scholar] [CrossRef]
- Islam, N.; Yokota, K. Lewis growth model and China’s industrialization. Asian Econ. J. 2008, 22, 359–396. [Google Scholar] [CrossRef]
- Arnaut, J.; Lidman, J. Environmental sustainability and economic growth in Greenland: Testing the Environmental Kuznets Curve. Sustainability 2021, 13, 1228. [Google Scholar] [CrossRef]
- Xiao, P.; Su, J.; Jiang, A.N. Eco-environmental effects of urbanization in the Dongting Lake area: Empirical analysis based on nonlinear PSTR model. J. Wuling 2021, 46, 46–51. [Google Scholar] [CrossRef]
- Nam, P.P.; Yen, T.T. Impact of urbanization on land complaints in Vinh City, Nghe An province. Land Use Policy 2022, 108, 105533. [Google Scholar] [CrossRef]
- Jin, D.; Dai, L.L. Temporal and spatial characteristics and driving factors of coordinated development between population urbanization and land urbanization in China. China Land Sci. 2021, 35, 74–84. [Google Scholar]
- Tian, P.; Li, J.L.; Cao, L.D.; Pu, R.L.; Wang, Z.Y.; Zhang, H.T.; Chen, H.L.; Gong, H.B. Assessing spatiotemporal characteristics of urban heat islands from the perspective of an urban expansion and green infrastructure. Sustain. Cities Soc. 2021, 74, 103208. [Google Scholar] [CrossRef]
- Al-Mulali, U.; Saboori, B.; Ozturk, I. Investigating the environmental Kuznets curve hypothesis in Vietnam. Energy Policy 2015, 76, 123–131. [Google Scholar] [CrossRef]
- Tan, J.Y.; Zhang, Y.H. Bonus of industrial agglomeration or reappearance of “Pollution Haven”? Based on the evidence in Guangdong Province. Res. Econ. Manag. 2015, 36, 82–89. [Google Scholar] [CrossRef]
Figure 1.
The study area of four regions and 21 cities in Guangdong Province.

Table 1.
Results of Green Water-use Efficiency in Guangdong Province: 2009–2019.
| Region | 2009 | 2010 | 2011 | 2012 | 2013 | 2014 | 2015 | 2016 | 2017 | 2018 | 2019 |
|---|---|---|---|---|---|---|---|---|---|---|---|
| Guangzhou | 0.52 | 0.54 | 0.57 | 0.58 | 0.61 | 0.61 | 0.61 | 0.62 | 0.62 | 0.62 | 1.00 |
| Shenzhen | 0.67 | 0.73 | 0.82 | 0.88 | 0.96 | 1.01 | 0.99 | 1.01 | 1.03 | 1.00 | 1.00 |
| Foshan | 0.49 | 0.51 | 0.52 | 0.52 | 0.53 | 0.53 | 0.54 | 0.55 | 0.55 | 0.56 | 0.58 |
| Dongguan | 0.43 | 0.44 | 0.47 | 0.48 | 0.50 | 0.51 | 0.53 | 0.56 | 0.60 | 0.63 | 0.64 |
| Zhongshan | 0.36 | 0.38 | 0.41 | 0.41 | 0.41 | 0.41 | 0.42 | 0.42 | 0.42 | 0.42 | 0.43 |
| Zhuhai | 0.44 | 0.47 | 0.49 | 0.49 | 0.50 | 0.51 | 0.53 | 0.54 | 0.60 | 0.60 | 1.00 |
| Jiangmen | 0.32 | 0.33 | 0.34 | 0.32 | 0.31 | 0.30 | 0.30 | 0.30 | 0.31 | 0.32 | 0.33 |
| Zhaoqing | 0.22 | 0.23 | 0.25 | 0.24 | 0.24 | 0.25 | 0.25 | 0.25 | 0.26 | 0.27 | 0.28 |
| Huizhou | 0.27 | 0.29 | 0.32 | 0.33 | 0.34 | 0.35 | 0.34 | 0.35 | 0.37 | 0.38 | 0.39 |
| Pearl River Delta | 0.41 | 0.44 | 0.47 | 0.47 | 0.49 | 0.50 | 0.50 | 0.51 | 0.53 | 0.53 | 0.63 |
| Shantou | 0.34 | 0.33 | 0.34 | 0.33 | 0.32 | 0.31 | 0.31 | 0.32 | 0.33 | 0.32 | 0.33 |
| Chaozhou | 0.29 | 0.30 | 0.32 | 0.32 | 0.34 | 0.34 | 0.33 | 0.33 | 0.31 | 0.32 | 0.33 |
| Jieyang | 0.25 | 0.24 | 0.25 | 0.25 | 0.27 | 0.27 | 0.26 | 0.28 | 0.27 | 0.29 | 0.29 |
| Shanwei | 0.18 | 0.19 | 0.20 | 0.22 | 0.22 | 0.22 | 0.22 | 0.23 | 0.24 | 0.25 | 0.26 |
| Eastern Guangdong | 0.26 | 0.27 | 0.28 | 0.28 | 0.29 | 0.29 | 0.28 | 0.29 | 0.29 | 0.30 | 0.30 |
| Zhanjiang | 0.30 | 0.31 | 0.34 | 0.34 | 0.32 | 0.30 | 0.28 | 0.27 | 0.27 | 0.27 | 0.27 |
| Maoming | 0.66 | 0.77 | 1.05 | 0.68 | 0.47 | 0.42 | 0.36 | 0.34 | 0.34 | 0.35 | 0.36 |
| Yangjiang | 0.27 | 0.26 | 0.26 | 0.27 | 0.29 | 0.30 | 0.30 | 0.30 | 0.31 | 0.32 | 0.34 |
| Yunfu | 0.18 | 0.17 | 0.18 | 0.17 | 0.17 | 0.17 | 0.17 | 0.19 | 0.20 | 0.21 | 0.22 |
| Western Guangdong | 0.35 | 0.38 | 0.46 | 0.37 | 0.31 | 0.30 | 0.28 | 0.28 | 0.28 | 0.29 | 0.30 |
| Shaoguan | 0.21 | 0.20 | 0.21 | 0.22 | 0.22 | 0.23 | 0.22 | 0.23 | 0.25 | 0.27 | 0.28 |
| Qingyuan | 0.15 | 0.16 | 0.19 | 0.20 | 0.21 | 0.22 | 0.23 | 0.26 | 0.27 | 0.28 | 0.29 |
| Meizhou | 0.25 | 0.26 | 0.27 | 0.27 | 0.27 | 0.26 | 0.25 | 0.24 | 0.23 | 0.23 | 0.23 |
| Heyuan | 0.19 | 0.19 | 0.21 | 0.22 | 0.23 | 0.23 | 0.22 | 0.22 | 0.23 | 0.23 | 0.23 |
| Northern Guangdong | 0.20 | 0.20 | 0.22 | 0.23 | 0.23 | 0.24 | 0.23 | 0.24 | 0.25 | 0.25 | 0.26 |
Table 2.
Estimation of the Impact of Rapid Urbanization on Green Water-use Efficiency in Guangdong Province.
Table 2.
Estimation of the Impact of Rapid Urbanization on Green Water-use Efficiency in Guangdong Province.
| Variable | Mixed Effects Model | Fixed Effects Model | Random Effects Model | |||
|---|---|---|---|---|---|---|
| Coefficient | p Value | Coefficient | p Value | Coefficient | p Value | |
| Industrial urbanization | 0.1840 | 0.175 | 0.3486 | 0.024 | 0.1893 | 0.133 |
| Population urbanization | −0.1031 | 0.537 | −0.3577 | 0.170 | −0.1013 | 0.416 |
| Land urbanization | 0.6694 | 0.003 | 0.6599 | 0.101 | 0.6787 | 0.000 |
| Social urbanization | −0.0066 | 0.060 | −0.0041 | 0.076 | −0.0065 | 0.002 |
| Urban–rural integration | −0.2566 | 0.148 | −0.5121 | 0.000 | −0.2688 | 0.023 |
| Economic development level | 0.0287 | 0.000 | 0.0187 | 0.028 | 0.0284 | 0.000 |
| Technological innovation level | 0.6308 | 0.377 | 0.4943 | 0.576 | 0.6405 | 0.393 |
| Environmental regulation level | −0.0602 | 0.194 | −0.0148 | 0.680 | −0.0581 | 0.090 |
| Foreign investment level | −0.9204 | 0.337 | −1.5083 | 0.013 | −0.9237 | 0.072 |
| External dependence | 0.0287 | 0.455 | −0.0367 | 0.456 | 0.0278 | 0.379 |
Publisher’s Note: MDPI stays neutral with regard to jurisdictional claims in published maps and institutional affiliations. |
© 2022 by the authors. Licensee MDPI, Basel, Switzerland. This article is an open access article distributed under the terms and conditions of the Creative Commons Attribution (CC BY) license (https://creativecommons.org/licenses/by/4.0/).
Share and Cite
MDPI and ACS Style
Zhou, Q.; Tong, C. Does Rapid Urbanization Improve Green Water-Use Efficiency? Based on the Investigation of Guangdong Province, China. Sustainability 2022, 14, 7481. https://doi.org/10.3390/su14127481
AMA Style
Zhou Q, Tong C. Does Rapid Urbanization Improve Green Water-Use Efficiency? Based on the Investigation of Guangdong Province, China. Sustainability. 2022; 14(12):7481. https://doi.org/10.3390/su14127481
Chicago/Turabian StyleZhou, Qiuxia, and Changfeng Tong. 2022. "Does Rapid Urbanization Improve Green Water-Use Efficiency? Based on the Investigation of Guangdong Province, China" Sustainability 14, no. 12: 7481. https://doi.org/10.3390/su14127481
Note that from the first issue of 2016, this journal uses article numbers instead of page numbers. See further details here.