Article

Construction and Optimization of Green Infrastructure Network Based on Space Syntax: A Case Study of Suining County, Jiangsu Province

1
School of Architecture, Southeast University, Nanjing 210096, China
2
School of Architecture & Design, China University of Mining and Technology, Xuzhou 221000, China
3
Jiangsu Collaborative Innovation Center for Building Energy Saving and Construction Technology, Xuzhou 221116, China
*
Authors to whom correspondence should be addressed.
Sustainability 2022, 14(13), 7732; https://doi.org/10.3390/su14137732
Submission received: 25 March 2022 / Revised: 27 May 2022 / Accepted: 6 June 2022 / Published: 24 June 2022

Abstract

:
The construction of green infrastructure (GI) plays an important role in improving the rural ecological functions and building a green livable environment. In this paper, the methods of morpho spatial pattern analysis (MSPA) and space syntax analysis are used to study the GI network construction in Suining County, Jiangsu Province. The results show that: (1) In 2018, the area of ecological patches increased by 110% compared with 1998, and the utilization rate of the GI network was significantly improved. (2) A total of 66 ecological corridors were analyzed in the county, and the main corridors were distributed in the central and western regions. The correlation analysis of core ecological patches in 1998, 2008, and 2018 proved that location factors had the greatest impact on the results of function and connectivity. (3) According to the optimization results, ecological benefits can be improved through engineering measures to realize the revitalization and development of regional rural areas.

1. Introduction

With the proposal of harmonious coexistence between man and nature at the 19th National Congress of the Communist Party of China, the “14th Five-Year Plan”, and the rural revitalization strategy, the construction of villages and towns in China has shifted from quantitative change to qualitative change. Building an “Ecologically Livable and Beautiful Village” starting from the county level is one of the important steps in building a regional ecological security pattern. Strengthening the construction of green infrastructure (GI) has become the top priority of national strategic development because the scientific construction of the GI network can ensure the sustainable development of village ecosystems.
In urban and rural planning [1], GI connectivity is one of the key indicators for measuring the scientificity of GI network construction [2]. Strong connectivity is of positive significance for the protection of biodiversity, ecosystem stability, and the construction of ecological security patterns. Although there is no accurate definition of green livability, the core of its concept is mainly derived from ecological livability [3]. Green and livable villages and towns prioritize a people-oriented and ecological environment. On the premise of meeting the ecological environment capacity and resource-carrying capacity of townships, the development of villages and towns should promote the deep integration of society, economy, and environment, ultimately achieving harmonious, sustainable, green, and low-carbon development. The construction of the GI network can not only alleviate the problem of landscape fragmentation but also ensure the benign operation of the village and town ecosystem. Studies have shown that excessive carbon emissions from human production and business activities is the main factor leading to environmental degradation [4,5]. The promotion of GI construction is crucial to relieving global climate change and is of great significance to the coordinated and sustainable development of villages’ and towns’ ecological and social spaces [6]. Some regions have deeply analyzed the relationship between social economy and water environment development quality by building a coordinated development model to provide suggestions for environmental protection [7]. In addition, wastewater treatment efficiency is higher in southeastern China than in northwestern China [8].
The concept of the GI network was put forward at the end of the 20th century. It is an infrastructure system that can provide ecological services and support functions for the region in which it is located, covering different levels of countries, regions, and cities. It is also one of the essential carriers of green poverty alleviation. Compared with other types of ecological space networks, GI emphasizes not only the service function of human settlements but also a multi-functional green space network, which contains various scales of natural space. Artificial landscape and ecological elements can provide important space carriers and guarantees for biodiversity protection, environmental quality maintenance, and human well-being and are of great significance for maintaining urban ecosystem services [9,10,11].
Through the review of relevant domestic and foreign literature in recent years, it can be seen that most of the current research is based on the research path of “identifying ecological sources–constructing resistance surfaces–extracting ecological corridors” in terms of GI network construction and connectivity evaluation. Among them, MSPA is an optimization of the traditional ecological source identification method, as shown in Table 1.
MSPA takes mathematical morphology as the core. By identifying ecological sources as seven ecological patches with different ecological meanings, it can quickly and accurately identify core ecological sources and construct resistance surfaces. Currently, MSPA has been widely used in GI network research [26]. MSPA can be applied in landscape ecology mainly because it explains the three key ecological elements of “scale”, “edge effect”, and “patch-corridor-node”, in which scale determines the minimum [27,28]. The research unit is a pixel (as shown in Figure 1); once the pixel size and edge width are determined, MSPA can identify the patch type of each pixel in the study area according to the penetration theory (as shown in Figure 2). The cumulative resistance surface calculated by combining spatial elements such as “slope” and “land use type” typically considers the difficulty of physical connectivity between ecological patches only, which makes this method suitable for plains where the “slope” does not change much. Regional “land-use type” has become the most critical factor in measuring resistance; however, the interconnectedness of the intricate GI network paths is ignored, and an in-depth analysis of the complex spatial-behavior interaction system is lacking [29]. The space syntax theory is a theoretical and analytical method that can correlate space with social and economic activities [30]. It is often used in urban and rural planning to study spatial organization and behavior in complex spatial networks. MSPA-based GI network construction and connectivity have positive implications for research improvement.
Therefore, this paper intends to optimize the original method by combining MSPA and space syntax and introduce space syntax into GI network construction and connectivity evaluation. Taking Suining County, Xuzhou City as an example, the study of the county area of Suining County in the past 20 years is carried out through correlation analysis. From the perspective of structure, the overall connectivity and importance of the GI network were analyzed, which provides a scientific reference for future research on the optimization of the GI network in villages and towns in the plains area from the county level.

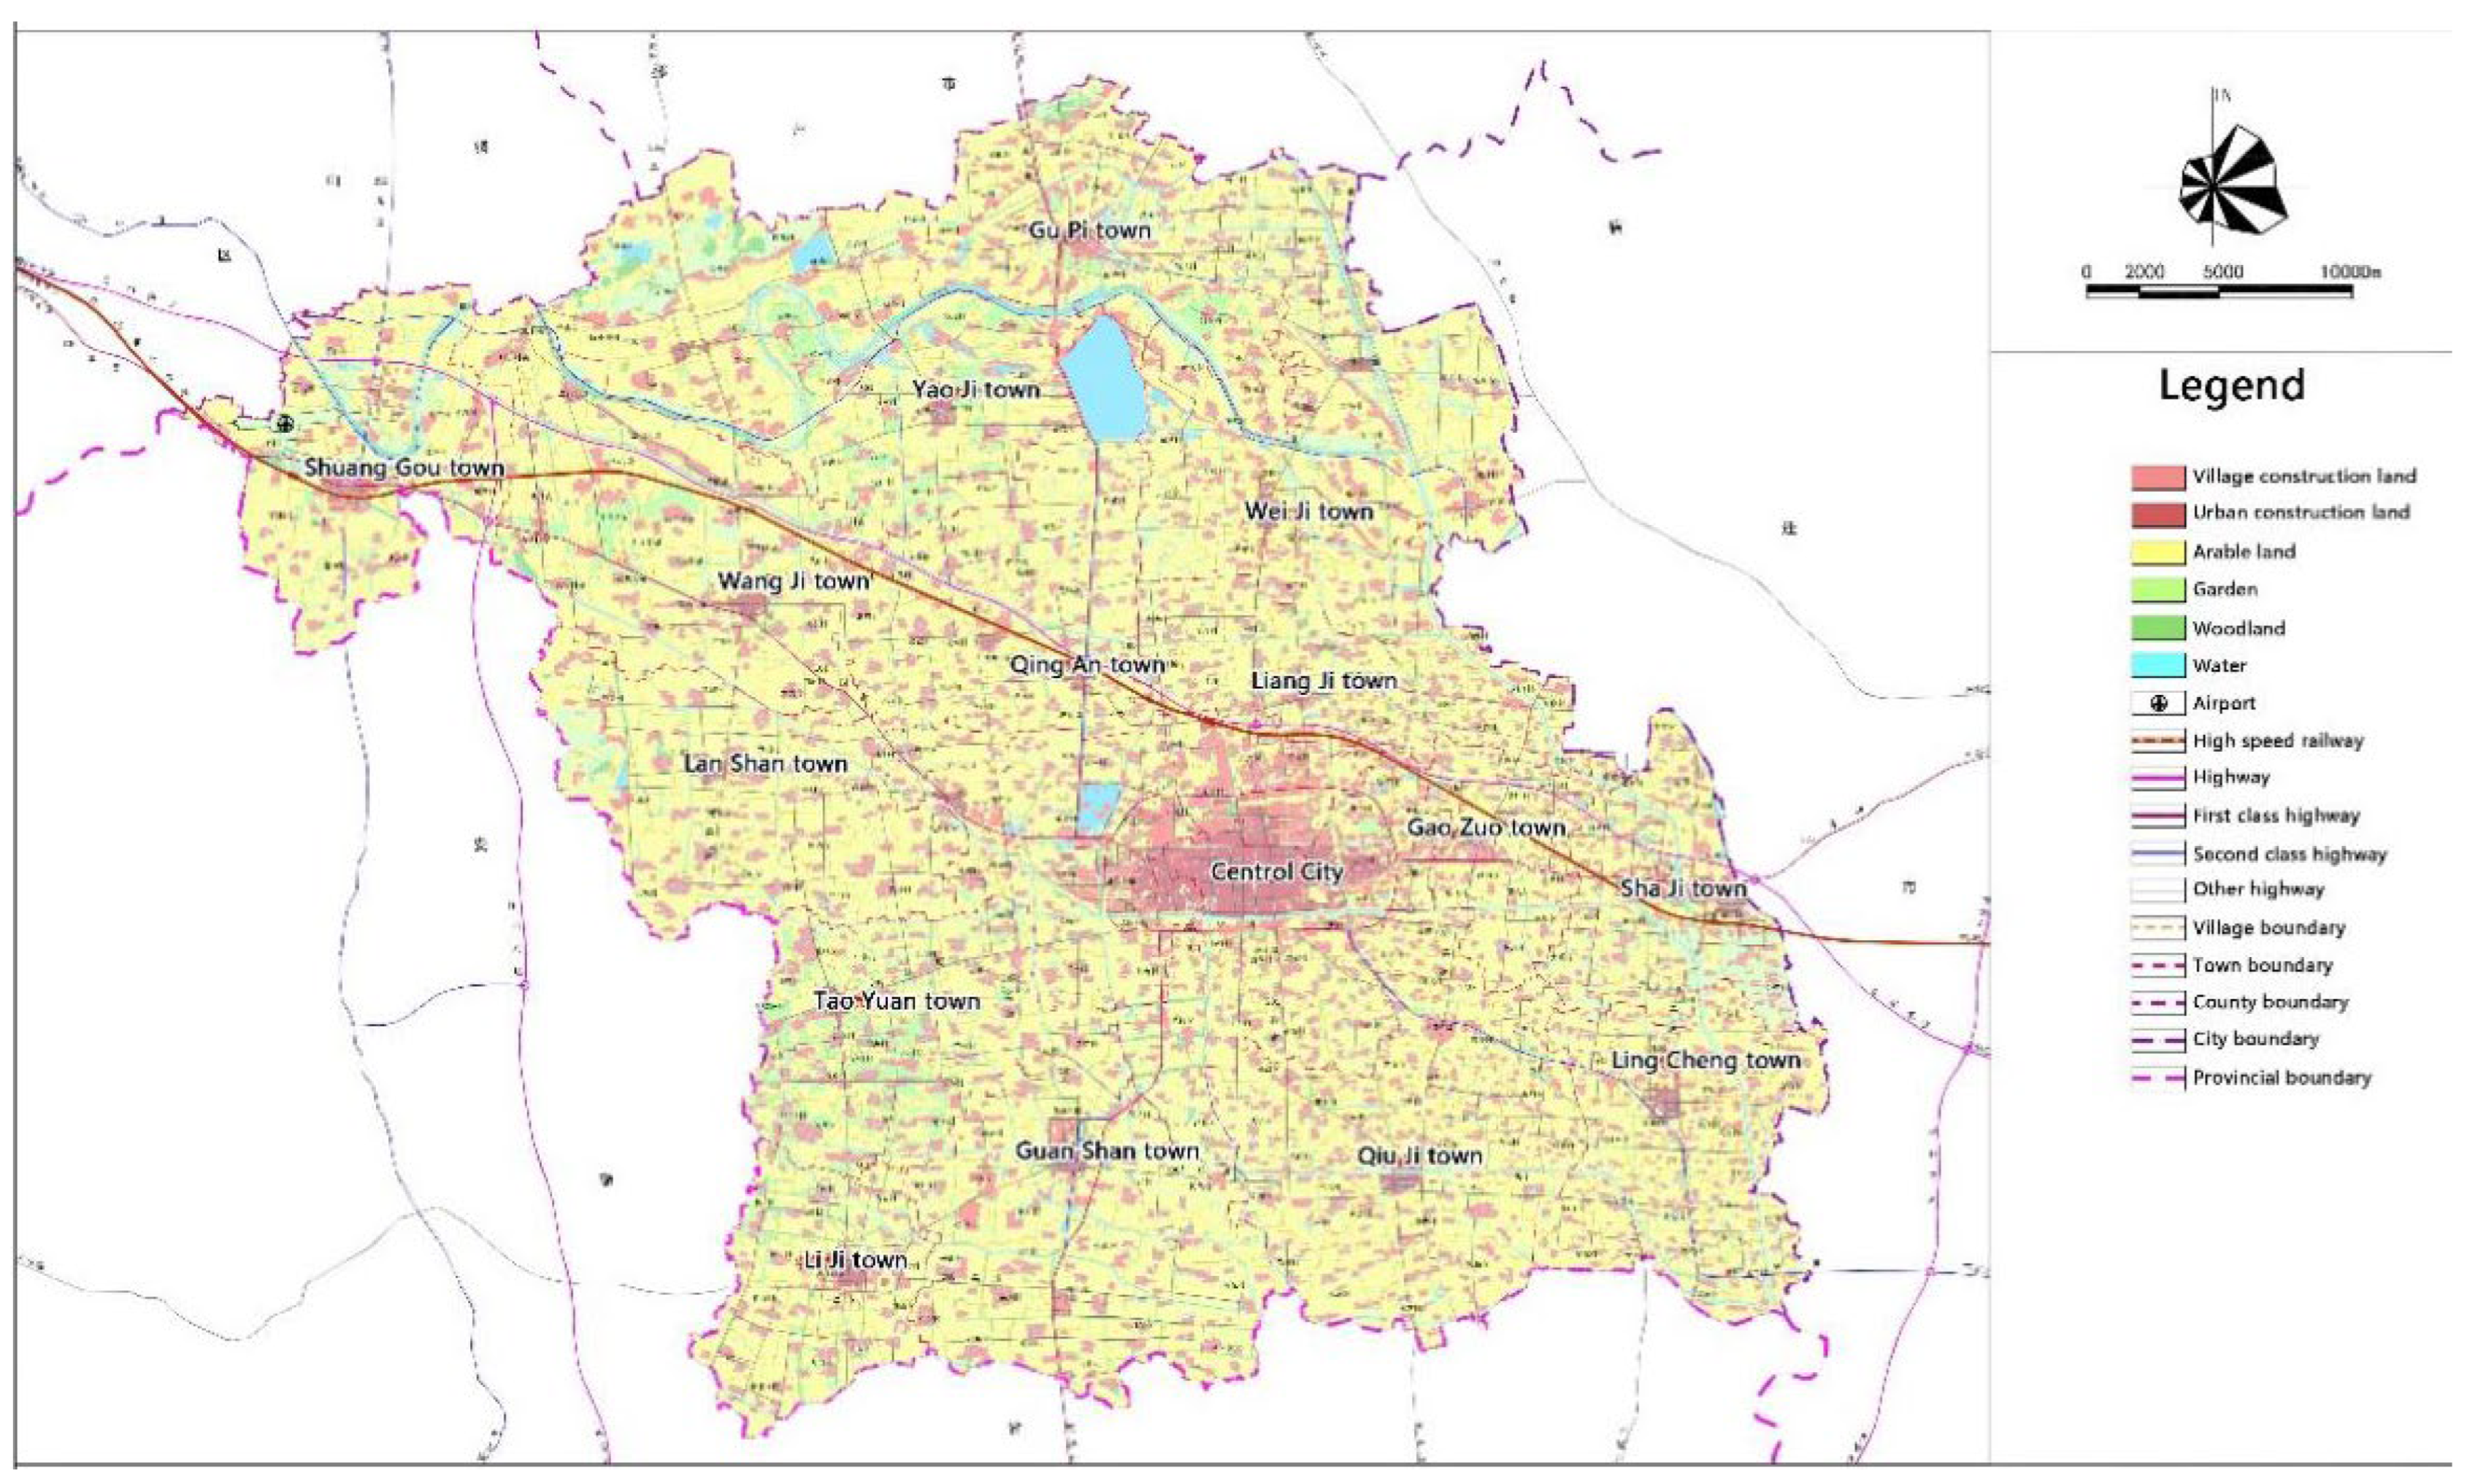
Overview of the Study Area

The Suining area has the typical characteristics of the North China Plain, which has flat terrain, convenient transportation, and many rivers and lakes. The pain has unique advantages in land use and social and economic development. However, while accounting for merely 3% of the total land area of China, it feeds nearly 1/4 of the country’s population, and the demand for rapid development has made the contradiction between ecological environment and social development increasingly prominent. Suining County is located in the northwest of Jiangsu Province (33°40′–34°10′ N, 117°31′–118°10′ E). It belongs to the subtropical monsoon climate and covers a floor area of 1769.2 km2. In the county, the area of plains is 1666.0 km2, that of hills is 20.4 km2, and that of water is 83.0 km2, with an average altitude of 28.3 m. Suning County has good natural conditions and abundant arable land and water resources (as shown in Figure 3). The region boasts the Yellow River, Xinlong River, Suibei River, Xusha River, and Xuhong River, constituting a “four horizontal and one vertical” river network system, in addition to another eight rivers. Reservoir and abundant water resources provide basic conditions for the development of agriculture, forestry, animal husbandry, and fishery in Suining County. In 2021, Suining County carried out “three special investigations” to strengthen the construction of ecological civilization in the local area and improve the level of ecological construction. However, the conflict between economic interests and ecological protection that has existed in the actual development process for a long time has exacerbated the fragmentation of the landscape in this area, and the decline of landscape connectivity will further affect the sustainable development of the ecological environment and the protection of biodiversity in the county.
The study on GI connectivity evaluation and network construction of villages and towns in Suining County can not only provide reasonable suggestions for biodiversity conservation, ecological environment quality maintenance, and improvement of human well-being in this region but also offer a more scientific basis for the construction of a GI network of villages and towns in the North China Plain, and the like.

2. Data Sources and Research Methods

2.1. Data Sources

This study used the TM\OLILandsat8 OLI image data in 1998, 2008, and 2018 and the 30 m digital elevation data downloaded from the geospatial data cloud platform. The image data were radiometrically calibrated and atmospherically corrected through ENVI5.1, and multispectral image fusion was performed, forming the 15 m image data. The maximum likelihood estimation, together with the spectral differences of land types and visual interpretation method, was used to obtain the current land use data, which were classified into five categories: farmland, woodland, waters, bare land, and construction land. Then, the classification results were verified by Google Earth maps of corresponding dates and related field research, showing that the final interpretation accuracy reached 94.30%. The Kappa coefficient was 0.94, which met the research requirements

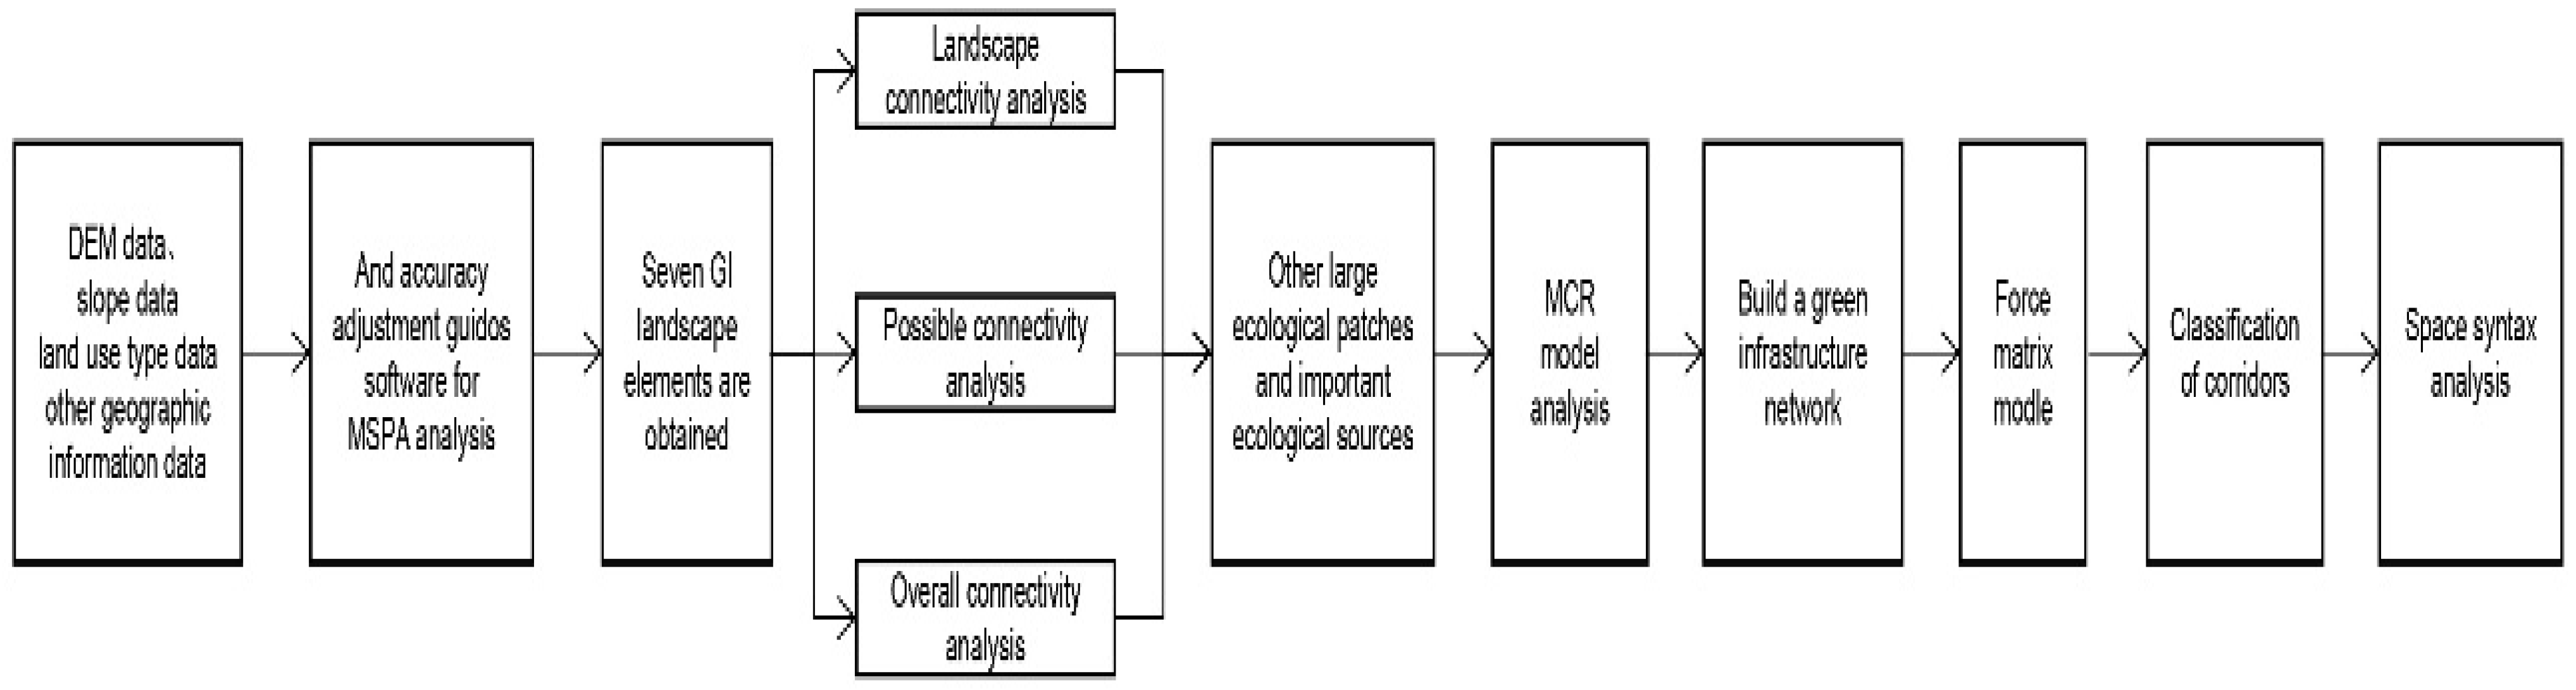
2.2. Research Methods

In this study, the collected data were sorted and corrected for GI elements pattern analysis based on MSPA. Then, the connectivity of GI was studied, and the GI network was constructed with the multivariate curve resolution (MCR) model [33]. Finally, the corridor connectivity was analyzed and ranked with an interaction matrix model. The space syntax was used to calculate the integration, choice, connectivity, control, and depth of each town (Figure 4).

2.3. Ecological Patch Identification and GI Network Construction

Landscape connectivity refers to the smooth flow of organisms or a certain ecological process between patch sources. This paper selects the commonly used landscape connectivity index, overall connectivity (IIC, Formula (1)), and possible connectivity (PC, Formula (2)) to analyze the landscape connectivity of the study area and extracts the importance of the patch connectivity (dI, Formula (3)) of the ecological source. Large ecological patches have high connectivity and ecological benefits. Therefore, in this paper, the core area patches with an area greater than 0.5 km2 were selected as the connectivity evaluation objects, and the Conefor2.6 software was used to evaluate the landscape connectivity. The connectivity probability was set to 0.5; then, 300 m, 500 m, and 1000 m were used as the distance threshold for calculation and analysis, and 1000 m was determined as the distance threshold. In the end, the core area patches with dPC ≥ 5 were extracted as the ecological source.
IIC = i = 1 n j = 1 n a i a j l + n l i j A 2 L
PC = i = 1 n j = 1 n p i j a i a j A L 2
IIC = i = 1 n j = 1 n a i a j l + n l i j A 2 L
where:
  • n is the total number of patches in the core area screened by area;
  • ai is the contribution of patch i (herein refers to the area);
  • nlij is the number of connectivity between patches i and j;
  • pij is the number of organisms in the two patches with the maximum probability of diffusion;
  • I is the landscape connectivity value;
  • IR is the landscape connectivity value after removing a patch.

2.4. GI Network Construction

The movement of organisms between two patches occurs at the expense of overcoming landscape resistance, so the value of the landscape resistance was used to measure the cost of such movement between different patches. The MCR model was adopted to calculate the optimal route of species movement between two patches [34]. The steps are as follows: (1) elevation, slope, land use status, and MSPA elements were determined as resistance layers; (2) based on the survey and cognition in the three periods of 1998, 2008, and 2018 in Suining County, the weight of each resistance layer was determined through the expert scoring method and the AHP method; (3) the resistance values of factors under each resistance layer were determined, as shown in Table 2; (4) the data of each resistance layer were rasterized, and the comprehensive resistance surface was obtained based on the weighted superposition method in the geographic information system (GIS), as shown in Figure 4; (5) the least cumulative resistance path between patches in the core area was calculated through the GIS cost path analysis tool, and the GI network corridors for 1998, 2008, and 2018 were constructed.

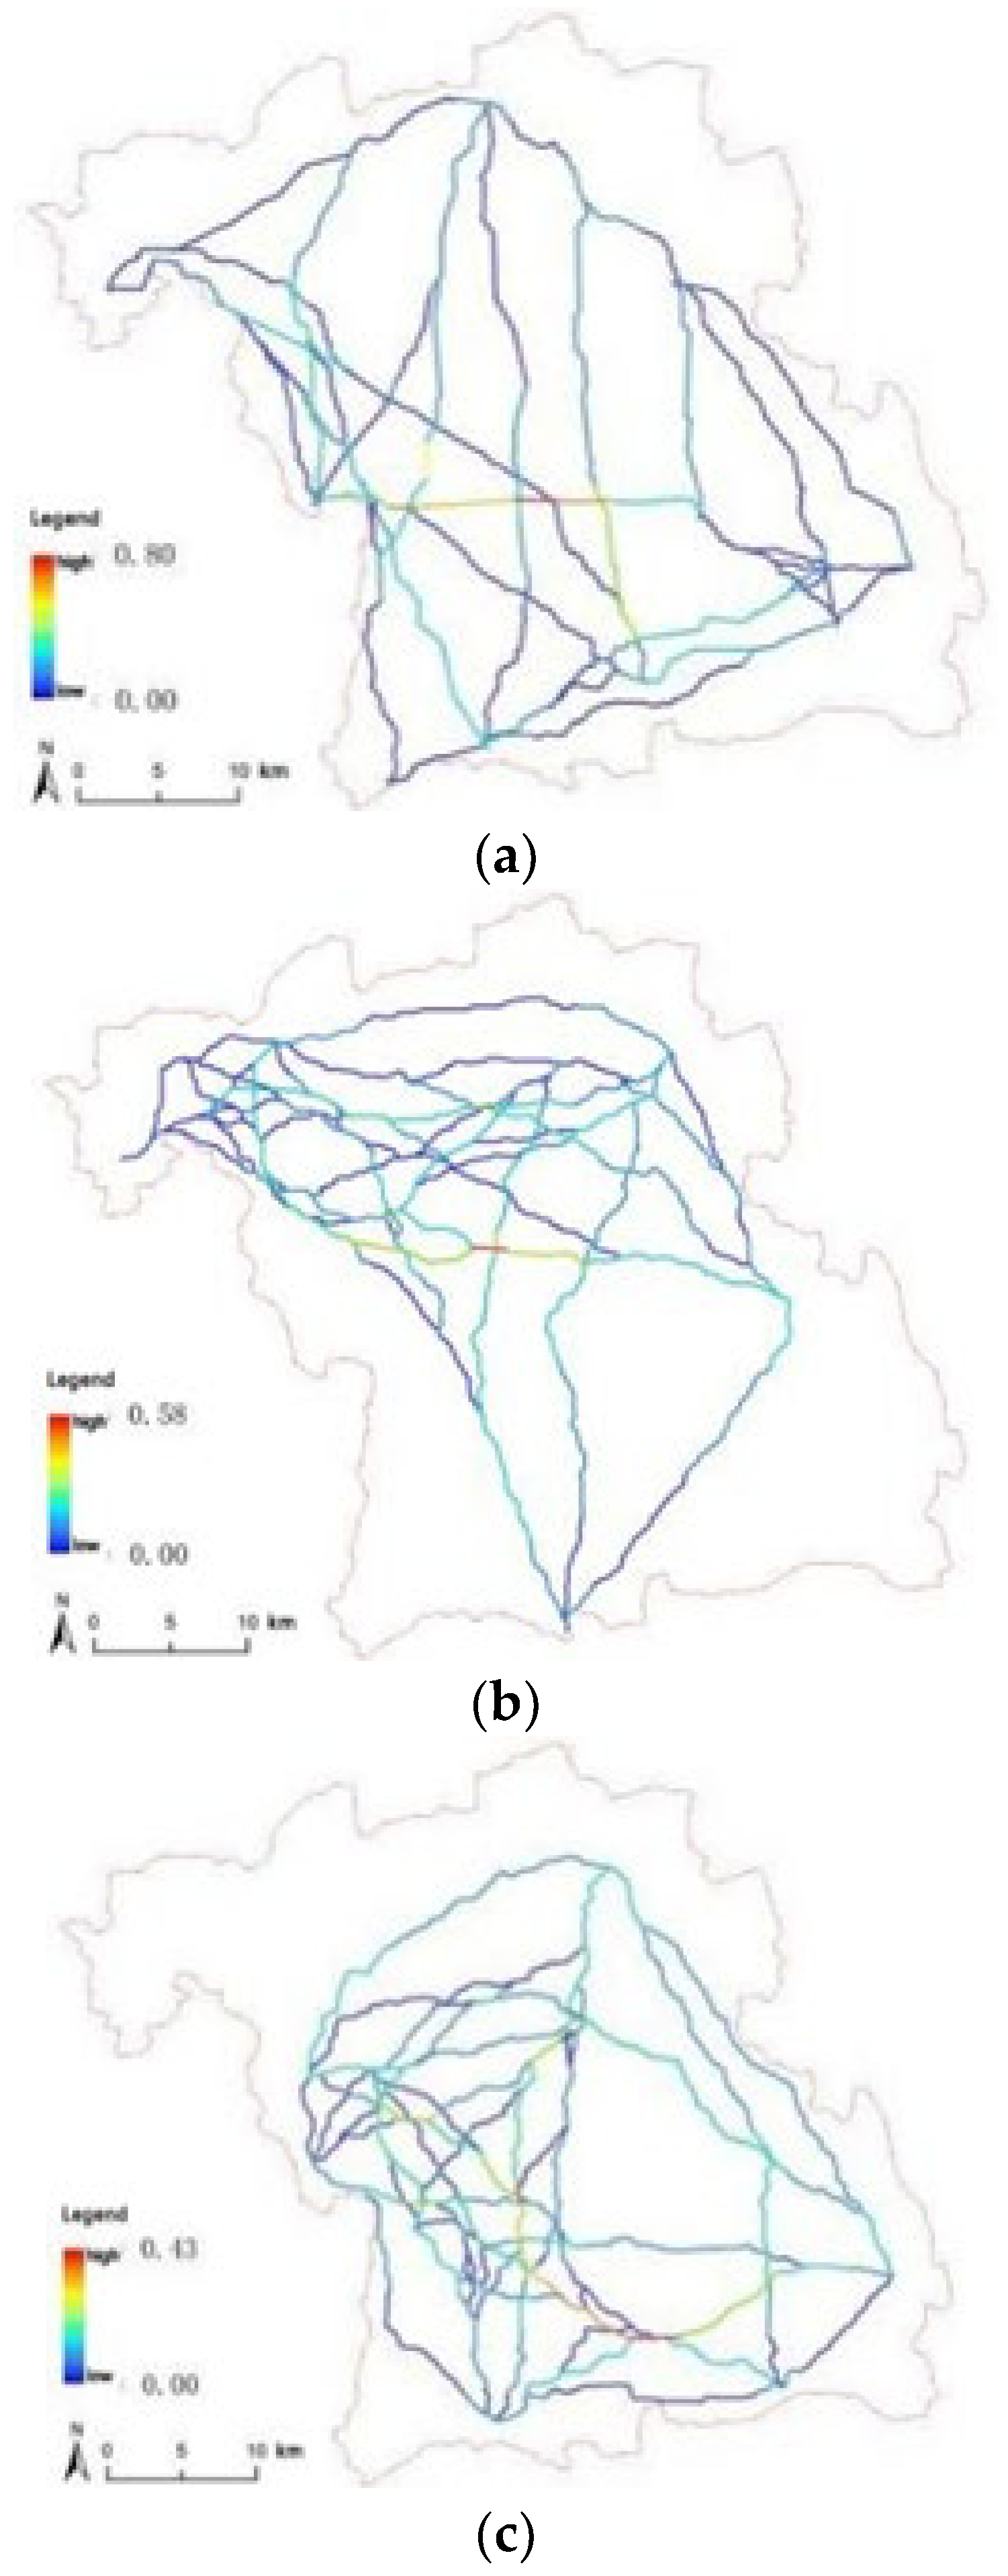
2.5. Syntax and Correlation Analysis of Core GI Corridor Space

The actual axis model can be drawn by inputting the Depthmap software in DXF format and following the minimum and longest principle and the corresponding field surveys [35]. Finally, the images and values of all spatial feature measurement indicators can be directly obtained after the relevant calculations of the Depthmap software [36]. This paper selects integration, choice, and connectivity as the index data to study the spatial accessibility, openness, and permeability of the core GI corridor and chooses the maximum and minimum values of the corresponding index data from the Depthmap software. Combined with the number of axes to calculate the average value of each index, the core GI corridor space syntactic measurement index table was obtained [37]. Correlation analysis was carried out on the SPSS software using the landscape connectivity and spatial syntax of all towns in the same period, and the data on related towns were put together for combined analysis (Figure 5 and Figure 6).

3. Result and Analysis

3.1. Plaque Functional Structure Composition Type

Through the cluster analysis, plaques over the years were divided into four types according to the ratio of area to DIIC: I, II, III, and IV. The area of type I plaques and DIIC was above 5.0, the ratio of two indicators of type II plaques was between 3.5 and 5.0, the ratio of type III was between 2.5 and 3.5, and the ratio of type IV was less than 2.5. A smaller ratio between the area and the DIIC means that the patch has a relatively higher contribution to the overall connectivity of the GI network in the county under the same area and has better coordination with the non-GI space.
The variation in the proportions of the four plaque types is as follows. In 1998, type I accounted for 60.0% of plaque structure, and type II accounted for 40.0%; in 2008, type I still accounted for 60.0%, type II accounted for 20.0%, type III for 13.3%, and type IV for 6.6%. Type I plaque structure disappeared in 2018, type II accounted for 23.8%, type III climbed to a significant value, reaching 61.9%, and type IV accounted for 14.3%. In 1998, No. 7 spots were represented, the structure of the corridor was relatively complicated, and there were many paths. In 2008, with ten ecological patches as the representative, the corridor structure was still complex, while in 2018, the corridor structure was simplified, with only 14 patches as the representative. This shows that, although the ecological patches in Suining County have become more fragmented in the past 20 years, the utilization rate of its GI network is higher than before, and the coordination with non-GI space is better. This further verifies that Suining County has developed extensively in recent years and gradually adopted a smart management planning model with improved effectiveness of ecological construction.

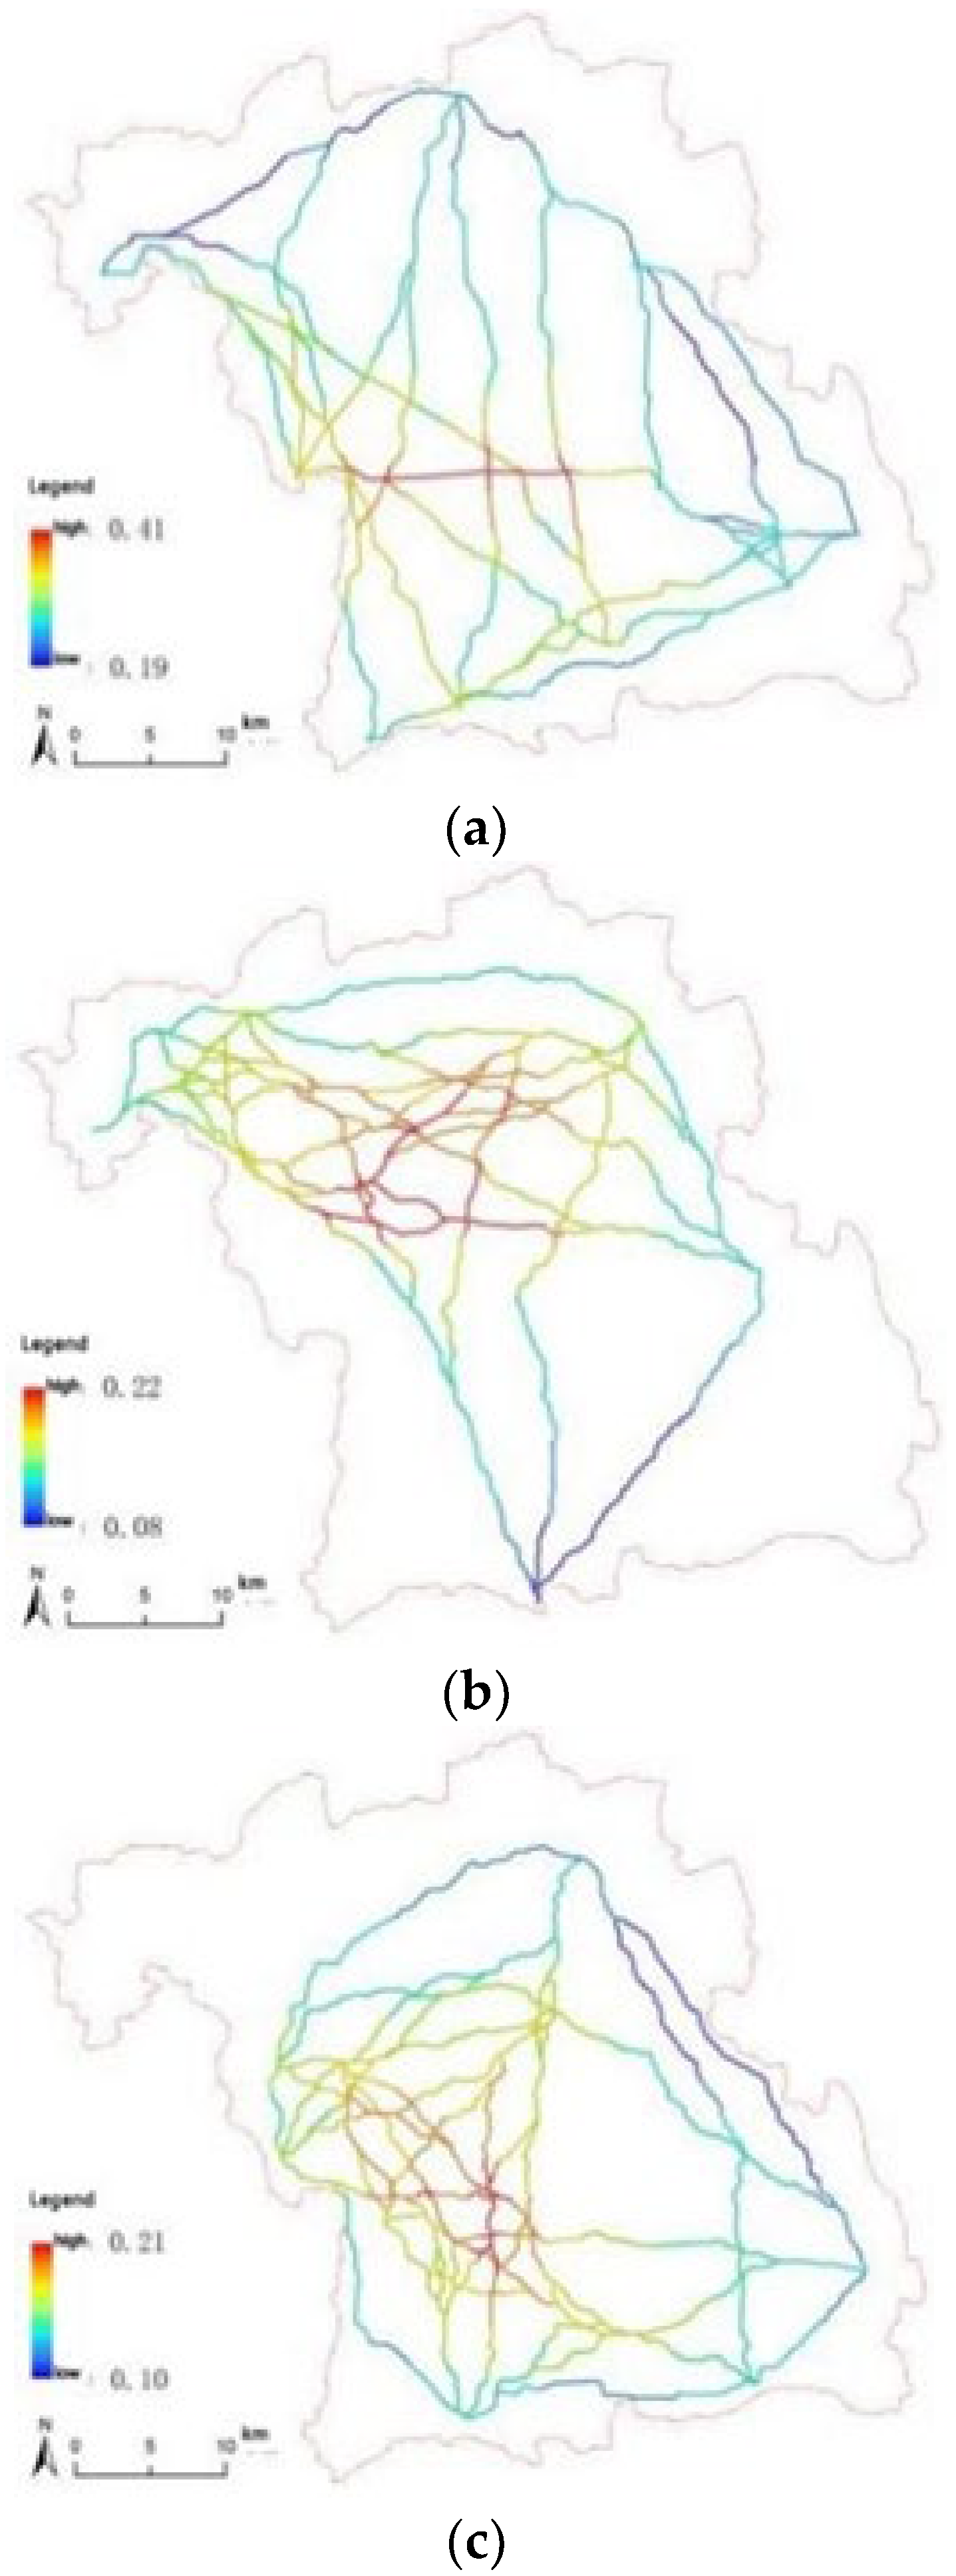
3.2. Plaque Spatial Structure Characteristics

From the perspective of the corridor structure, the corridors can be roughly divided into four categories, represented by the 2008-4 ecological corridor. The overall corridor has a central point and scatters outwards from the central point. The structure is relatively complex, but the central point often has higher value in choice and integration, and the overall structure has better connectivity. The one-line type is represented by the 2018-4 ecological corridor. The overall ecological corridor structure is relatively simple, with a single corridor facing one direction. This type of corridor is often used as a path, and its structural connectivity is more dependent on the location of the patch in the entire county. The water flow type is represented by the 1998-3 ecological corridor. The overall corridor is like a water system, with several channels facing the same direction. The overall structural connectivity of the mainline is better than that of the branch line. Finally, the polyline corridor is represented by the 1998-1 ecological corridor. There are fewer corridors of this type, and its shape is similar to the radial type, but there are fewer paths to choose from. Therefore, the location of the radiation point does not necessarily have high structural connectivity.

3.3. Relevance Analysis Results

From the results of the three-year SPSS comprehensive analysis in 1998, 2008, and 2018, it can be seen that the indicators with a significant correlation of 0.01 level are choice, integration, and average depth. Among them, the correlation between choice and integration reached −0.706, the correlation with the average depth reached 0.985, and the Pearson correlation index of integration and the average depth reached −0.71. The correlations were also significant in the three indicators of area, dIIC, and dPC, in which the correlation between area and dIIC reached 0.997, that between area and dPC reached 0.989, and that between dIIC and dPC reached 0.997 (as shown in Table 3).
By analyzing the correlation degree map, comprehensively considering the spatial syntax analysis map and data of the entire county, the results show that the connectivity between patches has no significant relationship with its spatial syntax index, but from the global integration degree of patches, the core patches responsible for the connectivity function of the GI network in these three years are patch 7 in 1998, patch 12 in 2008, and patch 15 in 2018. The index data of sex and location are superior to other plaques, indicating that the main factor affecting the function and structural connectivity of plaque is its location factor. (Figure 7 and Figure 8 and Table 4 and Table 5).

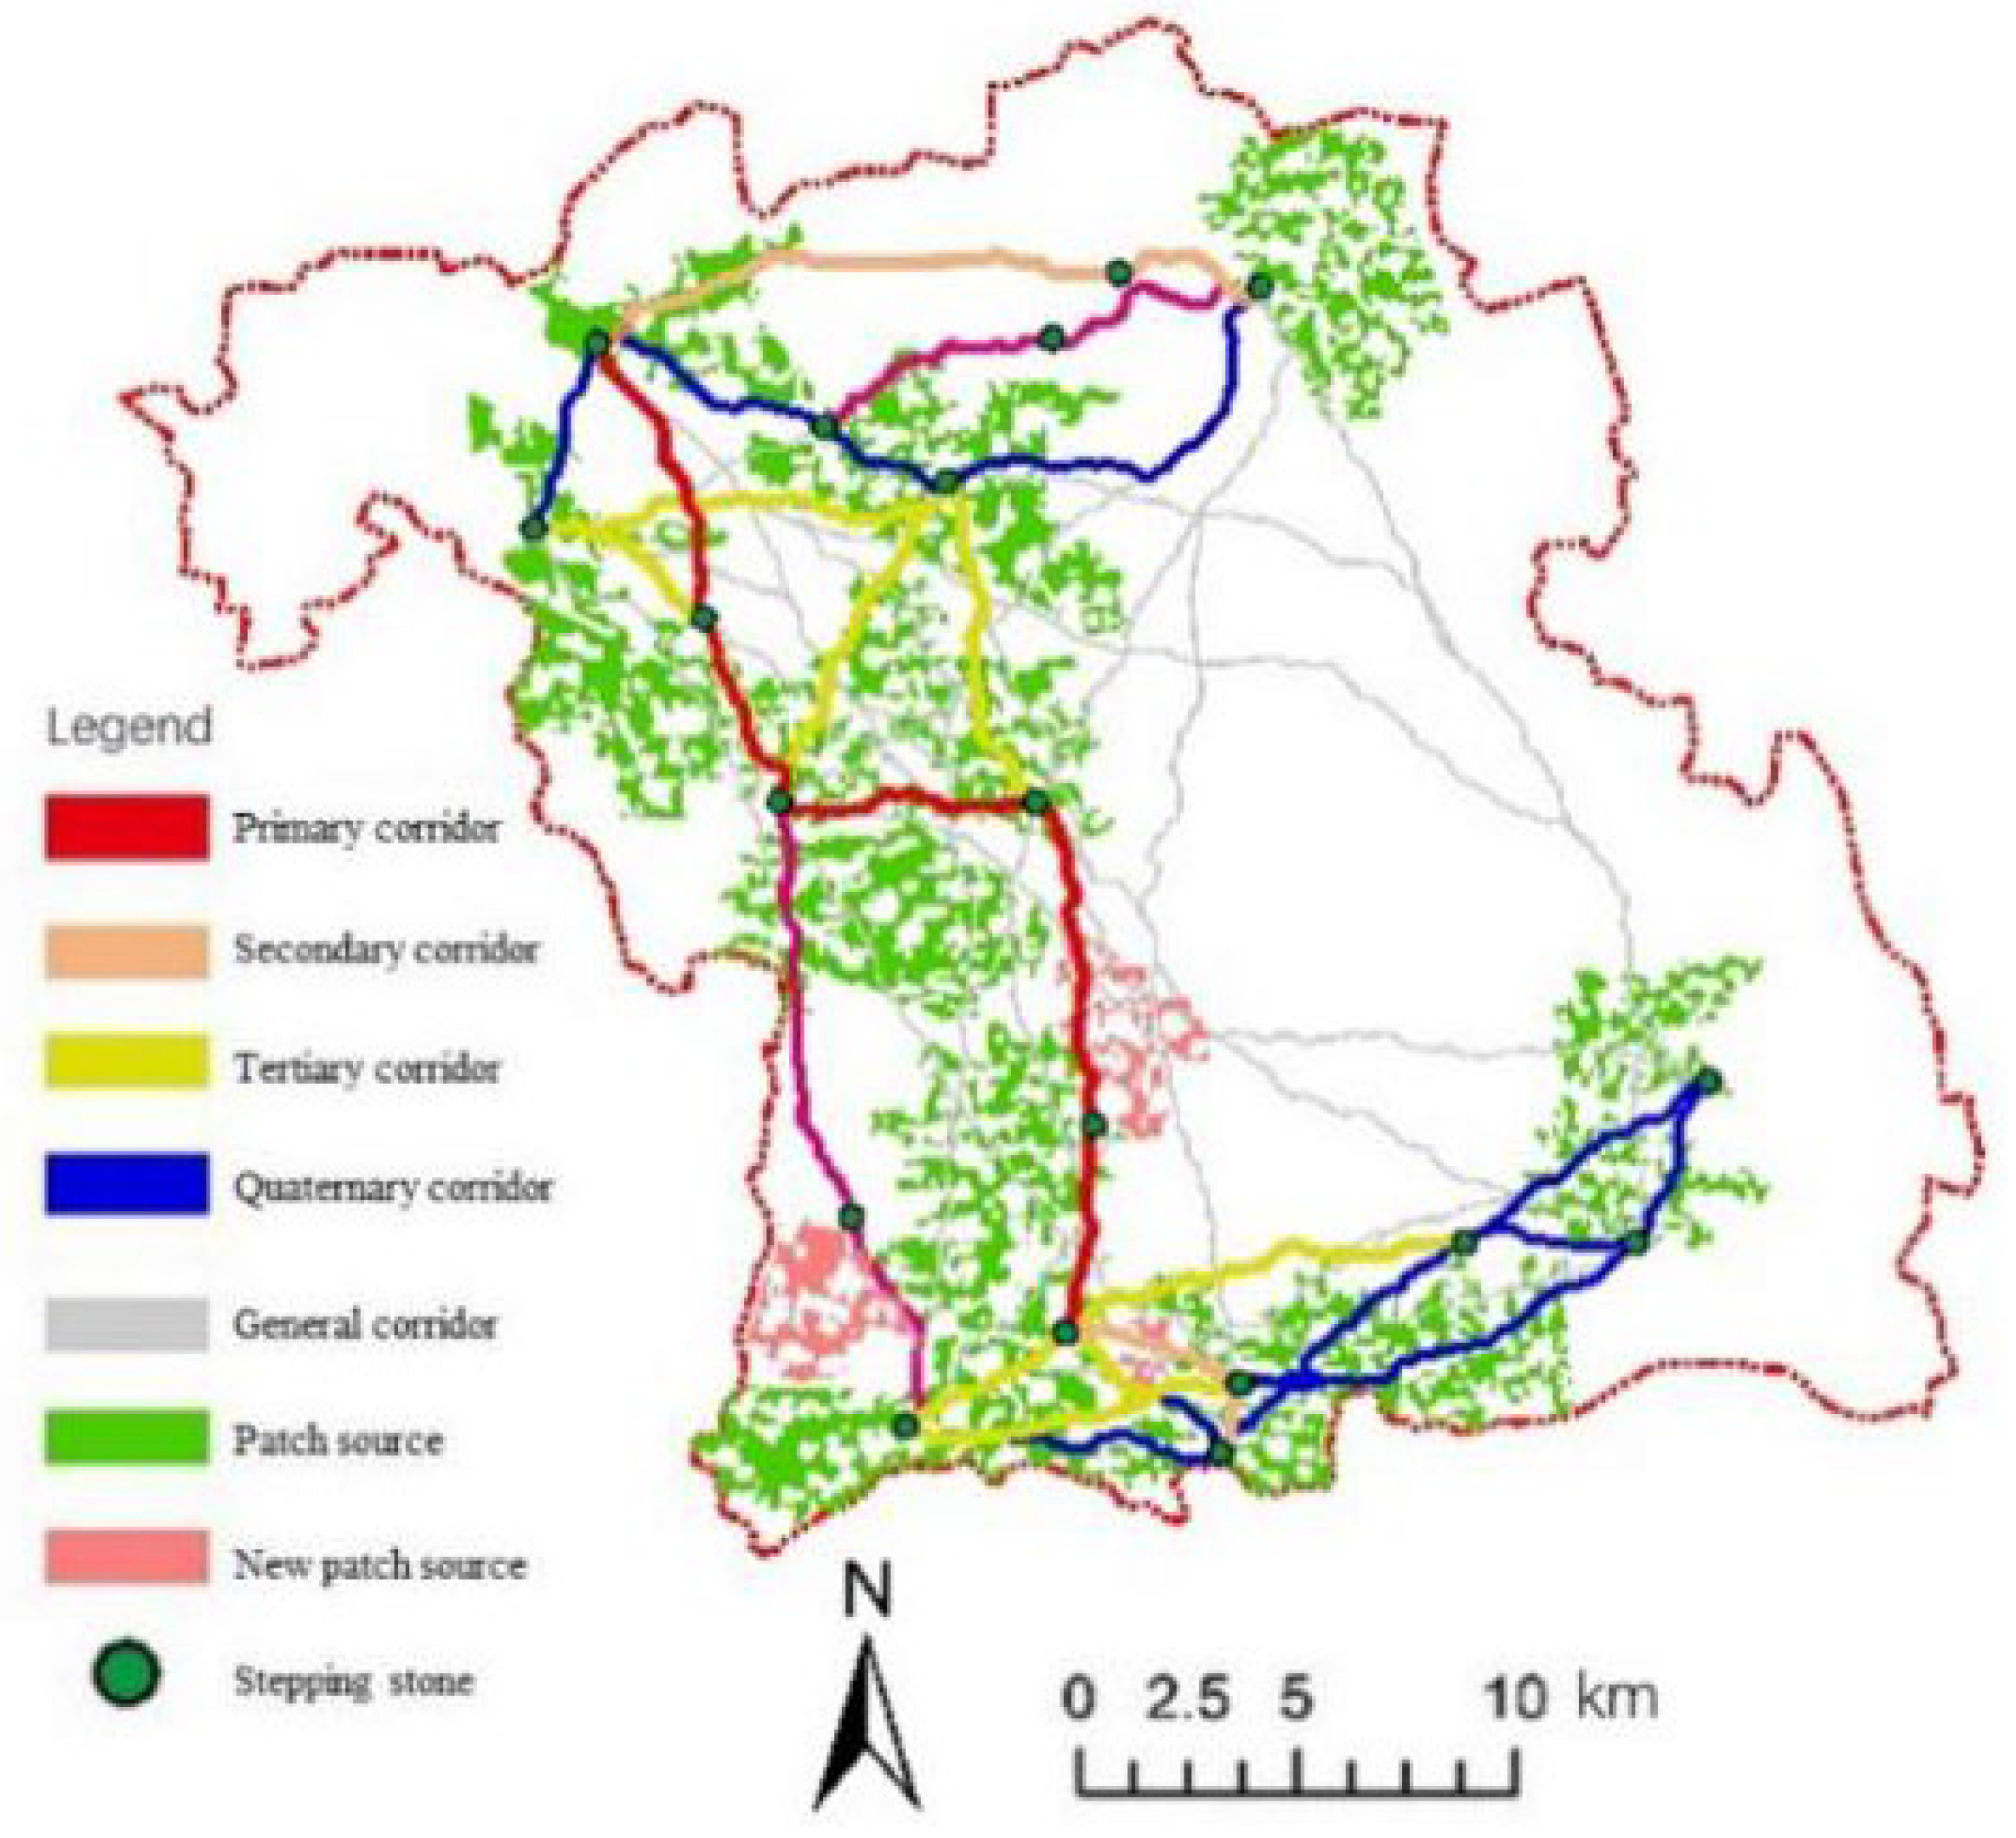
3.4. Optimization of the County GI Network

Based on the actual situation of the study area and the results of the GI network analysis, the optimization of the county GI network should be supplemented and improved in three ways: ecological source expansion, corridor improvement, and stepping-stone construction.

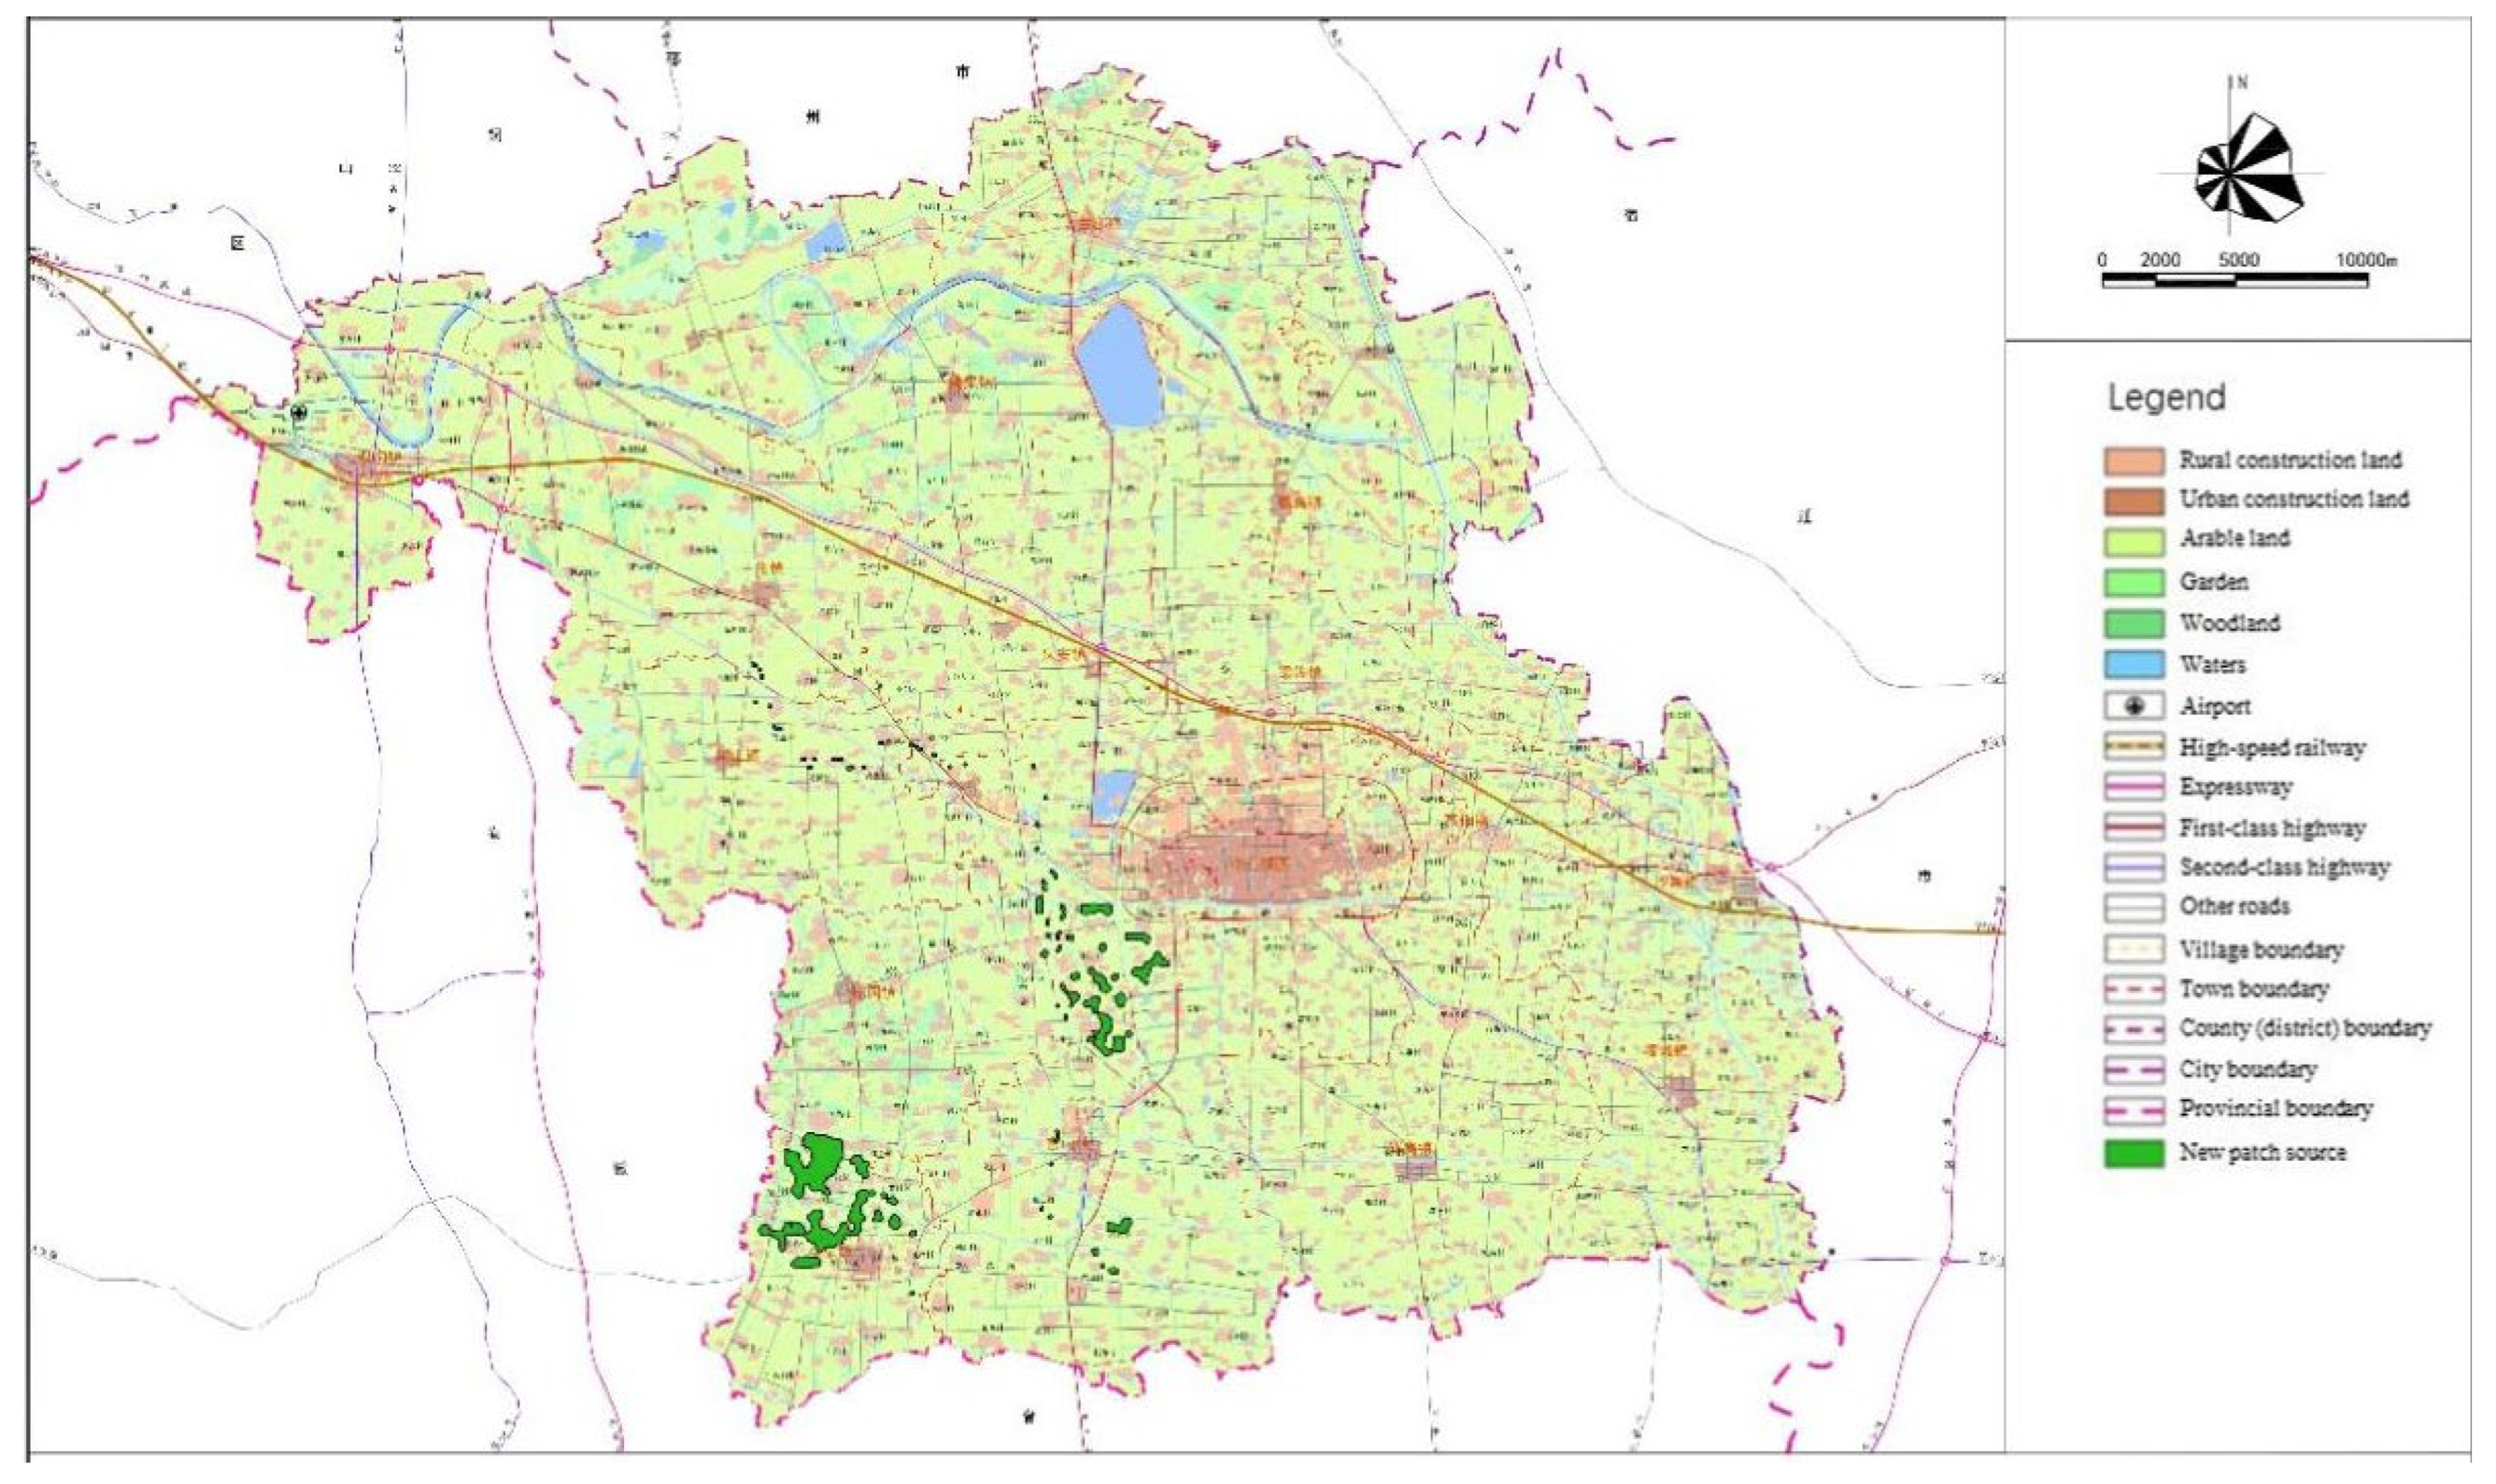
3.5. Ecological Source Expansion

Ecological sources offer major habitats for species and essential spaces for the flow of energy and materials [38,39,40]. The newly added patches in the study area were studied from fragmented landscape restoration, patch connectivity enhancement, and ecological benefits improvement. According to the distribution of patches and the results of gravity model analysis, patch 10 and patch 11 were in close proximity, and the interaction between the two patches was the highest. Yet, the size and connectivity were not significant, and the main vegetation type was arable land, making it challenging to generate ecological benefits. Therefore, the key points of ecological source expansion are as follows: (1) It is necessary to increase the ecological sources through soil and water conservation and afforestation and promote the integration of the two patches [38]. The specific measures may include the construction of ecological shelter forests, ecological landscape forests, soil and water conservation forests, urban oxygen source forests, urban healthcare forests, and forest habitats, through which ecological sources with stable structures, perfect functions, and pleasant ecological environments are constructed. (2) Relatively independent patches have long connectivity corridors with other patches and are susceptible to human interference, so new ecological sources need to be added between such patches to avoid corridor breakage and expand the area of ecological patches. This does not conflict with maintaining the original land types. (3) Specific methods of adding new ecological sources include increasing dense and closed forests, open forests, grasslands, public parks, etc. This can not only meet the multi-functional needs of water conservation, recreation, fitness, and landscape but also expand the area of ecological patches to prevent corridor breakage.

3.6. Enhancement of Corridor Maintenance

In this study, the important corridors were divided into four levels for priority protection, among which the primary corridors had strong accessibility and selectivity and were of great importance for the maintenance of ecological functions in Suining County, connecting the main patch sources in the study area. However, they were most vulnerable to human activities and needed extra protection by setting buffer zones and afforestation. The secondary and tertiary corridors in the north–south direction should be upgraded into primary corridors to enhance the north–south extension [39,40]. Meanwhile, the general corridors in the north–south direction in the eastern region should be upgraded into important corridors, with the original “C-shaped” layout (Figure 9) optimized to a “O” shape (Figure 10). The main points of enhancing the corridor maintenance include the following three aspects: (1) The green space of branch roads and secondary roads should be guided by the spatial planning of national territory to form the landscape boulevards. The protective green spaces on both sides of the roads should be uniformly designed to build a landscaped green belt. Native broad-leaved, economic, and fast-growing species should be selected; broad-leaved and coniferous species and evergreen and deciduous species should be combined with associated color-leaved species. (2) Considering that some of the corridors are too long and have low accessibility and selectivity, new important corridors need to be added for protection in accordance with the pilot ecological restoration of the areas in recent years. (3) Subject to the county space, green belts should be laid to meet the functional needs such as reducing exhaust pollution, denoising, etc. This measure can increase the accessibility of the patches, avoid the stagnation of the exchange of patches caused by the breakage of main corridors, and provide other functions such as beautification, recreation, and maintenance of species diversity.

3.7. Reinforcement of Stepping-Stones Construction

Corridors provide paths for species movement and material information exchange between patches, but corridors with excessive length are susceptible to external interference and not conducive to biological migration. Therefore, stepping stones need to be built to enhance the stability of corridors and provide a temporary habitat for species movement [41]. Corridor intersections are the key to the connectivity of the GI network. Although the islet is a small patch, it can provide a suitable habitat for biological migration after proper planning, which is of great significance for raising the connectivity of the landscape.
As non-essential units in the GI network, stepping stones can increase the connectivity of the landscape, provide habitats for edge species, small animals, and insects, contribute to species migration and dispersal between patches, and create discontinuous stepping-stone corridors in space [42]. Therefore, the installation of stepping stones at corridor intersections and in islets where the corridors pass can serve as nodes to improve the completeness of the GI network, promote the smoothness of corridors, increase the stability of the GI network, and provide support for the construction of ecological space in the future. Moreover, new stepping stones can greatly increase the number of patches, enhance the interconnectivity between the GI network, and improve the survival rate of species in the migration process. The corridors in the study area were mainly divided into two categories: the east–west corridor in the south and north and the north–south corridor in the west, among which there were fewer corridor intersections in the north and west, and patch sources were far away from each other [43,44]. Therefore, 23 stepping stones were set at the corridor intersections and in the islets, taking into account the actual situation of the study area (Figure 11).

4. Findings and Discussion

4.1. Results Analysis

This study has demonstrated that the combination of MSPA–MCR and space syntax methods can accurately identify the major ecological benefit of corridors with different capabilities. As a further optimization and valuable supplement to the results of gravity model analysis, the space syntax provided new ideas and methods for the overall planning of the GI network and had practical guiding significance for future overall GI network planning at the county scale and determined the GI corridor protection priorities. The following three conclusions can be drawn in this study: (1) Identifying spatial elements with MSPA and thereby analyzing the spatial distribution of the GI network can generate accurate landscape distribution with fewer data. Such a method is applicable to counties where it is difficult to obtain accurate information. (2) By constructing the GI network with the MCR model and analyzing the interaction force between patches with the gravity model, 22 important ecological corridors in Suining County were identified. The spatial distribution of the important corridors showed a “C” shape, i.e., the north–south connectivity in the west was high, and the east–west connectivity in the north and south was moderate, while north–south connectivity in the east was extremely weak, which needed to be strengthened and improved. (3) Three measures have been put forward, including ecological source expansion, enhancement of corridor maintenance, and construction of ecological stepping stones, to promote patch integration, enhance internal connectivity between various elements, enrich the diversity of regional biological species, and realize the sustainable development of green ecological benefits in Suining County. (4) The complexity of the GI network corridor structure in Suining County has further increased, and the overall service function of the internal structure of the corridor has further decreased. However, the decline has stabilized, indicating that the environmental protection policy of Suining County has a positive impact on maintaining the connectivity of the corridor structure.

4.2. Research Prospect

This study demonstrates that, in the MSPA-based GI network construction and connectivity evaluation research, space syntax can more accurately reveal the complex connectivity between paths in the GI network from the perspective of complex space-behavior interactions. This method offers new insights and methodologies for constructing GI networks, evaluating connectivity, and analyzing spatiotemporal pattern evolution. Nonetheless, the current method is based on the assumption that the overall terrain in the study area is flat, and the slope fluctuations are gentle, which means it is only suitable for the study of urban and rural GI networks in plains and other areas. Whether it is applicable to areas with other topographic and geomorphological features still remains unknown and needs further demonstration in future research. However, in the practice of green infrastructure construction, we found that blockchain technology and green information systems have a positive role in promoting sustainable supply chain practice [45]. It has positive and effective measures for regional development by using renewable energy, constructing efficient logistics and infrastructure, and creating a good ecological environment [45].
According to the requirements of the United Nations’ Sustainable Development Goals (SDGs), the world should focus on solving the development and coordination of the three social, economic, and environmental issues and move towards a sustainable development path [45]. Therefore, it is necessary to conduct research on green infrastructure in the county space that occupies the largest area of the country in order to reduce the impact on vulnerable areas in a targeted manner, further strengthen the construction of ecological corridors and ecological sources, and ultimately achieve the goal of sustainable human development.

Author Contributions

Conceptualization, F.W.; supervision, F.W. and X.J.; writing—original draft, F.W. and J.C.; investigation, J.C.; methodology, J.C.; software, S.T.; visualization, S.T. and X.Z.; funding acquisition, X.J.; project administration, X.J. All authors have read and agreed to the published version of the manuscript.

Funding

The research was funded by the National Key Research and Development Program of the 13th Five-Year Plan: Study on the development mode and technical path of village and town construction (No. 2018YFD1100200); 2019 Science and Technology Guidance Project of Housing and Urban-Rural Development of Jiangsu Province: Study on the Construction and Evaluation of Village and Town GI under the Guidance of Ecological Livability (No. 2019ZD001015).

Institutional Review Board Statement

It is not needed to require ethical approval.

Informed Consent Statement

Informed consent was obtained from all subjects involved in the study.

Data Availability Statement

The data used to support the findings of this study are included within the article.

Conflicts of Interest

The authors declare that they have no conflict of interest.

References

  1. Landscape Institute. Green Infrastructure: Connected and Multi-Functional Landscapes; Landscape Institute: London, UK, 2010. [Google Scholar]
  2. Yao, X.; Zhang, D. The study of “tunnel effect” of ecological poverty reduction. J. Ecol. Environ. 2018, 27, 389–396. [Google Scholar]
  3. Xie, Y.; Fan, H.; Wang, Q.; Luo, Y.; Wang, X. Morphological spatial analysis and landscape composition of green infrastructure in major cities of Sichuan Province. Chin. Gard. 2019, 35, 107–111. [Google Scholar]
  4. Khan, S.A.R.; Ponce, P.; Thomas, G.; Yu, Z.; Al-Ahmadi, M.S.; Tanveer, M. Digital Technologies, Circular Economy Practices and Environmental Policies in the Era of COVID-19. Sustainability 2021, 13, 12790. [Google Scholar] [CrossRef]
  5. Khan, S.A.R.; Ponce, P.; Yu, Z. Technological innovation and environmental taxes toward a carbon-free economy: An empirical study in the context of COP-21. J. Environ. Manag. 2021, 298, 113418. [Google Scholar] [CrossRef] [PubMed]
  6. Tischendorf, L.; Fahrig, L. On the usage and measurement of landscape connectivity. OIKOS 2000, 90, 7–19. [Google Scholar] [CrossRef] [Green Version]
  7. Liu, Y.; Yang, L.; Jiang, W. Coupling coordination and spatiotemporal dynamic evolution between social economy and water environmental quality—A case study from Nansi Lake catchment, China. Ecol. Indic. 2020, 119, 106870. [Google Scholar] [CrossRef]
  8. Zhang, Z.; Li, Y.; Wang, X.; Xu, Y.; Liao, Y.; Wan, Z.; Tang, N. Investigating the spatiotemporal dynamic evolution and driving factors of wastewater treatment efficiency in the context of China’s River Chief system. Ecol. Indic. 2021, 129, 107991. [Google Scholar] [CrossRef]
  9. Pennino, M.J.; McDonald, R.I.; Jaffe, P.R. Watershed-scale impacts of stormwater green infrastructure on hydrology, nutrient fluxes, and combined sewer overflows in the mid-Atlantic region. Sci. Total Environ. 2016, 565, 1044–1053. [Google Scholar] [CrossRef] [Green Version]
  10. Demuzere, M.; Orru, K.; Heidrich, O.; Geneletti, D.; Orru, H.; Bhave, A.G.; Mittal, N.; Feliu, E.; Faehnle, M. Mitigating and adapting to climate change: Multi-functional and multi-scale assessment of green urban infrastructure. J. Environ. Manag. 2014, 146, 107–115. [Google Scholar] [CrossRef]
  11. Skokanová, H.; Netopil, P.; Havlíček, M.; Šarapatka, B. The role of traditional agricultural landscape structures in changes to green infrastructure connectivity. Agric. Ecosyst. Environ. 2020, 302, 107071. [Google Scholar] [CrossRef]
  12. Szulczewska, B.; Giedych, R.; Maksymiuk, G. Can we face the challenge: How to implement a theoretical concept of green infrastructure into planning practice? Warsaw case study. Landsc. Res. 2016, 42, 176–194. [Google Scholar] [CrossRef]
  13. Jordán, F.; Báldi, A.; Orci, K.-M.; Rácz, I.; Varga, Z. Characterizing the importance of habitat patches and corridors in maintaining the landscape connectivity of a Pholidoptera transsylvanica (Orthoptera) metapopulation. Landsc. Ecol. 2003, 18, 83–92. [Google Scholar] [CrossRef]
  14. Li, K.; Li, C.; Cao, J.; One, P.; Liu, M.; Lu, J.; Hao, Z. Spatial-temporal pattern evolution of green infrastructure in central Liaoning urban agglomeration in 20 years based on landscape ecology. J. Ecol. 2021, 41, 8408–8420. [Google Scholar]
  15. Lin, H.; Qian, J.; Yan, L.; Huang, S. Spatial-temporal pattern change and scenario simulation of green in-frastructure in Wuyi County based on morphological spatial pattern analysis and CA-Markov model. J. Zhejiang Agric. 2019, 31, 1193–1204. [Google Scholar]
  16. Pascual-Hortal, L.; Saura, S. Comparison and development of new graph-based landscape connectivity indices: Towards the priorization of habitat patches and corridors for conservation. Landsc. Ecol. 2006, 21, 959–967. [Google Scholar] [CrossRef]
  17. Qiu, B.; Qi, W.; Chen, C.; Li, W. Relationship between spatial heterogeneity and wavelength in multisensor airborne images. Geo-Spat. Inf. Sci. 2015, 18, 56–64. [Google Scholar] [CrossRef] [Green Version]
  18. Calderón-Contreras, R.; Quiroz-Rosas, L.E. Analysing scale, quality and diversity of green infrastructure and the provision of Urban Ecosystem Services: A case from Mexico City. Ecosyst. Serv. 2017, 23, 127–137. [Google Scholar] [CrossRef]
  19. Fňukalová, E.; Zýka, V.; Romportl, D. The Network of Green Infrastructure Based on Ecosystem Services Supply in Central Europe. Land 2021, 10, 592. [Google Scholar] [CrossRef]
  20. He, K.; Yu, K.; Gao, Y.; Liu, J. Construction of Fuzhou green infrastructure network based on MSPA. Chin. Gard. 2019, 35, 70–75. [Google Scholar]
  21. Hu, T.; Chang, J.; Syrbe, R.-U. Green Infrastructure Planning in Germany: The Background, Spatial Framework and Implementations. Int. Urban Plan. 2021, 36, 109–119. [Google Scholar]
  22. Li, Y. Theory and practice of ecological restoration of urban rivers from the perspective of green infrastructure—A case study of Seattle. Urban Plan. Int. 2018, 33, 41–47. [Google Scholar] [CrossRef]
  23. Suškevičs, M. Legitimate planning processes or informed decisions? Exploring public officials’ rationales for participation in regional green infrastructure planning in Estonia. Environ. Policy Gov. 2019, 29, 132–143. [Google Scholar] [CrossRef]
  24. Rosot, M.A.D.; Maran, J.C.; da Luz, N.B.; Garrastazú, M.C.; de Oliveira, Y.M.M.; Franciscon, L.; Clerici, N.; Vogt, P.; de Freitas, J.V. Riparian forest corridors: A prioritization analysis to the Landscape Sample Units of the Brazilian National Forest Inventory. Ecol. Indic. 2018, 93, 501–511. [Google Scholar] [CrossRef]
  25. Shi, X.; Qin, M. Research on the Optimization of Regional Green Infrastructure Network. Sustainability 2018, 10, 4649. [Google Scholar] [CrossRef] [Green Version]
  26. Hillier, B. Space is the Machine: A Configurational Theory of Architecture; Cambridge University Press: Cambridge, UK, 1999. [Google Scholar]
  27. Yu, Y.; Yin, H.; Kong, F.; Wang, J.; Xu, W. Spatial and temporal change analysis of Nanjing green infrastructure network pattern based on MSPA. J. Ecol. 2016, 35, 1608–1616. [Google Scholar]
  28. Wu, Y.; Wang, Q.; Luo, Y. Research on the characteristics of Chengdu green infrastructure network structure based on MSPA. J. Northwest For. Univ. 2017, 32, 260–265. [Google Scholar]
  29. Mell, I.C.; Henneberry, J.; Hehl-Lange, S.; Keskin, B. To green or not to green: Establishing the economic value of green infrastructure investments in The Wicker, Sheffield. Urban For. Urban Green. 2016, 18, 257–267. [Google Scholar] [CrossRef]
  30. Zhang, J.; Zhu, H.; Zhang, P.; Song, Y.; Zhang, Y.; Li, Y.; Rong, T.; Liu, Z.; Yang, D.; Lou, Y. Construction and optimization of Jiangsu Province ecological network based on MSPA and MCR models. Ecol. Sci. 2019, 38, 138–145. [Google Scholar]
  31. Bowman, J.T. Connecting National Wildlife Refuges with Green Infrastructure: The Sherburne Crane Meadows Complex; University of Minnesota: St. Paul, MN, USA, 2008. [Google Scholar]
  32. Wei, J.; Yi, S.; Wang, Y.; Xiang, W. Construction of green infrastructure network in rapidly urbanizing areas based on spatial priority—Taking Pukou District of Nanjing as an example. J. Ecol. 2019, 39, 1178–1188. [Google Scholar]
  33. Wu, Z.; Tian, F. The analysis of urban recreational space morphology based on space syntax—Taking the main urban area of Nanchang as an example. Econ. Geogr. 2012, 32, 156–161. [Google Scholar]
  34. Zhu, Q.; Yu, K.; Li, D. The width of ecological corridor in landscape planning. Acta Ecol. Sin. 2005, 25, 2406–2412. [Google Scholar]
  35. Wang, Y.; Li, J.; Gu, K.; Lin, L. Optimization of urban green infrastructure network layout based on MSPA-CIRCUIT: Case of Hefei. J. Ecol. 2022, 42, 2022–2032. [Google Scholar]
  36. Huang, N.; Shi, T.; Shi, Y.; Li, C.; Hu, Y. Research progress on ecological and social function of green infrastructure. Acta Ecol. Sin. 2021, 41, 7946–7954. [Google Scholar] [CrossRef]
  37. Song, Q.; Feng, W. Green infrastructure construction drives urban renewal. Mod. Urban Stud. 2021, 10, 58–62. [Google Scholar]
  38. Karanikola, P.; Panagopoulos, T.; Tampakis, S.; Karipidou-Kanari, A. A perceptual study of users’ expectations of urban green infrastructure in Kalamaria, municipality of Greece. Manag. Environ. Qual. Int. J. 2016, 27, 568–584. [Google Scholar] [CrossRef]
  39. Liu, W.; Holst, J.; Yu, Z. Thresholds of landscape change: A new tool to manage green infrastructure and social–economic development. Landsc. Ecol. 2014, 29, 729–743. [Google Scholar] [CrossRef]
  40. Weber, T.; Sloan, A.; Wolf, J. Maryland’s Green Infrastructure Assessment: Development of a comprehensive approach to land conservation. Landsc. Urban Plan. 2006, 77, 94–110. [Google Scholar] [CrossRef]
  41. Zhou, Q.; Shi, W.; Guo, Q. Influence mechanism of urban environment and green infrastructure construction on high-quality development of urban economy. J. Ecol. 2021, 41, 8820–8832. [Google Scholar]
  42. Liu, W.; Zhou, Z.; Lang, R. The relationship between supply and demand of urban green infrastructure ecosystem services and spatial optimization-taking Xi’an as an example. Arid. Area Geogr. 2021, 44, 1500–1513. [Google Scholar]
  43. Khan, S.A.R.; Godil, D.I.; Jabbour, C.J.C.; Shujaat, S.; Razzaq, A.; Yu, Z. Green data analytics, blockchain technology for sustainable development, and sustainable supply chain practices: Evidence from small and medium enterprises. Ann. Oper. Res. 2021, 10, 1–25. [Google Scholar] [CrossRef]
  44. Khan, S.A.R.; Godil, D.I.; Yu, Z.; Abbas, F.; Shamim, M.A. Adoption of renewable energy sources, low-carbon initiatives, and advanced logistical infrastructure—A step toward integrated global progress. Sustain. Dev. 2021, 30, 275–288. [Google Scholar] [CrossRef]
  45. Zhang, Z.; Liu, Y.; Li, Y.; Wang, X.; Li, H.; Yang, H.; Ding, W.; Liao, Y.; Tang, N.; He, F. Lake ecosystem health assessment using a novel hybrid decision-making framework in the Nam Co, Qinghai-Tibet Plateau. Sci. Total Environ. 2021, 808, 152087. [Google Scholar] [CrossRef] [PubMed]
Figure 1. Schematic diagram of the connectivity rules of structural elements under the penetration theory (a) Eight-way Neighborhood Structure (b) Eight-way Neighborhood Structure. Mell, I.C., Henneberry, J., Hehl-Lange, S., et al. 2016. [31].
Sustainability 14 07732 g001
Figure 2. Effect of edge width on image element classification. Mell, I.C., Henneberry, J., Hehl-Lange, S., et al. 2016. [32].
Sustainability 14 07732 g002
Figure 3. Current land use of Suining County.
Sustainability 14 07732 g003
Figure 4. Technology roadmap.
Sustainability 14 07732 g004
Figure 5. Choice analysis diagram of 46 plaques.
Sustainability 14 07732 g005
Figure 6. Integration analysis diagram of 46 plaques.
Sustainability 14 07732 g006
Figure 7. Change in normalized choice of GI corridor from 1998 to 2018, (a) 1998 (b) 2008 (c) 2018.
Sustainability 14 07732 g007
Figure 8. Change in GI corridor normalized integration from 1998 to 2018, (a) 1998 (b) 2008 (c) 2018.
Sustainability 14 07732 g008
Figure 9. GI network status diagram.
Sustainability 14 07732 g009
Figure 10. GI network optimization diagram.
Sustainability 14 07732 g010
Figure 11. Location of new patch sources in the land use map.
Sustainability 14 07732 g011
Table 1. A Review of the traditional ecological source optimized methods by MSPA.
MethodContent
Barbara et al. [12]Conduct GI resistance model analysisSpatial analysis of GI in different areas
F. Jordán et al. [13]Adopt an approach for building ecological corridor connectivity
Li Kongming et al. [14]Conduct MSPA
Lin Hongyu et al. [15]
Lucía Pascual-Hortal et al. [16]Build a new index
Bingwen Qiu et al. [17]Apply variogram modelingInvestigation of the relation between spatial heterogeneity and spectral wavelength for objects
Demuzere M et al. [10]Carry out statistical analysisSignificance of GI
Rafael Calderón-Contreras et al. [18]Utilize remote sensing technology and the normalized difference vegetation index (NDVI) combined with fieldwork verification
Fňukalová Eliška et al. [19]Conduct analysis of ecological corridor maintenance capacity Identification of GI networks in different areas
Huang He et al. [20]Analyze GI pattern based on the MSPA method
Hu Tinghao et al. [21]Use literature analysis and case analysis methodsAn overview of the concept of GI
Liya [22]Conduct case analysis
Hana Skokanová et al. [23]Conduct MSPA and equivalent connected area (ECA) calculationSpatial variation characteristics of GI in different historical periods
Michael J et al. [24]Quantify the role of Stormwater GIQuantification of the cumulative effects of multiple SGI projects
Monika Suškevičs et al. [25]Conduct case analysisRole of public participation in the advancement of GI projects
Table 2. Weight and resistance of each factor layer.
Resistance LayersWeight
Allocation
Impact FactorsResistance
MSPA elements0.35Core5
Bridge10
Islet20
Loop30
Branch40
Perforation60
Edge70
Background100
Land use types0.25Woodland10
Arable land30
Bare land40
Waters70
Construction land100
Elevation0.17h ≤ 0 m5
0 m ≤ h ≤ 20 m15
20 m ≤ h ≤ 40m30
40 m ≤ h ≤ 200 m45
200 m < h100
Slope0.23i ≤ 8°1
8°≤ i ≤ 15°20
15°≤ i ≤ 25°60
25 ≤ i ≤ 35°80
35° ≤ i100
Table 3. Correlation analysis table.
ChoiceIntegration [HH]Mean DepthAreadIICdPC
ChoicePearson correlation1−0.706 **0.985 **−0.141−0.151−0.157
Sig. (Double tail) 0.0030.0000.6170.5910.576
Number of cases151515151515
Integration [HH]Pearson correlation−0.706 **1−0.710 **−0.0150.0080.009
Sig. (Double tail)0.003 0.0030.9570.9770.975
Number of cases151515151515
Mean DepthPearson correlation0.985 **−0.710 **1−0.129−0.135−0.138
Sig. (Double tail)0.0000.003 0.6460.6320.623
Number of cases151515151515
AreaPearson correlation−0.141−0.015−0.12910.997 **0.989 **
Sig. (Double tail)0.6170.9570.646 0.0000.000
Number of cases151515151515
dIICPearson correlation−0.1510.008−0.1350.997 **10.997 **
Sig. (Double tail)0.5910.9770.6320.000 0.000
Number of cases151515151515
dPCPearson correlation−0.1570.009−0.1380.989 **0.997 **1
Sig. (Double tail)0.5760.9750.6230.0000.000
Number of cases151515151515
** At the 0.01 level (double tail), the correlation is significant.
Table 4. Normalized choice statistics table of GI corridor from 1998 to 2018.
Normalized ChoiceMaximum ValueMinimum ValueAverage Value
199819980.80360.0013
200820080.58170.0011
201820180.43330.0014
Table 5. Global integration statistics table of GI corridor from 1998 to 2018.
Global IntegrationMaximum ValueMinimum ValueAverage Value
19980.41180.19020.2774
20080.22350.08320.1647
20180.20530.09780.1543
Publisher’s Note: MDPI stays neutral with regard to jurisdictional claims in published maps and institutional affiliations.

