Abstract
Wearable technology is a self-contained computer system that can record muscular activity data. Wearable technologies are rapidly evolving that have the potential to enhance the well-being of healthier lives. However, wearable technologies are finding slow adoption rates relative to mainstream technologies such as smartphones. Consequently, both designers and manufacturers are increasingly interested in key decision factors that influence the acceptance of these technologies. As discussions relating to wearable technologies are often approached from different perspectives, a general framework featuring not only a synthesis of general acceptance issues but also with consideration of contingent factors would be a useful research undertaking. Furthermore, wearable technology acceptance studies are insufficient to supplement practical implementation and promotion issues. In this regard, methods for further analysis of results from structural equation modeling (SEM), such as importance-performance map analysis (IPMA) and VIKOR for multi-criteria optimization and compromise solution, can be used to derive greater insights. The primary research findings are extensively discussed, and practical promotion strategies for wearable technologies for health care are suggested.
1. Introduction
Wearable technology (also called a wearable symbiotic device or system) is a self-contained computer system that delivers a range of functions. Users who wear or carry a wearable technology can access information at any time and in any setting [1,2]. In contrast with portable devices, regardless of the direction and activity of the body, the wearable technology remains in place, does not need to be removed for use, and can be carried with negligible physical exertion [3]. Due to these features, wearable technologies are ideal for symbiotic systems that can record, interpret, and respond appropriately to the physical states of their users. In particular, wearable technologies can record physiological data, such as breathing rate, heart rate, and visual, muscular, cerebral, or electrodermal inputs [4,5,6,7].
Wearable technologies have become rapidly evolving that have the potential to enhance the well-being of people and businesses. However, these technologies are relatively slow in gaining acceptance compared to mainstream technologies such as smartphones. Consequently, there exists a growing interest in decision factors influencing the acceptance of these technologies by both designers and manufacturers. Since the human-computer interface of wearable technologies is quite different from that of traditional information systems, wearable technologies’ specific attributes, such as perceived comfort and privacy, merit particular examination. Some studies have confirmed important factors regarding these relatively new information systems. For example, Kim and Shin [8] stressed effective quality and subcultural appeal related-use experience; Jeong, Kim, and Park [9] emphasized domain-specific innovativeness; Hsiao and Chen [10] examined concerns about hardware, software, appearance, and perceived value; and Gao et al. [11] highlighted perceived benefits and perceived health threats. As discussions related to wearable technologies are often approached from different perspectives, a general framework featuring not only a synthesis of general acceptance issues but also with consideration of contingent factors would fill an existing gap.
Furthermore, a study of wearable technology acceptance is insufficient to supplement practical implementation and promotion issues. In this regard, methods for analysis of results from structural equation modeling (SEM), such as importance-performance map analysis (IPMA) and VlseKriterijumska Optimizacija I Kompromisno Resenje (VIKOR) from the field of multi-criteria decision-making (MCDM) can be applied to yield more meaningful insights. This task is the motivational basis for the present study.
The Xiaomi Mi Band (referred to as Mi Band hereafter) is a wearable fitness tracking bracelet Xiaomi Tech has produced since 2014. Users can wear the Mi Band on their wrists, employ the official Mi Band app, and track the band’s location. The tracker is a rigid device measuring approximately 9 mm in thickness and 36 mm in length that is deployed within a hypoallergenic, anti-UV, and antimicrobial TPSiV wristband. The tracker must periodically be inserted into its charger module and charged with an external 5.0 V electricity source. Xiaomi was the world’s first-largest wearable device maker in 2018, capturing 21.5% of the global market share. The popularity of the Mi Band is the reason it serves as an example of wearable technology for this study.
The primary objectives of this study were as follows: first, to confirm the critical factors determining user attitudes to wearable technologies; second, to examine the crucial antecedents that motivate users to accept wearable technologies; third, to leverage data analysis techniques to derive insights from SEM results; and last, to elucidate practical promotion strategies for wearable technologies.
2. Theoretical Background
2.1. Technology Acceptance Related Theories
2.1.1. Technology Acceptance Model and Its Extensions
Scholars have discussed and confirmed various factors that motivate users to accept information systems. For example, Davis [12] published a Technology Acceptance Model (TAM), which expresses the relationship between perceived ease of use, perceived usefulness, and characteristics of a system (which are considered external variables) along with the acceptance of information systems. Venkatesh and Davis [13] extended the TAM with subjective norms and proposed the TAM2, which they tested in longitudinal studies.
Venkatesh et al. [14] went on to publish their United Theory of Acceptance and Use of Technology (UTAUT), which integrates elements proposed in eight prominent user-acceptance-related models. In UTAUT, the behavior patterns of technology users depend on their behavioral intention; furthermore, behavioral intention depends on performance expectancy, effort expectancy, social influence, and facilitating conditions. Since all technology acceptance-related theories were developed within a corporate context, they may not appropriately explain an individual consumer’s acceptance of a particular Information Technology (IT). To address this weak point, Venkatesh et al. [15] introduced three constructs in UTAUT2 as price value, hedonic motivation, and habit.
2.1.2. Theory of Planned Behavior
Ajzen [16] propounded the Theory of Planned Behavior (TPB) to explain general individual behavior. Behavioral intention is determined by an individual’s attitude toward the behavior, subjective norms (or social influence), and perceived behavioral control (or facilitating conditions). Attitude toward behavior indicates some individual’s positive or negative emotions relating to a specific behavior. In this theory, subjective norms represent an individual’s perception that “important people” think that an individual ought to enact a specific type of behavior. Finally, facilitating conditions refer to the degree to which a system’s users believe that certain factors can support system deployment [14].
The TPB is based on social psychology and has been applied in a variety of settings, such as health care, technology, and politics; in addition, it provides a satisfactory prediction for personal acceptance-related behavior [12]. Since IT can be considered a type of innovation, Innovation Diffusion Theory (IDT) [17] can also be applied to technology acceptance.
2.2. Innovation Diffusion Theory
IDT describes the process of distributing innovation over time through certain channels in a particular social system [17]. Two major research streams exist within IDT: one focuses on the innovation diffusion process, the other on the attributes of the innovations. Regarding attributes, the spread of information technology innovation is often affected by relative advantage, complexity, compatibility, observability, and trialability [18,19].
Within the context of IT innovation, relative advantage expresses the extent to which an innovative system is considered superior to existing systems. Compatibility refers to the extent to which an IT innovation coexists with potential adopters’ previous values, needs, and experiences. Complexity is defined as the difficulty in usage that the innovative system would possess. Observability refers to how easy it is to observe the results or output of the innovation. Trialability is the degree to which testing and experience of innovation are possible on a small scale before adoption. According to a previously published literature review on new product adoption [20], the three innovation attributes that are outlined in Rogers’ framework have a particularly strong influence on the early stages of an acceptance decision process: complexity, relative advantage, and compatibility.
According to Robertson [21], innovations arise from an agglomeration of antecedents; some antecedents are ideas that have been propagated for some time. Similarly, Usher [22] writes that major inventions include both individual novel items and many familiar elements. Consequently, the presence of components of innovation that are familiar facilitates the adoption process. Littrell and Millar [23] further stress that familiarity is essential to Rogers’ elements of compatibility, relative advantage, and observability. Familiarity enables a comparison of an innovative product with an established product. A system with a complexity attribute often requires extra learning or action from users because of their unfamiliarity with the development.
In addition to Rogers’ related innovation attributes and familiarity, novelty is introduced to represent the degree of inconsistency of a product with the current alternatives [24] and reflect the uncertainty surrounding the adoption outcome [25]. Ordaining et al. [26] propose that novelty induces heightened risk awareness in potential adopters.
2.3. Attributes Specific to Wearable Devices
In addition to the dimensions mentioned above that are generally relevant to user acceptance of wearable technologies, Spagnolli et al. [3] claim that two other aspects should be considered. First, the physical factors of the device, such as weight, size, and textural qualities, all have the potential to influence perceived comfort. In addition, wearing devices in public might be considered strange or improper; thus, adopters may feel uncomfortable. Second, because wearable devices collect sensitive personal information, a perceived lack of privacy could arouse concerns; users may fear that their data could be abused, misused, or misconstrued [27,28].
2.4. Consumer Adoption of Wearabletechnologies
An extensive literature review of wearable technology adoption reveals that the majority of researchers have adopted the TAM framework for their analysis (e.g., [8,29,30,31,32,33,34,35,36,37,38]). However, according to Ayeh et al. [39] and tom Dieck and Jung [40], adding appropriate context-specific external variables may make the TAM framework applicable in a broader range of technological contexts, and at the same time enhance the explanatory power of the model. Among the external variables added, researchers may include perceived enjoyment, perceived aesthetics, and perceived comfort.
For extensions to TAM, some researchers have applied the UTAUT to yield deeper insights regarding the factors influencing consumer adoption of wearable devices. For instance, Wu et al. [41] integrated the UTAUT with IDT and TAM to explore consumer acceptance of smartwatches. Similarly, van Heek et al. [42] combined the UTAUT and TAM to investigate consumer preferences for smart textiles. The UTAUT2 model has also been applied to cover the acceptance of wearable devices. For example, Gao et al. [11] combined the UTAUT2 model with protection motivation theory and privacy calculus theory to explore the governing factors of consumer wearable devices in the healthcare industry. Furthermore, Gu et al. [43] conducted a study concerning trust in wearable commerce and applied the UTAUT2 to identify critical influence factors.
Wu et al. [44] created a model by integrating the TPB model with TAM, with perceived service availability and personal innovativeness in IT as external variables to investigate the acceptance of mobile healthcare systems by hospital professionals. Turhan [45] conducted another TPB-based study to explore consumer acceptance of wearable technologies, particularly smart bras and t-shirts. Their model incorporated external variables of TAM (e.g., normative beliefs, need compatibilities, relative advantages, self-efficacy, fear of technological advances, and cost). Finally, Wu et al. [41] integrated IDT, TAM, the UTAUT, and perceived enjoyment to explore user intent to use smartwatches.
3. Research Method
3.1. Research Framework
From a sociotechnical standpoint, the nature of the Mi Band is that of wearable technology, and behavioral intention to wear the Mi Band is influenced by not only the system itself but also by other human factors. Consequently, this study adopts the cognitive emotion theory (CET) [46] to connect technology acceptance-related theories and human factors. Based on CET, stimuli drive the formation of evaluative perceptions and induce emotions. Verhagen and van Dolen [47] argue for an extended emotion–action tendency link. According to their assumptions, beliefs precede emotions (or attitude) and behavioral intention.
Given this research background, the present study investigated the stimuli-emotion-action tendency link on the acceptance of wearable technologies. Significant factors were determined based on the literature review in Section 2, which included consideration of the influence of beliefs on attitude toward wearable technologies. First, from the TAM related theories, in the context of their UTAUT model, Venkatesh et al. [14] argued that performance expectancy pertains to perceived usefulness, job fit, extrinsic motivation, outcome expectancy, and relative advantage. They also stipulate that effort expectancy is related to complexity and perceived ease of use. Consequently, performance expectancy and effort expectancy were identifiable as two essential TAM-associated beliefs.
Second, from an IDT perspective, Mun et al. [48] claim that both IDT and TAM adopt the same perspective that acceptance of a particular IT product is often determined by its perceived attributes; and further that the TAM fundamentally makes up some subset of perceived innovation characteristics. In particular, perceived usefulness (outcome expectancy) resembles IDT’s relative advantage, and perceived ease of use (effort expectancy) opposes IDT.s complexity. IDT’s complexity. Perceived usefulness and relative advantage represent the extent to which a user perceives the target technology as preferable to currently used technology or practices, whereas perceived ease of use is considered inversely proportional to complexity. Therefore, among the IDT attributes discussed, compatibility, familiarity, and novelty were selected as representatives of IDT-related beliefs.
Third, other than TAM and IDT-related beliefs, potential wearable device users may be concerned with straightforward device-specific attributes to reach a final acceptance decision. As a result, this study also highlights perceived comfort and perceived privacy as two salient device-specific beliefs, as noted by Spagnolli et al. [3].
Finally, this study adopted the TPB perspective for the action tendency dimension that stresses the users’ effects of social influence and facilitating conditions on behavioral intention. In summary, the following conceptual framework is proposed in Figure 1. All the relationships can be assumed to be positive except novelty as Ordanini et al. [26] propose novelty will produce risk perceptions on potential adopters.
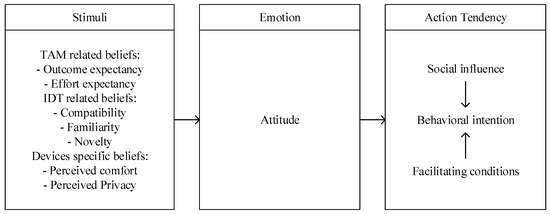
Figure 1.
Conceptual framework.
Research hypotheses based on this framework are as follows.
H1.
Attitudinal beliefs impact attitude.
H1a.
Outcome expectancy positively impacts attitude.
H1b.
Effort expectancy positively impacts attitude.
H1c.
Compatibility positively impacts attitude.
H1d.
Familiarity positively impacts attitude.
H1e.
Novelty negatively impacts attitude.
H1f.
Perceived comfort positively impacts attitude.
H1g.
Perceived privacy negatively impacts attitude.
H2.
Attitude positively impacts behavioral intention.
H3.
Social influence positively impacts behavioral intention.
H4.
Facilitating conditions positively impact behavioral intention.
3.2. Survey Items Used
Survey items were refined in two phases to ensure quality. The survey was pre-tested by five academics and five current Mi Band users to ensure the wording of the survey items was correct and appropriate. A pilot test of 100 participants was selected through convenience sampling, and tests were conducted to verify the overall quality of the survey instrument. The final version of the questionnaire includes a section detailing the Mi Band to present the research topic vividly.
The measures of all constructs, developed from previous literature and used a seven-point Likert scale, were summarized in Table 1.

Table 1.
Measurement scale of the research constructs.
Once validated, the questionnaire was distributed. Since wearable technologies are often considered high-tech products, their adopters often have extensive experience in using new technologies; therefore, an internet-based questionnaire was used for data collection. The website of the questionnaire was actively promoted through social networks (such as Facebook) and also distributed through a mailing list of employees at a large Taiwanese telecommunications company. The questionnaire was distributed for about one month from mid-April 2015. A total of 601 responses were collected, and 53 invalid responses were excluded. There were 548 valid samples with an effective response rate of 91.18%.
3.3. Profile of the Research Subjects
The ages of respondents were relatively evenly distributed. Most respondents held a bachelor’s degree or higher. Of the 548 respondents, 168 (30.66%) had previously encountered wearable technologies, whereas 137 (25.00%) had previous experience using the Mi Band. Table 2 summarizes the demographics of the study sample.
Table 2.
Demographics of the study respondents.
4. Data Analysis and Results
This study conducted data analysis in three stages. First, for the proposed research framework, structural equation modeling (SEM) evaluates the quality of the measurement model and the relationships in the structural model. Second, the importance-performance map analysis (IPMA) extends the SEM results by identifying the predecessor constructs’ total effects on their target construct as importance; their average latent variable scores as performance together to locate constructs deserve careful attention. Third, VIKOR ranks user and non-user groups based on essential decision elements for managerial decision support.
4.1. Structural Equation Modeling
The assessment of SEM goes through two stages, measurement model analysis, and structural model analysis. This study applies the component-based SEM approach (i.e., SmartPLS) rather than a covariance-based SEM approach (i.e., LISREL) because the former is more prediction-oriented [52] and is more suitable for the exploratory stages of theory development [53]. As a result, this study chose SmartPLS 3.0 [54] as the primary SEM method.
4.1.1. Measurement Model Analysis
Hair et al. [55] suggested primary measurement analyses were summarized. First, Cronbach’s alpha is the lower bound, and composite reliability is the upper bound for internal consistency, where both should be above 0.70. As indicated in Table 3, all Cronbach alpha and composite reliability results were well above the 0.70 thresholds, indicating good internal consistency.
Table 3.
Construct validity.
Second, for convergent validity, the indicator’s outer loadings should be above 0.70. Furthermore, the construct’s average variance extracted (AVE) should be above 0.50. As shown in Table 3, all outer loadings of the indicators were well above the threshold value of 0.70, suggesting sufficient indicator reliability. Moreover, all construct’s AVE values were considerably higher than the minimum threshold of 0.50, indicating a satisfactory convergent validity.
Third, researchers usually rely on two measures of discriminant validity. Firstly, an indicator’s outer loading on the associated construct should be higher than its cross-loadings with other constructs. Table 4 demonstrates the cross-loadings of the indicators. Considering the loadings across the columns, each indicator’s loadings on its construct were higher than all of its cross-loadings with all the other constructs, representing acceptable discriminant validity. Then the Fornell and Larcker [56] criteria maintain the square root of the AVE of each construct should be higher than its highest correlation with any other construct. Table 5 shows the results of the Fornell-Larcker criterion with the square root of constructs’ AVE on the diagonal and all the possible correlations in the off-diagonal position. Since the minimum number on the diagonal area (0.837) is greater than the maximum number in the off-diagonal area (0.720), all corrections in the off-diagonal area are lower than the numbers on the diagonal site, therefore meeting the requirement of discriminant validity.
Table 4.
Discriminant validity: loading and cross-loading criteria.
Table 5.
Discriminant validity: Fornell–Larcker criterion.
4.1.2. Structural Model Analysis
Once the reliability and validity of the measurement model were confirmed, the next step was to evaluate the structural model results, including examining the relationships between the constructs and the model’s predictive capabilities [57].
The significance and relevance of the structural model relationships are evaluated by applying the PLS-SEM algorithm, which estimated the path coefficients to prove the hypothetical relationship between the constructs. In addition to assessing the size of the path coefficients, their significance is evaluated by the bootstrapping option (5000 resample). Hair et al. [57] indicate that the assessment of a structural model should involve predictive accuracy and relevance. The coefficient of determination (R2 value) is first examined to show the model’s predictive accuracy. Then, Stone-Geisser’s Q2 value is assessed to indicate the models’ predictive relevance. The Q2 value is obtained by using the blindfolding procedure for a certain omission distance [57].
This study assesses the structural model by hypothesis testing and summarizes the results in Table 6.
Table 6.
Result of hypothesis testing and structural relationships.
The R2 and Q2 values of this study are summarized in Table 7. According to Hair et al. [57], R2 values of 0.75, 0.50, and 0.25 represent target constructs’ substantial, moderate, or weak values. In contrast, Q2 values above 0 indicate predictive relevance for the relevant construct. The model in this study has thus far shown satisfactory predictive accuracy and relevance.
Table 7.
Results of R2 and Q2.
Since the implications surrounding hypothesis testing and structural relationships have been discussed extensively in a study with a similar framework [58], this study concentrates on the advanced analysis of SEM results.
4.2. Importance–Performance Map Analysis
After the measurement model was confirmed as reliable and valid, the importance-performance relationship of the significant constructs was evaluated to gain managerial insights.
4.2.1. Procedure of IPMA
From a business perspective, research constructs are associated with pursuing goals that deserve careful attention regarding their importance and performance. The standardized path coefficients represent the strength of associations between the constructs in the PLS-SEM results obtained for the structural model. Consequently, the total effect of the predecessor constructs indicates its importance in shaping a specific target construct. Complemented this importance dimension by considering the rescaled average latent variable scores as a performance dimension, an Importance-Performance Map analysis (IPMA) can be conducted to make a valuable extension to the standard PLS-SEM analysis [49,55,59,60,61].
The goal of IPMA is to identify predecessors with a relatively high total effect and a relatively low average latent variable score. Hair. et al. [55] stated that IPMA indicates the constructs with relatively high importance and low performance to be the principal areas in which improvements can be made and thus should focus on marketing or management activities. IPMA plots importance on an x-axis and performance on the corresponding y-axis. The graphical representation of results enables researchers to effectively identify areas for attention and improvement.
Ringle and Sarstedt [62] suggested a five-step procedure for conducting IPMA.
Step 1. Requirements check.
Three requirements should be met before further analysis. First, all PLS-SEM path model indicators require using a metric or quasi-metric scale to ensure that the latent variable scores are rescaled from 0 to 100 [63]. Second, all the indicator coding must have the same proportional direction for a fair comparison. Third, the outer weight estimates must be positive to ensure the rescaled latent variable scores fall within the range 0–100.
Step 2. Computation of the performance values.
The IPMA system rescales indicator scores from 0 to 100, with 0 being the lowest and 100 being the highest performance on the following equation to interpret and compare performance levels of different scales. For a scale from 1 to 7, Minscale is 1, and Maxscale is 7.
Step 3. Computation of the importance values.
A construct’s importance in predicting another directly or indirectly linked (target) construct in the structural model is measured by the total effect of the relationship between these two constructs.
Step 4. Importance-performance map creation.
The first step in creating an importance-performance map requires selecting the target construct of interest. The importance and performance values of the target construct’s predecessor constructs provide a basis for making the importance-performance map of the target construct.
4.2.2. Results of IPMA
Following Ringle and Sarstedt [62], the requirements for carrying out an IPMA should first be checked. Indicator data obtained from the questionnaire were mainly on an interval scale from 1 to 7. Since beliefs as stimuli have two-way influences, we rescaled scores of perceived novelty from 1–7 to 7–1 So that all variables had the same directionality for a consistent and comparable base, where a higher indicator value represented a higher outcome. Next, after running the PLS-SEM algorithm, SmartPLS displayed the weights of all the indicators with a positive sign. Therefore, in line with IPMA Step 1, further analysis can proceed.
Based on the results of the PLS-SEM, the importance and performance data regarding behavioral intention were summarized in Table 8 and Figure 2. The IPMA diagram uses the average scores of importance and performance as a quadrant intersection for reasonable comparisons.
Table 8.
Summary of the IPMA data on behavioral intention.
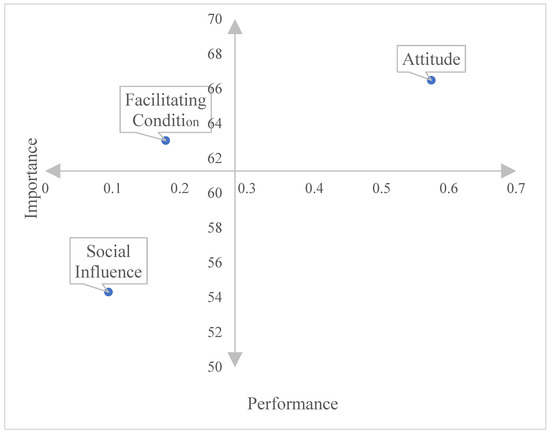
Figure 2.
IPMA results of behavioral intention as the target construct.
The IPMA results for behavioral intention reveal that no construct lies in the fourth quadrant, meaning that no factor required dramatic improvement. Attitude is located in the first quadrant, indicating that it significantly affects users’ behavioral intention toward wearable technologies, with performance matching importance appropriately.
Since attitude is the most crucial factor influencing behavioral intention, further IPMA for attitude was conducted (Table 9 and Figure 3).
Table 9.
Summary of the IPMA data on attitude.
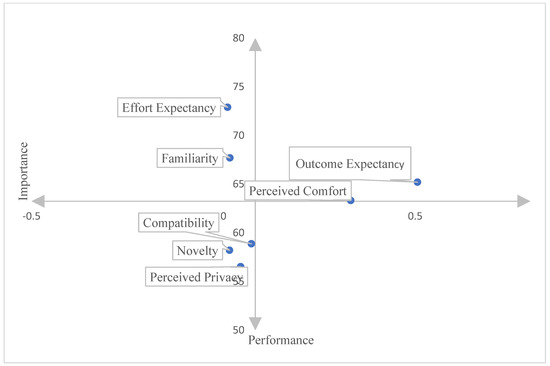
Figure 3.
IPMA results of attitude as the target construct.
The IPMA results of attitude show that outcome expectancy and perceived comfort were the two most influential constructs of attitude. Perceived comfort is located marginally in the fourth quadrant, indicating an area for potential managerial action. Meanwhile, the IMPA also shows other constructs without significant relationships with attitude for reference purposes. Reasonably, based on their position in the IMPA, these factors do not deserve special efforts under limited resources.
4.3. VIKOR Analysis
4.3.1. Procedure of VIKOR Analysis
According to Oprocovic and Tzeng [64], multi-criteria decision-making (MCDM) is a complex and dynamic technique for managerial and engineering decision support purposes. Duckstein and Opricovic [64,65,66,67] have introduced the steps of MCDM as follows: (1) Generate alternatives for attaining the goals, (2) Establish evaluation criteria that relate alternatives to goals, (3) Evaluate alternatives in terms of criteria, (4) Apply a normative multi-criteria analysis method, (5) Accept one optimal or preferred alternative, (6) Gather new information and go into the next iteration of MCDM if the final solution is not accepted.
The VIKOR is an MCDM method with a compromise ranking of conflicting criteria in nature and ranks them using the form of the Lp-metric introduced by Duckstein and Opricovic [64,65,66,67]. The compromise of VIKOR focuses on maximizing group utility and minimizing individual regret of the decision elements. Based on the research framework of this study, looking upon behavioral intention as the goal, related beliefs and attitude as decision criteria. The VIKOR methods can be applied to rank Mi Band user and non-user groups as two alternatives for managerial decision supports.
The VIKOR method is conducted in the following steps:
Step 1. Determine the best value () and worst value () of all criteria using
where B and C represent benefit and cost criteria, respectively.
Step 2. Compute the distance to the best values and using the relations,
Step 3. Compute the index values using the relation,
where , , , . Additionally, is a weight for the strategy of maximum group utility, whereas 1 − is the weight of an individual regret. Thus, if > 0.5, group utility is emphasized. In general, is set to 0.5, representing a balanced view.
Step 4. Order the alternatives by their Q values; in general, the smaller the Q is, the better the alternative. Nevertheless, to be the best compromise solution, the following two conditions should be satisfied: suppose A(1) is the best, and A(2) is second in the ranking list according to Q, then the first condition (C1). “Acceptable Advantage”: Q(A(2) − Q(A(1)) >= DQ where DQ = 1/(J − 1), J is the number of alternatives and the second condition (C2). “Acceptable Stability in decision making”: The alternative A(1) must also be the best ranked by S or/and R. If one of the conditions is not satisfied, then a set of compromise solutions is proposed, which consists of: Alternatives A(1) and A(2) if only the condition C2 is not satisfied, or—Alternatives A(1), A(2), A(M) if the condition C1 is not satisfied; A(M) is determined by the relation Q(A(M)) − Q(A(1)) < DQ for maximum M.
4.3.2. Results of VIKOR Analysis
Since the sample in this study included both Mi Band users and non-users, the two groups can be divided into two alternatives for further MCDM analysis. Table 10, Table 11, Table 12 and Table 13 present the results obtained using the VIKOR method.
Table 10.
Compromise solutions of behavioral intention.
Table 11.
Ranking solutions to behavioral intention.
Table 12.
Compromise solutions to attitude.
Table 13.
Ranking solutions of attitude.
5. Discussion
5.1. Conclusion
The significant findings of this study can be described as follows.
First, through proper calibration, SEM-based data can be dissected to reveal importance, performance, maximum group utility, and minimum individual regret by IPMA- and VIKOR-related techniques to gain deeper insight into stated preferences.
Second, attitude, social influence, and facilitating conditions are the three major driving factors of acceptance of wearable technologies. Among these, attitude is the most crucial factor, according to IPMA. Furthermore, among the essential antecedents of attitude (i.e., outcome expectancy, effort expectancy, compatibility, familiarity, novelty, perceived comfort, and perceived privacy), outcome expectancy and perceived comfort have more substantial effects. Outcome expectancy has both significant importance and performance. In contrast, peeved comfort has considerable room for improvement to match its importance.
Third, looking at the user and non-user groups as evaluation alternatives, the VIKOR analysis reveals that generally, the user group performed better on both maximum group utility and minimum individual regret in all decision elements than the non-user group. Specifically, the user group scored higher on behavioral intention, attitude, and antecedents of attitude, which means they benefit better from well-being from wearable technologies. This finding is further support for the SEM results. In addition, it demonstrates that user experience plays a vital role in the decision-making process of adopting wearable technologies. Furthermore, the only exception to the user group’s better performance relates to perceived privacy, in which non-users sensed less of a threat to privacy.
Fourth, this study demonstrated that IPMA and VIKOR techniques could complement each other to offer better decision-making insights. For example, IPMA identified outcome expectancy and perceived comfort as two important constructs leading to acceptance of wearable technologies; meanwhile, VIKOR indicated the distance of these constructs from the possible optimal values and where improvements could.
5.2. Theoretical Implications
Kalantari [35] conducted a comprehensive literature review of consumer adoption of wearable technologies, then synthesized the applied technology acceptance and diffusion theories, concluded by identifying major influential factors in the adoption decision process as “technology characteristics,” “perceived benefits,” “perceived risks,” “individual characteristics,” and “social factors.” Traditionally, technology characteristics are the research mainstream concerning the acceptance of wearable technologies. Later studies emphasized the importance of “domain-specific innovations (DSI).” For instance, Jeong et al. [9] proposed the concern with both the “perceived innovation adoption factors” (e.g., relative advantage, social image, and so on) and DSI (e.g., product-processing innovativeness and information-processing innovativeness). Nevertheless, the consideration of DSI might make the framework too complicated. For example, the Gao et al. [11] model included a “perceived health threat” factor. Similarly, Kim and Shin [8] proposed that “cost” will impact behavioral intention because their research targets were high-end smartwatches. Moreover, Kim and Shin [8] followed Russell’s [68] viewpoint that affection is a fundamental and universal human aspect of all emotion-laden events, objects, and places. Consequently, they defined “affective quality” (AQ) as how users believe a stimulus can change one’s core affection.
This study proposes the cognition emotion theory as a higher-order framework with a concise and flexible stimuli-emotion-action tendency link to accommodate technology acceptance-related beliefs and differentiated DSI considerations. This study accepted the supposition that emotion drives action. Nevertheless, instead of applying AQ as an exogenous construct as in Kim and Shin’s [8] model, because human is rational, it would be appropriate to consider emotion as an attitude toward behavioral intention and recognize its related driving stimuli (or beliefs).
Furthermore, in Kalantari and Rauschnabel’s [35] summary, comments on the interrelationships of these factors were lacking. The proposed framework based on CET could become a good foundation for connecting related factors as stimuli to the emotion-action tendency link. Furthermore, Kalantari and Rauschnabel [35] suggested a future research agenda, including “advancing the existing research” and “new research methodologies.” The first relates to studying other influential factors in consumer adoption decisions, applying existing findings in heterogeneous contexts and populations to find more generalizable conclusions, and focusing on arguably factors such as privacy concerns and aesthetics. The second refers to applying qualitative research through in-depth focus group interviews to complement traditional quantitative testing and highlighting the importance of incorporating other methodologies such as multi-criteria decision-making techniques (e.g., AHP) to explore the adoption decision process. In line with this agenda, this study demonstrates advancements in this field.
5.3. Managerial Implications
Based on these findings, strategies for promoting wearable technologies are suggested. First, because user attitudes toward wearable technologies account for final acceptance, marketers of wearable technologies should endeavor to cultivate favorable attitudes in prospective users. Specifically, they can emphasize the excellent performance of device compatibility, familiarity, non-novelty, outcome expectancy, effort expectancy, perceived comfort, and privacy.
Second, because outcome expectancy results in a favorable attitude, the functionality of wearable technologies can be continually enhanced to make the product more appealing to potential users with practical concerns, thus creating a sustainable competitive advantage. Though this suggestion might seem mediocre, based on the results of IPMA, the advanced and sophisticated functionality should not outweigh consumers’ desire for perceived comfort.
Third, as the results of the VIKOR analysis showed, the user group perceived higher group utility and lower individual regret than the non-user group, representing user experience plays a crucial role in the decision-making process regarding acceptance. Consequently, manufacturers can offer low entry-level products to encourage the product’s trial and thus spur later adoption of more high-end products.
Finally, because social influences and facilitating conditions are important antecedents besides attitudes toward the behavioral intention of wearable technologies, leveraging word-of-mouth and social media marketing demonstrating product usages and benefits could also effectively contribute to the promotion of wearable technologies.
5.4. Limitations and Future Research Avenues
This study used the commercially available Mi Band as a sample case and surveyed a convenient sample population. Hence, the generalization of the present research findings may be limited. Consequently, further studies should consider other wearable devices (e.g., Apple Watch, Google Glass, and so on) and employ a more representative sample to investigate possible differences and implications.
Second, this study advanced the investigation of wearable technologies by integrating PLS-SEM and MCDM methods. PLS-SEM helps recognize current status, then MCDM methods locate rooms for improvements. The measurement model analysis of PLS-SEM laid the foundation for qualified input data of MCDM; together, they create significant synergy. However, the structural model analysis of PLS-SEM, such as multi-group analysis of user and non-user groups, can be explored in more depth. At the same time, other MCDM methods, such as DEMATEL, ANP, and so on [64] can also be applied for more managerial implications. Furthermore, longitudinal study designs should be employed to check the dynamics of behavioral intention toward wearable technologies [69,70,71].
Finally, in product adoption literature, it is widely and implicitly assumed that the effects of a new product’s attributes on adoption intention are additive, meaning all individual attributes play an independent role [26]. Nevertheless, the impact of product attributes on final adoption may depend not only on the levels of the individual but also on how the attributes are configured. Set-theoretical approaches, such as fuzzy set qualitative comparative analysis [72,73,74], could also be employed to investigate consumer behavioral intention toward wearable devices.
Author Contributions
Writing—original draft, H.-M.C. and C.-I.C. All authors have read and agreed to the published version of the manuscript.
Funding
This research received no external funding.
Institutional Review Board Statement
Not applicable.
Informed Consent Statement
Not applicable.
Data Availability Statement
The data presented in this study are available on request from the corresponding author.
Conflicts of Interest
The authors declare no conflict of interest.
References
- Gimhae, G.N. Six human factors to acceptability of wearable computers. Int. J. Multimed. Ubiquitous Eng. 2013, 8, 103–114. [Google Scholar]
- Jing, L.; Cheng, Z.; Zhou, Y.; Wang, J. Transparent services selecting and loading with wearable devices. Int. J. Cloud Comput. 2012, 1, 351–366. [Google Scholar] [CrossRef]
- Spagnolli, A.; Guardigli, E.; Orso, V.; Varotto, A.; Gamberini, L. Measuring user acceptance of wearable symbiotic devices: Validation study across application scenarios. In Symbiotic Interaction; Jacucci, G., Gamberini, L., Freeman, J., Spagnolli, A., Eds.; Springer: London, UK, 2014; pp. 87–98. [Google Scholar]
- Allanson, J.; Fairclough, S.H. A research agenda for physiological computing. Interact. Comput. 2004, 16, 857–878. [Google Scholar] [CrossRef]
- Daim, T.U.; Al-Mulla, N.; Sengupta, S.B.; Shah, K.; Demchig, B. Technology assessment: Case of the wearable computing for fitness. Int. J. Med. Eng. Inform. 2015, 7, 321–364. [Google Scholar] [CrossRef]
- Haghi, M.; Danyali, S.; Ayasseh, S.; Wang, J.; Aazami, R.; Deserno, T.M. Wearable devices in health monitoring from the environmental towards multiple domains: A survey. Sensors 2021, 21, 2130. [Google Scholar] [CrossRef]
- Ouyang, Y.; Cai, X.; Li, J.; Gao, Q. Investigating the “Embodied Spaces of Health” in Marathon Running: The Roles of Embodiment, Wearable Technology, and Affective Atmospheres. Int. J. Environ. Res. Public Health 2021, 19, 43. [Google Scholar] [CrossRef]
- Kim, K.J.; Shin, D.H. An acceptance model for smart watches: Implications for the adoption of future wearable technology. Internet Res. 2015, 25, 527–541. [Google Scholar] [CrossRef]
- Jeong, S.C.; Kim, S.H.; Park, J.Y.; Choi, B. Domain-specific innovativeness and new product adoption: A case of wearable devices. Telemat. Inform. 2017, 34, 399–412. [Google Scholar] [CrossRef]
- Hsiao, K.L.; Chen, C.C. What drives smartwatch purchase intention? Perspectives from hardware, software, design, and value. Telemat. Inform. 2018, 35, 103–113. [Google Scholar] [CrossRef]
- Gao, Y.; Li, H.; Luo, Y. An empirical study of wearable technology acceptance in healthcare. Ind. Manag. Data Syst. 2015, 115, 1704–1723. [Google Scholar] [CrossRef]
- Davis, F.D. Perceived usefulness, perceived ease of use, and user acceptance of information technology. MIS Q. 1989, 13, 319–340. [Google Scholar] [CrossRef] [Green Version]
- Venkatesh, V.; Davis, F.D. A theoretical extension of the technology acceptance model: Four longitudinal field studies. Manag. Sci. 2000, 46, 186–204. [Google Scholar] [CrossRef] [Green Version]
- Venkatesh, V.; Morris, M.G.; Davis, G.B.; Davis, F.D. User acceptance of information technology: Toward a unified view. MIS Q. 2003, 27, 425–478. [Google Scholar] [CrossRef] [Green Version]
- Venkatesh, V.; Thong, J.Y.; Xu, X. Consumer acceptance and use of information technology: Extending the unified theory of acceptance and use of technology. MIS Q. 2012, 36, 157–178. [Google Scholar] [CrossRef] [Green Version]
- Ajzen, I. The theory of planned behavior. Organ. Behav. Hum. Decis. Process. 1991, 50, 179–211. [Google Scholar] [CrossRef]
- Rogers, E.M. Diffusion of Innovations, 4th ed.; ACM The Free Press: New York, NY, USA, 1995; pp. 15–23. [Google Scholar]
- Moore, G.C.; Benbasat, I. Development of an instrument to measure the perceptions of adopting an information technology innovation. Inf. Syst. Res. 1991, 2, 192–222. [Google Scholar] [CrossRef] [Green Version]
- Tornatzky, L.G.; Klein, K.J. Innovation characteristics and innovation adoption-implementation: A meta-analysis of findings. IEEE Trans. Eng. Manag. 1982, 29, 28–45. [Google Scholar] [CrossRef]
- Arts, J.W.; Frambach, R.T.; Bijmolt, T.H. Generalizations on consumer innovation adoption: A meta-analysis on drivers of intention and behavior. Int. J. Res. Mark. 2011, 28, 134–144. [Google Scholar] [CrossRef]
- Robertson, T.S. The process of innovation and the diffusion of innovation. J. Mark. 1967, 31, 14–19. [Google Scholar] [CrossRef]
- Usher, A.P. A History of Mechanical Invention, revised ed.; Harvard University Press: Cambridge, MA, USA, 1954. [Google Scholar]
- Littrell, M.A.; Miller, N.J. Marketing across cultures: Consumers’ perceptions of product complexity, familiarity, and compatibility. J. Glob. Mark. 2001, 15, 67–86. [Google Scholar] [CrossRef]
- Firth, R.W.; Narayanan, V.K. New product strategies of large, dominant product manufacturing firms: An exploratory analysis. J. Prod. Innov. Manag. 1996, 13, 334–347. [Google Scholar] [CrossRef]
- Hoeffler, S. Measuring preferences for really new products. J. Mark. Res. 2003, 40, 406–420. [Google Scholar] [CrossRef]
- Ordanini, A.; Parasuraman, A.; Rubera, G. When the recipe is more important than the ingredients a qualitative comparative analysis (QCA) of service innovation configurations. J. Serv. Res. 2014, 17, 134–149. [Google Scholar] [CrossRef]
- Britz, J.J. Technology as a Threat to Privacy: Ethical Challenges and Guidelines for the Information Professionals. Microcomput. Inf. Manag. 1996, 13, 175–193. [Google Scholar]
- Tavani, H.T. Genomic research and data-mining technology: Implications for personal privacy and informed consent. Ethics Inf. Technol. 2004, 6, 15–28. [Google Scholar] [CrossRef] [PubMed]
- Arvanitis, T.N.; Williams, D.D.; Knight, J.F.; Baber, C.; Gargalakos, M.; Sotiriou, S.; Bogner, F.X. A human factors study of technology acceptance of a prototype mobile augmented reality system for science education. Adv. Sci. Lett. 2011, 4, 3342–3352. [Google Scholar] [CrossRef]
- Chae, J.M. Consumer acceptance model of smart clothing according to innovation. Int. J. Hum. Ecol. 2009, 10, 23–33. [Google Scholar]
- Chang, H.S.; Lee, S.C.; Ji, Y.G. Wearable device adoption model with TAM and TTF. Int. J. Mob. Commun. 2016, 14, 518–537. [Google Scholar] [CrossRef]
- Choi, J.; Kim, S. Is the smartwatch an IT product or a fashion product? A study on factors affecting the intention to use smartwatches. Comput. Hum. Behav. 2016, 63, 777–786. [Google Scholar] [CrossRef]
- Chuah, S.H.W.; Rauschnabel, P.A.; Krey, N.; Nguyen, B.; Ramayah, T.; Lade, S. Wearable technologies: The role of usefulness and visibility in smartwatch adoption. Comput. Hum. Behav. 2016, 65, 276–284. [Google Scholar] [CrossRef]
- Hwang, C.; Chung, T.L.; Sanders, E.A. Attitudes and purchase intentions for smart clothing: Examining US consumers’ functional, expressive, and aesthetic needs for solar-powered clothing. Cloth. Text. Res. J. 2016, 34, 207–222. [Google Scholar] [CrossRef]
- Kalantari, M.; Rauschnabel, P. Exploring the early adopters of augmented reality smart glasses: The case of Microsoft HoloLens. In Augmented Reality and Virtual Reality; Springer: Cham, Switzerland, 2018; pp. 229–245. [Google Scholar]
- Kwee-Meier, S.T.; Bützler, J.E.; Schlick, C. Development and validation of a technology acceptance model for safety-enhancing, wearable locating systems. Behav. Inf. Technol. 2016, 35, 394–409. [Google Scholar] [CrossRef]
- Lee, H.M. A study on the acceptance of wearable computers based on the extended technology acceptance model. Res. J. Costume Cult. 2009, 17, 1155–1172. [Google Scholar]
- Rauschnabel, P.A.; He, J.; Ro, Y. An exploration of intended use of augmented reality smart glasses. In Proceedings of the Midwest Decision Sciences Institute (MWDSI) Annual Conference, Valparaiso, IN, USA, 15 April 2016; pp. 98–122. [Google Scholar]
- Ayeh, J.K.; Au, N.; Law, R. Towards an understanding of online travellers’ acceptance of consumer-generated media for travel planning: Integrating technology acceptance and source credibility factors. In Information and Communication Technologies in Tourism 2013; Springer: Berlin/Heidelberg, Germany, 2013; pp. 254–267. [Google Scholar]
- Tom Dieck, M.C.; Jung, T. A theoretical model of mobile augmented reality acceptance in urban heritage tourism. Curr. Issues Tour. 2018, 21, 154–174. [Google Scholar] [CrossRef]
- Wu, L.H.; Wu, L.C.; Chang, S.C. Exploring consumers’ intention to accept Smartwatch. Comput. Hum. Behav. 2016, 64, 383–392. [Google Scholar] [CrossRef]
- Van Heek, J.; Schaar, A.K.; Trevisan, B.; Bosowski, P.; Ziefle, M. User requirements for wearable smart textiles: Does the usage context matter (medical vs. sports)? In Proceedings of the 8th International Conference on Pervasive Computing Technologies for Healthcare, Institute for Computer Sciences, Social-Informatics and Telecommunications Engineering (ICST), Oldenburg, Germany, 20–23 May 2014; pp. 205–209. [Google Scholar]
- Gu, Z.; Wei, J.; Xu, F. An empirical study on factors influencing consumers’ initial trust in wearable commerce. J. Comput. Inf. Syst. 2016, 56, 79–85. [Google Scholar] [CrossRef]
- Wu, L.; Li, J.Y.; Fu, C.Y. The adoption of mobile healthcare by hospital’s professionals: An integrative perspective. Decis. Support Syst. 2011, 51, 587–596. [Google Scholar] [CrossRef]
- Turhan, G. An assessment towards the acceptance of wearable technology to consumers in Turkey: The application to smart bra and t-shirt products. J. Text. Inst. 2013, 104, 375–395. [Google Scholar] [CrossRef]
- Reisenzein, R. Emotions as metarepresentational states of mind: Naturalizing the belief–desire theory of emotion. Cogn. Syst. Res. 2009, 10, 6–20. [Google Scholar] [CrossRef]
- Verhagen, T.; van Dolen, W. The influence of online store beliefs on consumer online impulse buying: A model and empirical application. Inf. Manag. 2011, 48, 320–327. [Google Scholar] [CrossRef]
- Mun, Y.Y.; Jackson, J.D.; Park, J.S.; Probst, J.C. Understanding information technology acceptance by individual professionals: Toward an integrative view. Inf. Manag. 2006, 43, 350–363. [Google Scholar]
- Slack, N. The importance-performance matrix as a determinant of improvement priority. Int. J. Oper. Prod. Manag. 1994, 14, 59–75. [Google Scholar] [CrossRef]
- Im, S.; Workman, J.P. The impact of creativity on new product success. In American Marketing Association, Conference Proceedings; American Marketing Association: Chicago, IL, USA, 2000; Volume 11, p. 198. [Google Scholar]
- Calantone, R.J.; Chan, K.; Cui, A.S. Decomposing product innovativeness and its effects on new product success. J. Prod. Innov. Manag. 2006, 23, 408–421. [Google Scholar] [CrossRef]
- Joreskog, K.G.; Wold, H. The ML and PLS techniques for modeling with latent variables: Comparative aspects. In Proceedings of the Conference on Systems under Indirect Observation. Causality, Structure, Prediction, Cartigny, Switzerland, 18–20 October 1979; pp. 18–20. [Google Scholar]
- Chin, W.W. The partial least squares approach to structural equation modeling. Mod. Methods Bus. Res. 1998, 295, 295–336. [Google Scholar]
- Ringle, C.M.; Wende, S.; Will, S. SmartPLS 2.0 (M3) Beta; University of Hamburg: Hamburg, Germany, 2005. [Google Scholar]
- Hair, J.F., Jr.; Hult, G.T.M.; Ringle, C.; Sarstedt, M. A Primer on Partial Least Squares Structural Equation Modeling (PLS-SEM); Sage Publications: Thousand Oaks, CA, USA, 2016. [Google Scholar]
- Fornell, C.; Larcker, D.F. Evaluating structural equation models with unobservable variables and measurement error. J. Mark. Res. 1981, 18, 39–50. [Google Scholar] [CrossRef]
- Hair, J.F.; Ringle, C.M.; Sarstedt, M. Partial least squares structural equation modeling: Rigorous applications, better results and higher acceptance. Long Range Plan. 2013, 46, 1–12. [Google Scholar] [CrossRef]
- Chuang, H.M. Factors Influencing Behavioral Intention of Wearable Symbiotic Devices-Case Study of the Mi Band. Soochow J. Econ. Bus. 2016, 93, 1–24. [Google Scholar]
- Fornell, C.; Johnson, M.D.; Anderson, E.W.; Cha, J.; Bryant, B.E. The American customer satisfaction index: Nature, purpose, and findings. J. Mark. 1996, 60, 7–18. [Google Scholar] [CrossRef] [Green Version]
- Hock, C.; Ringle, M.C.; Sarstedt, M. Management of multi-purpose Stadiums: Importance and Performance Measurement of Service Interfaces. Int. J. Serv. Technol. Manag. 2010, 14, 188–207. [Google Scholar] [CrossRef]
- Martilla, A.J.; James, C.J. Importance-performance analysis. J. Mark. 1977, 3, 77–79. [Google Scholar] [CrossRef]
- Ringle, C.M.; Sarstedt, M. Gain more insight from your PLS-SEM results: The importance-performance map analysis. Ind. Manag. Data Syst. 2016, 116, 1865–1886. [Google Scholar] [CrossRef]
- Sarstedt, M.; Mooi, E. A Concise Guide to Market Research; Springer: Berlin/Heidelberg, Germany, 2019. [Google Scholar]
- Opricovic, S.; Tzeng, G.H. Defuzzification within a multi-criteria decision model. Int. J. Uncertain. Fuzziness Knowl. Based Syst. 2003, 11, 635–652. [Google Scholar] [CrossRef]
- Opricovic, S. Multicriteria Optimization of Civil Engineering Systems; Faculty of Civil Engineering: Belgrade, Serbia, 1998. [Google Scholar]
- Opricovic, S.; Tzeng, G.H. Compromise solution by MCDM methods: A comparative analysis of VIKOR and TOPSIS. Eur. J. Oper. Res. 2004, 156, 445–455. [Google Scholar] [CrossRef]
- Opricovic, S.; Tzeng, G.H. Extended VIKOR method in comparison with outranking methods. Eur. J. Oper. Res. 2007, 178, 514–529. [Google Scholar] [CrossRef]
- Russell, J.A. Core Affect and the Psychological Construction of Emotion. Psychol. Rev. 2003, 110, 145–172. [Google Scholar] [CrossRef] [PubMed]
- Arai, A.; Fan, Z.; Matekenya, D.; Shibasaki, R. Comparative Perspective of Human Behavior Patterns to Uncover Ownership Bias among Mobile Phone Users. ISPRS Int. J. Geo-Inf. 2016, 5, 85. [Google Scholar] [CrossRef] [Green Version]
- Jia, T.; Jiang, B. Exploring Human Activity Patterns Using Taxicab Static Points. ISPRS Int. J. Geo-Inf. 2012, 1, 89–107. [Google Scholar] [CrossRef] [Green Version]
- Xu, Y.; Shaw, S.L.; Fang, Z.; Yin, L. Estimating Potential Demand of Bicycle Trips from Mobile Phone Data—An Anchor-Point Based Approach. ISPRS Int. J. Geo-Inf. 2016, 5, 131. [Google Scholar] [CrossRef] [Green Version]
- Ojala, J. Personal content in online sports communities: Motivations to capture and share personal exercise data. Int. J. Soc. Humanist. Comput. 2013, 2, 68–85. [Google Scholar] [CrossRef]
- Ragin, C.C. Fuzzy-Set Social Science; University of Chicago: Chicago, IL, USA, 2000. [Google Scholar]
- Ragin, C.C. Redesigning Social Inquiry: Fuzzy Sets and Beyond; University of Chicago: Chicago, IL, USA, 2009. [Google Scholar]
Publisher’s Note: MDPI stays neutral with regard to jurisdictional claims in published maps and institutional affiliations. |
© 2022 by the authors. Licensee MDPI, Basel, Switzerland. This article is an open access article distributed under the terms and conditions of the Creative Commons Attribution (CC BY) license (https://creativecommons.org/licenses/by/4.0/).