
An Evaluation of the PV Integrated Dynamic Overhangs Based on Parametric Performance Design Method: A Case Study of a Student Apartment in China


Abstract
:1. Introduction
2. Methodology
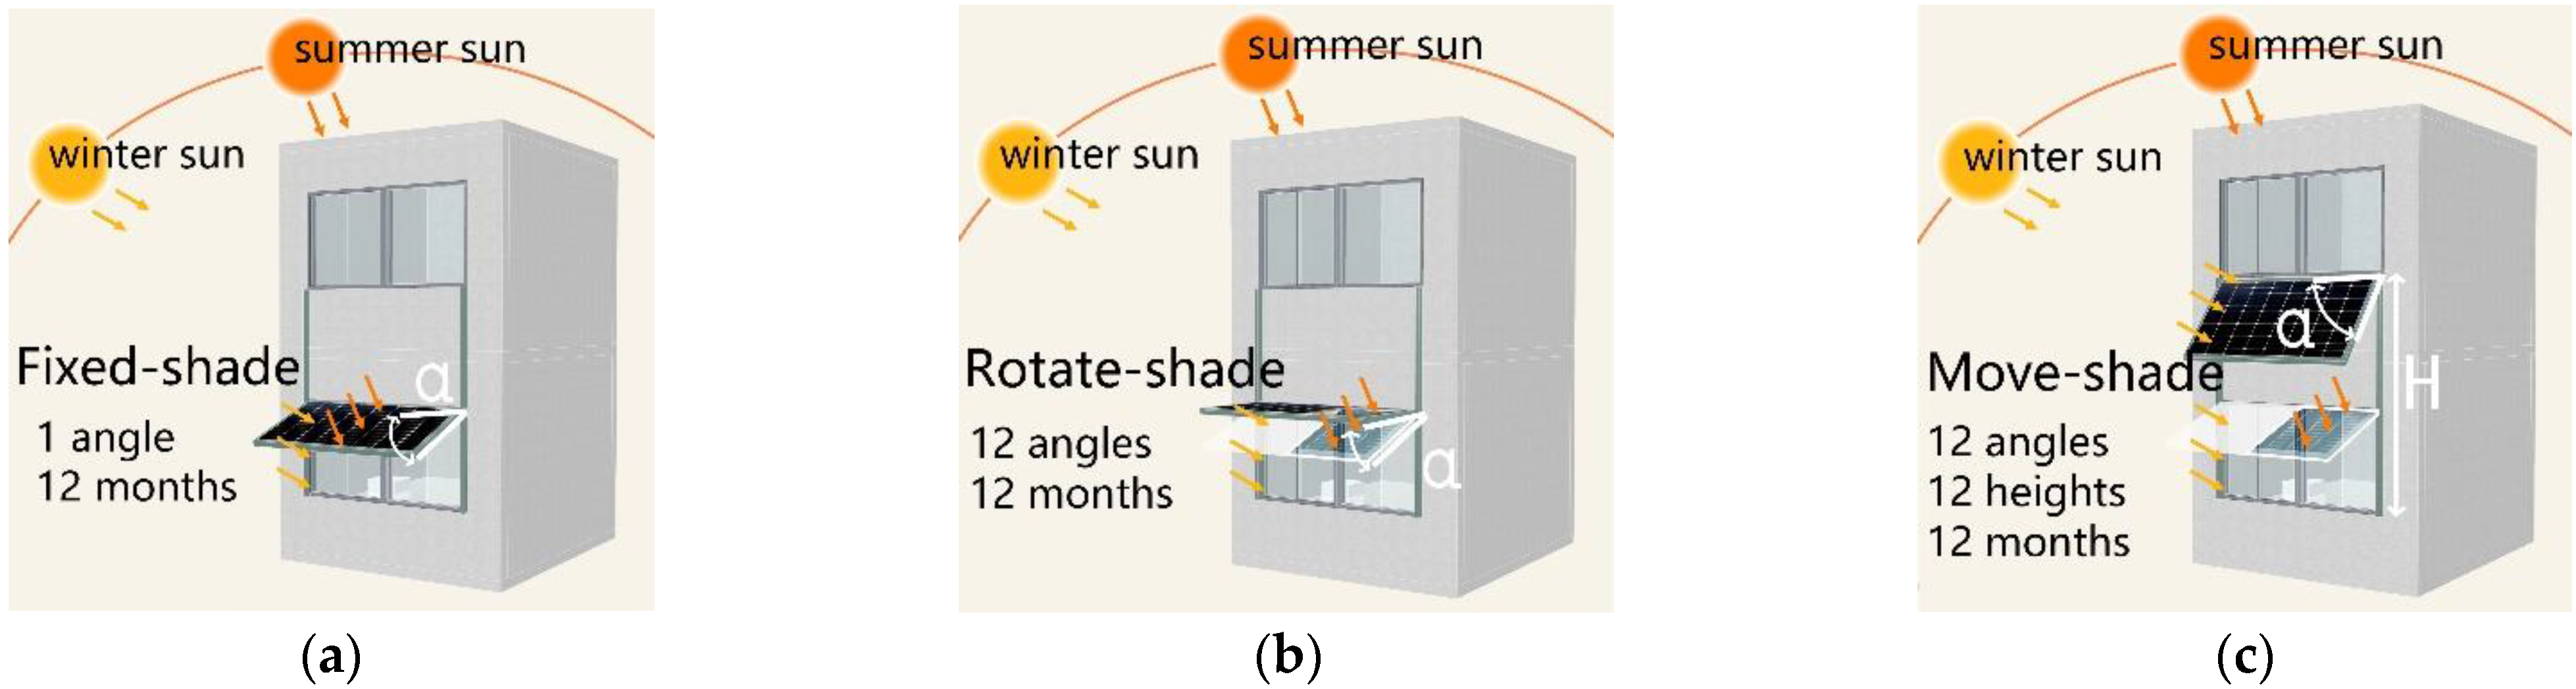
2.1. PVSD Design Strategy
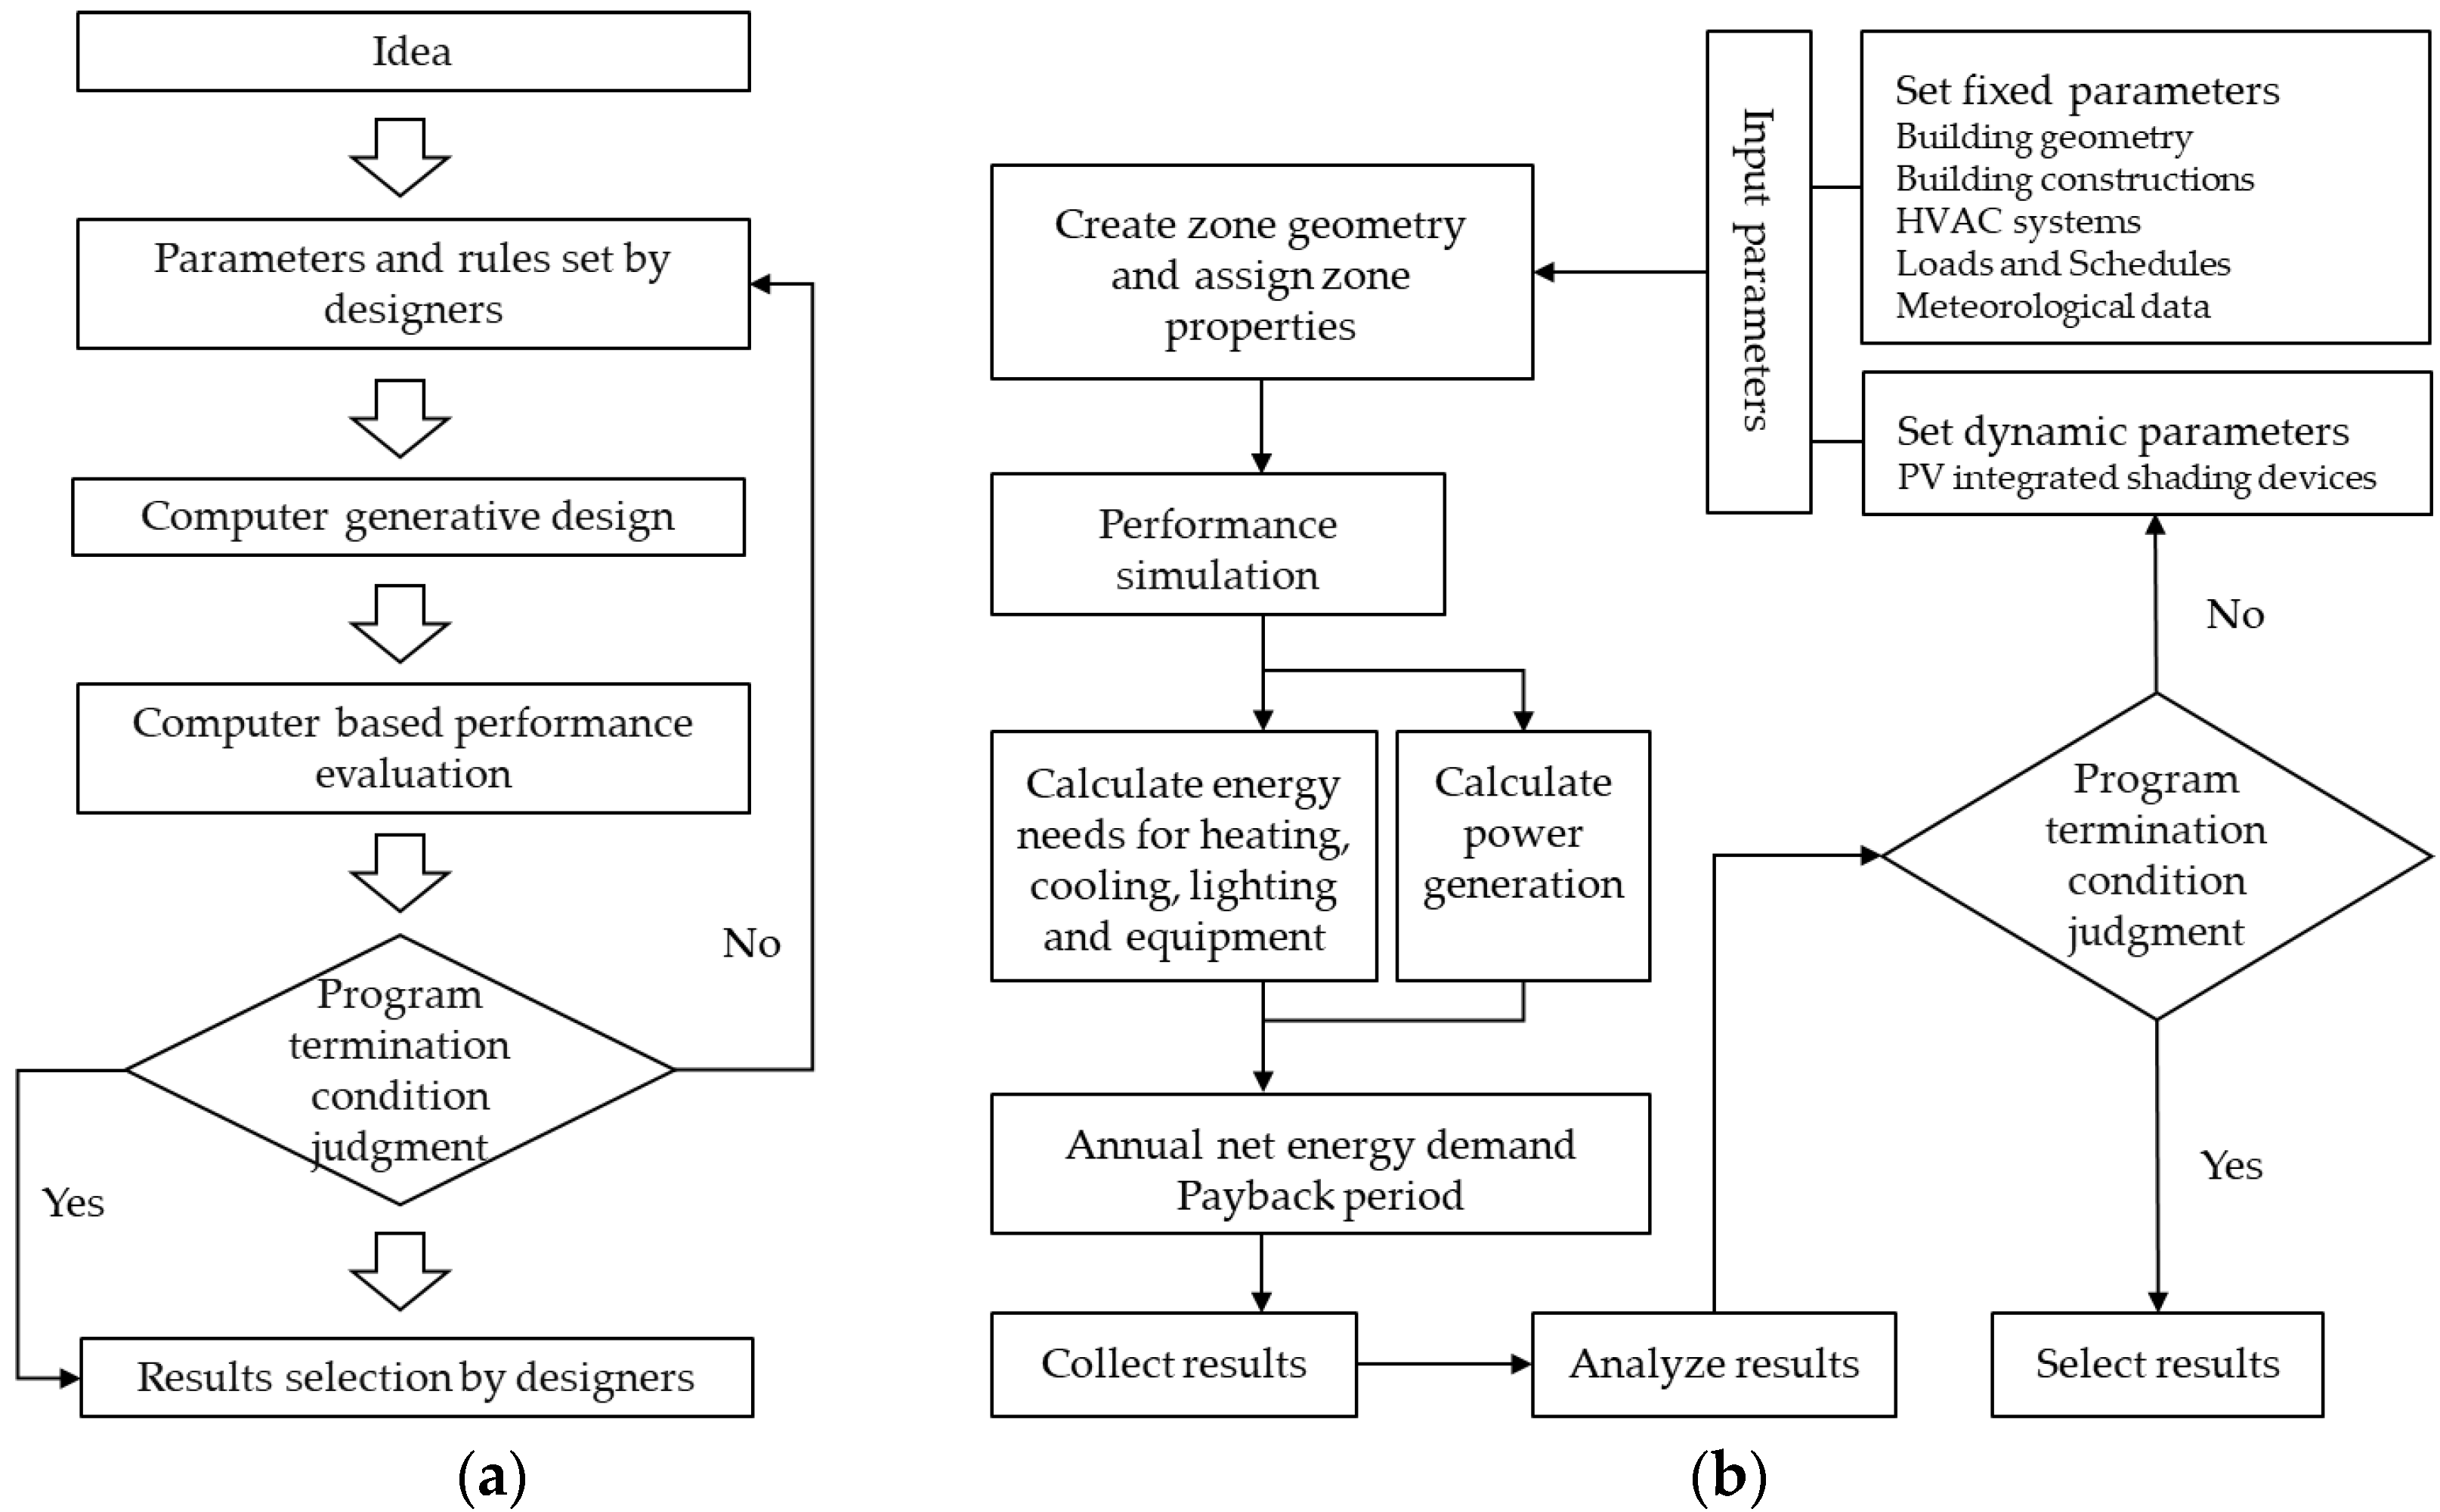
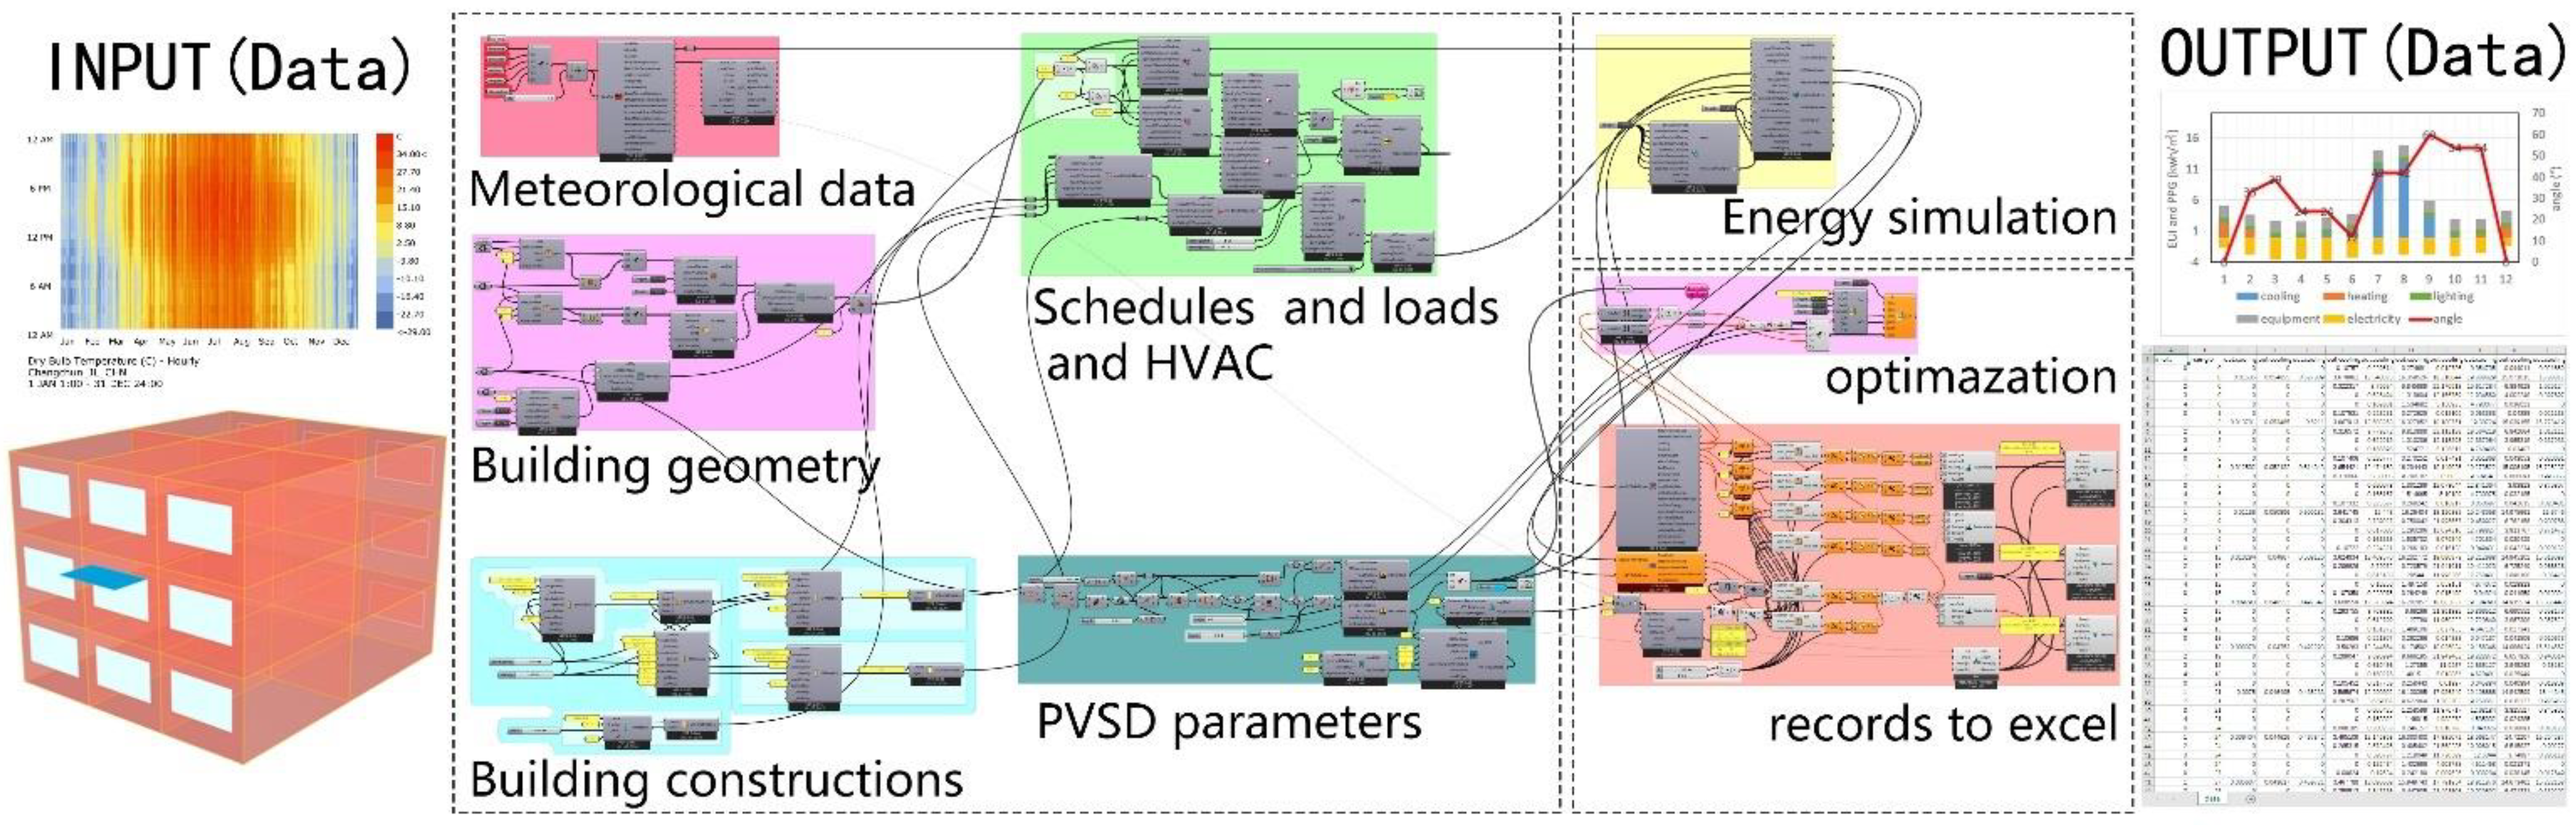
2.2. Simulation Workflow
2.3. Experiment
3. Results
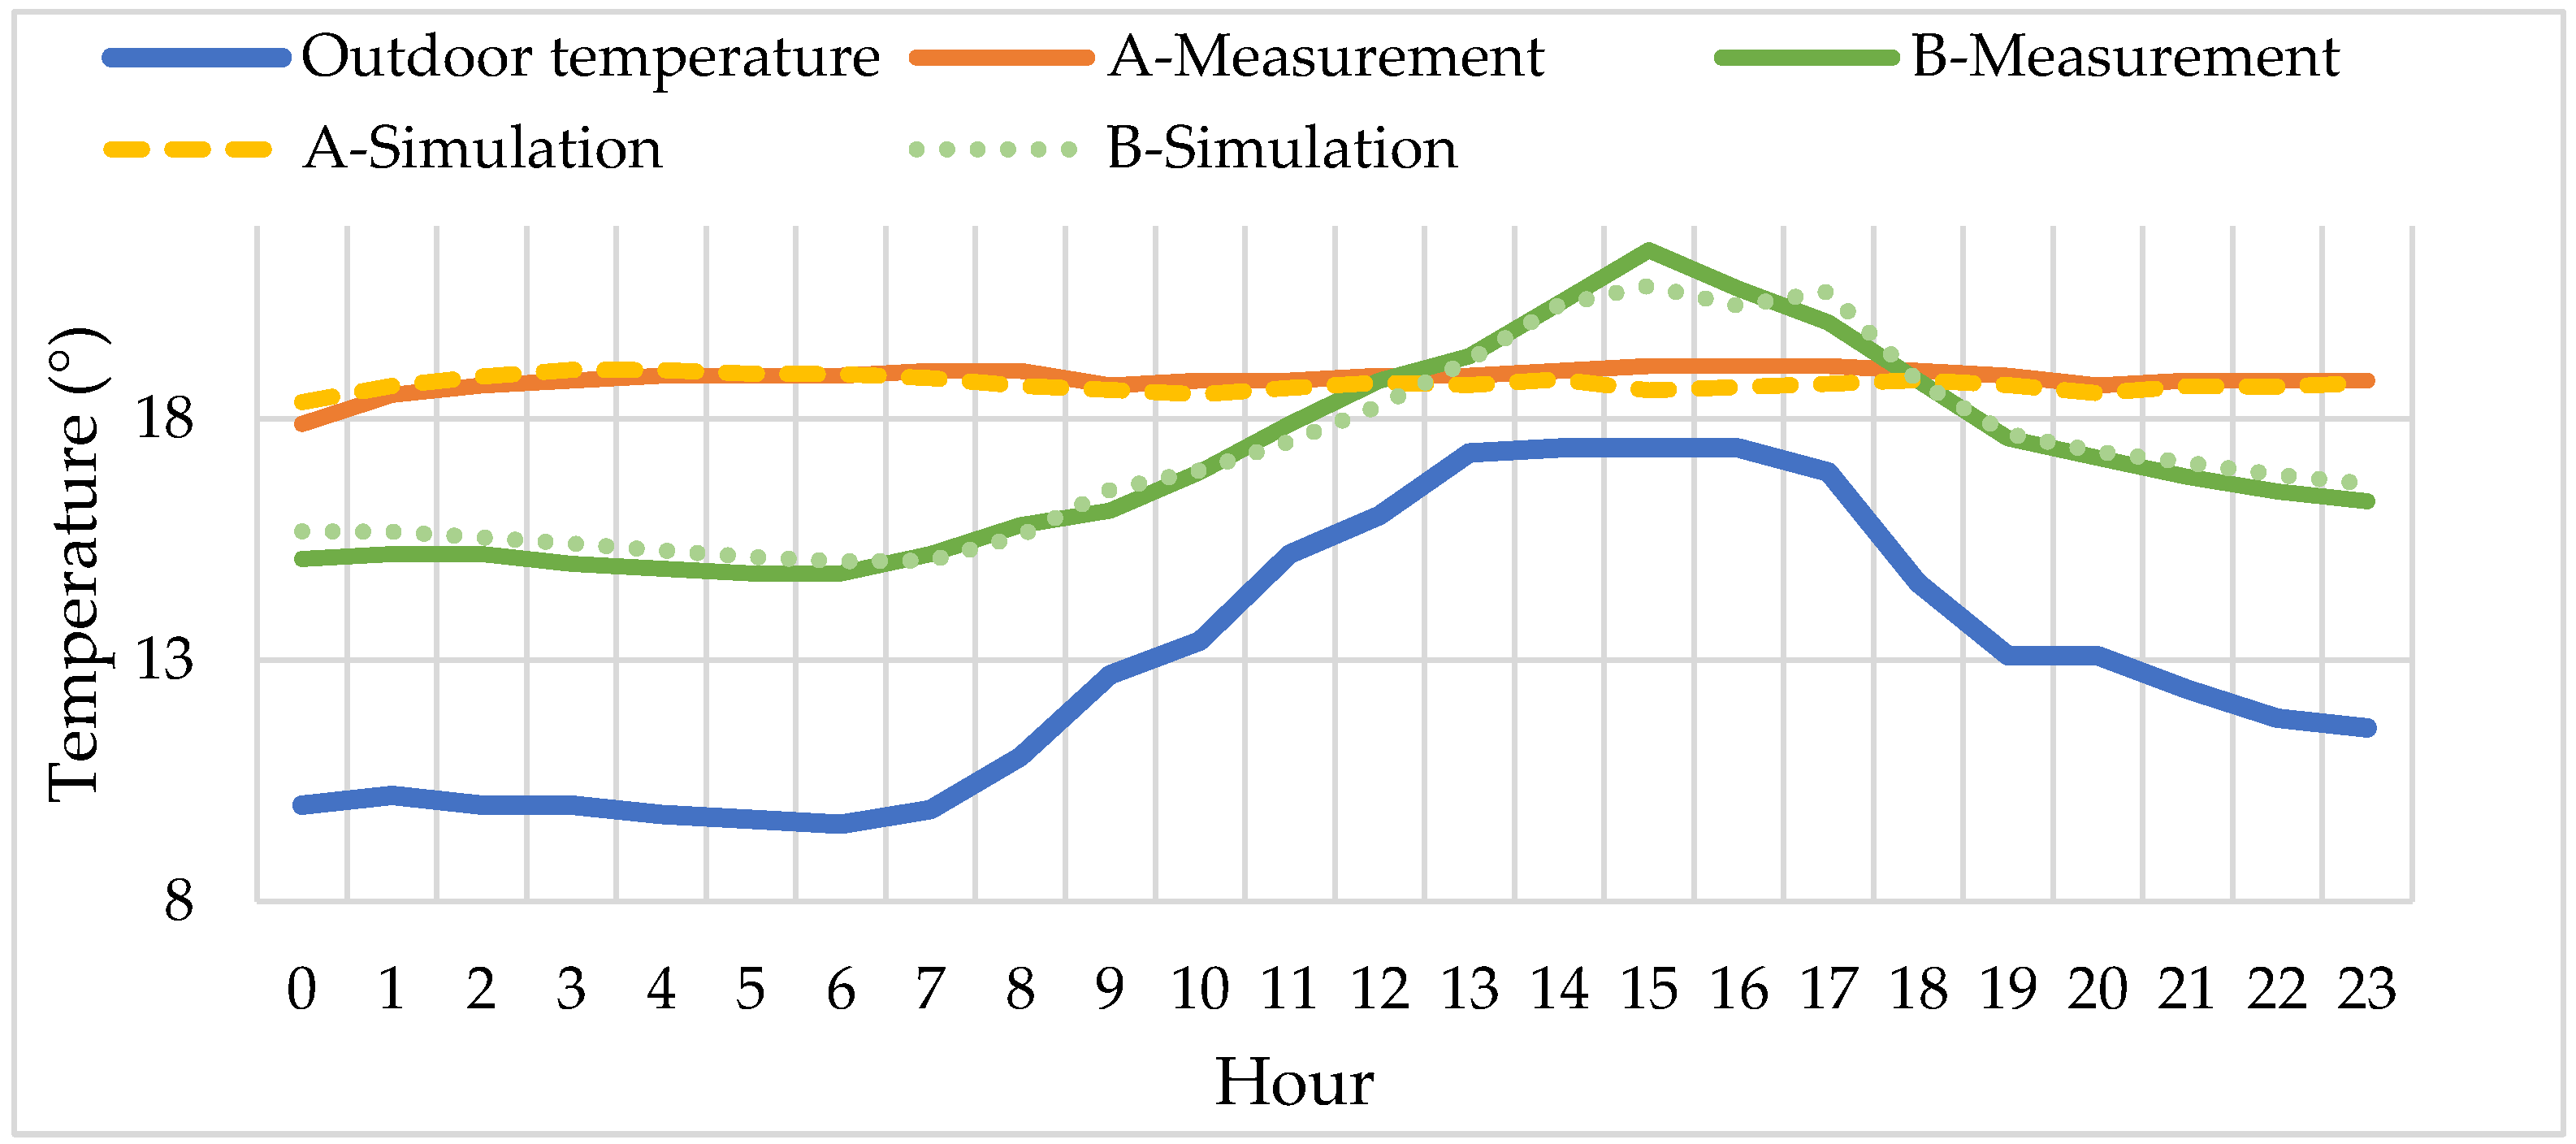
3.1. Model Validation
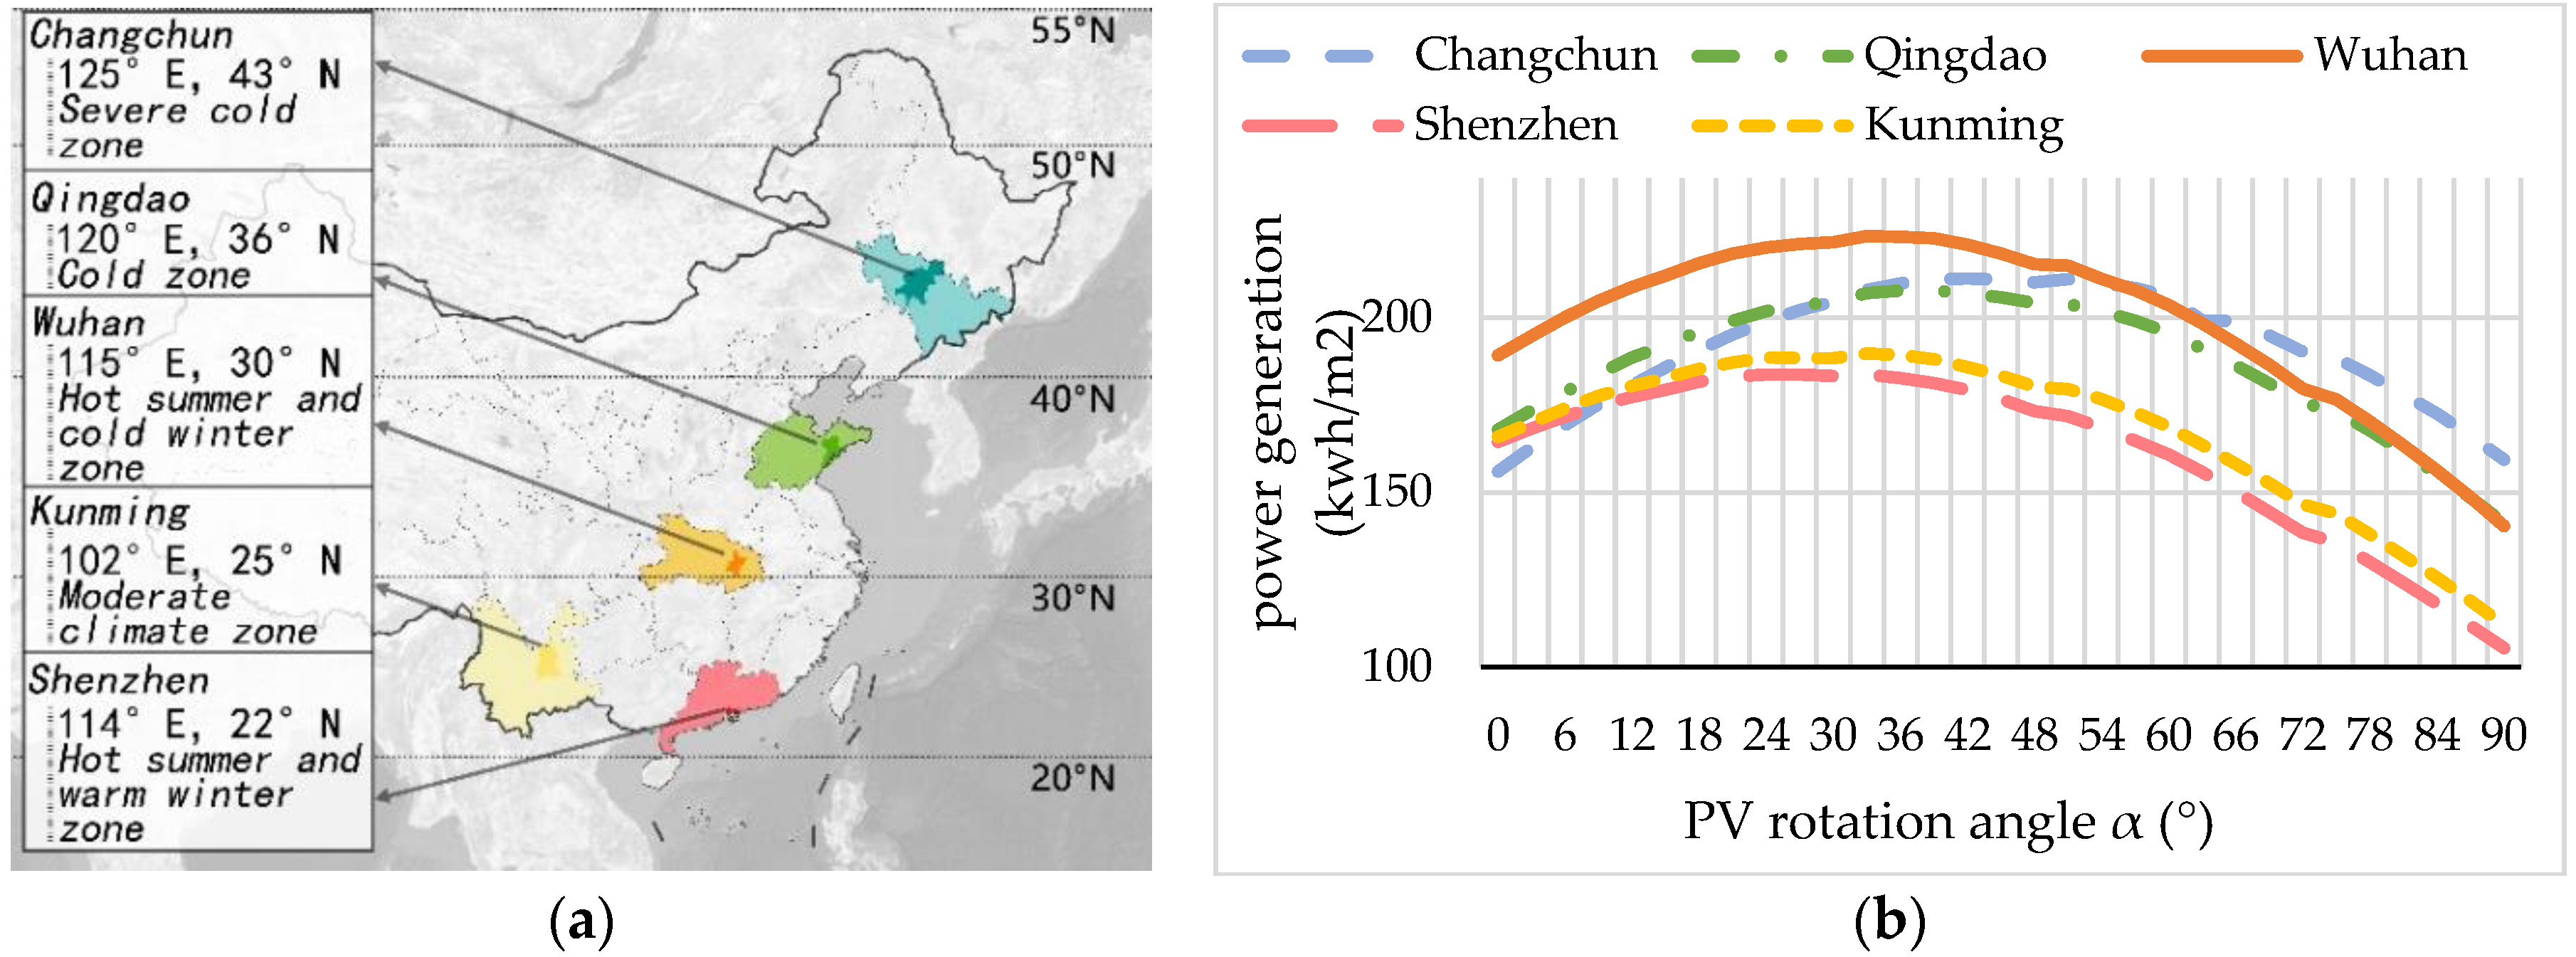
3.2. Power Generation in Five Cities
3.3. Results of the PVSD Strategies
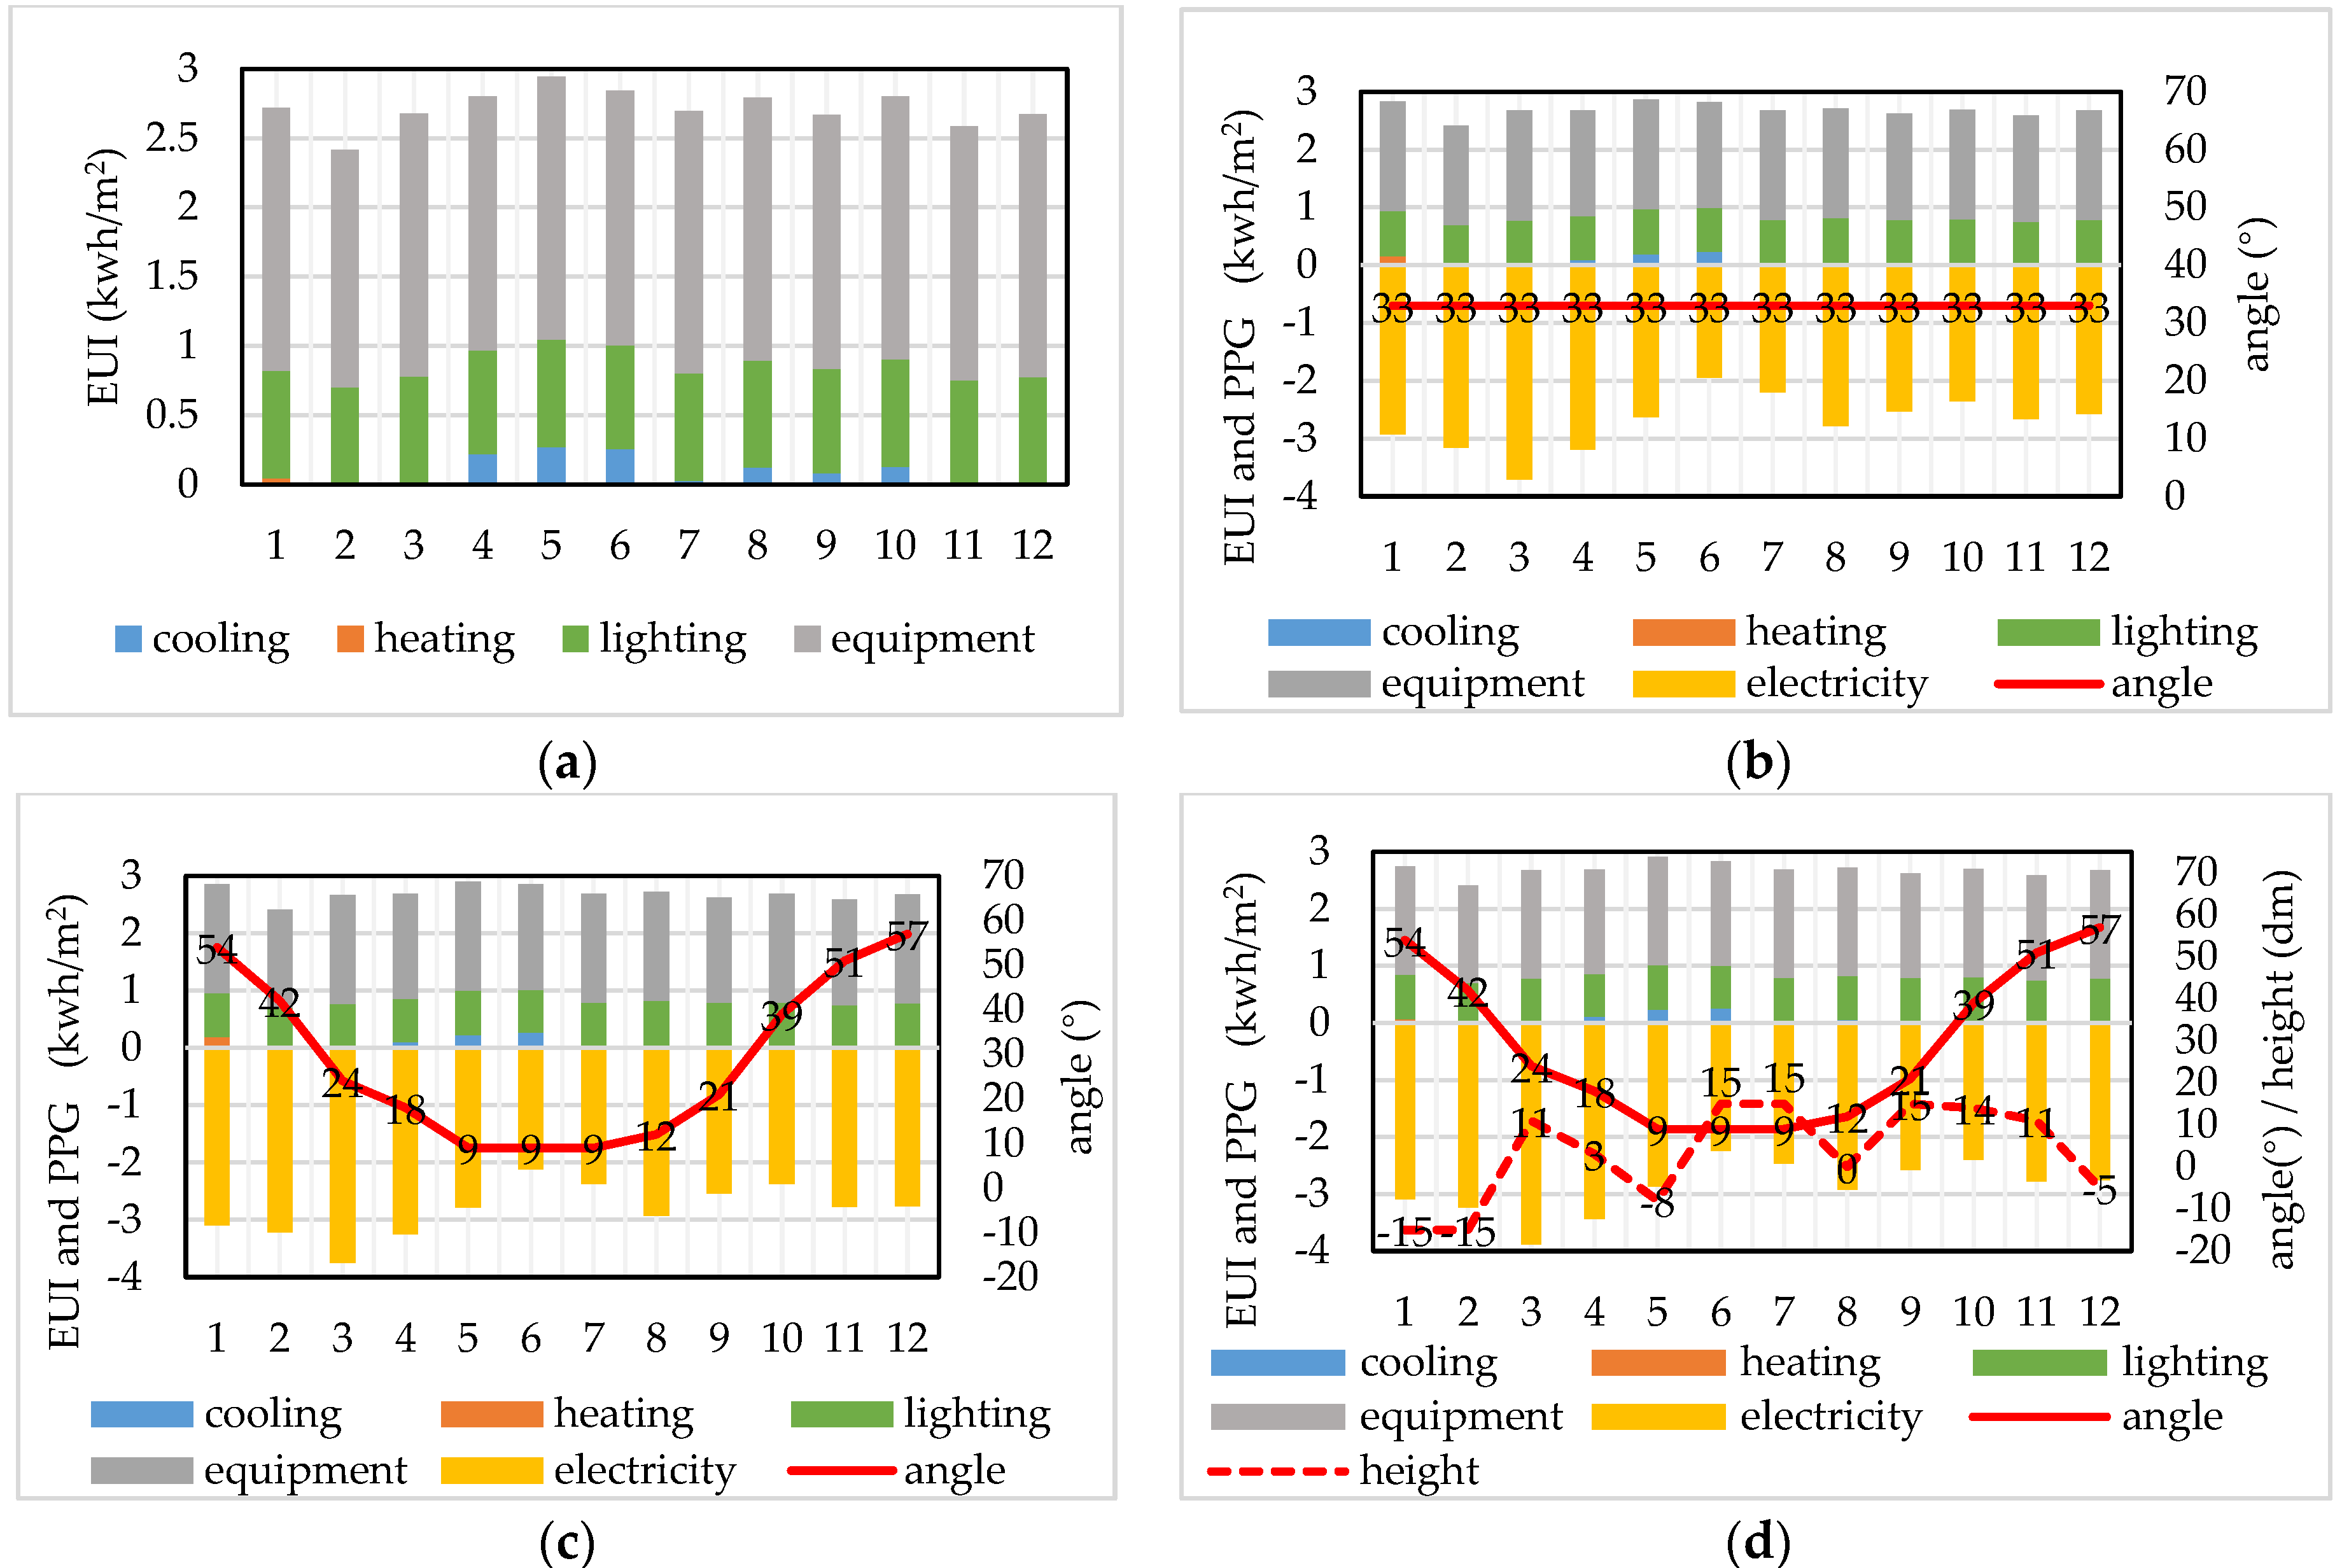
3.3.1. In Shenzhen
3.3.2. In Kunming
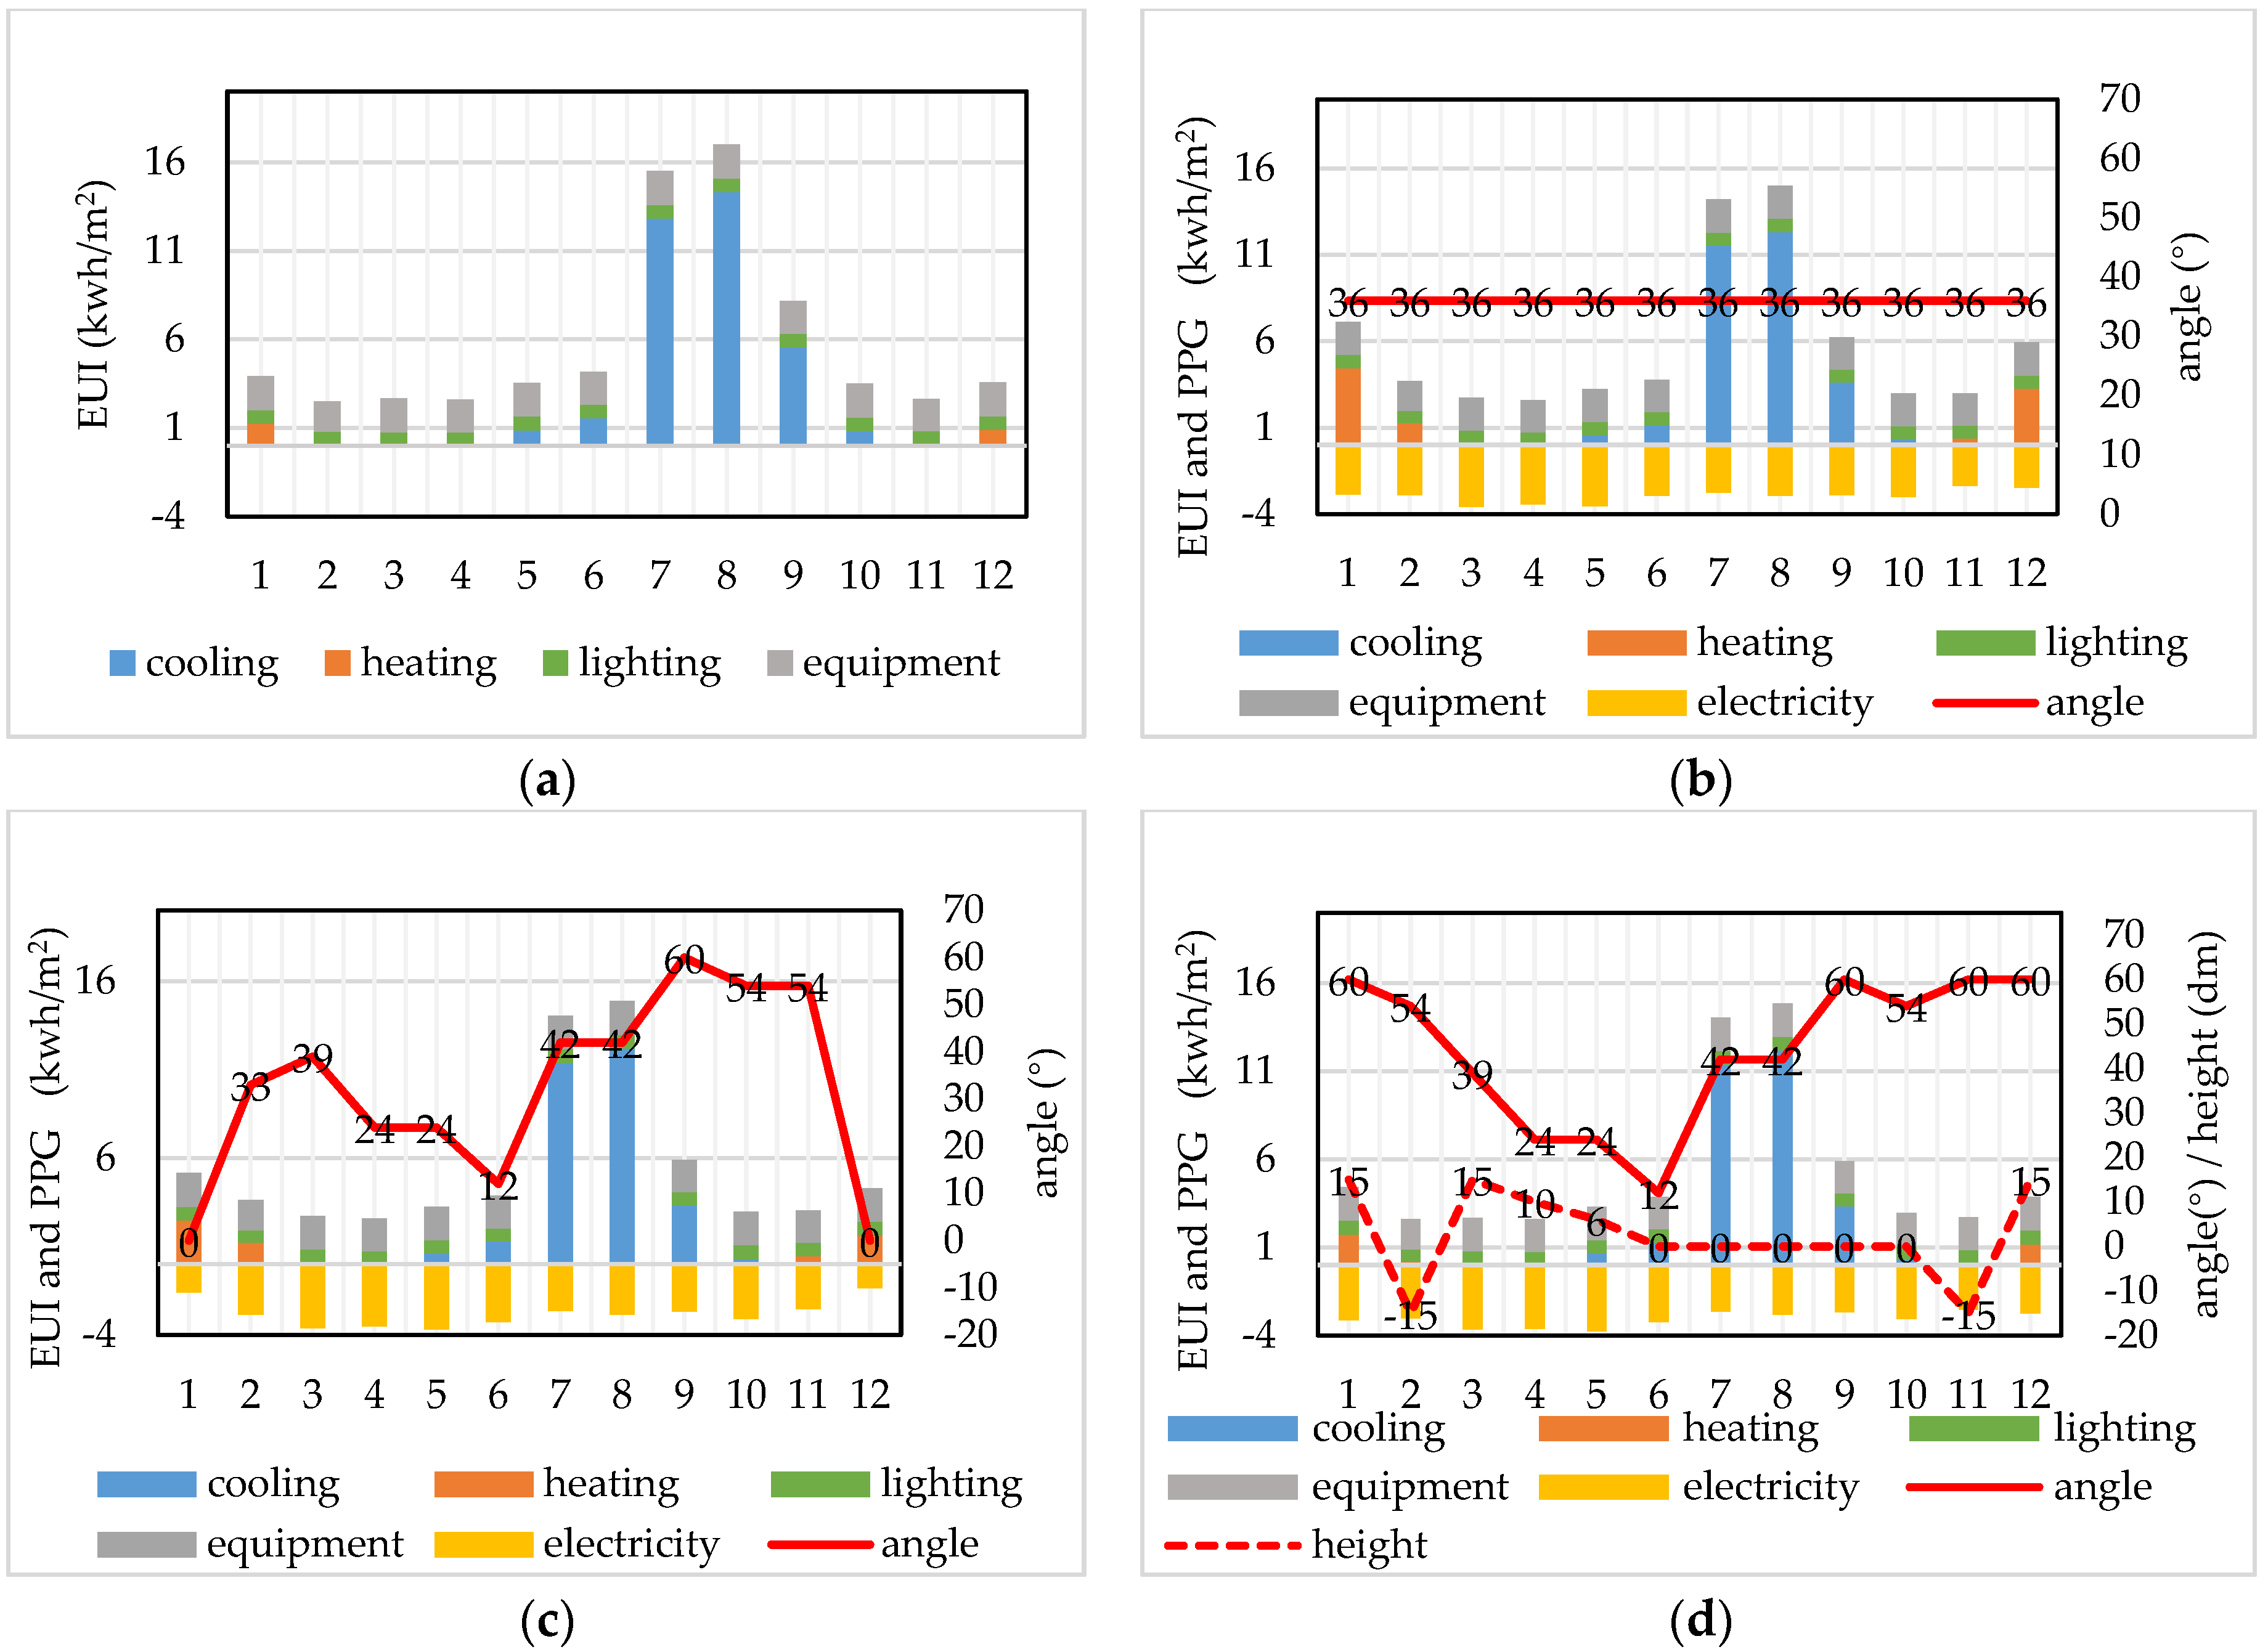
3.3.3. In Wuhan
3.3.4. In Qingdao
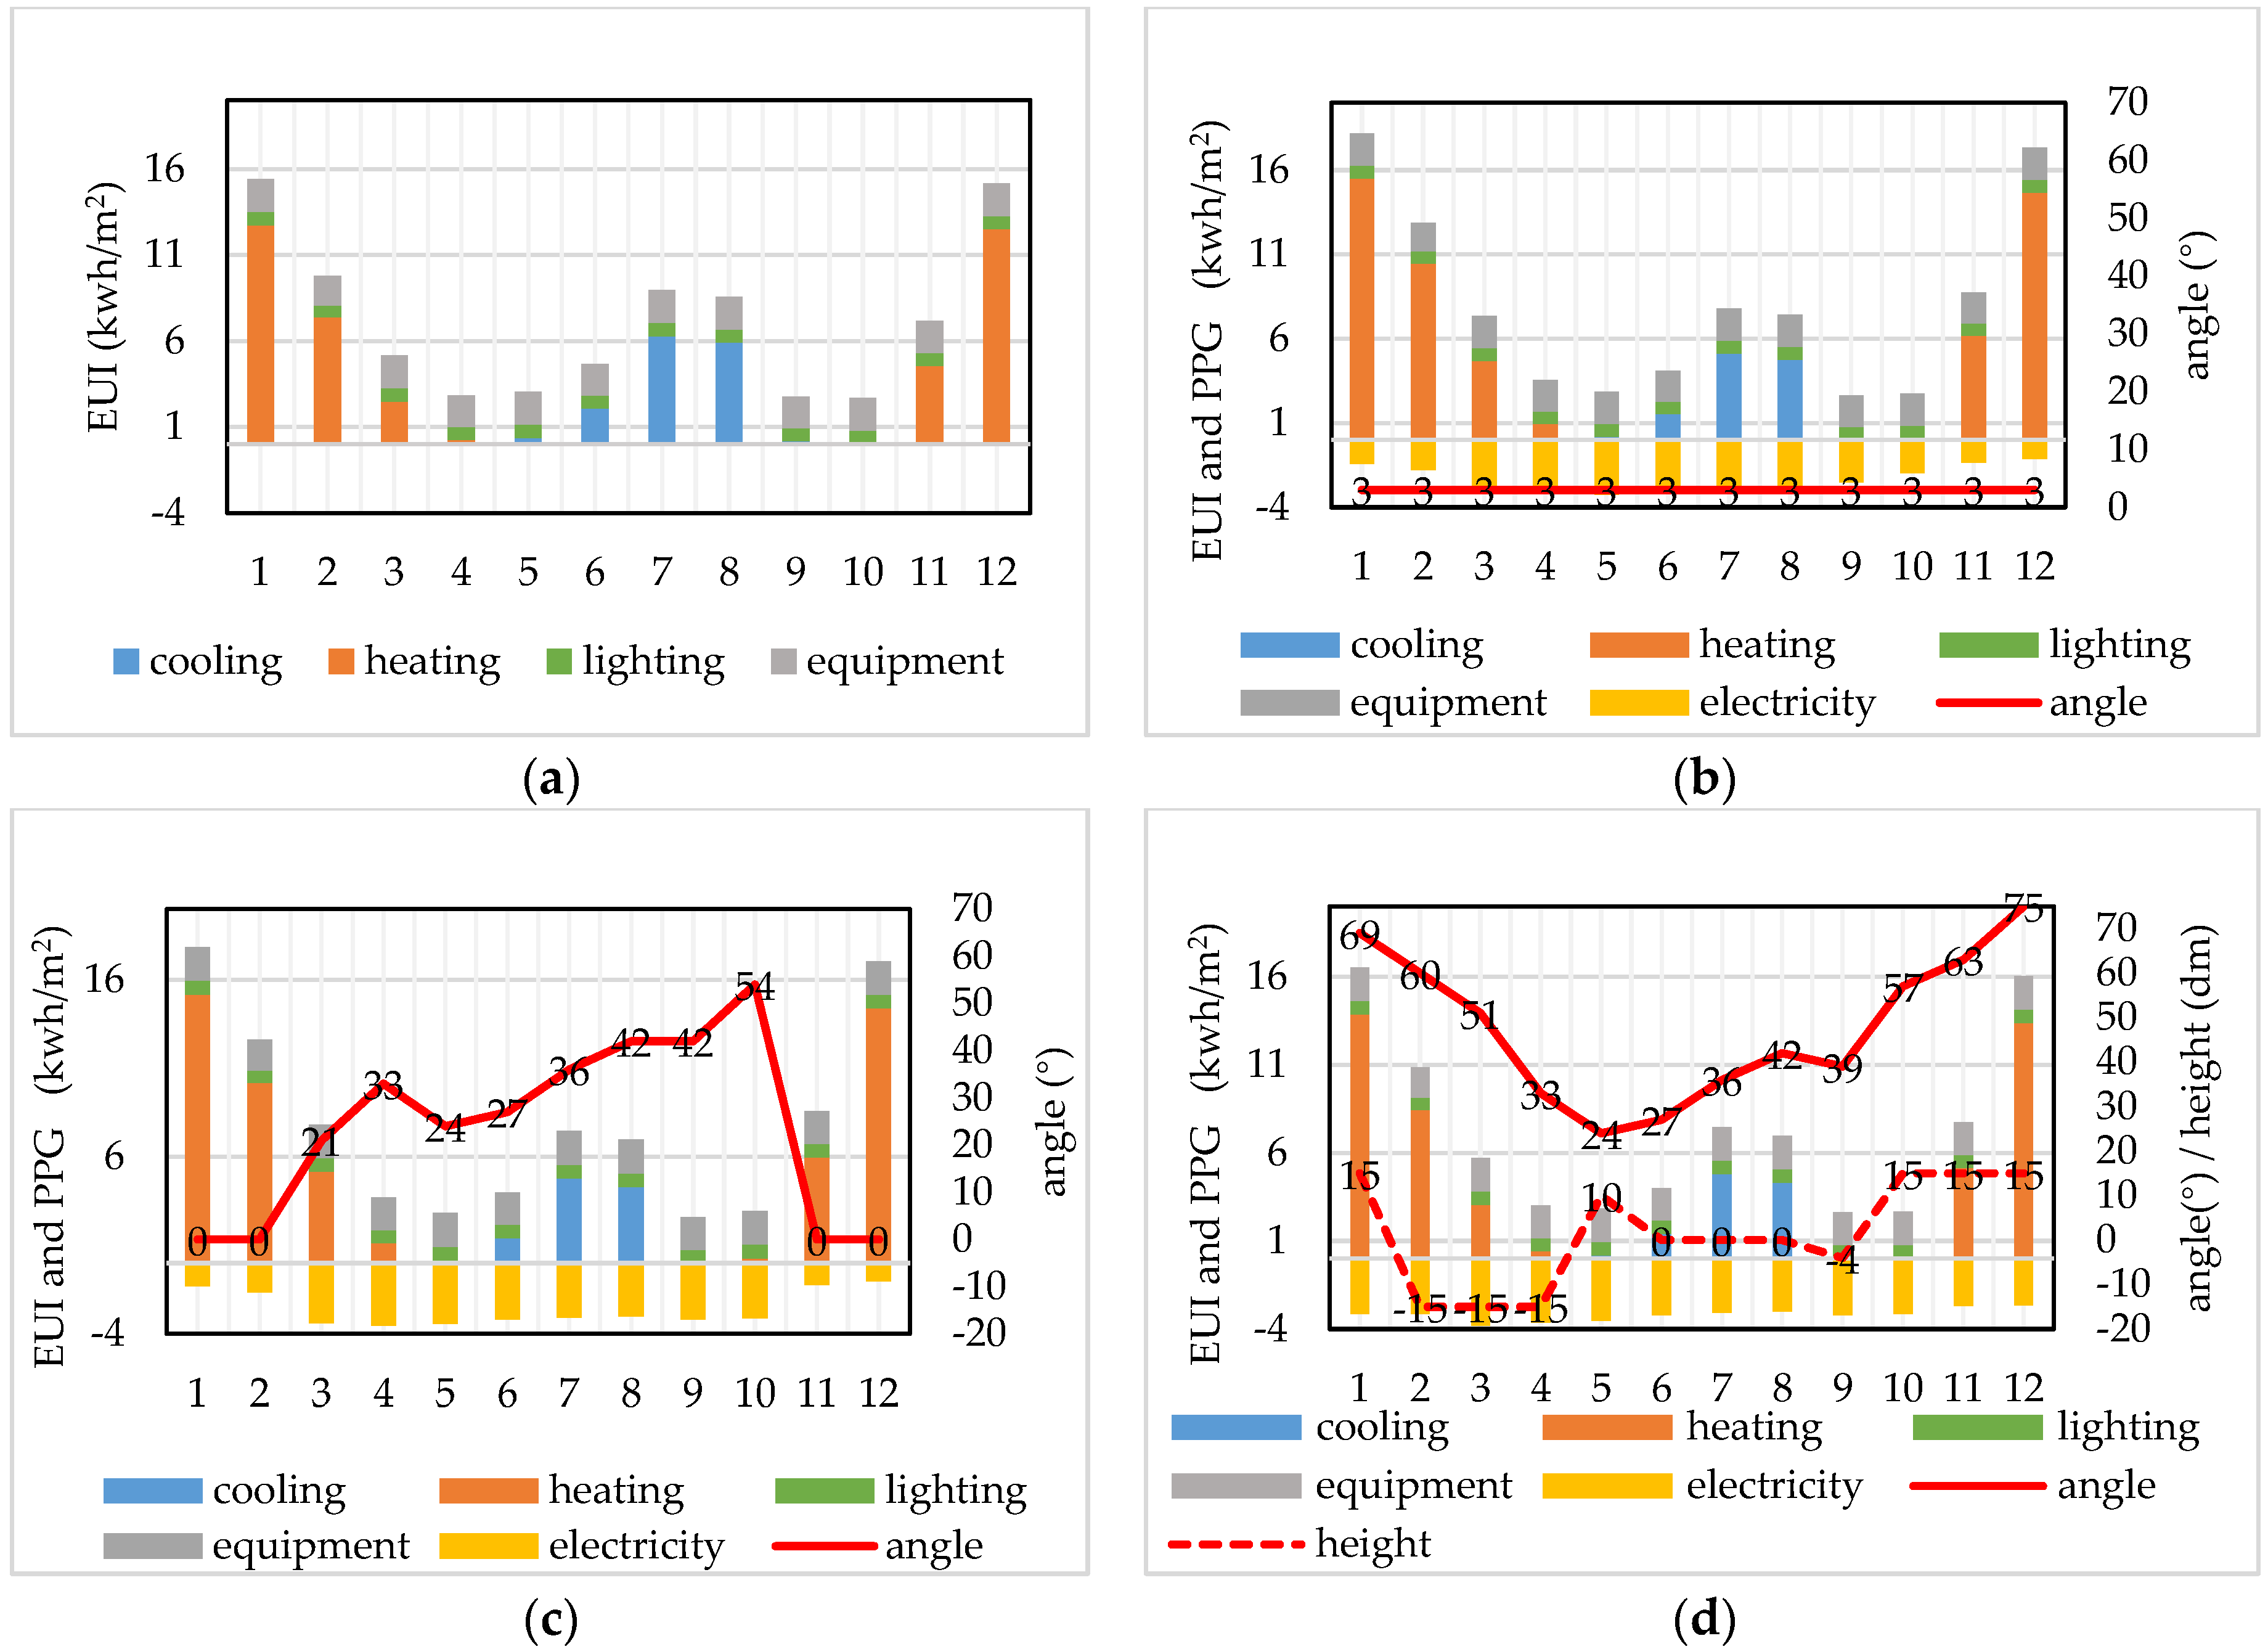
3.3.5. In Changchun
3.4. Energy Efficiency and Economic Feasibility
4. Discussion
5. Conclusions
Author Contributions
Funding
Data Availability Statement
Acknowledgments
Conflicts of Interest
References
- Building on the Past, Starting a New Journey to Address Climate Change Globally. Available online: http://www.gov.cn/gongbao/2020/issue_8786.htm (accessed on 12 December 2020).
- Notice of the State Council on the Issuance of the Action Plan for Carbon Peaking by 2030. Available online: http://www.gov.cn/gongbao/2021/issue_9406.htm (accessed on 24 October 2021).
- Che, X.-J.; Zhou, P.; Chai, K.-H. Regional policy effect on photovoltaic (PV) technology innovation: Findings from 260 cities in China. Energy Policy 2022, 162, 112807. [Google Scholar] [CrossRef]
- Hao, D.; Qi, L.; Tairab, A.M.; Ahmed, A.; Azam, A.; Luo, D.; Pan, Y.; Zhang, Z.; Yan, J. Solar energy harvesting technologies for PV self-powered applications: A comprehensive review. Renew. Energy 2022, 188, 678–697. [Google Scholar] [CrossRef]
- Kirimtat, A.; Tasgetiren, M.F.; Brida, P.; Krejcar, O. Control of PV integrated shading devices in buildings: A review. Build. Environ. 2022, 214, 108961. [Google Scholar] [CrossRef]
- Florio, P.; Peronato, G.; Perera, A.T.D.; Di Blasi, A.; Poon, K.H.; Kämpf, J.H. Designing and assessing solar energy neighborhoods from visual impact. Sustain. Cities Soc. 2021, 71, 102959. [Google Scholar] [CrossRef]
- Scognamiglio, A. A Trans-Disciplinary Vocabulary for Assessing the Visual Performance of BIPV. Sustainability 2021, 13, 5500. [Google Scholar] [CrossRef]
- Aguacil, S.; Lufkin, S.; Rey, E. Active surfaces selection method for building-integrated photovoltaics (BIPV) in renovation projects based on self-consumption and self-sufficiency. Energy Build. 2019, 193, 15–28. [Google Scholar] [CrossRef] [Green Version]
- Al-Masrani, S.M.; Al-Obaidi, K.M. Dynamic shading systems: A review of design parameters, platforms and evaluation strategies. Autom. Constr. 2019, 102, 195–216. [Google Scholar] [CrossRef] [Green Version]
- Singh, B.P.; Goyal, S.K.; Siddiqui, S.A. Analysis and Classification of Maximum Power Point Tracking (MPPT) Techniques: A Review. In Intelligent Computing Techniques for Smart Energy Systems—Proceedings of ICTSES 2018; Springer: Singapore, 2020; pp. 999–1008. [Google Scholar]
- Boito, P.; Grena, R. Application of a fixed-receiver Linear Fresnel Reflector in concentrating photovoltaics. Sol. Energy 2021, 215, 198–205. [Google Scholar] [CrossRef]
- Gupta, M.; Dubey, A.K.; Kumar, V.; Mehta, D.S. Experimental study of combined transparent solar panel and large Fresnel lens concentrator based hybrid PV/thermal sunlight harvesting system. Energy Sustain. Dev. 2021, 63, 33–40. [Google Scholar] [CrossRef]
- Agyekum, E.B.; PraveenKumar, S.; Alwan, N.T.; Velkin, V.I.; Shcheklein, S.E. Effect of dual surface cooling of solar photovoltaic panel on the efficiency of the module: Experimental investigation. Heliyon 2021, 7, e07920. [Google Scholar] [CrossRef]
- Agyekum, E.B.; PraveenKumar, S.; Alwan, N.T.; Velkin, V.I.; Adebayo, T.S. Experimental Study on Performance Enhancement of a Photovoltaic Module Using a Combination of Phase Change Material and Aluminum Fins—Exergy, Energy and Economic (3E) Analysis. Inventions 2021, 6, 69. [Google Scholar] [CrossRef]
- Agyekum, E.B.; PraveenKumar, S.; Alwan, N.T.; Velkin, V.I.; Shcheklein, S.E.; Yaqoob, S.J. Experimental Investigation of the Effect of a Combination of Active and Passive Cooling Mechanism on the Thermal Characteristics and Efficiency of Solar PV Module. Inventions 2021, 6, 63. [Google Scholar] [CrossRef]
- PraveenKumar, S.; Agyekum, E.B.; Velkin, V.I.; Yaqoob, S.J.; Adebayo, T.S. Thermal management of solar photovoltaic module to enhance output performance: An experimental passive cooling approach using discontinuous aluminum heat sink. Int. J. Renew. Energy Res. 2021, 11, 1700–1712. [Google Scholar]
- De Vries, S.B.; Loonen, R.C.G.M.; Hensen, J.L.M. Simulation-aided development of automated solar shading control strategies using performance mapping and statistical classification. J. Build. Perform. Simul. 2021, 14, 770–792. [Google Scholar] [CrossRef]
- Taveres-Cachat, E.; Lobaccaro, G.; Goia, F.; Chaudhary, G. A methodology to improve the performance of PV integrated shading devices using multi-objective optimization. Appl. Energy 2019, 247, 731–744. [Google Scholar] [CrossRef]
- Hofer, J.; Groenewolt, A.; Jayathissa, P.; Nagy, Z.; Schlueter, A. Parametric analysis and systems design of dynamic photovoltaic shading modules. Energy Sci. Eng. 2016, 4, 134–152. [Google Scholar] [CrossRef] [Green Version]
- Kosorić, V.; Lau, S.-K.; Tablada, A.; Bieri, M.; Nobre, A.M. A Holistic Strategy for Successful Photovoltaic (PV) Implementation into Singapore’s Built Environment. Sustainability 2021, 13, 6452. [Google Scholar] [CrossRef]
- Yang, R.J.; Zou, P.X.W. Building integrated photovoltaics (BIPV): Costs, benefits, risks, barriers and improvement strategy. Int. J. Constr. Manag. 2015, 16, 39–53. [Google Scholar] [CrossRef]
- Mofidi, F.; Akbari, H. Intelligent buildings: An overview. Energy Build. 2020, 223, 110192. [Google Scholar] [CrossRef]
- Lufkin, S. Towards dynamic active façades. Nat. Energy 2019, 4, 635–636. [Google Scholar] [CrossRef]
- Svetozarevic, B.; Begle, M.; Jayathissa, P.; Caranovic, S.; Shepherd, R.F.; Nagy, Z.; Hischier, I.; Hofer, J.; Schlueter, A. Dynamic photovoltaic building envelopes for adaptive energy and comfort management. Nat. Energy 2019, 4, 671–682. [Google Scholar] [CrossRef]
- Ramadan, A.; Kamel, S.; Hamdan, I.; Agwa, A.M. A Novel Intelligent ANFIS for the Dynamic Model of Photovoltaic Systems. Mathematics 2022, 10, 1286. [Google Scholar] [CrossRef]
- Kirimtat, A.; Krejcar, O.; Ekici, B.; Fatih Tasgetiren, M. Multi-objective energy and daylight optimization of amorphous shading devices in buildings. Sol. Energy 2019, 185, 100–111. [Google Scholar] [CrossRef]
- Ridha, H.M.; Gomes, C.; Hizam, H.; Ahmadipour, M.; Heidari, A.A.; Chen, H. Multi-objective optimization and multi-criteria decision-making methods for optimal design of standalone photovoltaic system: A comprehensive review. Renew. Sustain. Energy Rev. 2021, 135, 110202. [Google Scholar] [CrossRef]
- Fouad, M.M.; Shihata, L.A.; Morgan, E.I. An integrated review of factors influencing the perfomance of photovoltaic panels. Renew. Sustain. Energy Rev. 2017, 80, 1499–1511. [Google Scholar] [CrossRef]
- Akbari Paydar, M. Optimum design of building integrated PV module as a movable shading device. Sustain. Cities Soc. 2020, 62, 102368. [Google Scholar] [CrossRef]
- Krarti, M. Evaluation of PV integrated sliding-rotating overhangs for US apartment buildings. Appl. Energy 2021, 293, 116942. [Google Scholar] [CrossRef]
- Zhang, W.L.; Lu, L.; Peng, J.Q. Evaluation of potential benefits of solar photovoltaic shadings in Hong Kong. Energy 2017, 137, 1152–1158. [Google Scholar] [CrossRef]
- Sun, C.; Liu, Q.; Han, Y. Many-Objective Optimization Design of a Public Building for Energy, Daylighting and Cost Performance Improvement. Appl. Sci. 2020, 10, 2435. [Google Scholar] [CrossRef] [Green Version]
- Ladybug Tools, Food4rhino Apps for Rhino and Grasshopper. Available online: https://www.food4rhino.com/en/app/ladybug-tools (accessed on 11 January 2022).
- Barzegar Ganji, H.; Utzinger, D.M.; Bradley, D.E. Create and Validate Hybrid Ventilation Components in Simulation Using Grasshopper and Python in Rhinoceros. In Proceedings of the 16th IBPSA International Conference and Exhibition, Rome, Italy, 2–4 September 2019; pp. 4345–4352. [Google Scholar]
- Feng, K.; Lu, W.; Wang, Y. Assessing environmental performance in early building design stage: An integrated parametric design and machine learning method. Sustain. Cities Soc. 2019, 50, 101596. [Google Scholar] [CrossRef]
- De SousaFreitas, J.; Cronemberger, J.; Soares, R.M.; Amorim, C.N.D. Modeling and assessing BIPV envelopes using parametric Rhinoceros plugins Grasshopper and Ladybug. Renew. Energy 2020, 160, 1468–1479. [Google Scholar] [CrossRef]
- EnergyPlus™ Version 22.1.0 Documentation Application Guide for EMS. Available online: https://energyplus.net/assets/nrel_custom/pdfs/pdfs_v22.1.0/EMSApplicationGuide.pdf (accessed on 29 March 2022).
- General Code for Energy Efficiency and Renewable Energy Application in Buildings GB 55015-2021. Available online: http://www.jianbiaoku.com/webarbs/book/160785/4633673.shtml (accessed on 1 April 2022).
- BIPRO TD7G66M 10BB 132 Half-Cell. Available online: https://www.talesun.com/en/download/num/ (accessed on 29 March 2022).
- Climate.OneBuilding.Org. Available online: https://climate.onebuilding.org/default.html (accessed on 24 April 2022).
- Building Climate Zoning Standards GB 50178-93. Available online: http://www.jianbiaoku.com/webarbs/book/12519/2916745.shtml (accessed on 1 February 1994).
- Zeraatpisheh, M.; Arababadi, R.; Saffari Pour, M. Economic Analysis for Residential Solar PV Systems Based on Different Demand Charge Tariffs. Energies 2018, 11, 3271. [Google Scholar] [CrossRef] [Green Version]
- State Grid Corporation of China. Available online: http://www.sgcc.com.cn/ (accessed on 29 March 2022).


| Parameter Name | Quantity |
|---|---|
| Total floor area | 22.68 m2 |
| Window area | 3.9 m2 |
| Infiltration rate per area façade | 0.0006 m³/s·m2 |
| Number of people | 2 |
| Lighting load | 3.17 W/m2 |
| Equipment load | 3.88 W/m2 |
| Wall construction u-value | 2.2 w/m2·K |
| Window construction u-value | 5.5 w/m2·K |
| Residential Electricity | Shenzhen | Kunming | Wuhan | Qingdao | Changchun |
|---|---|---|---|---|---|
| Price (yuan)/kWh | 0.68 | 0.42 | 0.56 | 0.55 | 0.53 |
Publisher’s Note: MDPI stays neutral with regard to jurisdictional claims in published maps and institutional affiliations. |
© 2022 by the authors. Licensee MDPI, Basel, Switzerland. This article is an open access article distributed under the terms and conditions of the Creative Commons Attribution (CC BY) license (https://creativecommons.org/licenses/by/4.0/).
Share and Cite
Long, W.; Chen, X.; Ma, Q.; Wei, X.; Xi, Q. An Evaluation of the PV Integrated Dynamic Overhangs Based on Parametric Performance Design Method: A Case Study of a Student Apartment in China. Sustainability 2022, 14, 7808. https://doi.org/10.3390/su14137808
Long W, Chen X, Ma Q, Wei X, Xi Q. An Evaluation of the PV Integrated Dynamic Overhangs Based on Parametric Performance Design Method: A Case Study of a Student Apartment in China. Sustainability. 2022; 14(13):7808. https://doi.org/10.3390/su14137808
Chicago/Turabian StyleLong, Weifan, Xiaofei Chen, Qingsong Ma, Xindong Wei, and Qiao Xi. 2022. "An Evaluation of the PV Integrated Dynamic Overhangs Based on Parametric Performance Design Method: A Case Study of a Student Apartment in China" Sustainability 14, no. 13: 7808. https://doi.org/10.3390/su14137808