Article

A Vision-Based Collision Monitoring System for Proximity of Construction Workers to Trucks Enhanced by Posture-Dependent Perception and Truck Bodies’ Occupied Space

Department of Architectural Engineering, Dankook University, Yongin 16890, Korea
*
Author to whom correspondence should be addressed.
Sustainability 2022, 14(13), 7934; https://doi.org/10.3390/su14137934
Submission received: 8 June 2022 / Revised: 22 June 2022 / Accepted: 24 June 2022 / Published: 29 June 2022
(This article belongs to the Section Hazards and Sustainability)

Abstract

:
In the study, an automated visualization of the proximity between workers and equipment is developed to manage workers’ safety at construction sites using the convolutional-neural-network-based image processing of a closed-circuit television video. The images are analyzed to automatically transform a hazard index visualized in the form of a plane map. The graphical representation of personalized proximity in the plane map is proposed and termed as safety ellipse in the study. The safety ellipse depending on the posture of workers and the area occupied by the hazardous objects (trucks) enable to represent precise proximity. Collision monitoring is automated with computer vision techniques of artificial-intelligence-based object detection, occupied space calculation, pose estimation, and homography.

1. Introduction

Workers are at risk of safety-related accidents during construction, owing to the harsh environment of construction sites. In 2019, 1026 out of 5333 fatal injuries (approximately 20%) in the U.S. occurred at construction sites. The death rate is four times higher than that of construction workers in the U.S., accounting for 5%. In addition, nonfatal injuries are 29.2% higher than those of all other industries [1]. The leading causes of injuries are collisions with objects or equipment (32.8%), slips (31.1%), and falls (25.2%). These ratios intuitively demonstrate the need for the safety management of construction workers and the type of accident prevention studies needed. The collision between operating construction equipment, such as trucks, backhoes, loaders, etc., and workers has been issued as one of the typical accidents in construction sites; thus, proximity sensing for collision avoidance has been a highly focused-on research topic in the past decade. The research approach for collision avoidance is to estimate the physical distance between the locations of workers and equipment in the workspace. Wireless sensor-based technology and image processing are typically employed to estimate the location of target objects [2,3].
The most widely used wireless sensing for positioning is the Global Positioning System (GPS), which uses a satellite network to locate a target [4,5]. In addition, in order to improve the accuracy, research using signals such as Wi-Fi, Bluetooth, and Ultrasonic transmitted through an emitter at a location close to the construction-site level has been conducted [6]. Image analysis for positioning is represented as object detection in which workers and equipment are detected in an image and expressed in pixel coordinates. In the case of a 2D RGB camera, an object detection technique was been initiated from the filtering method, in which the object is extracted from the highly correlated part [7]. Recently, various object detection techniques using artificial neural networks have been actively developed [8,9,10]. In the case of 3D cameras such as stereo vision and Kinect, it is possible to obtain the direct distance from the camera to the object, so the object is recognized by using the difference in the distance between the background and the object [11,12].
In addition to location monitoring, workers’ behavior such as posture and movement influence the occurrence of accidents. Being a precursor to injuries and accidents, unsafe behavior is associated with workers’ stress and fatigue [13]. Wearable sensors attached to the wrists, feet, and waist of workers collect various information related to workers’ behavior; for example, workers’ actions can be detected using an accelerometer [14,15] and the health status of workers using musculoskeletal sensors [16]. Image processing is also an alternative to behavior and safety monitoring: it is possible to estimate changes in workers’ behavior from the changes in the detected object’s size in a sequence of images [17] and to record working behavior through the movement of the worker’s joints [18].
With the advancement of high-performance deep learning technology, recent studies on worker safety monitoring through the vision sensing of image processing have been conducted [19]. Deep learning enables image processing, such as detecting workers, equipment, and materials [20,21], extracting the motion of workers, and detecting abnormal behaviors that cause accidents; some examples of deep learning are convolutional neural network (CNN)-based multiple worker detection and tracking [22], the detection of workers without hard hats [23], the detection of unauthorized workers [24], the analysis of workers’ postures in various poses and changing backgrounds [25], the recognition of beams under construction and the detection of workers at risk of falling [26], and worker behavior analysis using recurrent neural network models [27].
When confining to collision monitoring, deep learning-based image processing for the detection and location of workers and equipment as well as the detection of abnormal behaviors of workers has been extended to the study of estimating the occurrence of collisions and the possibility of accidents of workers. A series of research achievements can be found in the literature; predicting the probability of collision from the distance calculated as the center coordinates of workers and equipment tends to underestimate real distance since the volume of equipment is ignored [22]; a direct use of the bounding box size, which is a result of deep learning-based detection, is suggested to consider the volume of equipment [28]. However, an intrinsic error induced due to the perspective being dependent on the position and angle of the camera exists, which reduces the accuracy of the detection of the volume of equipment.
In this study, in order to expand the scope of safety monitoring, which was previously limited to object detection and location recognition, a more realistic representation of workers’ safety with respect to collision with equipment is proposed by integrating three components: (1) identifying the location in space, (2) imposing the accurate volume of equipment, and (3) proximity sensing considering workers’ perception according to their posture. The monitoring algorithm proposed visually generates the proximity of hazardous objects to workers by applying CNN to the video. A CNN-based object detection and tracking technique, namely, YOLO, is conducted on consecutive images. The detected object is overlapped on the plane map created through homograph transformation to obtain the accurate distance between objects. For equipment, the volume is allocated by the moving location and direction estimated by YOLO. For workers, a CNN-based pose estimation technique, namely, OpenPose, is applied to determine their posture. Then, a safety ellipse is generated according to each worker’s perception. Proximity visualization was verified using closed-circuit television (CCTV) installed at a construction site.

2. Methodology

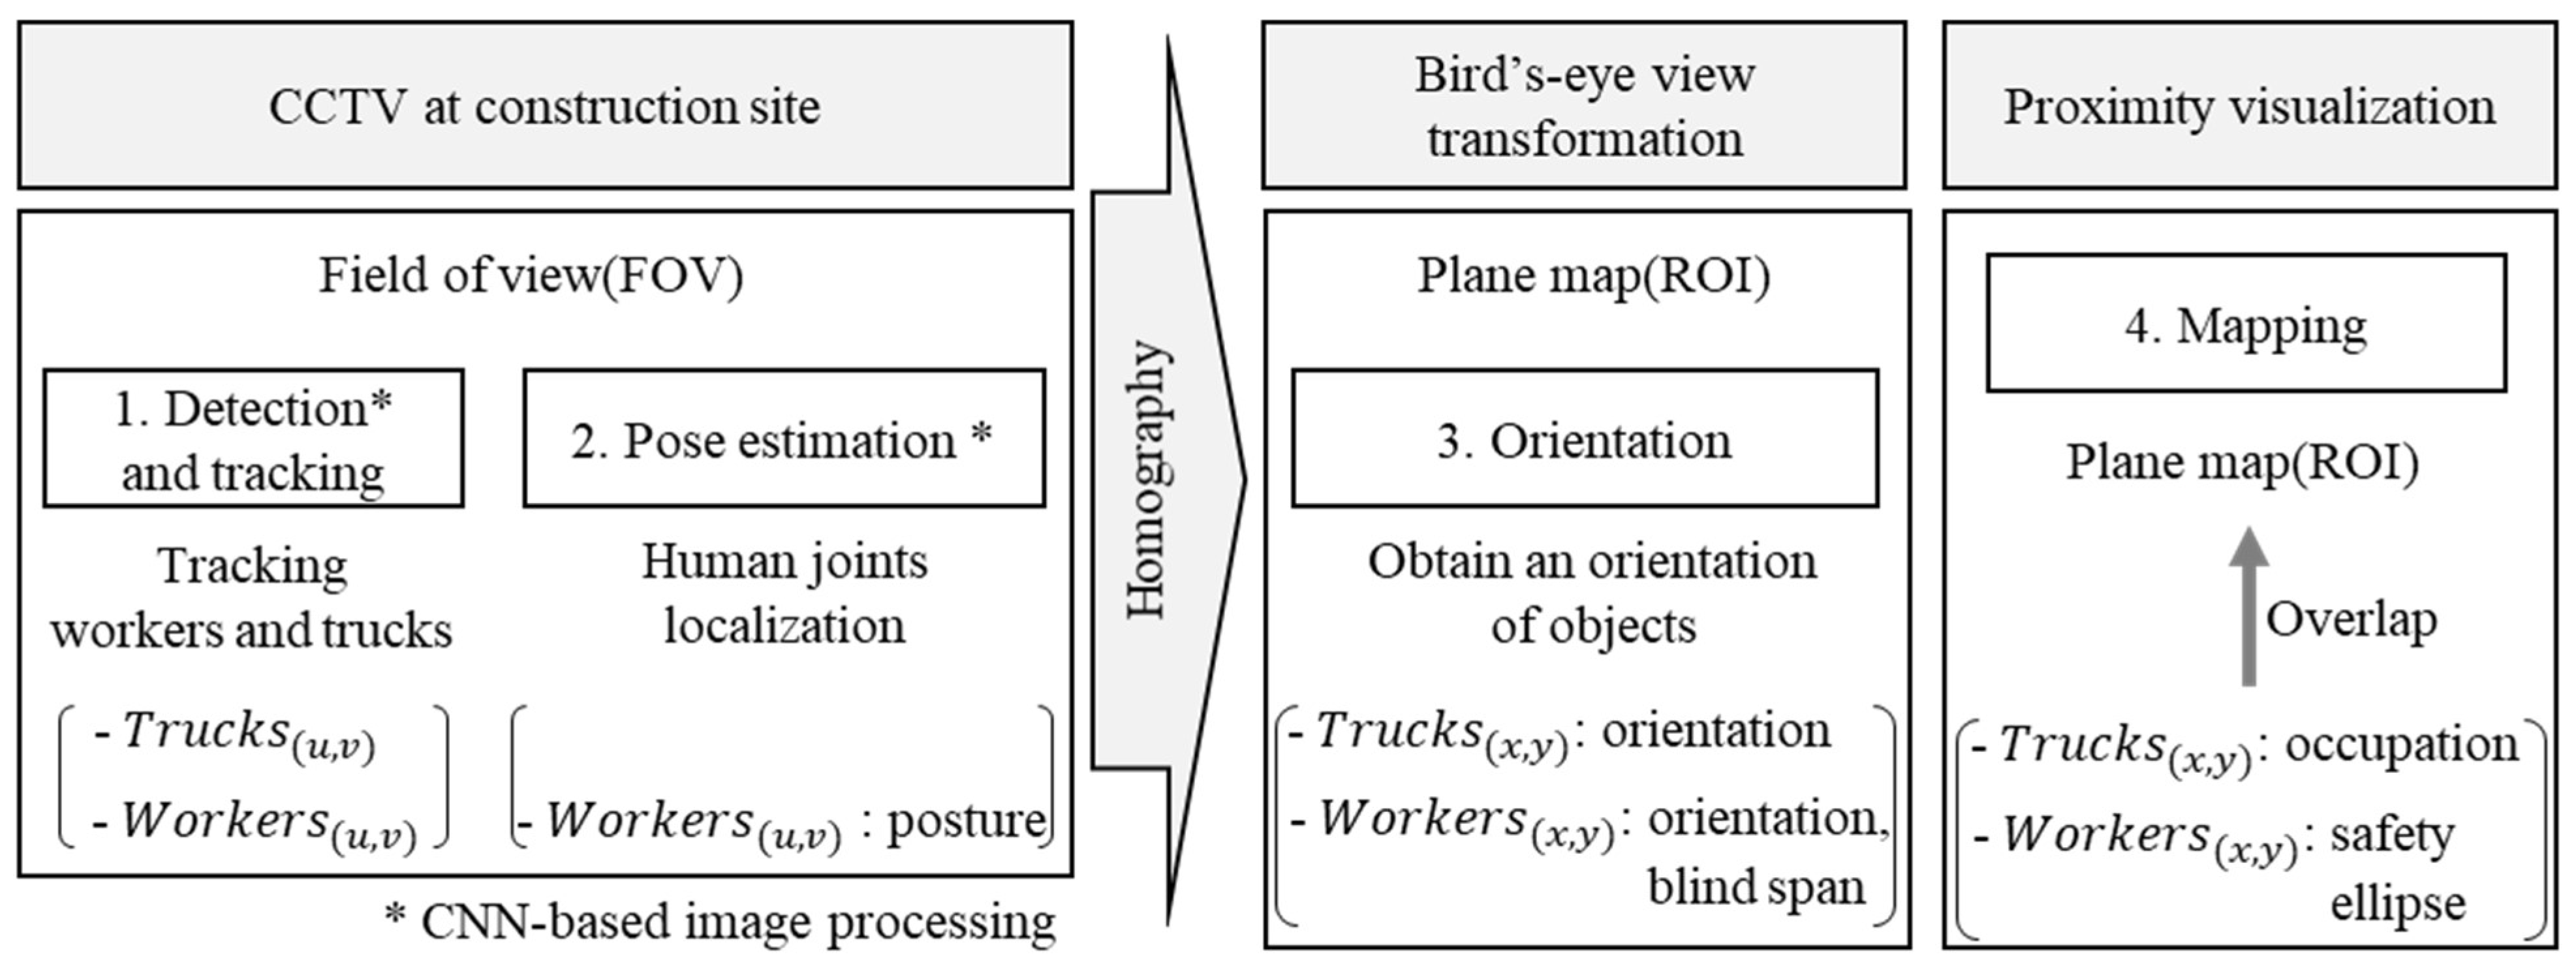
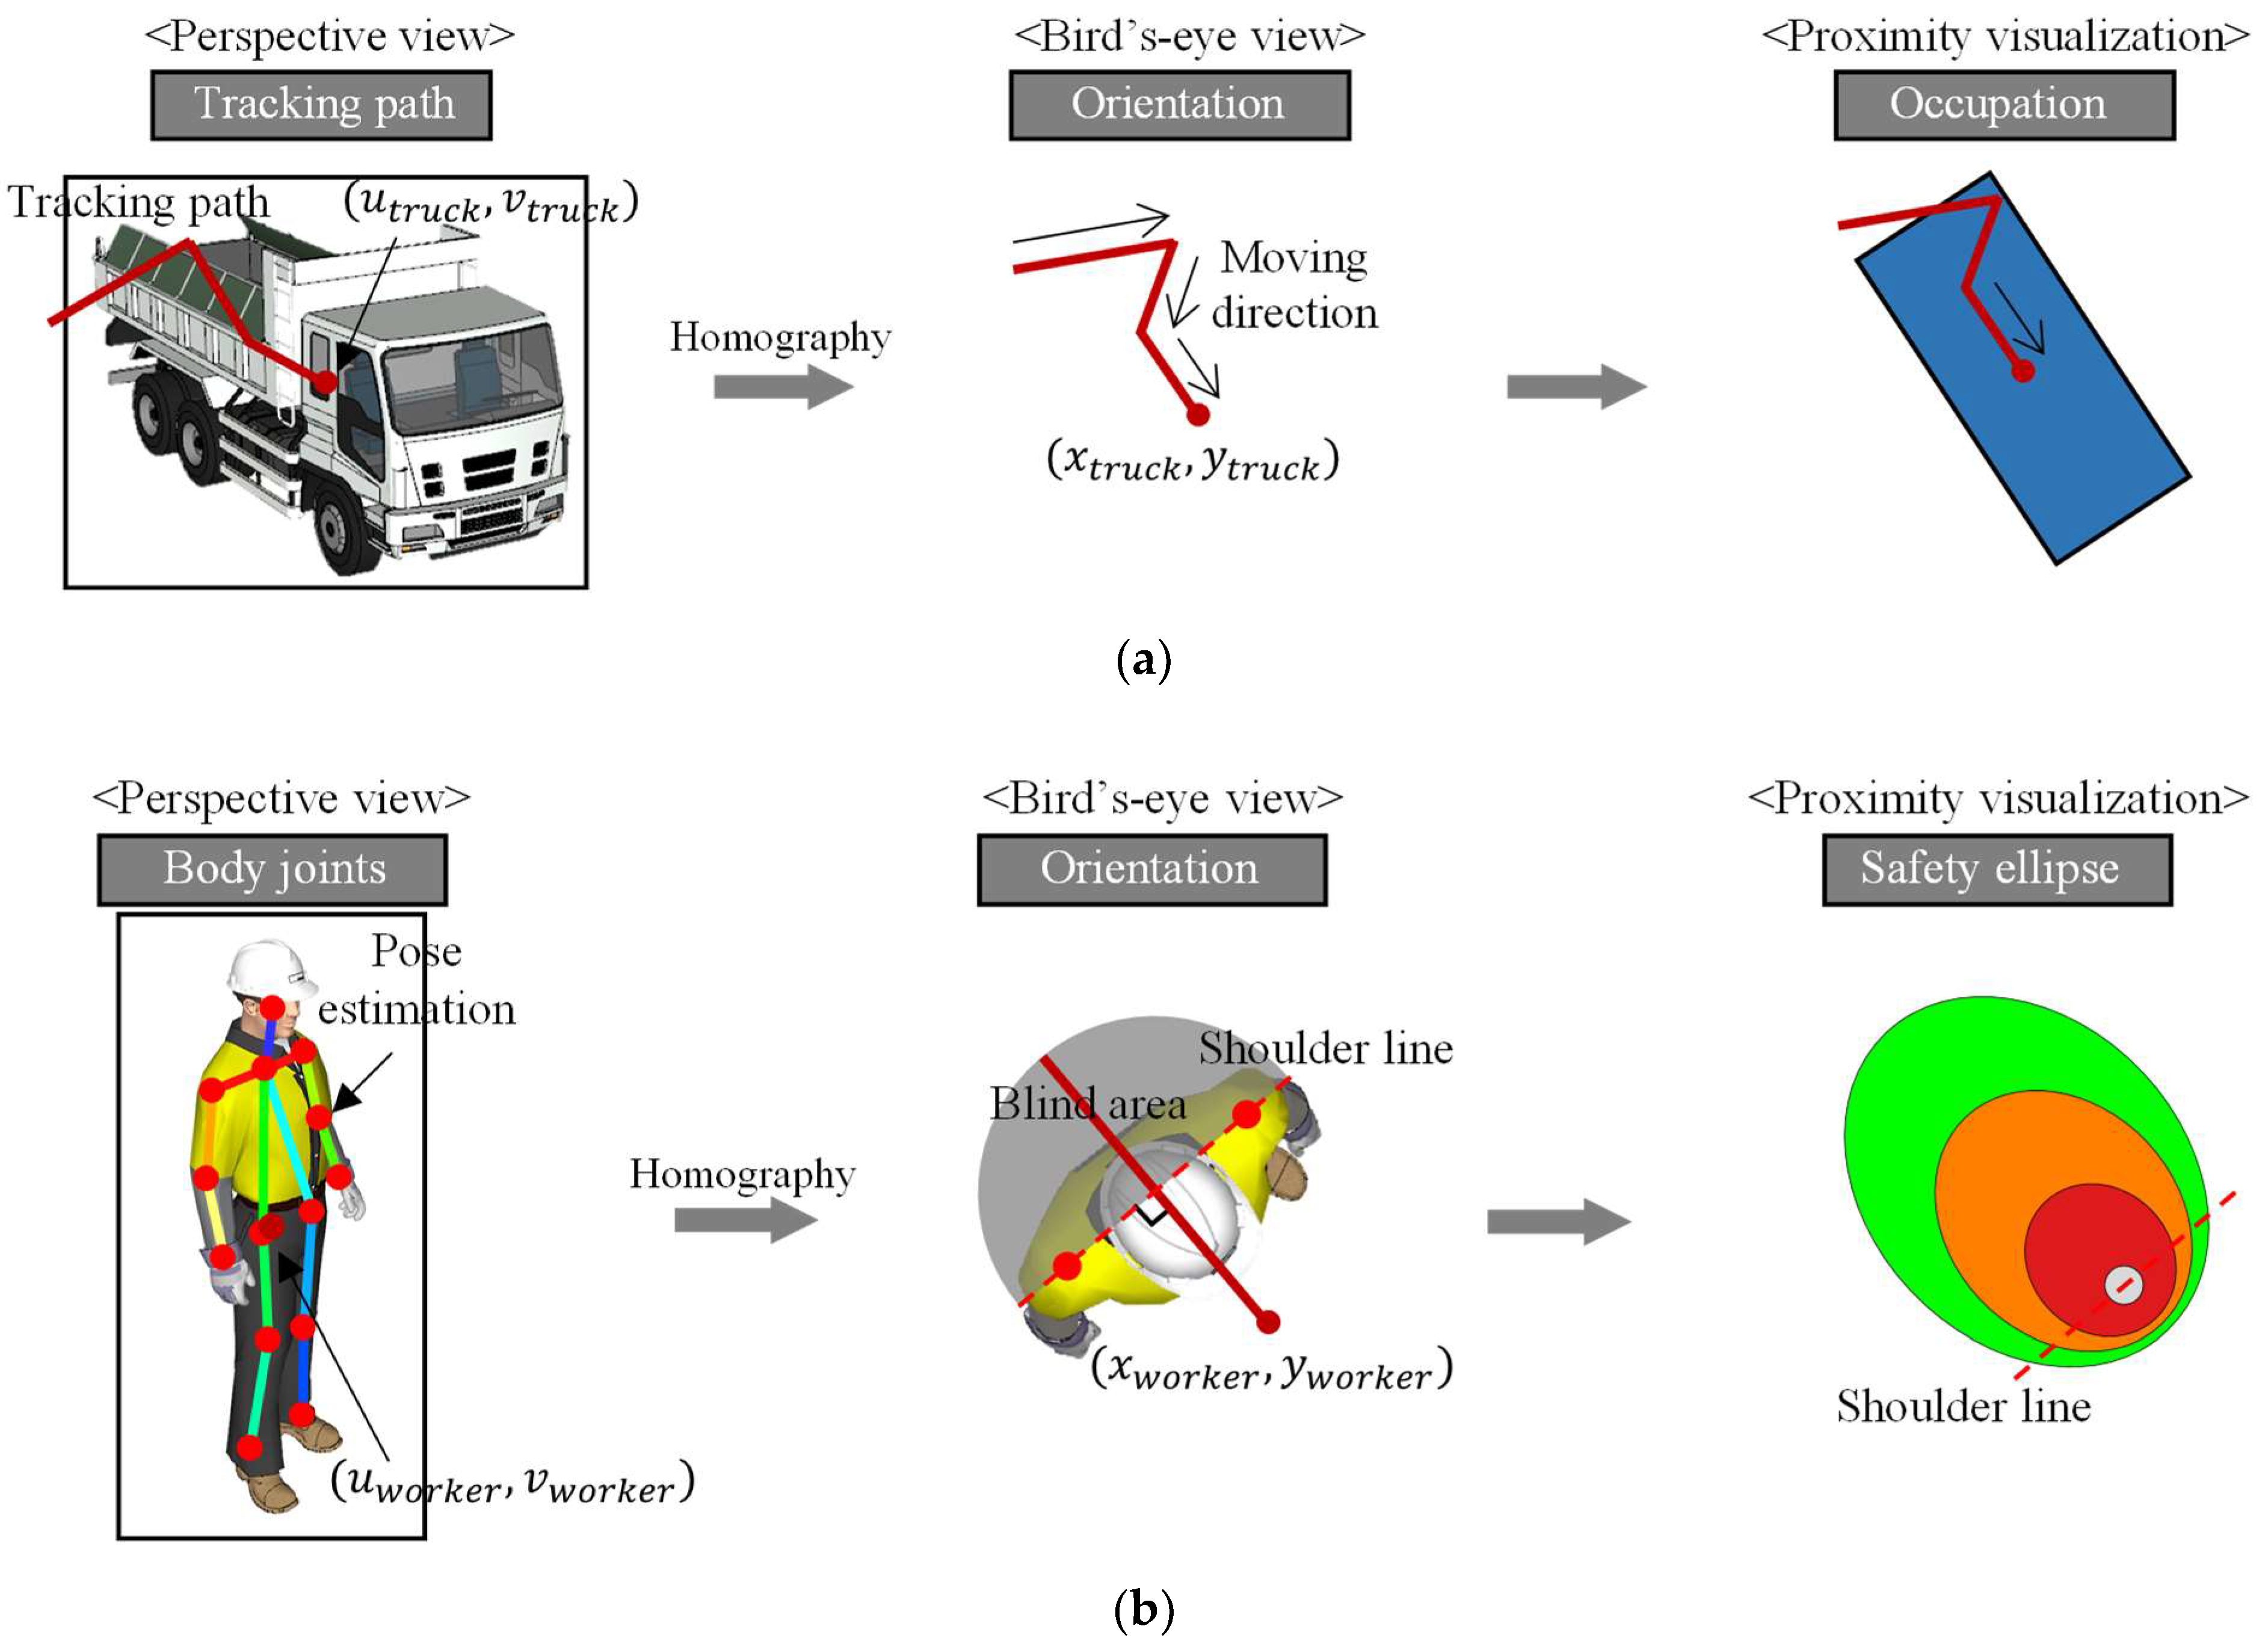
2.1. Vision-Based Proximity Visualization

In this study, an automated visualization of the proximity between workers and equipment is developed to visually express workers’ safety at construction sites. A CCTV installed at a construction site records information on workers, equipment, and construction progress, so the captured video images can be used for research studies. In addition, non-contact image sensing has the advantage of capturing multiple objects using a single camera without the need to attach additional sensors.
It is necessary to recognize workers and equipment in CCTV to prevent collisions between workers and equipment at construction sites. Because the collision risk of a worker can be defined as the proximity between the worker and equipment, the calculated distance between equipment and the worker is directly related to collision prevention. Equipment such as trucks have a direction; hence, the determination of the occupied space depending on the orientation can improve precision of the distance between equipment to workers. In addition, as the worker’s perception of equipment and the physical distance between the worker and equipment affects the worker’s safety, the risk of the worker’s vision angle should be reflected.
The process of generating the proximity visualization consists of four steps, as shown in Figure 1. First, the workers and trucks are detected and tracked in the CCTV images. Second, a posture determination algorithm utilizing pose estimation is applied to the workers, and the workers’ postures are obtained. Then, holography is applied to generate a plane map. Third, the plane map based on the region of interest (ROI) of the CCTV images, and the orientation and blind span of workers and trucks are obtained using bird’s eye view transformation. Finally, the space occupied by trucks based on area and the safety ellipse of workers based on blind spans are overlapped on the plane map to create proximity visualization.

2.2. Object Detection and Tracking

Object detection expresses the minimum range of an object in an image as a bounding box composed of four rectangular coordinates. Because the bounding box can convert the position of the visually expressed object into data, the local image processing of the object is conducted within the bounding box image. Thus, the center point of the bounding box can be defined as the only single pixel coordinate where the target object exists in the image. Among various object detection techniques of region-based CNNs (R-CNNs), YOLO-v3 [29] demonstrates object detection speed that is more than 100 times faster than that of Fast R-CNNs [30], thanks to two model structure updates from YOLO-v1 [31]. In addition, the YOLO-v3 model has the advantage of being able to learn universal objects well, so it has been recently adopted in various object recognition models in the construction field [32,33,34].
Tracking is focused on matching detected objects in neighboring frames. Vision-based object tracking algorithms include mean-shift-based, optical-flow-based, and Kalman-filter-based techniques based on image processing methods. The Kalman-filter-based technique is used for object tracking because it yields high accuracy, has a higher speed than the deep learning method, and requires no additional training.
The basic principle of the Kalman-filter-based object-tracking technique is to (1) predict the motion of a target object and then (2) correct the newly extracted location through the predicted motion to detect the same object in successive frames. Different tracking techniques are derived using the method for predicting the movement of an object or correcting the location information [35,36,37]. In this study, the velocity of detected objects is calculated for consecutive frames and formulated for the object position during the prediction stage. In addition, the predicted object is corrected based on the intersection-over-union score of the Gaussian covariance, considering the optical features of the detected objects.

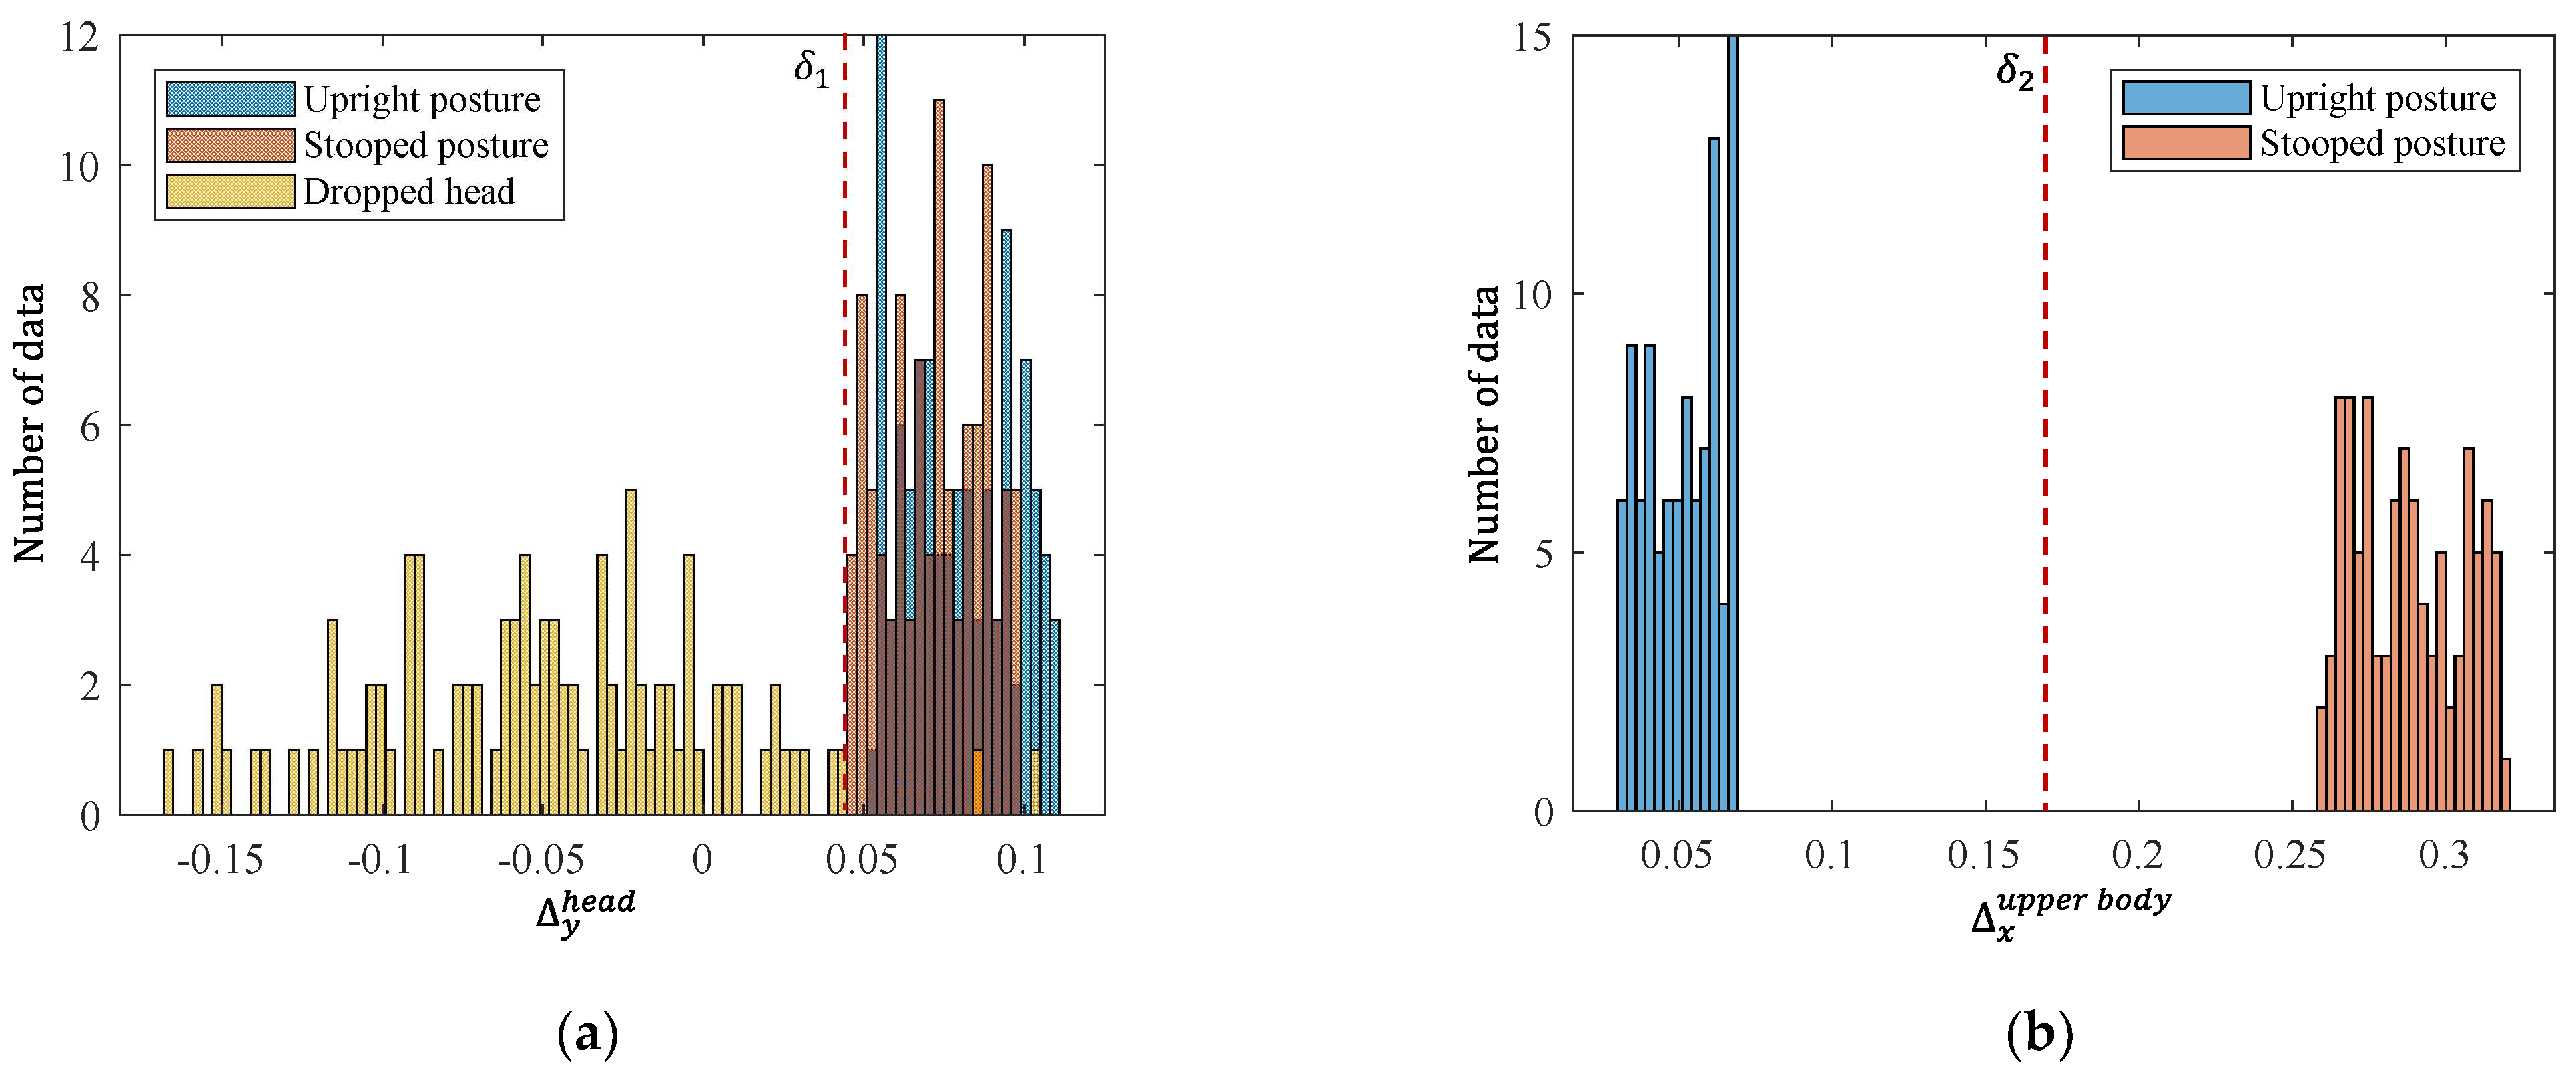
2.3. Posture Determination

Because the perception of a hazardous object, such as equipment, by a worker depends on the worker’s posture, a posture determination algorithm for determining posture was developed. The posture determination algorithm is based on human body joints obtained from pose estimation. During pose estimation, the human skeleton is acquired by connecting key points, such as the head, neck, shoulder, elbow, wrist, hip, knee, and ankle, which are human body parts. Worker posture is classified into “upright posture”, “stooped posture”, and “dropped head” state, and it is determined using a two-step discriminant based on the head, neck, and wrist coordinates. Discriminants for classifying a “dropped head” state and for classifying the “stooped posture” state when it is not in the “dropped head” state are shown in Figure 2.
First, a discriminant is determined to distinguish the “dropped head” state. The “dropped head” state refers to when the worker is looking at the ground. In this case, the head and neck coordinates are used, classified based on the vertical position of the head. The vertical position of the worker’s head is calculated as follows:
y h e a d = P t y h e a d P t y n e c k H b b o x  
where P t is the coordinate value of the key points generated through pose estimation, H b b o x is the height of the bounding box, and y h e a d is a constant that determines the position of the head. Pt is expressed as P t C o o r d i n a t e k e y p o i n t based on the body joint and the x- and y-coordinates of the image. P t y h e a d and P t y n e c k are the y values of the head and neck, respectively, and y h e a d consists of the difference between the two values. In addition, even with the same posture, it is normalized by H b b o x because the value is different for each perspective of the object. y h e a d determines the vertical position of the worker’s head and is classified into a “dropped head” state based on threshold value δ 1 .
Second, for workers not in the “dropped head” state, a discriminant is performed to distinguish the “stooped head” state. The “stooped head” state generally exists when a worker’s waist is bent to perform groundwork. Therefore, regardless of the position of the worker’s head, the “stooped head” state depends on the shape of the upper body. Hence, the neck and waist key points are used to distinguish them from the horizontal position of the upper body. The horizontal position of the worker’s upper body is calculated using Equation (2):
x u p p e r   b o d y = P t x n e c k P t x w a i s t H b b o x  
where P t x n e c k is the x value of the neck, P t x w a i s t is the x value of the waist, and x u p p e r   b o d y is a constant that determines the position of the upper body. The difference between the neck and waist, x u p p e r   b o d y , determines the horizontal position of the worker’s upper body and is divided into a “stooped posture” state based on threshold δ 2 . Because δ 1 and δ 2 are variables that depend on the position and angle where the image was captured, they are calculated using the heuristic determination of the actual CCTV (Section 4).

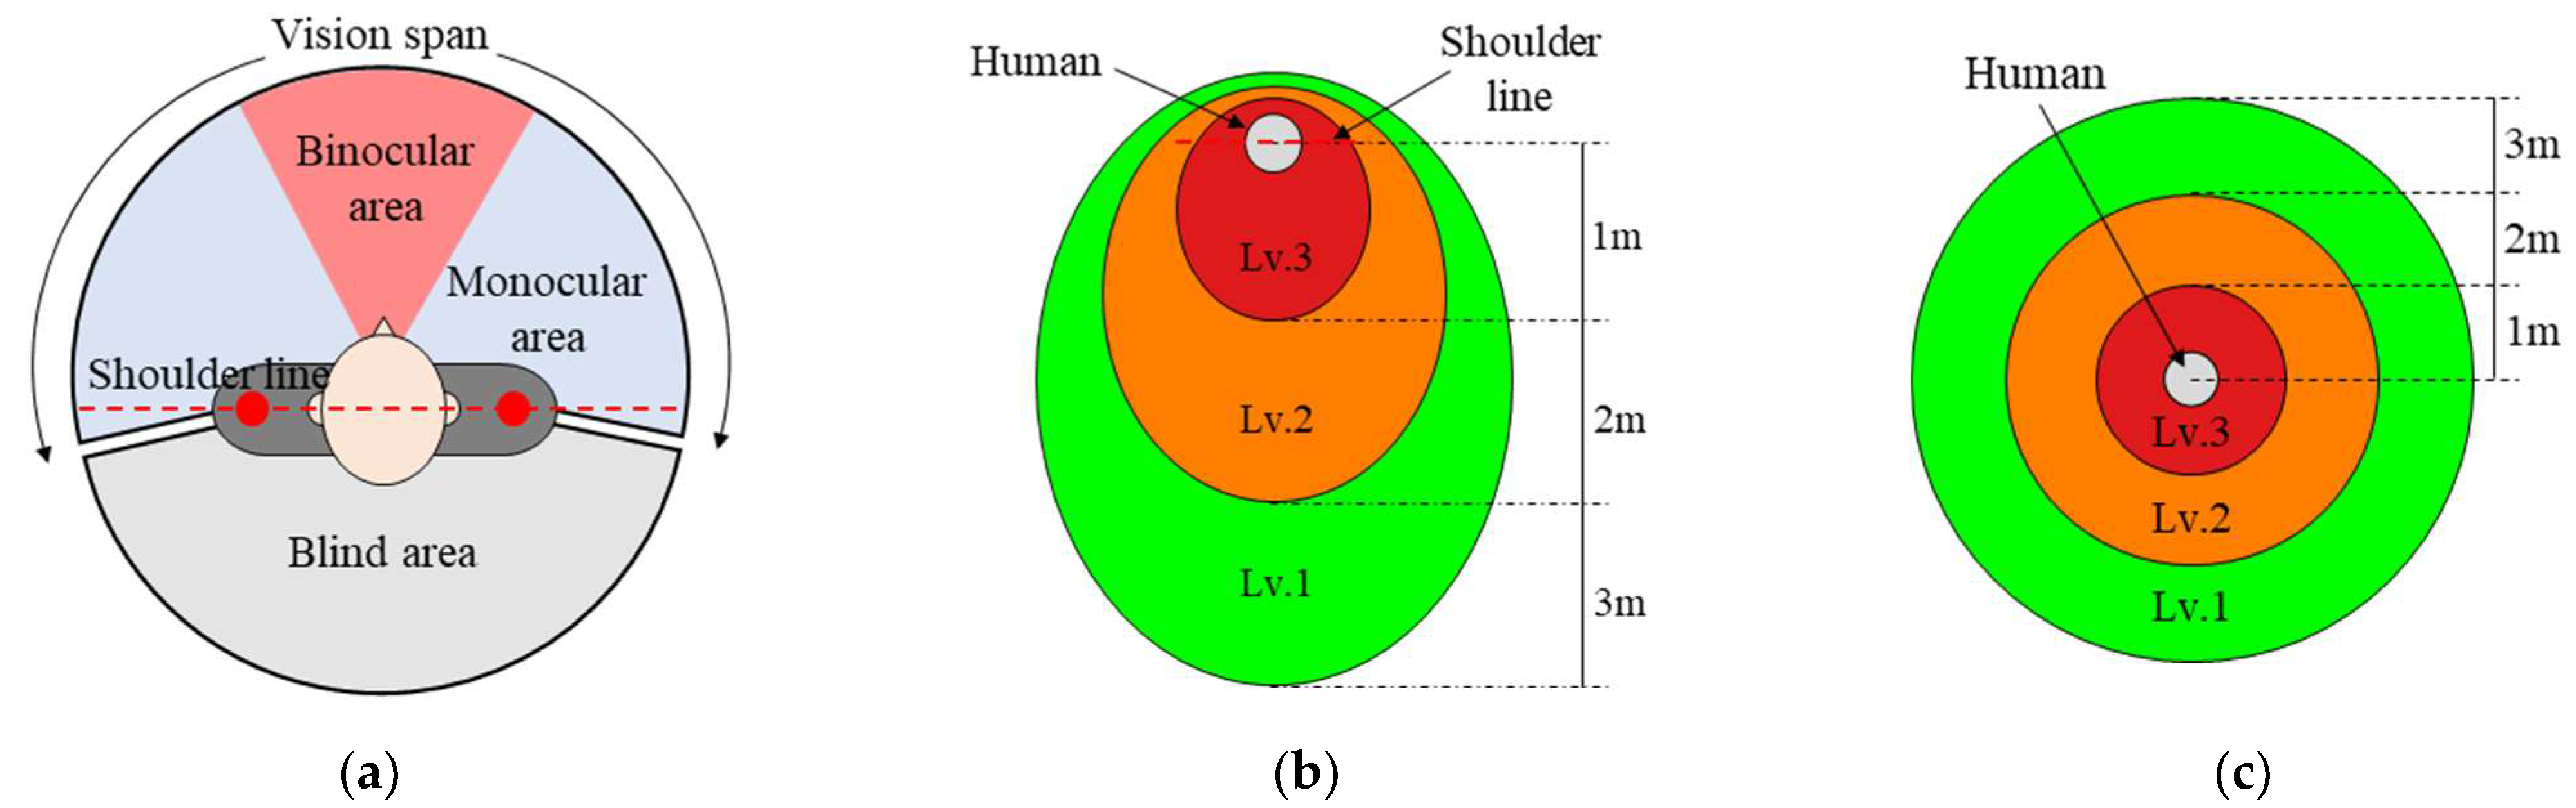
2.4. Perception-Based Safety Ellipse

Generally, the shoulder line depicted in Figure 3a is treated as an axis of visual perception [38]. The vision span is then divided into a binocular area, where both eyes overlap to distinguish the perspective of an object, and a monocular area, where one eye can see the object. The rest of the area, except the vision span, is the blind area, which is the rear part of the body based on the human shoulder line. As the binocular, monocular, and blind areas influence human perception, there is a difference in the perception level for each area. In this study, a safety ellipse concept reflecting the difference in perception based on the span is developed.
The risk of workers having accidents is low in the binocular area, increases in the monocular area, and is the most significant in the blind area based on the difference in perception. Hence, it is expressed as an ellipse based on distance from the worker, as shown in Figure 3b. In this study, the safety ellipse representing risk is divided into three levels and subdivided into 1 m segments by distance in the blind area with the most significant risk. In addition, if the worker looks at the ground, which is the most unfavorable condition for perceiving the approach of nearby hazardous objects, the risk is high in the 360° direction. Therefore, the danger area can be expressed as a circle rather than an ellipse (Figure 3c).

2.5. Plane-Map Generation

Typically, CCTV installed at a construction site is affected by the perspective view, in which the location and dimension cannot be measured directly. A bird’s eye view transformation of the perspective view to the top view, that is, a plane map, is necessary. Homography is an image processing method in which an image captured from a virtual angle is obtained using the corresponding point transformation relationship between two images, and a perspective view image can be transformed into a bird’s eye view image, as shown in Figure 4a. The transformed bird’s eye view is a virtual image that has not been photographed, but because it contains the same information as the plane map, normalized distance information can be obtained at all locations in the virtual image. An ROI consisting of at least four points is required to apply homography. The pixel coordinates (u, v) inside the ROI are converted into plane coordinates (x, y), as shown in Figure 4b.
The plane map is mainly composed of entities of trucks and workers in this study. When tracking is completed in the case of a truck, a tracking path of the truck, a concatenated line of the center point ( u t r u c k , v t r u c k ) of the bounding boxes in every frame, is determined. In the plane map, location ( x t r u c k , y t r u c k ) and moving direction, termed as the orientation of the truck in this study, are identified. Given the dimension of the truck detected, it is mapped into the plane coordinates subjected to the orientation (Figure 5a).
In the case of a worker determined to be in the “upright posture” state by the pose determination algorithm, the orientation of the worker is acquired in the perpendicular direction of the shoulder line, as the shoulder points acquired by pose estimation are converted to a bird’s eye view through homography. A safety ellipse is generated in the blind area direction based on the shoulder line at the plane map ( x w o r k e r , y w o r k e r ) point, where center point ( u w o r k e r , v w o r k e r ) of the bounding box is converted (Figure 5b). A proximity visualization of the degree of safety based on the distance between workers and trucks is developed by overlapping the plane map with the space occupied by the truck and the safety ellipse of the worker.

3. Results

A program of proximity visualization was developed and executed in the study. Its feature and sample video file were as follows: The algorithm testing hardware was an NVIDIA GeForce RTX 2080 Ti graphics processing unit. CCTV videos were acquired from CCTV installed for security at a construction site of apartment houses in Seoul, Korea. The video shot at 30 fps, and 1280 × 720 high-definition images were resized to 640 × 360 for processing. A total of 12 min of the recorded videos were analyzed, some of which are presented in this paper. A YOLO v3 pretrained model trained on a coco data set [39] with an image size of 608 × 608 was used to detect workers and trucks. In the coco class, ID #1 person was set as the worker, and ID #7 truck was set as the hazardous object. OpenPose was used for worker pose estimation [40].
The Kalman-filter-based object-tracking technique was implemented; velocity was calculated from the identical objects that were determined by the aforementioned highest Gaussian covariance in two consecutive images. In case of failure of object detection in the neighbor frames, the velocity estimated by the Kalman filter was utilized to locate the objects in the frames. However, objects were labelled with new numbers after five failures of frames in a row.

3.1. Posture and Orientation

A heuristic classification was applied to set discriminant δ 1 and δ 2 of the posture determination algorithm to generate an automated safety ellipse. The heuristic classification process was as follows: (1) Samples of worker images for object detection were manually classified based on the postures. (2) y h e a d , x u p p e r   b o d y , and the orientation were calculated and labeled for each image. The discriminants were determined by classifying the labeled values for each image.
Worker images were extracted from the 12 min-long video and then 100 images were classified for each posture. For labeling, y h e a d and x u p p e r   b o d y were identified based on the image name written in the json file in the format, {“key”: “value”}. For the images of standing workers, the orientation was also expressed. Some images and labels for each posture are presented in Table 1.
Classifications were performed to determine the discriminants from the labeled images and are summarized in Figure 6. Images were classified by y h e a d to determine the worker holds the head high. For “upright posture”, “stooped posture”, and “dropped head”, their values ranged from 0.051 to 0.111, from 0.045 to 0.099, and from −0.168 to 0.442, respectively. When δ 1 was set to 0.047, the “dropped head” state were clearly distinguished from the “upright posture” and “stooped posture” states. The images were classified based on x u p p e r   b o d y to separate the “upright posture” and “stooped posture” states. The values ranged from 0.033 to 0.069 and from 0.261 to 0.321, respectively, for the “upright posture” and “stooped posture” states. Both states were distinguished by setting δ 2 to 0.17. Therefore, the three worker postures were classified using two discriminants.

3.2. Image Processing

A representative image for explaining our software is depicted in Figure 7. As the first step for creating the plane map, the objects detected by YOLO were assigned unique numbers and colors for the same objects in the video through object tracking (Figure 7a). Next, an 8 m × 8.4 m ROI was set to apply homography to the image with object detection, and tracking was applied. Subsequently, a plane map was generated using the transform matrix calculated from the ROI. Coordinates (u, v) in the original image were reconstructed into (x, y) coordinates in the plane map.
The orientations of the truck and worker were extracted to determine the truck’s occupied space and the worker’s safety ellipse, respectively (Figure 7b). The detection noise generated in the bounding box was removed by applying a moving average for 90 frames to the tracking path of Truck-9. After the truck’s occupied space of 1.5 m × 3.5 m was input, a truck-sized rectangle was overlapped on the plane map. For Person-10 and Person-2 with OpenPose applied, safety ellipses were generated on the plane map. The determinants of δ 1 and δ 2 for classifying the worker’s posture were set to 0.047, 0.17, and 0.9162, respectively, as in the above study. Because Person-10 was determined to be a standing worker, the safety ellipse according to the shoulder angle was generated. However, for the Person-2 worker, who dropped their head, the circular type was generated as the safety ellipse.

3.3. Results in Sequential Images

Figure 8 shows the sequential results of the proposed proximity visualization. Figure 8a–e were captured sequentially from the CCTV images. The ROIs for generating the plane map, truck’s occupied space, moving average interval of the tracking path, and thresholds for determining the orientation were as aforementioned. Initially, one truck and three workers were detected and tracked in the CCTV image (Figure 8a). Unique random numbers and colors were assigned to each object, and a tracking path was generated based on the center point of the bounding box. On the plane map, one truck and two people in the ROI overlapped. The safety ellipse overlapped the truck with the worker’s posture in the neighboring frame, that is, a situation when the hazardous object approached where there was no worker’s field of view (Figure 8a). Figure 8b is a frame image captured a few seconds after that in Figure 8a. Two workers were initially standing in front of the truck (Figure 8a). A few seconds later (Figure 8b), the truck was still in front of Person-2, but because the worker was looking at the ground and working, the safety ellipse of Person-2 was expanded in all directions. Moreover, the truck’s occupied space was invaded up to the Lv.2 range of the safety ellipse. After some time had passed, Truck-9 remained in the ROI, but after all the workers exited from the screen, a new worker with a new number and a new color appeared on the screen (Figure 8c). After the worker went out of the screen, a new truck was captured, and the orientation was calculated (Figure 8d). The two trucks were represented with different colors but with the identical area preset in the study. After one of the trucks moved away from the screen, two new workers entered (Figure 8e). Person-48 was the same person as Person-10 in Figure 8a—because the worker came back after exiting from the screen, the worker was detected as a new person.

4. Conclusions

In this study, a novel automated proximity visualization technique that visually expresses the approaching of hazardous objects to workers was developed using the CCTV video of a construction site to monitor construction workers’ safety. The visualization technique for workers’ safety is composed of identifying the location in space, imposing the accurate volume of equipment, and proximity sensing considering workers’ perception according to their posture.
First, object detection is conducted on the workers and hazardous objects (the trucks) to generate the proximity visualization. Second, object tracking is performed, and for trucks, the orientation is simultaneously calculated based on the tracking path. In the case of workers, after pose estimation is applied to extract the orientation, a safety ellipse is created based on the developed posture estimation algorithm. Third, the worker and truck are overlapped on the plane map with the actual dimensions through camera calibration. In the plane map, the worker and truck, for which the safety ellipse and occupied space are calculated, respectively, are monitored.
As a showcase of the method proposed in the study, a CCTV video file of a construction site was processed, and its results are presented with a detailed explanation in the paper; a YOLO v3 pretrained model was utilized for object detection, and OpenPose was used for pose estimation. In the 12 min long video file, all image frames were successfully converted for proximity visualization. Up to two workers and two trucks were detected and marked with safety ellipses and areas, respectively, in the plane. The proposed method shows advanced collision risk monitoring by considering the truck’s volume and the worker’s perceived field of view. In the future, the proposed system could be applied to CCTV cameras considering various places and angles.

Author Contributions

Conceptualization Y.-S.S. and J.K.; Formal analysis Y.-S.S.; Methodology Y.-S.S. and J.K.; Data curation Y.-S.S.; Funding Acquisition J.K.; Writing-original draft Y.-S.S. and J.K.; Project administration J.K.; Writing-review & editing Y.-S.S. and J.K. All authors have read and agreed to the published version of the manuscript.

Funding

This work is supported by the Basic Research Programs (NRF-2020R1F1A1074371) of the National Research Foundation (NRF) of Korea funded by Ministry of Education, Science, and Technology (MEST).

Data Availability Statement

The data used to support the results in this study are included within the article. Furthermore, some of the data in this research are supported by the references mentioned in the article. If you have any queries regarding the data, the data of this research would be available from the correspondence upon request.

Conflicts of Interest

The authors declare no conflict of interest.

References

  1. Bureau of Labor Statistics. Census of Fatal Occupational Injuries Summary, 2019 (USDL-20-2265); Bureau of Labor Statistics: Washington, DC, USA, 2020.
  2. Sung, Y. RSSI-based distance estimation framework using a Kalman filter for sustainable indoor computing environments. Sustainability 2016, 8, 1136. [Google Scholar] [CrossRef] [Green Version]
  3. Wang, Z.; Li, H.; Yang, X. Vision-based robotic system for on-site construction and demolition waste sorting and recycling. J. Build. Eng. 2020, 32, 101769. [Google Scholar] [CrossRef]
  4. Zabielski, J.; Srokosz, P. Monitoring of Structural Safety of Buildings Using Wireless Network of MEMS Sensors. Buildings 2020, 10, 193. [Google Scholar] [CrossRef]
  5. Cai, H.; Andoh, A.R.; Su, X.; Li, S. A boundary condition based algorithm for locating construction site objects using RFID and GPS. Adv. Eng. Inform. 2014, 28, 455–468. [Google Scholar] [CrossRef]
  6. Lee, H.-S.; Lee, K.-P.; Park, M.; Baek, Y.; Lee, S. RFID-based real-time locating system for construction safety management. J. Comput. Civ. Eng. 2012, 26, 366–377. [Google Scholar] [CrossRef]
  7. BenAbdelkader, C.; Cutler, R.; Davis, L. Stride and cadence as a biometric in automatic person identification and verification. In Proceedings of the Fifth IEEE International Conference on Automatic Face Gesture Recognition, Washington, DC, USA, 21–21 May 2002; pp. 372–377. [Google Scholar]
  8. Liu, Z.; Hu, H.; Lin, Y.; Yao, Z.; Xie, Z.; Wei, Y.; Ning, J.; Cao, Y.; Zhang, Z.; Dong, L. Swin Transformer V2: Scaling Up Capacity and Resolution. arXiv 2021, arXiv:2111.09883. [Google Scholar] [CrossRef]
  9. Yuan, L.; Chen, D.; Chen, Y.-L.; Codella, N.; Dai, X.; Gao, J.; Hu, H.; Huang, X.; Li, B.; Li, C. Florence: A New Foundation Model for Computer Vision. arXiv 2021, arXiv:2111.11432. [Google Scholar] [CrossRef]
  10. Ghiasi, G.; Cui, Y.; Srinivas, A.; Qian, R.; Lin, T.-Y.; Cubuk, E.D.; Le, Q.V.; Zoph, B. Simple copy-paste is a strong data augmentation method for instance segmentation. In Proceedings of the IEEE/CVF Conference on Computer Vision and Pattern Recognition, Nashville, TN, USA, 20–25 June 2021; pp. 2918–2928. [Google Scholar]
  11. Jin, Y.-H.; Ko, K.-W.; Lee, W.-H. An indoor location-based positioning system using stereo vision with the drone camera. Mob. Inf. Syst. 2018, 2018, 5160543. [Google Scholar] [CrossRef] [Green Version]
  12. Weerasinghe, I.T.; Ruwanpura, J.Y.; Boyd, J.E.; Habib, A.F. Application of Microsoft Kinect sensor for tracking construction workers. In Proceedings of the Construction Research Congress 2012: Construction Challenges in a Flat World, West Lafayette, IN, USA, 21–23 May 2012; pp. 858–867. [Google Scholar]
  13. Palikhe, S.; Lee, J.Y.; Kim, B.; Yirong, M.; Lee, D.-E. Ergonomic Risk Assessment of Aluminum Form Workers’ Musculoskeletal Disorder at Construction Workstations Using Simulation. Sustainability 2022, 14, 4356. [Google Scholar] [CrossRef]
  14. Lee, G.; Choi, B.; Jebelli, H.; Lee, S. Assessment of construction workers’ perceived risk using physiological data from wearable sensors: A machine learning approach. J. Build. Eng. 2021, 42, 102824. [Google Scholar] [CrossRef]
  15. Kim, H.; Han, S. Accuracy improvement of real-time location tracking for construction workers. Sustainability 2018, 10, 1488. [Google Scholar] [CrossRef] [Green Version]
  16. Gatti, U.C.; Schneider, S.; Migliaccio, G. Physiological condition monitoring of construction workers. J. Autom. Constr. 2014, 44, 227–233. [Google Scholar] [CrossRef]
  17. Antwi-Afari, M.F.; Li, H. Fall risk assessment of construction workers based on biomechanical gait stability parameters using wearable insole pressure system. Adv. Eng. Inform. 2018, 38, 683–694. [Google Scholar] [CrossRef]
  18. Ray, S.J.; Teizer, J. Real-time construction worker posture analysis for ergonomics training. Adv. Eng. Inform. 2012, 26, 439–455. [Google Scholar] [CrossRef]
  19. Vazirizade, S.M.; Nozhati, S.; Zadeh, M.A. Seismic reliability assessment of structures using artificial neural network. J. Build. Eng. 2017, 11, 230–235. [Google Scholar] [CrossRef]
  20. Hu, Q.; Bai, Y.; He, L.; Huang, J.; Wang, H.; Cheng, G. Workers’ Unsafe Actions When Working at Heights: Detecting from Images. Sustainability 2022, 14, 6126. [Google Scholar] [CrossRef]
  21. Tien, P.W.; Wei, S.; Calautit, J. A computer vision-based occupancy and equipment usage detection approach for reducing building energy demand. Energies 2020, 14, 156. [Google Scholar] [CrossRef]
  22. Zhang, M.; Cao, Z.; Yang, Z.; Zhao, X. Utilizing Computer Vision and Fuzzy Inference to Evaluate Level of Collision Safety for Workers and Equipment in a Dynamic Environment. J. Constr. Eng. Manag. 2020, 146, 04020051. [Google Scholar] [CrossRef]
  23. Fang, Q.; Li, H.; Luo, X.; Ding, L.; Luo, H.; Rose, T.M.; An, W. Detecting non-hardhat-use by a deep learning method from far-field surveillance videos. Autom. Constr. 2018, 85, 1–9. [Google Scholar] [CrossRef]
  24. Fang, Q.; Li, H.; Luo, X.; Ding, L.; Rose, T.M.; An, W.; Yu, Y. A deep learning-based method for detecting non-certified work on construction sites. Adv. Eng. Inform. 2018, 35, 56–68. [Google Scholar] [CrossRef]
  25. Li, Z.; Li, D. Action recognition of construction workers under occlusion. J. Build. Eng. 2022, 45, 103352. [Google Scholar] [CrossRef]
  26. Fang, W.; Zhong, B.; Zhao, N.; Love, P.E.; Luo, H.; Xue, J.; Xu, S. A deep learning-based approach for mitigating falls from height with computer vision: Convolutional neural network. Adv. Eng. Inform. 2019, 39, 170–177. [Google Scholar] [CrossRef]
  27. Ding, L.; Fang, W.; Luo, H.; Love, P.E.; Zhong, B.; Ouyang, X. A deep hybrid learning model to detect unsafe behavior: Integrating convolution neural networks and long short-term memory. Autom. Constr. 2018, 86, 118–124. [Google Scholar] [CrossRef]
  28. Luo, H.; Liu, J.; Fang, W.; Love, P.E.; Yu, Q.; Lu, Z. Real-time smart video surveillance to manage safety: A case study of a transport mega-project. Adv. Eng. Inform. 2020, 45, 101100. [Google Scholar] [CrossRef]
  29. Redmon, J.; Farhadi, A. Yolov3: An incremental improvement. arXiv 2018, arXiv:1804.02767. [Google Scholar]
  30. Ren, S.; He, K.; Girshick, R.; Sun, J. Faster r-cnn: Towards real-time object detection with region proposal networks. Adv. Neural Inf. Process. Syst. 2015, 28, 91–99. [Google Scholar] [CrossRef] [Green Version]
  31. Redmon, J.; Divvala, S.; Girshick, R.; Farhadi, A. You only look once: Unified, real-time object detection. In Proceedings of the IEEE Conference on Computer Vision and Pattern Recognition, Las Vegas, NV, USA, 27–30 June 2016; pp. 779–788. [Google Scholar]
  32. Son, H.; Choi, H.; Seong, H.; Kim, C. Detection of construction workers under varying poses and changing background in image sequences via very deep residual networks. Autom. Constr. 2019, 99, 27–38. [Google Scholar] [CrossRef]
  33. Park, S.; Kim, J.; Jeon, K.; Kim, J.; Park, S. Improvement of GPR-Based Rebar Diameter Estimation Using YOLO-v3. Remote Sens. 2021, 13, 2011. [Google Scholar] [CrossRef]
  34. Du, Y.; Pan, N.; Xu, Z.; Deng, F.; Shen, Y.; Kang, H. Pavement distress detection and classification based on YOLO network. Int. J. Pavement Eng. 2021, 22, 1659–1672. [Google Scholar] [CrossRef]
  35. Angah, O.; Chen, A.Y. Tracking multiple construction workers through deep learning and the gradient based method with re-matching based on multi-object tracking accuracy. Autom. Constr. 2020, 119, 103308. [Google Scholar] [CrossRef]
  36. Iswanto, I.A.; Li, B. Visual object tracking based on mean-shift and particle-Kalman filter. Procedia Comput. Sci. 2017, 116, 587–595. [Google Scholar] [CrossRef]
  37. Saho, K. Kalman filter for moving object tracking: Performance analysis and filter design. In Kalman Filters—Theory for Advanced Applications; IntechOpen: London, UK, 2017; pp. 233–252. [Google Scholar]
  38. Ball, K.K.; Beard, B.L.; Roenker, D.L.; Miller, R.L.; Griggs, D.S. Age and visual search: Expanding the useful field of view. JOSA A 1988, 5, 2210–2219. [Google Scholar] [CrossRef] [PubMed]
  39. Lin, T.-Y.; Maire, M.; Belongie, S.; Hays, J.; Perona, P.; Ramanan, D.; Dollár, P.; Zitnick, C.L. Microsoft coco: Common objects in context. In Proceedings of the European Conference on Computer Vision, Zurich, Switzerland, 6–12 September 2014; Springer: Berlin/Heidelberg, Germany, 2014; pp. 740–755. [Google Scholar]
  40. Cao, Z.; Hidalgo, G.; Simon, T.; Wei, S.-E.; Sheikh, Y. OpenPose: Realtime multi-person 2D pose estimation using Part Affinity Fields. Comput. Vis. Pattern Recognit. 2019, 43, 172–186. [Google Scholar] [CrossRef] [PubMed] [Green Version]
Figure 1. Flow chart of generating proximity visualization.
Sustainability 14 07934 g001
Figure 2. Flow chart of worker’s posture determination algorithm.
Sustainability 14 07934 g002
Figure 3. Vision-dependent safety ellipse: (a) human vision and blind area; (b) safety ellipse, example 1; (c) safety ellipse, example 2.
Sustainability 14 07934 g003
Figure 4. Schematic of bird’s eye view transformation: (a) principal of its transformation; (b) coordinates of each image.
Sustainability 14 07934 g004
Figure 5. Components of plane map for (a) truck and (b) worker.
Sustainability 14 07934 g005
Figure 6. Classification analysis using labeled images: (a) images of “upright posture”, “stooped posture,” and “dropped head” states; (b) images of “upright posture” and “stooped posture” states.
Sustainability 14 07934 g006
Figure 7. Proximity visualization generation process: (a) plane map generated through camera calibration after object detection and tracking; (b) objects overlapped to plane map based on orientation and pose estimation.
Sustainability 14 07934 g007
Figure 8. Representative sequential results of worker proximity visualization generation: tracking results in the video (left) and generated plane map (right).
Sustainability 14 07934 g008aSustainability 14 07934 g008b
Table 1. Manually labeled image samples.
PostureUpright PostureStooped PostureDropped Head
Image Sustainability 14 07934 i001 Sustainability 14 07934 i002 Sustainability 14 07934 i003 Sustainability 14 07934 i004 Sustainability 14 07934 i005 Sustainability 14 07934 i006
KeyImage
372.jpg
Image
1653.jpg
Image2462.jpgImage2795.jpgImage619.jpgImage811.jpg
Value y h e a d 0.13160.15730.13070.16110.0492−0.1527
x u p p e r   b o d y 0.03810.06740.32090.26520.15920.1017
Publisher’s Note: MDPI stays neutral with regard to jurisdictional claims in published maps and institutional affiliations.

