
The Impact of the Two-Child Policy on the Pension Shortfall in China: A Case Study of Anhui Province


1
Department of Economics, Jiaxing University, Jiaxing 314000, China
2
Department of Global Business and Economics, Changwon National University, Changwon 51140, Korea
3
Department of Economics, Zhejiang Redboat Executive Leadership Academy, Jiaxing 314000, China
*
Author to whom correspondence should be addressed.
Sustainability 2022, 14(13), 8128; https://doi.org/10.3390/su14138128
Submission received: 10 June 2022
/
Accepted: 29 June 2022
/
Published: 3 July 2022
(This article belongs to the Special Issue Labor Economics and Sustainability)
Abstract
:The one-child policy was designed as a basic national policy in China and was written into the Constitution in 1982. The main content and purpose of the policy are to advocate late marriage, late childbearing and fewer births to control population growth in a planned way. Since the implementation of the basic national policy, its positive effect upon China’s economic development cannot be ignored, but after entering the 21st century, the problems related to population aging became obvious. Consequently, the basic pension system is confronted with great challenges. Under these circumstances, China initiated the two-child policy in 2016. This paper tries to forecast the change of pension shortfall after the implementation of the “two-child” policy in Anhui Province in China by establishing a pension revenue model, a pension expenditure model and a population prediction model. The prediction results reveal that the “two-child” policy helps to alleviate the pressure on the pension system, but the effect is limited and the “two-child” policy cannot change the trend of increasing pension shortfall in the long run. To reduce the burden on the pension system, the government can consider extending the pension contribution period and retirement age to make pension system sustainable.
1. Introduction
After the founding of the People’s Republic of China in 1949, with the call for “more people, more power”, China gradually faced the dilemma of a large population with scarce resources. In the 1970s, China’s government has recognized that a high fertility rate is an obstacle for per capita growth, and thus the “one-child” policy was introduced in 1982. The “one-child” policy advocates late marriage, late childbearing and fewer births. Since the establishment of this national policy, the effect has been remarkable, China has entered a period of demographic dividend with higher per capita growth and less unemployment.
However, after entering the 21st century, China is gradually facing the problem of population aging, and the sustainability of the basic social pension system is challenged. On one hand, people’s life expectancy increases because of the technical progress in health care and better nutrition, on the other hand, with the implementation of “one-child” policy, the number of young workers and retirees become disproportionate (the ratio of number of retirees to number of workers increase). The consequence is that the workers are confronted with an increasing contribution rate to keep the pension benefits constant, and additionally they are confronted with a higher contribution rate in the healthcare system, because elder people cause over-proportional high healthcare costs. As a solution, China’s government initiated the “two-child” policy on 1 January 2016. A “two-child” policy is expected to improve the situation, but there is one big obstacle, people at the age between 20 and 40 have to pay a lot for pensions, healthcare, and now in addition they shall raise one more child, which is relatively expensive in China (particularly in cities). Based on microscopic survey data, Wang and Liu (2017) use the method of classification and summation to estimate the basic cost of having a second child in the city of Guangzhou, Chongqing, Wuhan, Nanchang, Weifang and Yuxi. They find that the basic cost of having a second child in Guangzhou, Chongqing and Wuhan is more than $100,000, and the basic cost of having a second child in Nanchang and Weifang is more than $70,000. Within the cost of raising a second child, education costs account for a relatively high proportion of the total cost [1].
There is one more line of arguments beyond pure economic thinking, which is rooted in anthropology to explain fertility behavior. Dasgupta and Dasgupta (2017) argue that the number of desired children, is dependent on how many children per household are born in the relevant peer group. They call this conformist behavior [2]. The advantage of this approach is that it explains why many stable equilibria regarding the optimal number of children may exist. Based on this idea Bhattacharya and Chakraborty (2012) built a theoretical model of fertility behavior. They find if all others in the relevant peer-group prefer one child, then it is highly probable that an individual of this group also prefer only one child [3]. This conformist idea combined with the idea of status competition [4] leads to the argument that in a world of status competition expressed in terms of recognizable goods like an apartment, a luxury car, newest mobile and the like, households with two-children are disadvantaged compared to households with one child. Additionally, to have one child will become the norm, because the peers have also only one child. Consequently, the incentive to have a second child is very weak, because it would violate the norm and would lead to a decline of social status. Not surprisingly, even huge child allowances and child support do not alter the behavior of parents, as can be seen in the case of Germany, where the government provides a lot of support for giving birth to child and raising child. The German government offers for example the following benefits: one parent can stay at home for 13 months, while receiving 70% of the previous salary; tuition fees are not required from universities and schools; the monthly child allowance is $250 for the first and second child, $260 for the third, and $290 for each additional child (In the case when someone has 4 children, the total child allowance is 250 + 250 + 260 + 290 = $1050 per month, or above $12,000 a year); additionally the pension benefits of females increase with an increasing number of children. Stauvermann and Wernitz (2019) propose that after the child allowance increases the number of children, it is necessary to prevent the occurrence of a decrease in the income of children due to the lower education level per child, which could have an adverse effect on the future pay-as-you-go pension system [5].
We recognize that research on pension shortfall is relatively detailed, but there are only a few studies on the impact of the “two-child” policy on pension shortfall. The issue of pension shortfall caused by demographic change not only determines whether the basic social pension system can run healthily and sustainably, but also influences the social welfare and stability of the society. Hence, after the implementation of the “two-child” policy, the effect of the policy on the pension system has become an issue worthy paying attention to. By constructing a pension revenue model, a pension expenditure model and a population forecast model, we analyze the effect of the “two-child” policy on the pension shortfall by taking Anhui Province in China as an example. The main reason for focusing only on one province is that every Chinese province has its own and independent pension system, but it has to be noted that the structure of the provincial pension systems is almost identical in all provinces. Our research is based on the background of the “two-child” policy, and we comprehensively consider various factors that affect the balance of the pension system, which makes our analysis closer to reality, and the conclusions are more scientific and credible.
The rest of the paper is organized as follows: in Section 2 we present the literature review; in Section 3 we describe the model and the methods used in the research; in Section 4 we will present the forecast and results analysis; Section 5 is dedicated to sensitivity analysis, in Section 6 we draw the main conclusions, in Section 7 we discuss the policy implication and thereafter we note some limitations of the current research.
2. Literature Review
The accelerating process of population aging will have an impact on the pension systems of many countries in the world. Scholars have conducted research on issues related to the pension system in various countries in the context of population aging. The research mostly revolves around fertility policy, retirement age, institutional reforms, the relationship between aging and pension system and etc.
2.1. The Impact of Adjusting the Fertility Policy on the Population Size
In the context of an aging society, it is of great significance to pay attention to the impact of fertility policy on the population size. Chesnais (1996) states that the total fertility rate in developed industrial societies has been lower than the replacement level of 2.1, which is necessary to keep the population constant. Thus, it is necessary to adopt fertility encouraging policies to maintain a sustainable population structure [6]. Bongaarts (2004) points out that regarding population aging, it is unfair and unsustainable to transfer the burden from one generation to the next, thus, the current fertility policy should be adjusted [7]. Qiao and Ren (2006) put forward that China should implement a reasonable fertility policy to keep the fertility level at around 2.0, so as to avoid the negative impact brought about by population decline [8]. Cai (2007) points out that the demographic dividend has made a great contribution to the sustained growth of China’s economy. Therefore, facing the trend of population aging and the shrink of the working-age population, China should adjust its fertility policy to provide a sufficient working-age population for the stable development of the economy [9].
The “two-child” policy was introduced in China in 2016. Until now, the relevant research focusing on this topic is still limited. Yuan (2016) et al. estimate the future population of China by making assumptions about the fertility rate under the “two-child” policy, and forecast the trend of China’s total population size in the future under different fertility rates [10]. Yang (2016) uses the cohort factor method to predict the future population under the “two-child” policy, and concludes that a baby boom will occur in the short term, but there will not be a sharp rebound in population growth in the long run. The effect of policy adjustment on improving the population structure is relatively weak [11]. Luo et al. (2014) set relevant parameters based on the current population size and development trend of Yunnan Province, and calculates the impact of the “two-child” policy on the population size of Yunnan Province. They conclude that the trend of population aging in Yunnan is irreversible, thus the fertility policy should be further improved [12]. Yang et al. (2014) use the three-dimensional analysis framework to evaluate and analyze the effect of “two-child” policy on the demographic dividend in Hubei Province, and note that “two-child” policy could increase population quality measured in terms of human capital, but the effect on demographic dividend is small [13]. In addition, some scholars have studied the relationship between “two-child” policy and fertility rate from country view. Based on the 2013 China’s fertility willingness survey report, Zhuang et al. (2014) analyze and conclude that after the implementation of “two-child” policy, China’s fertility rate will increase, but the time period of having a second child will not be overly concentrated [14]. Zeng (2006), through a comparative study of different birth policies, find that the “two-child” policy increases the working-age population, lowers the dependency ratio of the elderly population and reduces the ratio of male to female babies [15]. Regarding the long-term impact of the “two-child” policy on fertility rate, Qiao (2014) argues that the fertility rate may drop to a minimum soon, and the implementation of the “two-child” policy will only delay this time [16]. Zhai et al. (2014) note that the total fertility rate of women will eventually be expected to remain around 1.8 [17].
However, in general a consensus regarding the factors affecting population size does not exist. Besides fertility policy, some scholars believe that economic development and the level of productivity play a more decisive role. Peng and Hu (2011) point out that not only the fertility policy needs adjustment, it is more important to find out the contradictions arising from the incongruity between population aging and the socio-economic system from the perspective of public policy [18]. Zhang and Li (2021) argue that economic growth is the foundation and source of pension sustainability [19]. Cao and Cheng (2014) state that the fertility rate of urban and rural residents will not increase significantly after the implementation of “two-child” policy, since there is a difference between the willingness to get a child and the ability to get a child [20]. Mao (2013) points out that changes in population structure and social dependency ratio are the result of a combination of factors, such as the level of economic development, subjective consciousness, traditional culture, etc., and are not only affected by the fertility policy [21].
2.2. Different Countermeasures to Ease the Pressure of Pension Benefits
Borsch-Supan (1992) shows that due to the strong impact of population aging, the pension system will inevitably face a payment crisis in the future. How to ease the payment pressure on pension system is worthy of in-depth discussion [22]. Corbo V. (2004) finds out that appropriately delaying the retirement age of employees has a significant effect on increasing the revenue of the pension system. At the same time, raising the fertility rate and promoting the immigration of young well-educated individuals from abroad can also increase the revenue of the pension system and ease the payment pressure [23]. Breyer and Hupfeld (2010) also agree with Corbo. V and advocate that the sustainability of the pension system should be improved through policies which delay employees’ retirement age [24]. Nicholas Barr (2000) focuses on analyzing related constraints in pension system design [25], while Holzmann and Stiglitz (2004) mainly investigate how to promote the sustainable development of the pension system, and analyze the misunderstandings in the pension reform [26]. Posel and Casale (2003) points out that the revenues of the pension system in most countries rely heavily on government subsidies. In the context of population aging, the government is under great pressure and should reduce subsidies for the pension system [27]. Holzmann (2005) conducts research on the pension system in the United States and concludes that the balance of the pension system will be exhausted around 2030, and the reform of the pension system in the United States is imminent [28]. Feldstein et al. (2001) conducts research on the investment method of the pension system, and suggests that the government should invest the pension system in stocks, bonds, etc., to prevent the depreciation and shrinkage of the pension system [29]. OECD (2005) analyzes China’s pension system and points out that due to China’s “one-child” policy and the prolongation of average life expectancy, China’s pension accounts are bound to run short. He suggests scientific and effective management of pension system [30]. Cabo (2014) points out that population aging has a profound impact on most national pension system. In order to prevent pension deficits due to population aging, the retirement age should be postponed, and the government should design a reasonable incentive mechanism to make employees more willing to delay retirement to reduce the financial pressure of the pension system [31].
2.3. Fertility Policy, Population Structure and Pension Shortfall
The pension shortfall is closely related to the population structure and fertility policy. Yin and Huang (2012) points out that under a pay-as-you-go pension scheme, the age structure of the population can significantly affect revenue of the pension system and pension benefits, and the old-age dependency ratio is closely related to the pension shortfall [32]. In recent years, China’s population aging has accelerated, with the number of retired workers increasing while the number of young workers decreasing. Stauvermann and Kumar (2016) use an overlapping generation model with endogenous fertility, endogenous lifespan, and human capital accumulation to theoretically explore whether the pay-as-you-go pension system will be sustainable under a declining population structure and a longer life expectancy. They find that if parents’ investment in human capital is beneficial, the revenue of the pension system will always increase in the future. Furthermore, the ratio between pension benefits and the consumption of younger generation will reach a positive limit value, and therefore the pay-as-you-go pension system will not suffer from insolvency problems due to increased life expectancy and declining fertility rate [33].
From the perspective of fertility policy, the research on birth policy is mostly focused on the prediction analysis of birth rate and birth peak, while the research on the impact of increasing the total fertility rate on the financial status of the pension system is limited. Using macro data analysis, Lee and Miller (1990), Blake and Mayhew (2006) take the United Kingdom as an example and find out that the financial burden of the pension system can be reduced by increasing the total fertility rate [34,35]. Through population forecast, Sun et al. (2011) concludes that in the long run, releasing the two-child policy will help to solve the payment crisis of the pension system and narrow the pension shortfall [36]. In general, most scholars believe that the release of the fertility policy can help to ease the aging of China’s population and achieve sustainable development of the pension system. Chen and Song (2013), Zeng and Ren (2015) take urban employees’ pension system as an example to study the effect of the “two-child” policy on solving the pension crisis. They find that the “two-child” policy increases the number of contributors, improves the financial situation and eases the payment pressure of the pension system [37,38]. Zhang (2014) and Mou and Yu (2016) propose that the “two-child” policy is desired for social and economic development and is an effective means to alleviate the imbalance of the population structure and the aging of the population. Full application of the “two-child” policy will inevitably have an impact on China’s social dependency ratio [39,40]. Wang (2014) notes that there is an advantage and an disadvantage associated to the full application of the “two-child” policy with respect to the balance of the pension system. On the one hand, it can effectively reduce the pension deficit, but on the other hand, it may also have a negative impact on employment rate and wages and the social security system [41]. Sun (2013) points out that China’s pension system crisis is rooted in an unreasonable population structure, in order to cope with the pension crisis, it is necessary to moderately increase the fertility rate [42]. Liu (2013) points out that population aging in China has a great impact on savings, investment and labor productivity, the liberalization of the “two-child” policy will help to solve these problems [43]. Kang (2014) remarks that according to historical data and forecast data, the level of pension expenditure increases, while the fertility rate decreases, thus, it is necessary to apply the “two-child” policy [44].
2.4. Prediction and Analysis on the Balance of Payments of the Pension System
By simulating the fertility rate, Luo and Jiang (2015) find that the increase in the fertility rate in the short term will not have a significant impact on the revenues and expenditures of the pension system, but it facilitates long-term balance of payments for the pension system [45]. Sun et al. (2011) compare the changes in the pension shortfall under the “one-child” and “two-child” birth plans, and conclude that the impact of the adjustment of the birth policy on the pension system will appear after 2039. The application of the fertility policy can effectively offset the pension shortfall [36]. Liu (2014) simulates an increase of the total fertility rate from 1.45 to 1.6, and compares the pension shortfalls. His results show that increasing the fertility rate has little effect on the balance of future the pension system [46]. Wang (2000) points out that the balance of the pension system is very important for the sustainable development of pension system, and analyzes the impact of changes of contribution rate, replacement rate and wage growth rate on the balance of the pension system [47]. Regarding the research on the balance of the pension system in the case of Anhui Province, by applying relevant data in Anhui, Guo (2011) forecasts urban employees’ pension income and expenditure. The results show that starting from 2026, there will be a gap in the balance of the basic pension system for urban employees in Anhui Province. From that year on, the gap will continue to expand year by year [48].
In general, most of the mentioned studies are focused on the study of the balance of the pension system, and the variables introduced are relatively simple, a quantitative research that comprehensively considers the application of the “two-child” policy and other relevant variables (like demographic changes, delayed retirement, changes in replacement or contribution rates, etc.) is thus needed at present. Therefore, we analyze and predict the impact of the “two-child” policy on the demographic changes and the shortfall of the pension system in Anhui Province.
3. The Model—Taking Anhui Province as a Case Study
3.1. Pension Revenue Model
In general, the revenues of China’s pension system consists of two parts, a pay-as-you-go part and a personal account part. The pay-as-you-go part is equal to corporate payments plus government subsidies. From another perspective, it is also equal to the number of insured employees multiplied by the average salary of the insured employees multiplied by the corporate contribution rate.
Let be the income from the pay-as-you-go part of the pension system in the nth year; is the average annual wage of the employees in the th year, which is the base period; is the annual growth rate of average wage; is the corporate contribution rate; is the number of insured employees at the age of x in the nth year. Then is the total number of insured employees, where a is the age when the employees begin to contribute to the pension system, and b is the employees’ retirement age. We assume that the average beginning time of employment age in Anhui Province is 20 and μ is the contribution rate of the pay-as-you-go part. We assume the latter is fixed to 20% like it is assumed in the literature referenced above.
3.2. Pension Expenditure Model
China’s pension expenditure generally consists of the following two parts. One part is the payment of monthly pension benefits to retirees, and the other part is to distribute pension benefits in personal accounts to retirees.
Suppose is the pension expenditure in the nth year; is the number of retired employees at the age of x in the nth year, then is the total number of retired employees, where w is the age of death of the employees; is the average basic pension level of retired employees at the age of m in year t; is the pension adjustment rate.
3.3. Population Forecast Model
The revenue of the pension system and its expenditure are closely related to the number of insured employees, the number of retirees and the trend of demographic change. Therefore, in order to calculate the revenue of the pension system and pension expenditure of Anhui Province, we should consider the population and pension policies of Anhui Province and predict future population structure, specifically, we should focus on the impact of the “two-child” policy on the fertility rate.
There are many types of population prediction models, including Logistic model, Leslie matrix population prediction model, gray GM (1.1) population prediction model and etc. The problem with the above mentioned models is that the implementation of the “two-child” policy will have a great impact on various parameters in each model, making the model difficult to be accurate, and the prediction result will inevitably be biased. We use in this paper the cohort element method—which can improve the accuracy of population prediction. We use data from the Anhui Provincial Statistical Yearbook and apply MATLAB software to calculate and predict the demographic change of Anhui Province until 2050.
Let denotes the population size of a cohort of age a in year t, a = 1, 2, 3, ..., 100, and at the same time; denotes the mortality rate of people aged a in year t; represents the increase in the number of registered households at the age of a in year t, represents the increase of the migrant population aged a in year t; represents the fertility rate of prolific females at the age of a in year t, assuming 15 ≤ a ≤ 49, the total fertility rate is ; g(t) represents the sex ratio (male to female) of newborns in year t; f represents females and m represents males; the assumptions here are all vector assumptions, X(t) = represents the population structure in year t, (t) = denotes the increased population structure of the registered population in year t, (t) = denotes the increased population structure of the immigrant population in year t, A(t) = represents the survival rate in year t, (t) = is the number of newborns in year t.
The population in year t + 1 can be expressed as follows:
The number of male newborns and female newborns in year t + 1 can be expressed as follows:
From the above formulas, we can get the population model as follows:
In China, pensions are received in accordance with the territorial principle. If an individual participates in the pension system, it must be processed in the place where the household registration is located, that is, it cannot be insured in another place. Therefore, this article does not consider the number of immigrants and their pension payments in all following calculations.
3.3.1. Basic Assumptions
As noted above, China’s pension fund is divided into two parts. The individual contributes 8% of its salary to the personal account; the enterprise contributes about 20% of the employees’ salary to the pay-as-you-go part. We mainly focus on the pay-as-you-go part, and the personal account is not calculated here, because all funds in the personal account will be returned when the individual retires, therefore the impact of personal accounts on the overall account is weak. At the same time, the impact of state subsidies on pensions is not considered.
We assume that male employees and female employees begin to work at the age of 20. In recent years, the government releases a progressive delayed retirement plan, but only a few places (Shandong province and Jiangsu Province) have implemented the scheme since the beginning of 2022. Thus, for conservative estimation, the retirement age for male employees is still set at the age of 60 and for females at the age of 55 (In the robustness check part, we will assume an increase in the retirement age and check whether the conclusions still hold). In addition, it usually takes on average 20 years for a newborn baby to be included in the pension system after birth, so we will consider the period 2016–2050.
With reference to the forecast of the average life expectancy of population in China, we refer to the United Nations “World Population Outlook”, and assume that the average life expectancy of the population in China is 80 years, that is, the age of death is 80.
3.3.2. Parameter Introduction
- (1)
- Average wage growth rate
Table 1 displays the average wage growth rate of Anhui Province from 2001 to 2018, we observe from the table that the trend of growth rate of average wage is nearly the same as the growth rate of GDP. However, as the economy continues to grow, its growth rate will definitely decline, and accordingly, the growth rate of average wages will also decrease.
It can be concluded from the table that the average wage index ranges between 100–120. Considering China’s future economic situation and GDP growth target, we refer to the CGE model constructed by Xiao (2012) and use the method of changing a certain percentage at regular intervals to define k, the growth rate of average wage per year in Anhui Province [49], where k is 9% before 2020, 6% from 2021 to 2030, 4% from 2031 to 2040, and 3% from 2041 to 2050.
- (2)
- The average replacement rate of the pension system
We use the ratio of the average pension benefit of retired employees to the average salary of in-service employees to calculate the average replacement rate of the pension system.
Average replacement rate of the pension system = average pension income of retired employees/average salary of in-service employees.
It can be observed from Table 2 that the average replacement rate of pension system in Anhui Province from 2001 to 2018 basically showed a declining trend (except for 71.26% in 2018). The average replacement rate from 2001 to 2009 was 53.41%, and the average replacement rate from 2010 to 2018 was 47.21%. According to the data of the “Pension Development Report” over the years and consider the actual situation in Anhui Province, we use the value calculated by Yang (2017), where the future pension replacement rate is 45% [50].
- (3)
- Participation rate
It can be recognized from Table 3 that the number of employees participating in the pension system in Anhui Province continues to increase, and the increase in the participation rate reflect the growth rate of revenue of the pension system. The average annual increase of the participation rate for the pension system in China as a whole over the years is 1.66% [51], on the basis of this value, this article adopts a conservative estimate and assumes that the participation rate in Anhui Province will increase by 1% annually.
- (4)
- Number of retirees
The data in Table 4 shows that the number of retirees in Anhui Province fluctuated, but the general trend is an increase of the number of retirees. At the same time, pension expenditure in Anhui Province increased as the number of retirees rose, and the growth rate of the number of retirees reflects the growth rate of pension expenditure.
- (5)
- Contribution rate of the pension system
According to national regulations, the enterprise contributes about 20% of the employees’ salary to the pay-as-you-go part in the pension system. However, the executive meeting of the State Council on 13 April 2016 stipulated that the contribution rate of pension system for the enterprise part should be reduced stepwise to reduce their financial pressure, and could be adjusted from 20% to 19% in the first step. We refer to the practice of other regions in China in 2022 (Fujian Province and Shandong Province in particular) and set the average contribution rate of Anhui Province in the future as 19%.
- (6)
- The revenue and expenditure of pension system
Because of the continuous improvement of the pension system and economic development, we can observe from Table 5 that the income of the pension system in Anhui Province has increased year by year, from 4.7 billion RMB in 2001 to 210.5 billion RMB in 2018. At the same time, the expenditure of the pension system in Anhui Province increased from 5.9 billion in 2001 to 181.7 billion in 2018.
- (7)
- Pension adjustment rate
Beginning in 2005, China has repeatedly increased the payments for enterprise employees after retirement. The growth rate in 2006 was 23.7%, since then, the annual growth rate has been around 10% for nearly ten years, and the growth rate was about 6.5% in 2016. Based on related research, this paper adopts the following pension adjustment formula: , where we use α and β values calculated by Yang and Shen [52]. Then we have . Among them, ω represents the basic pension adjustment ratio, c is the inflation rate, and w is the growth rate of the average wage.
It can be derived from Table 6 that the average wage index of urban employees in Anhui Province from 2001 to 2018 ranged between 100 and 120, and the growth rate of wages was relatively stable, the inflation rate fluctuated from 2001 to 2010, but remained relatively stable from 2011 to 2018. Taking into account the actual situation in China and referring to Tang and Wu’s work [51], we assume that the subsequent inflation rate stabilize at 3% in China.
- (8)
- Fertility rate
We adopt the fertility rate of females at childbearing age in the statistical yearbook of Anhui Province.
It can be derived from Table 7 that the fertility rate has increased after the implementation of the “two-child” policy in 2016, but it is expected to fall back. We refer to Qiao’s (2014) research and assume that the fertility rate will remain constant at 0.35 until 2050 [53].
- (9)
- Sex ratio of newborn children
According to the data of the 2005 sample survey, the sex ratio of newborns was 120.49 nationwide and 133.20 in Anhui Province. According to the data of the sixth national census in 2010, the sex ratio of newborns was 121.21 in China and 131.07 in Anhui Province. Based on the above data and related research, this paper makes the same assumption as Tang and Wu (2016) and the sex ratio of newborns in Anhui Province from 2001 to 2015 is 130. With the implementation of the “two-child” policy, the sex ratio of newborns from 2016 to 2050 will be 115 [51].
- (10)
- Mortality rate
According to Table 8, the overall mortality rate was around 6‰ in the period 2001–2015. Since 2016, the mortality rate was around 5.95‰. Therefore, in order to simplify the calculation, it is assumed that from 2018 to 2050, the mortality rate will decrease by 0.01‰ each year. At the same time, the population of Anhui Province in 2018 by age and sex is shown in Table 9.
4. Forecast and Result Analysis
4.1. Population Forecast Results
Based on the above models and data, we calculate the total population and the number of newborns in Anhui Province from 2020 to 2050. The results are shown in Figure 1 and Figure 2.
The total population of Anhui Province increased steadily from 63.25 million in 2001 to 70.83 million in 2018, and the sex ratio was very stable, basically around 108. At the same time, the specific data of newborns in Anhui Province can be calculated from the total population and birth rate in each year. Here we only calculate the number of newborns in 2012–2018, which could give us an intuition. According to the above principles, the total number of newborns was 897,300 in 2012, 892,500 in 2013, 892,000 in 2014, 897,800 in 2015, 914,900 in 2016, 993,200 in 2017, and 879,000 in 2018. The data shows that the number of newborns increased slightly after the implementation of the “Two-child” policy in 2016, but this can be explained by a one-time catch-up effect. This means, some parents particularly older parents want to get more than one child since some time and then they could realize their desire not earlier than 2016. This explains then also why the number of newborns dropped sharply in 2018. Based on this, it can be predicted that the number of newborns will decline steadily thereafter.
Figure 1 shows that after the implementation of the “two-child” policy in Anhui Province, the population peak will probably be reached around 2035. After that, the total population will gradually decline, and could even be smaller than the total population before the policy was implemented.
Figure 2 depicts the number of newborns in Anhui Province from 2012 to 2050. It is obvious that the number of male newborns, female newborns and the total number of newborns all display a trend of rising first and then falling back. It can be clearly seen from the figure that after the implementation of the “two-child” policy in 2016, the number of newborns shows a steep rise, reaching a peak in 2017, and then steadily declines until 2050.
If the “two-child” policy is not implemented, the population forecast in Anhui will be different.
Based on the data from 2001 to 2015, we draw the first figure in Figure 3 below, where the blue line represents the total population and the red line represents the trend line from 2001 to 2015, and then we added a predicted trend line in Figure 3, which forecasts the change in the total population of Anhui Province by 2050 without implementing the “two-child” policy.
4.2. Forecast Results of Pension Revenue and Expenditure
Combining the results of the population forecast with the pension income and expenditure model, we calculate the future pension revenue and expenditure, as shown in the Table 10 (unit: 100 million).
Comparing the two scenarios in Table 10, it becomes clear that changes regarding the pension revenues until 2036 cannot be expected. The reason is simply that children born in 2016 or later will not enter the labor market before 2036. After 2036, the policy change has a significant influence on the pension revenues, because the calculations show that “two-child” policy will increase the pension revenues. The main reason for this difference is the change in the number of insured persons, and the difference of insured persons is due to the different fertility policies. The number of newborns increases with the implementation of the “two-child” policy, it usually takes at least 20 years on average for newborns to participate in the pension system. Therefore, the number of insured persons in 2036 and beyond will rise, which will increase the income of the pension system.
Children born after the implementation of the “two-child” policy in 2016 have not reached the retirement age within the estimated time limit, so the newborns after the implementation of the “two-child” policy have no impact on the number of insured retirees, or it has no effect on pension expenditure. It should be noted that the calculations show that the pension expenditure will nevertheless increase and this is caused by the increasing life expectancy. However, from a pure logical point of view the “two-child” policy cannot guarantee the long-run sustainability of the pension system, because even in the best case the number of children per female will remain below two and combined with an increasing life expectancy, additional measures have to be taken.
Judging from the current balance of the pension, in either case, the current balance has a surplus first and then gradually decreases until it reaches a deficit. Because of the “lag effect” of population growth, there is no difference between the two policies (implementing the two-child policy and not implementing the “two-child” policy) until 2036. In 2036 and thereafter, the “two-child” policy leads to a bigger surplus than the business as usual (BAU) scenario. Additionally, the future deficits are bigger under the BAU scenario than under the “two-child” policy scenario. Generally speaking, the scale of the current balance with the implementation of the “two-child” policy is relatively high.
From the perspective of the cumulative balance of pensions, the cumulative balance of pensions has gradually developed from surplus to deficit. Before 2036, due to the “lag effect”, the accumulated balance will not be affected. With respect to the accumulated balance the calculations show that the point of time when the pension system will run into a deficit will be postponed by the “two-child” policy from 2044 to 2045.
5. Robustness Check
In order to test whether the conclusions of this paper will be affected by the changes of relevant parameters and produce large fluctuations, a sensitivity analysis is hereby conducted. Considering China has proposed to appropriately reduce contribution rates of the pension system and implement the progressive delayed retirement policy (In January 2022, Shandong Province and Jiangsu Province in China announced to initiate the delayed retirement policy nationwide, for which the time period for the deferred retirement should not be less than one year) and taking into account of the degree of uncertainty in the model parameters, we select the number of population, contribution rate, retirement age and wage growth rate to carry out robustness check. The results show that the basic conclusion of this paper has not changed, that is, the “two-child” policy is conducive to improving the balance of the pension system, but the “two-child” policy alone cannot effectively solve the problem of the pension shortfall.
5.1. Sensitivity Analysis of the Number of Population
Based on different preferences with respect to fertility, we convert data of fertility rate into data of birth rate under three different scenarios, namely optimistic, moderate, and pessimistic scenario.
Pessimistic scenario: The birth rate remained at 11.3‰ before the implementation of the “two-child” policy. The birth rate is 11.8‰ within 2 to 5 years after the implementation of the “two-child” policy. Five years later, it will drop to the level of 11.2‰. Moderate scenario: The birth rate is maintained at 11.3‰ before the implementation of the “two-child” policy. Within 2 to 5 years after the implementation of the “two-child” policy, the birth rate rise to 12.4‰, the birth rate remains at 11.8‰ five years later. Optimistic scenario: The birth rate remained at 11.3‰ before the implementation of the “two-child” policy. The birth rate is 14.2‰ within 2 to 5 years after the implementation of the “two-child” policy. Five years later, the birth rate remains at 12.3‰.
Figure 4 depicts the total population in Anhui Province from 2020 to 2050 under three different fertility scenarios. We can observe from Figure 4 that the population peak will probably be reached around 2031, 2035 and 2036 under pessimistic, moderate and optimistic scenarios, respectively. Thus, we conclude that the trend of the number of total population slightly changes under different fertility willingness scenarios, with a rise of number of total population after the implementation of the “two-child” policy, but the effect lasts for only a short period of time and the overall trend remains unchanged and the number of total population drops in the long term.
5.2. Sensitivity Analysis of the Wage Growth Rate
When other parameters remain unchanged, changes in the average wage growth rate will not only affect the pension contribution, but also affect the pension benefits of the employees. The growth rate of wages is closely related to the level of national economic growth, which is affected by many factors and is difficult to predict accurately. We assume that the average wage growth rate is 5% and 7%, respectively after 2020 (where in previous part, we assumed this number to be 6% after 2020) and conduct a sensitivity analysis, the results are shown in Table 11 and we can conclude from the table that the impact of the “two-child” policy on the pension shortfall is still gradually weakening over time with different wage growth rate.
5.3. Sensitivity Analysis of the Retirement Age
Other things equal, the change of retirement age will affect the retirement population and the revenue and expenditure of the pension system. In order to alleviate the impact of population aging on the pension system, China has initiated the progressive delayed retirement plan which was officially introduced in 2017, and Shandong Province and Jiangsu Province has already implemented the policy in 2022. We hereby conduct a sensitivity analysis for two different plans. One is to defer the retirement age by one year for every three years, the other is to postpone the retirement age by one year every four years (as shown in Table 12). We can observe from the table that delaying retirement age helps to reduce the pension gap. Under the condition that the “two-child” policy is not implemented, the time for the first shortfall to appear will be postponed to 2049. To clearly examine the influence of the “two-child” policy, we extend the time period until 2060, the results still remain valid. Thus, we can conclude that after the implementation of the “two-child” policy, the impact of which upon the pension shortfall is still weakening over time.
5.4. Sensitivity Analysis of the Contribution Rate
Under the condition that other parameters remain unchanged, changes in the contribution ratio of the pension system will affect the revenue and expenditure of the pension system over the years. According to latest policies initiated in China, we assume that the contribution rate of the pension system will be further reduced from 19% to 18% in the future, and conduct a sensitivity analysis test. The results show that the time when pension shortfall occurs under this scenario is 2033, thus, the conclusions of this paper have not changed fundamentally, and the impact of the “two-child” policy on the pension shortfall is gradually weakening over time.
6. Conclusions
In general, due to the “lag effect” of newborns, the impact of the “two-child” policy on urban employee pension’s revenue and expenditure has no immediate effect on the pension system. The “two-child” policy will have an impact on the pension shortfall around 2035. While maintaining the policy unchanged, the pension system in Anhui Province will run into a current deficit in 2037. With the implementation of the “two-child” policy, the same problem will occur also around 2037. This means that the policy does not postpone the date of the occurrence of a current deficit. However, the extent of the pension shortfall with the implementation of the “two-child” policy is smaller than the pension shortfall under an unchanged policy regime. Therefore, in terms of the results, the “two-child” policy helps to alleviate the pressure on pension system, but it cannot change the trend of expanding pension shortfall in the long run, and the fundamental problem of the pension system remains unsolved.
7. Policy Implications
The simple forecast shows that the “two-child” policy alone does not make the pension system in Anhui province sustainable. Even in the most optimistic scenario which is very improbable, the pension system will run into a deficit in the long run. Only the date when it will happen will be postponed into the future. The underlying reason is the increasing life expectancy. Therefore, it is necessary to implement other policy measures. Many studies have shown that the high child-rearing cost may be an important reason for many couples to delay childbirth or even refuse childbirth. However, as we know from other countries child allowances is a policy which can become very expensive and which has no huge impact on the number of children. A compromise would be to lower or abolish cost of education as it is done in many European countries. The advantage is that these educational costs are significant costs for parents and increasing the human capital of people will have a significant positive impact on wages and salaries. As a consequence, the revenue of the pension system will increase. Another approach is to increase the retirement age, but this must be done carefully, because old workers and employees may become unemployed under this approach. In this context, it should be considered to make the retirement age dependent on the working conditions. Particularly, to keep the retirement age of low-skilled workers constant and to increase only the retirement age of skilled workers. The background is that the increasing life expectancy is not equally distributed across the working population. The life expectancy of skilled workers is increasing much more than the life expectancy of low-skilled workers. This measure will on aggregate increase the years of contribution of every population vintage and reduce the years of retirement of every population vintage. Both effects will increase the income of the pension system. However, to emphasize the main result again, the “two-child” policy alone is not sufficient to guarantee the long-run sustainability of the pension system in the Anhui region under the existing institutional setting.
8. Limitations
In our article, some variables, like the contribution rate of pension system, the retirement age of employees, and the growth rate of average wage of employees are uncertain, and reasonable assumptions need to be made based on existing literature research. Thus, the accuracy of these assumptions may affect the predicted results. Nevertheless, we are convinced that even reasonable changes of these numbers will not change our main results and conclusions.
Author Contributions
Conceptualization: J.H.; methodology: J.H.; formal analysis: J.H.; writing—original draft preparation: J.H.; writing—review and editing: J.H., J.S. and P.J.S.; project administration: J.H.; funding acquisition: J.H. All authors have read and agreed to the published version of the manuscript.
Funding
This research was financially supported by the General Scientific Research Project of Department of Education in Zhejiang Province (Y202147642) and Research on Ecological Construction and Sustainable Development (JSKGH2021012). Peter J. Stauvermann thankfully acknowledges the financial support of the Changwon National University 2021–2022.
Institutional Review Board Statement
Not applicable.
Informed Consent Statement
Not applicable.
Data Availability Statement
Data are available from the corresponding authors upon reasonable request.
Conflicts of Interest
The authors declare no conflict of interest.
References
- Wang, Z.; Liu, T. Research on the calculation of the basic cost of giving birth to a second child and the social sharing mechanism. Popul. J. 2017, 4, 17–29. [Google Scholar]
- Dasgupta, P.; Dasgupta, A. Socially Embedded, Preferences, Environmental Externalities, and Reproductive Rights. Popul. Dev. Rev. 2017, 43, 405–441. [Google Scholar] [CrossRef] [Green Version]
- Bhattacharya, J.; Chakraborty, S. Fertility choice under child mortality and social norms. Econ. Lett. 2012, 115, 338–341. [Google Scholar] [CrossRef] [Green Version]
- Frank, R. Luxury Fever: Weighing the Cost of Excess; Princeton University Press: Princeton, NJ, USA, 2010. [Google Scholar]
- Stauvermann, P.J.; Wernitz, F. Why child allowances fail to solve the pension problem of aging societies. Economies 2019, 7, 117. [Google Scholar] [CrossRef] [Green Version]
- Chesnais, J.C. Fertility, family, and social policy in contemporary Western Europe. Popul. Dev. Rev. 1996, 22, 729–739. [Google Scholar] [CrossRef]
- Bongaarts, J. Population Aging and the Rising Cost of Public Pensions. Popul. Dev. Rev. 2004, 30, 1–23. [Google Scholar] [CrossRef]
- Qiao, X.; Ren, Q. The choice of China’s future fertility policy. Popul. Dev. 2006, 12, 1–13. [Google Scholar]
- Cai, F. How China’s Economic Growth Continues in the 21st Century. Policy Outlook 2007, 3, 49. [Google Scholar]
- Yuan, L.; Yin, X.; Wang, J. “Two-Child”, Fertility Assumption and Urban Employee Endowment Insurance Fund Gap. J. Shandong Univ. Financ. Econ. 2016, 28, 10–20. [Google Scholar]
- Yang, G. Population Expectations and Policy Prospects after “Universal Two-Children”. J. Beijing Univ. Technol. 2016, 16, 25–33. [Google Scholar]
- Luo, C.; Xu, Q.; Dai, Q. A study on the implementation of the “two-child” policy and the expectation of population development in Yunnan. Chin. J. Popul. Sci. 2014, 3, 30–42. [Google Scholar]
- Yang, Y.; Xiang, H.; Huang, R. Analysis of the Demographic Dividend Effect of the “Two-Child” Policy. J. Zhongnan Univ. Econ. Law 2014, 5, 3–8. [Google Scholar]
- Zhuang, Y.; Jiang, Y.; Wang, Z.; Li, C.; Qi, J.; Wang, H.; Liu, H.; Li, B.; Qin, M. The current fertility intention of urban and rural residents in China-based on the 2013 national fertility intention survey. Popul. Res. 2014, 3, 3–13. [Google Scholar]
- Zeng, Y. On the Necessity and Feasibility of the Soft Landing of the Two-Child Late Parenthood Policy. Chin. Soc. Sci. 2006, 2, 93–109. [Google Scholar]
- Qiao, X. How high will the fertility level be after the implementation of the “ two-child” policy? Discussing with Professor Zhai Zhenwu. Popul. Dev. 2014, 6, 2–15. [Google Scholar]
- Zhai, Z.; Zhang, X.; Jin, Y. Analysis on the Demographic Consequences of the Immediate and Comprehensive Release of the Two-Child Policy. Popul. Res. 2014, 38, 3–17. [Google Scholar]
- Peng, X.; Hu, Z. China’s Population Aging from the Perspective of Public Policy. Soc. Sci. China 2011, 32, 106–124. [Google Scholar]
- Zhang, S.; Li, B. Research progress on population aging and pension sustainability. Econ. Dyn. 2021, 2, 126–142. [Google Scholar]
- Cao, L.; Cheng, G. How much fertility potential will be released by the “two-child” policy. J. Zhongnan Univ. Econ. Law 2014, 5, 9–13. [Google Scholar]
- Mao, Z.; Luo, H. Differences in reproductive willingness and reproductive behavior of women in line with the two-child policy: An empirical study based on the theory of planned behavior. Popul. Res. 2013, 37, 84–93. [Google Scholar]
- Borsch-Supan, A. Population aging, social security design, and early retirement. J. Inst. Theor. Econ. 1992, 148, 533–557. [Google Scholar]
- Corho, V. Policy Challenges of Population Aging and Pension Systems in Latin America; Economic Impacts and Policy Challenges, Working Paper; Federal Reserve Bank of Kansas City: Kansas City, MO, USA, 2004. [Google Scholar]
- Breyer, F.; Hupfeld, S. On the fairness of early retirement provisions. Ger. Econ. Rev. 2010, 11, 60–77. [Google Scholar] [CrossRef] [Green Version]
- Barr, N. Economics of the Welfare State; Economic Impacts and Policy Challenges, Working Paper; Oxford University Press: Oxford, UK, 2000. [Google Scholar]
- Holzmann, R.; Stiglitz, J.E. New Ideas about Old Age Security toward Suitable Pension Systems in the 21st Century; China Labor Social Security Publishing House: Qinghai, China, 2004. [Google Scholar]
- Posel, D.; Casale, D. What has been happening to internal labour migration in South Africa, 1993–1999? South Afr. J. Econ. 2003, 71, 455–479. [Google Scholar] [CrossRef] [Green Version]
- Holzmann, R. Old Age Income Support in the 21st Century: An International Perspective on Pension Systems and Reform; World Bank: Washington, DC, USA, 2005. [Google Scholar]
- Feldstein, M.S.; Liebman, J.B. The Distributional Effects of an Investment-Based Social Security Reform. In Distribution Aspects of Investment-Based Social Security Reform; University of Chicago Press: Chicago, IL, USA, 2001. [Google Scholar]
- OECD. Corporate Pension Fund Liabilities and Funding Gaps. Financ. Mark. Trends 2005, 88, 69–113. [Google Scholar]
- Cabo, F.; García-González, A. The Endogenous Determination of Retirement Age and Social Security Benefits. Macroecon. Dyn. 2014, 18, 93–113. [Google Scholar] [CrossRef] [Green Version]
- Yin, J.; Huang, R. Analysis of the long-term financial status of China’s pay-as-you-go basic pension system based on the change of population age structure. Qiu Suo 2012, 10, 1–5. [Google Scholar]
- Stauvermann, P.J.; Kumar, R.R. Sustainability of a pay-as-you-go pension system in a small open economy with Ageing, Human Capital and Endogenous Fertility. Metroeconomics 2016, 67, 2–20. [Google Scholar] [CrossRef] [Green Version]
- Lee, R.D.; Miller, T. Population growth, externalities to childbearing, and fertility policy in developing countries. World Bank Econ. Rev. 1990, 4 (Suppl. S1), 275–304. [Google Scholar] [CrossRef]
- Blake, D.; Mayhew, L. On The Sustainability of the UK State Pension System in the Light of Population Ageing and Declining Fertility. Econ. J. 2006, 116, F286–F305. [Google Scholar] [CrossRef]
- Sun, B.; Dong, K.; Tang, Y. Research on the impact of fertility policy adjustment on the basic pension gap. Popul. Econ. 2011, 2, 101–107. [Google Scholar]
- Chen, Q.; Song, Z. How will urbanization cope with aging?—From the perspective of China’s urban and rural population flow to pension fund balance. Financ. Res. 2013, 6, 1–15. [Google Scholar]
- Zeng, Y.; Ren, C.; Liu, Q. Solving the pension payment crisis: Is the “two-child” policy effective: Taking the basic pension insurance for urban workers as an example. Financ. Res. 2015, 41, 21–34. [Google Scholar]
- Zhang, L. Comparison of the Pros and Cons of Liberalizing the “Two-Child” Policy; Jilin Agricultural University: Changchun, China, 2014. [Google Scholar]
- Mou, X.; Yu, H. A study on the “full liberalization of the second child” policy on China’s future population size and structure. J. Baicheng Norm. Univ. 2016, 5, 39–43. [Google Scholar]
- Wang, M. Analysis of the Two-Child Policy from the Perspective of Economics. Chin. Mark. 2014, 52, 219–220. [Google Scholar]
- Sun, C. The Adjustment of China’s Fertility Policy and Pension Security; Nanjing University: Nanjing, China, 2013. [Google Scholar]
- Liu, P. Research on the Impact of Population Aging on China’s Economic Growth; Shandong University: Jinan, China, 2013. [Google Scholar]
- Kang, Y. Research on the Relationship between Social Endowment Insurance Expenditure Level and Comprehensive Fertility Rate and Its Coordinated Development; University of International Business and Economics: Beijing, China, 2014. [Google Scholar]
- Luo, Z.; Jiang, D. The impact of the adjustment of the birth policy on the intergenerational balance of the basic endowment insurance for employees of urban enterprises in China. J. Guangxi Univ. Financ. Econ. 2015, 28, 94–99. [Google Scholar]
- Liu, X. Research on the income and expenditure gap and sustainability of China’s pension insurance. China Ind. Econ. 2014, 9, 25–37. [Google Scholar]
- Wang, J. The impact of interest rates on the balance of pension insurance funds under the current employee pension insurance model. Sociol. Res. 2000, 15, 55–62. [Google Scholar]
- Guo, Y. Research on the Financial Balance and Sustainability of the Basic Pension Insurance System for Urban Employees. Econ. Issues 2011, 7, 122–126. [Google Scholar]
- Xiao, M. Research on China’s Economic Development and Pension Accounts under the Background of Population Aging; Hunan University: Changsha, China, 2012. [Google Scholar]
- Yang, S. The Effect of Two Child Policy on the Balance of Fundamental Old-Age Insurance Funds for Urban Employees; Hebei University of Economics: Shijiazhuang, China, 2017. [Google Scholar]
- Tang, Y.; Wu, S. Can the implementation of the “two-child” policy effectively solve the payment crisis of urban workers’ the pension system? Econ. Theory Econ. Manag. 2016, 36, 56. [Google Scholar]
- Yang, Y.; Shen, S. Inflation and wage growth: New ideas and systematic plans for adjusting China’s basic pensions. Insur. Res. 2012, 8, 95–103. [Google Scholar]
- Qiao, X. The new population measurement method and monitoring system construction under the “two-child” policy. Popul. Dev. 2014, 20, 2–12. [Google Scholar]
Figure 1.
Forecast of the future population of Anhui Province (Unit: 10,000 people).
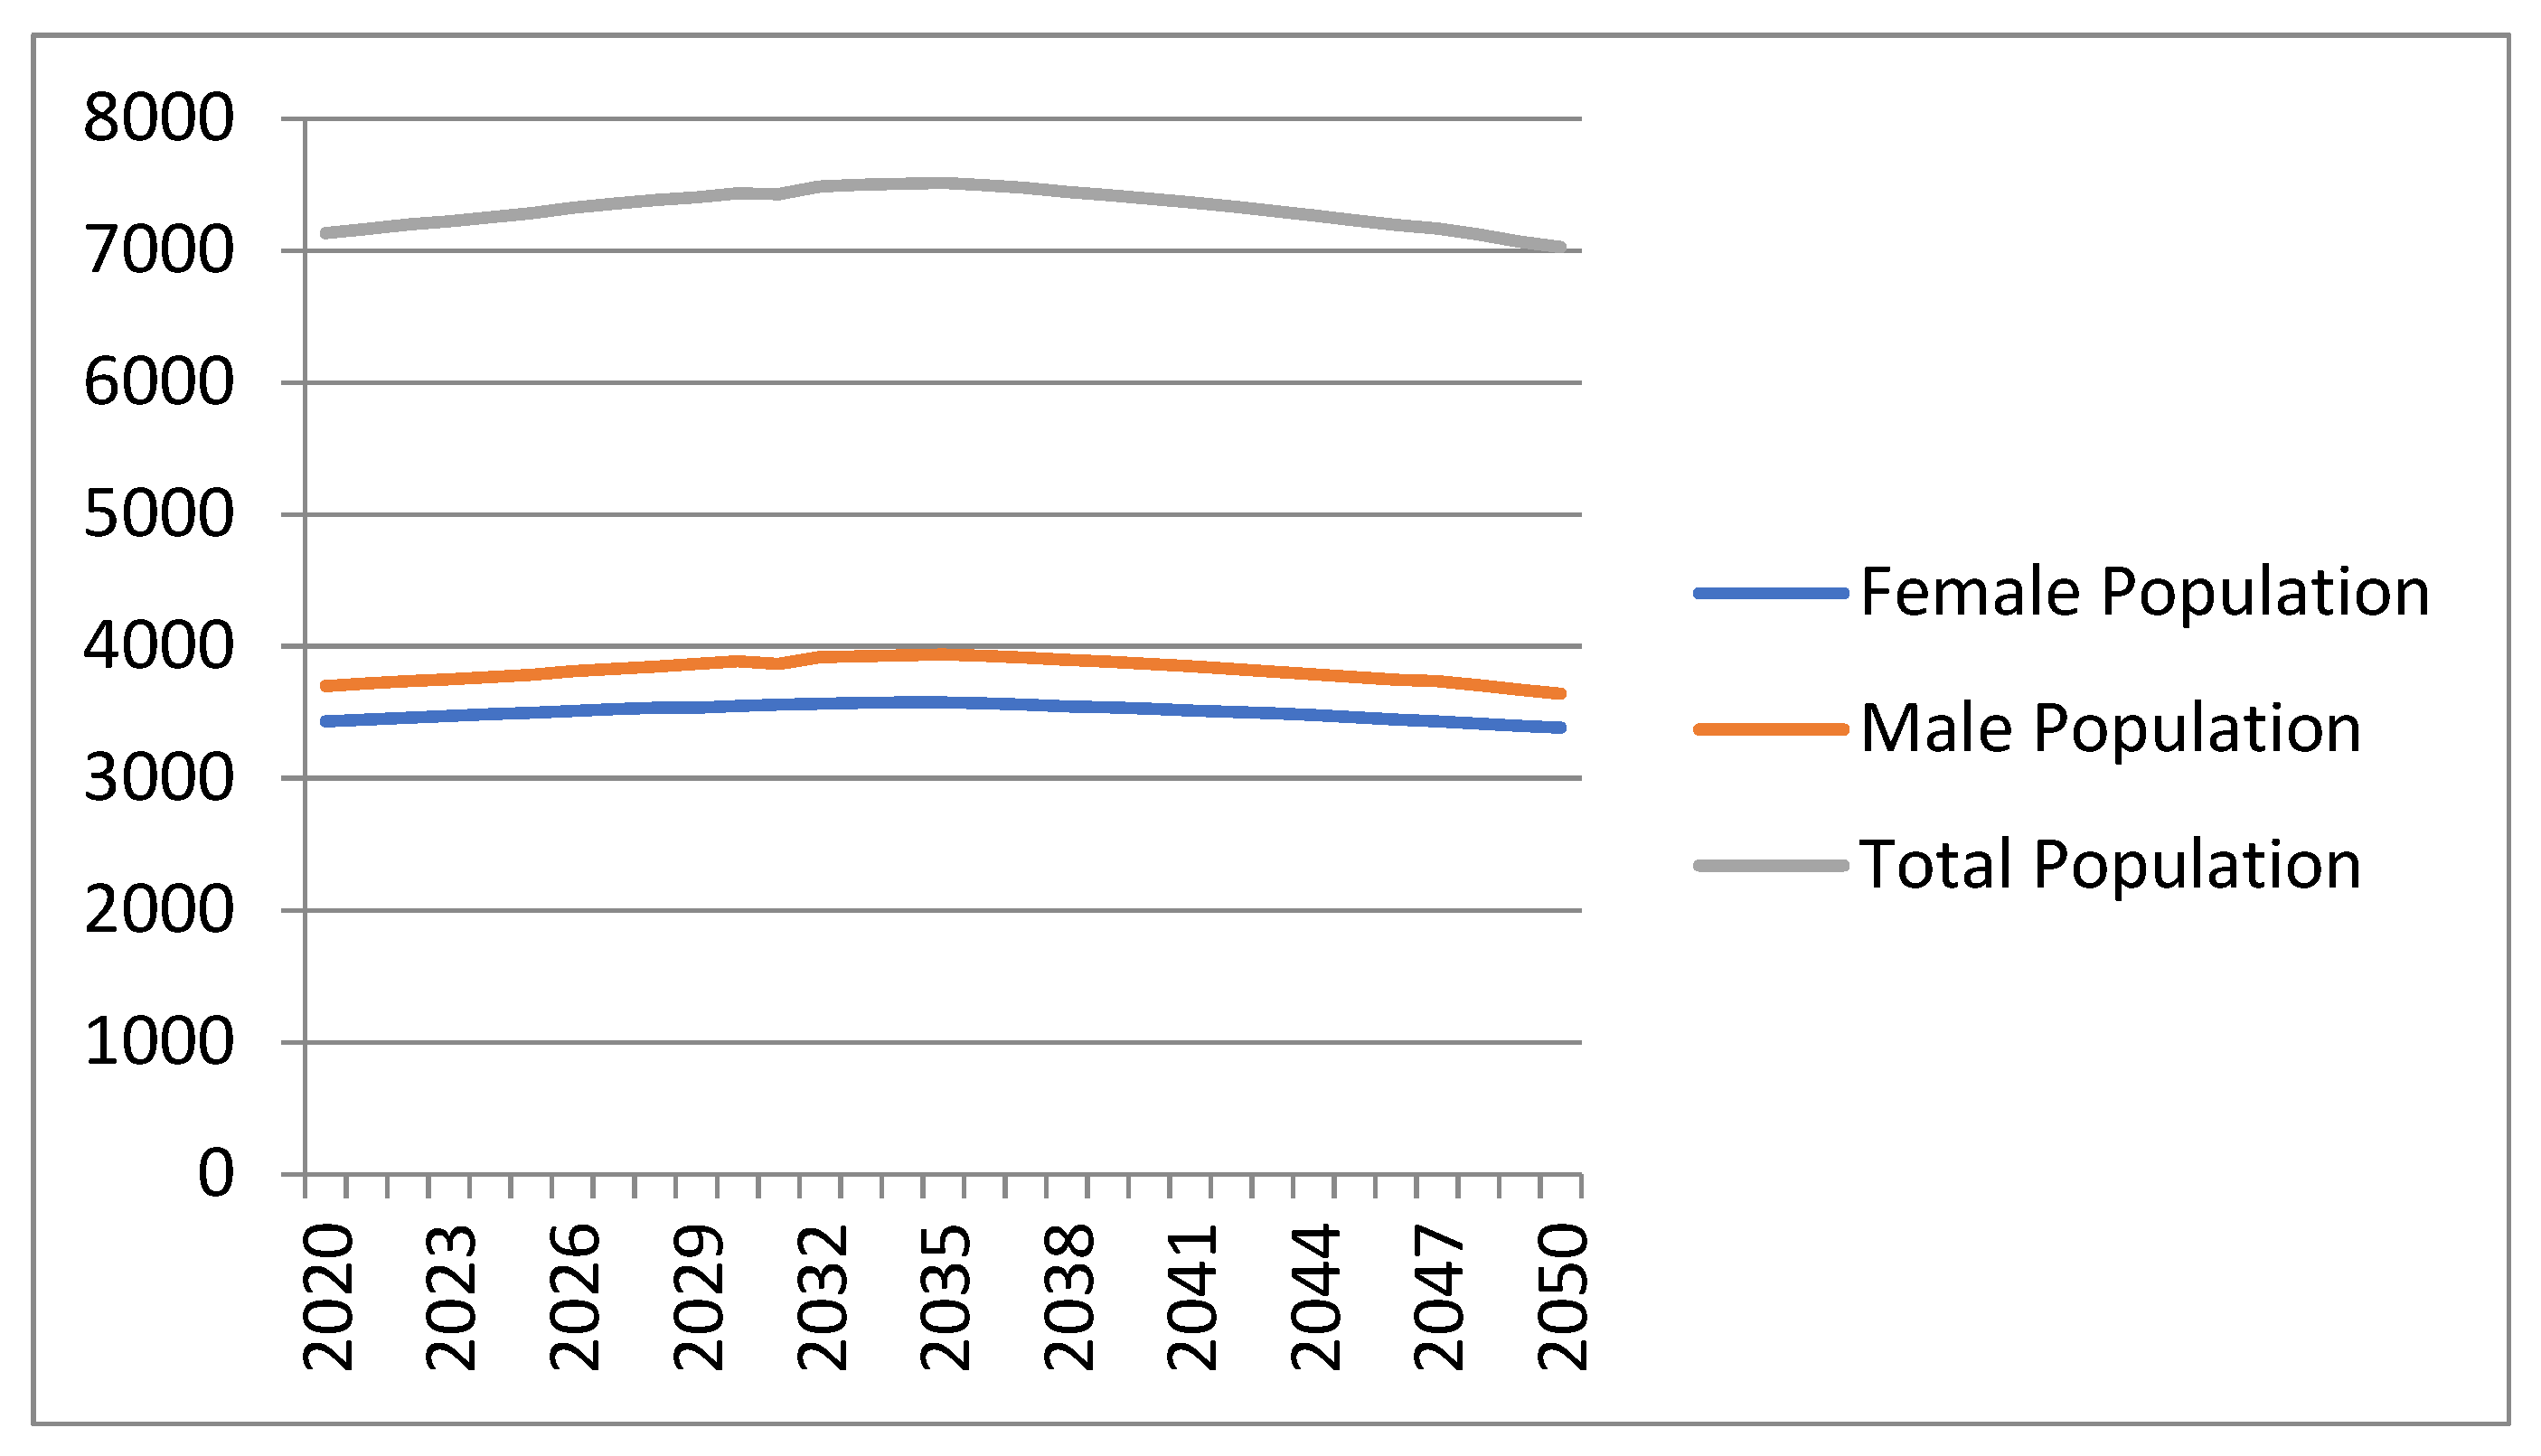
Figure 2.
Forecast of the future number of newborns in Anhui Province.

Figure 3.
Population forecast without implementing the “two-child” policy.

Figure 4.
Prediction of the total population of Anhui Province under different fertility scenarios.


Table 1.
Average wage and index of employees in Anhui Province from 2001 to 2018.
| Year | Average Wage (Yuan) | Average Wage Index (First Half Year = 100) |
|---|---|---|
| 2001 | 7908 | 113.1 |
| 2002 | 9296 | 117.6 |
| 2003 | 10,581 | 113.8 |
| 2004 | 12,928 | 122.2 |
| 2005 | 15,334 | 118.6 |
| 2006 | 17,949 | 117.1 |
| 2007 | 22,180 | 123.6 |
| 2008 | 26,363 | 118.9 |
| 2009 | 29,658 | 112.5 |
| 2010 | 34,341 | 115.8 |
| 2011 | 39,352 | 118.0 |
| 2012 | 44,601 | 113.3 |
| 2013 | 47,806 | 107.2 |
| 2014 | 50,894 | 106.5 |
| 2015 | 55,139 | 108.3 |
| 2016 | 59,102 | 107.2 |
| 2017 | 65,150 | 110.2 |
| 2018 | 74,378 | 114.2 |
Data comes from “Anhui Statistical Yearbook”.
Table 2.
The average replacement rate of the pension system in Anhui Province from 2001 to 2018.
| Year | Average Salary of Employees (Yuan) | Average Pension Income for Retired Employees (Yuan) | Replacement Rate (%) |
|---|---|---|---|
| 2001 | 7908 | 5472 | 69.20 |
| 2002 | 9296 | 6180 | 66.48 |
| 2003 | 10,581 | 6336 | 59.88 |
| 2004 | 12,928 | 6732 | 52.07 |
| 2005 | 15,334 | 7320 | 47.74 |
| 2006 | 17,949 | 8904 | 49.61 |
| 2007 | 22,180 | 9912 | 44.69 |
| 2008 | 26,363 | 12,444 | 47.20 |
| 2009 | 29,658 | 12,984 | 43.78 |
| 2010 | 34,341 | 15,259 | 44.43 |
| 2011 | 39,352 | 17,444 | 44.33 |
| 2012 | 44,601 | 19,354 | 43.39 |
| 2013 | 47,806 | 21,394 | 44.75 |
| 2014 | 50,894 | 23,418 | 46.01 |
| 2015 | 55,139 | 25,597 | 46.42 |
| 2016 | 59,102 | 27,006 | 45.69 |
| 2017 | 65,150 | 25,137 | 38.58 |
| 2018 | 74,378 | 53,005 | 71.26 |
Data comes from “Anhui Statistical Yearbook”.
Table 3.
Basic pension situation of employees in Anhui Province from 2001 to 2018.
| Year | Number of Employees (Ten Thousand People) | Number of Insured Employees | Employees’ Participation Rate (%) |
|---|---|---|---|
| 2001 | 641.5 | 3,242,376 | 50.54 |
| 2002 | 659.1 | 3,295,412 | 50.00 |
| 2003 | 683.2 | 3,430,677 | 50.21 |
| 2004 | 694.4 | 3,450,517 | 49.69 |
| 2005 | 730.5 | 3,469,852 | 47.50 |
| 2006 | 755.9 | 3,614,088 | 47.81 |
| 2007 | 818.1 | 3,855,442 | 47.13 |
| 2008 | 901.9 | 4,202,763 | 46.60 |
| 2009 | 936.2 | 4,586,947 | 49.00 |
| 2010 | 973.5 | 4,920,498 | 50.54 |
| 2011 | 1038.3 | 5,377,490 | 51.79 |
| 2012 | 1141.0 | 5,784,030 | 50.69 |
| 2013 | 1226.2 | 5,922,049 | 48.30 |
| 2014 | 1277.4 | 5,969,045 | 46.73 |
| 2015 | 1292.1 | 6,108,539 | 47.28 |
| 2016 | 1327.5 | 6,343,078 | 47.78 |
| 2017 | 1378.5 | 7,541,145 | 54.71 |
| 2018 | 1385.3 | 7,988,093 | 57.66 |
Data comes from “Anhui Statistical Yearbook”.
Table 4.
The number of retired people in Anhui Province from 2001 to 2018.
| Year | Number of Retired Employees (Persons) | The Growth Rate of Retired Employees (%) |
|---|---|---|
| 2001 | 955,122 | |
| 2002 | 1,027,929 | 7.62 |
| 2003 | 1,135,507 | 10.47 |
| 2004 | 1,188,445 | 4.66 |
| 2005 | 1,247,613 | 4.98 |
| 2006 | 1,338,138 | 7.26 |
| 2007 | 1,447,758 | 8.19 |
| 2008 | 1,581,377 | 9.23 |
| 2009 | 1,694,577 | 7.16 |
| 2010 | 1,774,880 | 4.74 |
| 2011 | 1,915,225 | 7.91 |
| 2012 | 2,053,564 | 7.22 |
| 2013 | 2,191,238 | 6.70 |
| 2014 | 2,323,449 | 6.03 |
| 2015 | 2,466,593 | 6.16 |
| 2016 | 2,579,290 | 4.57 |
| 2017 | 3,228,587 | 25.17 |
| 2018 | 3,429,090 | 6.21 |
Data comes from “Anhui Statistical Yearbook”.
Table 5.
The basic situation of income and expenditure of pension system in Anhui Province from 2001 to 2018.
Table 5.
The basic situation of income and expenditure of pension system in Anhui Province from 2001 to 2018.
| Year | Revenue (Ten Thousand Yuan) | Expenditure (Ten Thousand Yuan) | Year | Revenue (Ten Thousand Yuan) | Expenditure (Ten Thousand Yuan) |
|---|---|---|---|---|---|
| 2001 | 472,902 | 593,444 | 2010 | 3,432,478 | 2,708,340 |
| 2002 | 725,628 | 695,937 | 2011 | 4,594,510 | 3,341,022 |
| 2003 | 873,533 | 832,462 | 2012 | 5,084,201 | 3,974,490 |
| 2004 | 1,026,149 | 917,557 | 2013 | 6,249,422 | 4,688,128 |
| 2005 | 1,247,813 | 1,052,615 | 2014 | 6,807,025 | 5,441,083 |
| 2006 | 1,639,319 | 1,304,720 | 2015 | 7,917,525 | 6,313,752 |
| 2007 | 2,076,644 | 1,540,523 | 2016 | 8,394,118 | 6,965,752 |
| 2008 | 2,648,464 | 1,975,524 | 2017 | 10,202,349 | 8,115,654 |
| 2009 | 3,006,151 | 2,334,678 | 2018 | 21,051,657 | 18,176,103 |
Data comes from “Anhui Statistical Yearbook”.
Table 6.
Basic pension adjustment rate in Anhui from 2001–2018.
| Year | Wage Growth Rate (%) | Inflation Rate (%) | Basic Pension Adjustment Rate (%) |
|---|---|---|---|
| 2001 | 11.31 | 0.72 | |
| 2002 | 11.76 | −0.73 | 9.09 |
| 2003 | 11.38 | 1.13 | 9.14 |
| 2004 | 12.22 | 3.82 | 9.23 |
| 2005 | 11.86 | 1.78 | 10.46 |
| 2006 | 11.71 | 1.65 | 9.74 |
| 2007 | 12.36 | 4.82 | 9.60 |
| 2008 | 11.89 | 5.93 | 10.78 |
| 2009 | 11.25 | −0.73 | 10.64 |
| 2010 | 11.58 | 3.18 | 8.73 |
| 2011 | 11.80 | 5.55 | 9.82 |
| 2012 | 11.33 | 2.62 | 10.49 |
| 2013 | 10.72 | 2.62 | 9.50 |
| 2014 | 10.65 | 1.92 | 9.02 |
| 2015 | 10.83 | 1.44 | 8.82 |
| 2016 | 10.72 | 2.00 | 8.86 |
| 2017 | 11.02 | 1.59 | 8.89 |
| 2018 | 11.42 | 2.07 | 9.04 |
Data comes from “Anhui Statistical Yearbook” and National Bureau of Statistics.
Table 7.
The fertility rate of Anhui Province from 2001 to 2018.
| Year | Fertility Rate | Fertility Rate of Female with One Child | Fertility Rate of Female with Two-child | Fertility Rate of Female with Three Child and Above |
|---|---|---|---|---|
| 2001 | / | / | / | / |
| 2002 | 0.4196 | 0.3102 | 0.1089 | 0.0005 |
| 2003 | 0.4210 | 0.3036 | 0.1069 | 0.0105 |
| 2004 | 0.4386 | 0.2976 | 0.1288 | 0.0122 |
| 2005 | 0.3969 | 0.2558 | 0.1303 | 0.0108 |
| 2006 | 0.3122 | 0.2063 | 0.0952 | 0.0107 |
| 2007 | 0.3113 | 0.2104 | 0.0898 | 0.0111 |
| 2008 | 0.3189 | 0.2135 | 0.0932 | 0.0122 |
| 2009 | 0.3167 | 0.2131 | 0.0924 | 0.0112 |
| 2010 | / | / | / | / |
| 2011 | 0.2922 | 0.2054 | 0.0788 | 0.0080 |
| 2012 | 0.3065 | 0.2079 | 0.0914 | 0.0072 |
| 2013 | 0.3048 | 0.1985 | 0.0967 | 0.0096 |
| 2014 | 0.3085 | 0.1873 | 0.1115 | 0.0097 |
| 2015 | 0.3462 | 0.1920 | 0.1396 | 0.0146 |
| 2016 | 0.3669 | 0.2139 | 0.1441 | 0.0089 |
| 2017 | 0.4110 | 0.1677 | 0.2211 | 0.0222 |
| 2018 | 0.4371 | 0.1811 | 0.2335 | 0.0225 |
Data comes from “Anhui Statistical Yearbook”.
Table 8.
Anhui Province’s total population, birth rate and mortality rate from 2001–2018.
| Year | Birth Rate (‰) | Mortality Rate (‰) | Natural Growth Rate (‰) |
|---|---|---|---|
| 2001 | 12.46 | 5.85 | 6.61 |
| 2002 | 11.20 | 5.17 | 6.03 |
| 2003 | 11.15 | 5.20 | 5.95 |
| 2004 | 11.62 | 5.50 | 6.12 |
| 2005 | 12.43 | 6.23 | 6.2 |
| 2006 | 12.60 | 6.30 | 6.3 |
| 2007 | 12.75 | 6.40 | 6.35 |
| 2008 | 13.05 | 6.60 | 6.45 |
| 2009 | 13.07 | 6.60 | 6.47 |
| 2010 | 12.70 | 5.95 | 6.75 |
| 2011 | 12.23 | 5.91 | 6.32 |
| 2012 | 13.00 | 6.14 | 6.86 |
| 2013 | 12.88 | 6.06 | 6.82 |
| 2014 | 12.86 | 5.89 | 6.97 |
| 2015 | 12.92 | 5.94 | 6.98 |
| 2016 | 13.02 | 5.96 | 7.06 |
| 2017 | 14.07 | 5.90 | 8.17 |
| 2018 | 12.41 | 5.96 | 6.45 |
Data comes from “Anhui Statistical Yearbook”.
Table 9.
Population by age and sex in Anhui Province in 2018.
| Population (Person) | |||
|---|---|---|---|
| Age | Total | Male | Female |
| 642,304 | 323,721 | 318,583 | |
| 0–4 | 38,585 | 20,605 | 17,979 |
| 5–9 | 42,390 | 23,007 | 19,383 |
| 10–14 | 40,099 | 21,765 | 18,334 |
| 15–19 | 33,341 | 17,946 | 15,396 |
| 20–24 | 34,083 | 17,735 | 16,348 |
| 25–29 | 45,604 | 22,105 | 23,500 |
| 30–34 | 40,112 | 19,124 | 20,988 |
| 35–39 | 38,652 | 18,803 | 19,849 |
| 40–44 | 45,624 | 22,778 | 22,846 |
| 45–49 | 64,872 | 32,034 | 32,838 |
| 50–54 | 64,471 | 31,760 | 32,711 |
| 55–59 | 36,672 | 18,308 | 18,365 |
| 60–64 | 34,492 | 17,526 | 16,966 |
| 65+ | 83,307 | 40,629 | 42,678 |
Data comes from “Anhui Statistical Yearbook”.
Table 10.
The impact of the “two-child” policy on the revenue and expenditure of urban employees’ pension system.
Table 10.
The impact of the “two-child” policy on the revenue and expenditure of urban employees’ pension system.
| Year | Without Implementation of the “Two-Child” Policy | With Implementation of the “Two-Child” Policy | Difference (Revenue) | ||||||
|---|---|---|---|---|---|---|---|---|---|
| Revenue | Expenditure | Current Balance | Accumulated Balance | Revenue | Expenditure | Current Balance | Accumulated Balance | ||
| 2016 | 839 | 697 | 143 | 143 | 839 | 697 | 143 | 143 | 0 |
| 2017 | 1020 | 812 | 209 | 352 | 1020 | 812 | 209 | 352 | 0 |
| 2018 | 2105 | 1818 | 288 | 639 | 2105 | 1818 | 288 | 639 | 0 |
| 2019 | 2258 | 2019 | 239 | 878 | 2258 | 2019 | 239 | 878 | 0 |
| 2020 | 2386 | 2171 | 215 | 1093 | 2386 | 2171 | 215 | 1093 | 0 |
| 2021 | 2547 | 2425 | 122 | 1215 | 2547 | 2425 | 122 | 1215 | 0 |
| 2022 | 2733 | 2681 | 52 | 1267 | 2733 | 2681 | 52 | 1267 | 0 |
| 2023 | 2874 | 2820 | 54 | 1321 | 2874 | 2820 | 54 | 1321 | 0 |
| 2024 | 3016 | 2963 | 53 | 1374 | 3016 | 2963 | 53 | 1374 | 0 |
| 2025 | 3162 | 3100 | 62 | 1436 | 3162 | 3100 | 62 | 1436 | 0 |
| 2026 | 3289 | 3263 | 26 | 1462 | 3289 | 3263 | 26 | 1462 | 0 |
| 2027 | 3507 | 3422 | 85 | 1547 | 3507 | 3422 | 85 | 1547 | 0 |
| 2028 | 3627 | 3588 | 39 | 1586 | 3627 | 3588 | 39 | 1586 | 0 |
| 2029 | 3743 | 3761 | −18 | 1568 | 3743 | 3761 | −18 | 1568 | 0 |
| 2030 | 3980 | 3942 | 38 | 1606 | 3980 | 3942 | 38 | 1606 | 0 |
| 2031 | 4204 | 4171 | 33 | 1639 | 4204 | 4171 | 33 | 1639 | 0 |
| 2032 | 4319 | 4290 | 29 | 1668 | 4319 | 4290 | 29 | 1668 | 0 |
| 2033 | 4476 | 4402 | 74 | 1742 | 4476 | 4402 | 74 | 1742 | 0 |
| 2034 | 4714 | 4681 | 33 | 1775 | 4714 | 4681 | 33 | 1775 | 0 |
| 2035 | 4842 | 4868 | −26 | 1749 | 4842 | 4868 | −26 | 1749 | 0 |
| 2036 | 5109 | 5062 | 47 | 1796 | 5199 | 5062 | 137 | 1886 | 90 |
| 2037 | 5231 | 5264 | −33 | 1763 | 5261 | 5264 | −3 | 1883 | 30 |
| 2038 | 5335 | 5473 | −138 | 1625 | 5387 | 5473 | −86 | 1797 | 52 |
| 2039 | 5611 | 5691 | −80 | 1545 | 5690 | 5691 | −1 | 1796 | 79 |
| 2040 | 5727 | 5918 | −191 | 1354 | 5790 | 5918 | −128 | 1668 | 63 |
| 2041 | 5836 | 6153 | −317 | 1037 | 5900 | 6153 | −253 | 1415 | 64 |
| 2042 | 5952 | 6398 | −446 | 591 | 5991 | 6398 | −407 | 1008 | 39 |
| 2043 | 6075 | 6602 | −527 | 64 | 6168 | 6602 | −434 | 574 | 93 |
| 2044 | 6191 | 6813 | −622 | −558 | 6358 | 6813 | −455 | 119 | 167 |
| 2045 | 6305 | 7030 | −725 | −1283 | 6548 | 7030 | −482 | −363 | 243 |
| 2046 | 6424 | 7254 | −830 | −2113 | 6827 | 7254 | −427 | −790 | 403 |
| 2047 | 6535 | 7486 | −951 | −3064 | 6912 | 7486 | −574 | −1364 | 377 |
| 2048 | 6638 | 7725 | −1087 | −4151 | 7089 | 7725 | −636 | −2000 | 451 |
| 2049 | 6741 | 7971 | −1230 | −5381 | 7100 | 7971 | −871 | −2871 | 359 |
| 2050 | 6834 | 8225 | −1391 | −6772 | 7103 | 8225 | −1122 | −3993 | 269 |
Table 11.
Sensitivity analysis of the wage growth rate.
| Wage Growth Rate 5% | Without Implementation of “Two-Child” Policy | Pessimistic Scenario | Moderate Scenario | Optimistic Scenario |
|---|---|---|---|---|
| First time when pension shortfall occurs | 2035 | 2035 | 2035 | 2035 |
| Wage growth rate 7% | Without implementation of “two-child” policy | Pessimistic scenario | Moderate scenario | Optimistic scenario |
| First time when pension shortfall occurs | 2039 | 2039 | 2040 | 2042 |
Table 12.
Sensitivity analysis of the retirement age.
| To Postpone Retirement Age by One Year Every Three or Four Years | Without Implementation of “Two-Child” Policy | Pessimistic Scenario | Moderate Scenario | Optimistic Scenario |
|---|---|---|---|---|
| First time when pension shortfall occurs | 2048 | 2050 | 2053 | - |
Publisher’s Note: MDPI stays neutral with regard to jurisdictional claims in published maps and institutional affiliations. |
© 2022 by the authors. Licensee MDPI, Basel, Switzerland. This article is an open access article distributed under the terms and conditions of the Creative Commons Attribution (CC BY) license (https://creativecommons.org/licenses/by/4.0/).
Share and Cite
MDPI and ACS Style
Hu, J.; Stauvermann, P.J.; Sun, J. The Impact of the Two-Child Policy on the Pension Shortfall in China: A Case Study of Anhui Province. Sustainability 2022, 14, 8128. https://doi.org/10.3390/su14138128
AMA Style
Hu J, Stauvermann PJ, Sun J. The Impact of the Two-Child Policy on the Pension Shortfall in China: A Case Study of Anhui Province. Sustainability. 2022; 14(13):8128. https://doi.org/10.3390/su14138128
Chicago/Turabian StyleHu, Jin, Peter Josef Stauvermann, and Juncheng Sun. 2022. "The Impact of the Two-Child Policy on the Pension Shortfall in China: A Case Study of Anhui Province" Sustainability 14, no. 13: 8128. https://doi.org/10.3390/su14138128
Note that from the first issue of 2016, this journal uses article numbers instead of page numbers. See further details here.