Article

Effects of Alternative Fertilization and Irrigation Practices on the Energy Use and Carbon Footprint of Canning Peach Orchards

by
Persefoni Maletsika
1,*,
Chris Cavalaris
2,
Vasileios Giouvanis
1 and
George D. Nanos
1
1
Laboratory of Pomology, School of Agricultural Sciences, University of Thessaly, Fitoko Str., 38446 Volos, Greece
2
Laboratory of Farm Mechanization, School of Agricultural Sciences, University of Thessaly, Fitoko Str., 38446 Volos, Greece
*
Author to whom correspondence should be addressed.
Sustainability 2022, 14(14), 8583; https://doi.org/10.3390/su14148583
Submission received: 6 June 2022 / Revised: 6 July 2022 / Accepted: 11 July 2022 / Published: 13 July 2022
(This article belongs to the Special Issue Good Practices of Sustainable Development in Agriculture)

Abstract

:
Throughout peach orchards in Greece, plant protection, fertilization and irrigation are often conducted empirically, negatively affecting energy use efficiency and greenhouse gas emissions (GHG emissions). The aim of this study was to apply alternative fertilization and irrigation practices in canning peach orchards to improve nutrient and irrigation water management and to assess yield, energy input–output and the carbon footprint of the alternative cultivation practices for three important clingstone cultivars of different ripening periods. Energy use analysis revealed that the cultivation practice with the highest energy use was almost always irrigation, followed by fertilization, plant protection, weed control and pruning. Electricity, fuels, fertilizers and machinery presented the highest energy requirements. Alternative fertilization, in combination with deficit irrigation (DI), was more energy efficient compared to farmers’ practices in all cultivars based on energy use efficiency, energy productivity and specific energy. Irrigation was the cultivation practice with the highest impact on GHG emissions due to electricity and, secondly, to fuel consumption. Alternative fertilization and DI decreased the intensity (kg CO2eq kg−1) of the emitted GHG compared to farmers’ practices. In conclusion, alternative fertilization and irrigation practices improved energy use efficiency and decreased the carbon footprint of the canning peach orchards by improving yield and decreasing fertilizer and irrigation water input.

1. Introduction

Peach processing is an important sector for the local economy in the cultivation and processing areas, but also for the national economy of Greece. The cultivation of canning peaches in Greece spreads mainly to the area of northern Greece and, to a lesser extent, to central Greece. In the EU, Greece takes up the third position in total production of peaches and nectarines. Important Greek processing industries absorb the total production and the final products (cans, glass jars, aseptic fruit, puree or juice), and almost entirely (98%) are exported mainly to the EU (80%) [1].
In recent years, peach processing industries have been emphasizing the quality and nutritive value of the raw product, which must be safe for humans (mainly free of pesticide residues) and environmentally friendly. Processing industries try to collaborate with farmers to intervene in the cultivation management of the raw product in order to cover the consumer and market requirements and standards. Consumers often hear or use terms such as ‘sustainable’, ‘green’ and ‘reduced carbon footprint’, and expect more sustainable products and services in terms of economics, natural resource depletion and global warming potential (GWP), in addition to healthy and safe products [2]. Thus, the peach processing industries move towards more environmentally friendly products and certification of these products.
On the other hand, the antagonism leads to an intensification of cultivation to reach a higher yield, to decrease production costs and, finally, to provide a higher income to the farmer. Integrated crop management has been implemented for almost 20 years now; unfortunately, it has not been implemented ‘fully’. Usually its application is based on complete plant protection, and it is characterized by incomplete management of other practices such as irrigation and fertilization. Thus a more holistic intervention is required to deal with crop management with the participation of main cultivation practices in addition to chemical plant protection. Apart from the above, we face a climatic change which may hit the tree crops at multiple levels and cause serious stress to plants, which is expected to have a negative impact on crop productivity, mainly because of extreme temperatures, lower precipitation and reduced water availability [3]. For this reason it is crucial to target actions for a more environmentally friendly and sustainable peach cultivation that will improve the antagonism of peaches. Thus the rational management of fertilization, irrigation and crop protection remains of major significance.
Life Cycle Assessment (LCA) is often used to quantify the environmental impact of a product or a service, and can help to optimize energy consumption and minimise environmental burdens during production [4]. A carbon footprint (expressed as the GWP in net kilograms CO2 or equivalent for other greenhouse gases such as methane (CH4) and nitrous oxide (N2O) released or sequestered per functional unit of the product or practice] is usually the most common component of LCA systems [2]. GHG emissions are also directly linked with energy use in agriculture [5].
Energy management is a fundamental issue in terms of efficient, sustainable and economic use of energy [6]. Energy input–output analysis of a system is applied to measure its energy efficiency, as it is one of the main requirements of sustainable agriculture [7,8]. Energy use analysis can indicate ways to decrease energy input and increase energy efficiency without negatively affecting crop production economics [9], while simultaneously it could increase productivity [5]. Thus, energy analysis is frequently used in combination with other environmental or economic indicators to obtain the best management strategies [10].
Several researchers have analysed the energy use [6,7,8,9,11,12] and the GHG emissions [13,14,15,16,17,18] for different crops, agricultural production systems and cultivation practices in order to evaluate the energy use efficiency, the environmental effects and their relationship to sustainability. Enhancing energy efficiency not only helps to increase the productivity and profitability ratio, but also results in minimised GHG emissions and environmental impact [19].
Until now, the quantification of energy use and GHG emissions of different ripening periods for canning peach orchards and the effects of the alternative use of fertilization and irrigation on the energy input–output and GHG emissions are limited. The main objectives of this study were: (1) to evaluate the energy use and carbon footprint of the current cultivation scheme followed by the farmers for three important processing cultivars: the early ripening ‘Catherina’, the mid-season ‘Andross’ and the late-season ‘Everts’, in order to understand the environmental impact of the specific agricultural production system and to identify ways that growers can improve overall the efficiency of the cultivation, (2) to suggest an alternative cultivation method by improving fertilization and irrigation management according to the needs for nutrients and water at specific stages of peach cultivation, and (3) to compare energy use and carbon footprint of the two cultivation methods. The functional unit was defined per kg of peaches at farm gate.

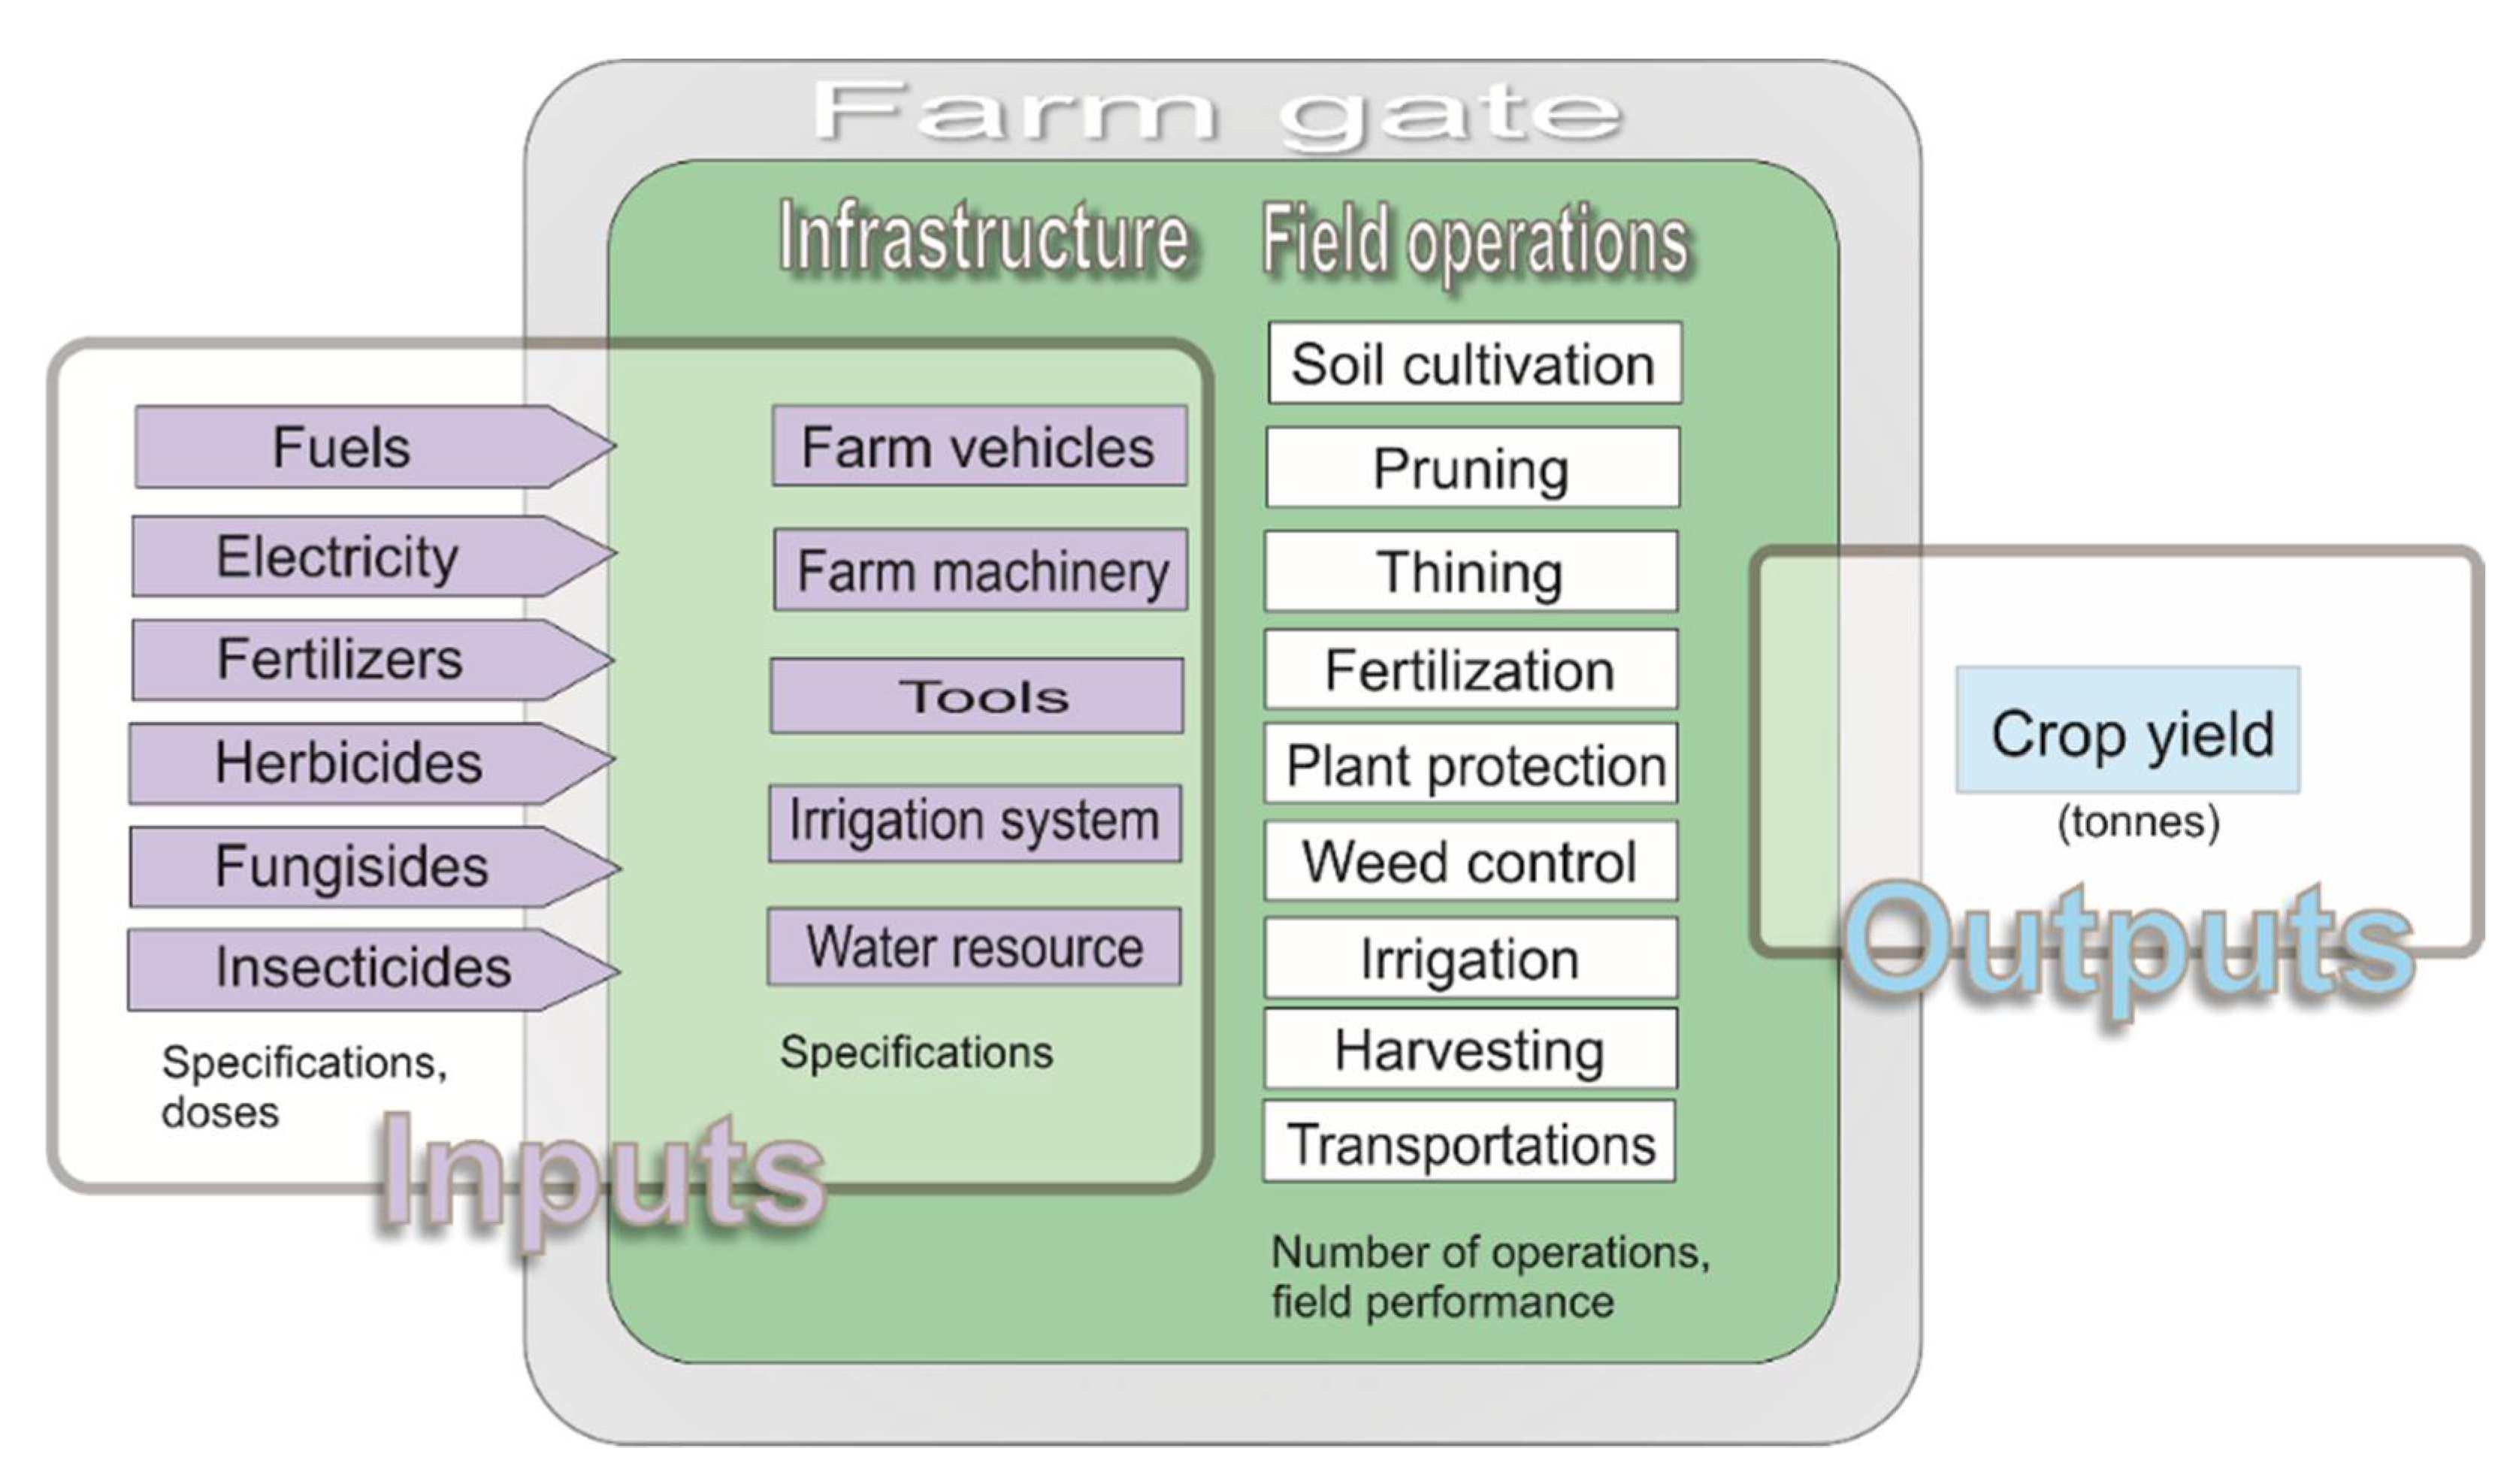
2. Materials and Methods

The research was conducted in three commercial canning peach orchards of three cultivars: the early ripening ‘Catherina’, the mid-season ‘Andross’ and the late-season ‘Everts’ grafted on GF677 during 2020. The orchards were located at Pella, in northern Greece. ‘Catherina’ and ‘Everts’ trees were trained to open vase, while ‘Andross’ trees were trained to a fruiting wall system, and all were cultivated according to local horticultural practices. The size of the studied orchards was 1.20, 0.45 and 0.90 ha; tree spacing was 5 m × 5 m, 2.5 m × 4.5 m and 3.8 m × 5 m; and the age was 5, 7 and 4 years for ‘Catherina’, ‘Andross’ and ‘Everts’, respectively. Soil analysis was conducted for each farm and is presented in the Table 1.
Detailed data for the horticultural practices of the farmers were collected through personal interviews. The system boundaries for energy analysis and the carbon footprint of canning peach production were defined as shown in Figure 1.
To investigate the effect of an alternative fertilization and irrigation protocol on energy input–output and GHG emissions of canning peach production, experimental applications were carried out at each orchard with the two following treatments:
  • Farmers’ traditional practices
  • Alterative cultivation protocol comprising deficit irrigation (75% of ETc) and fertilization schemes combining balanced applications of surface granular fertilizers, foliar fertilizers and fertigation.
At the ‘Catherina’ orchard, deficit irrigation was applied in the postharvest stage, while in the ‘Andross’ and ‘Everts’ orchards it was applied at pit hardening. Except for irrigation and fertilization, the other agricultural practices (weed management, crop protection, etc.) were common among the two treatments. Details are presented in Table S1 in the Supplementary Materials.
Each treatment consisted of 10 tree replications. At fruit commercial harvests, yield per tree was recorded and expressed per hectare. The pit hardening period was evaluated by recording fruit growth (diameter measurement) from fruit set until fruit harvest. The pit hardening period for ‘Andross’ was found to be from early June to early July, and for ‘Everts’ from late May to early July.
The energy use for peach production is associated with the machinery used for farm operations, transportation to the field and processing point, water for irrigation, agricultural inputs (fertilizers, pesticides, etc.), supplementary tools (ladders, bins, etc.) and human labour. All necessary detailed data were logged during personal interviews with each farmer (Table S1).
The energy inputs involve direct and indirect energy sources [20]. Direct energy inputs come from human labour and fossil fuel (diesel or gasoline) consumption (accounting also for the lubricants) during field operations or transportation. Human energy was counted as the energy content of the consumed food, equivalent to 2.2 MJ h−1 [21], and was estimated by recording the working hours per ha. Fuel consumption was measured by top filling and refiling the tank of the tractor or light truck after a specific area or distance covered within a certain period of time. The data were used to calculate fossil fuel consumption (L h−1) (Table 2). The energy equivalent for diesel accounted for 47.78 MJ L−1 (including the caloric value and the energy for mining, refining and transporting the fuel) and for gasoline, 42.32 MJ L−1 [22]. Subsequently, energy use (MJ h−1) was estimated and was finally converted to energy use per ha from all inputs used (Table S1). Lubricant energy was estimated as 4% of fossil fuel energy [22]. Energy for irrigation was estimated by calculating the absorbed power and the electricity consumption as described by [20]. The number of irrigation events, water applied per irrigation event, pumping depth, network pressure, pump rated power and pump discharge rate were all essential information retrieved by the farmers (Table S1). Table 2 presents the direct energy used in irrigation in MJ h−1 ha−1.
Indirect energy inputs come from machinery and infrastructure use and from agricultural inputs. Machinery and infrastructure energy include the energy embodied in materials and the sequestered energy during the manufacturing process. The most widely used value for estimating this type of energy is 86.77 MJ kg−1 [23]. The indirect energy of machinery also includes the energy consumed for repairs and maintenance (estimated as 0.49 times the energy for manufacturing) and energy for trading and the delivery of equipment to the owner (accounted as 8.8 MJ kg−1) [22,24]. The rate of indirect energy use depends on machinery or equipment life span hours (Table 3) and real field performance (ha h−1) as reported from the farmers (Table S1). For the truck, the estimated life in hours was calculated at 7500 h by considering a travel lifetime of 300,000 km divided by a mean travel speed of 40 km h−1. All inputs were initially estimated per hour of use and were consequently converted to MJ per ha. Another important source of indirect energy inputs is agricultural input (fertilizers, pesticides, etc.). The energy for their production is consumed outside the farm’s gates, but enters the farm embodied in the products. The inputs were estimated from the applied doses per ha and the corresponding energy content from the literature (Table 4).
The energy outputs were estimated by the energy content of the peach fruit, equal to 3.37 MJ kg−1 [34], and the corresponding yields for each treatment and farm. They were also expressed in MJ ha−1. Net energy (energy outputs minus total energy inputs), energy efficiency (output/input ratio), specific energy (energy used per kg of product) and energy productivity (kg of product per unit energy used) were estimated.
The assessment of GHGs included emissions due to the use of fossil fuels and electricity; emissions due to the production, transportation, storage and transfer of agricultural inputs [35]; and emissions due to the fossil fuel consumption for manufacturing all components of machinery [28]. GHG emissions were managed as CO2 equivalents (CO2eq), which was calculated by multiplying the input application rate (fuel, fertilizers, pesticides and electricity used for irrigation) by each corresponding CO2eq emission factor (Table 5).

3. Results and Discussion

3.1. Analysis of Input–Output Energy Use

Energy use analysis revealed that irrigation was the cultivation practice with the highest energy use for all farms and both cultivation systems except for the farm with ‘Everts’ peaches, where irrigation was the second most energy demanding practice after fertilization (Table 6, Table 7 and Table 8). Following irrigation, the most energy demanding cultivation practices were fertilization, plant protection, weed control and pruning, while fruit thinning and harvest were the cultivation practices with the least energy consumption for all farms and both cultivation systems. Regarding production coefficients, electricity, fuels, fertilizers and machinery presented the highest energy requirements, while human labour, irrigation water, pesticides, herbicides, and tools provided low contributions in total energy input for all cultivars and cultivation systems (Table 9, Table 10 and Table 11). In other peach orchards in Greece, the most important production coefficients were machinery and tools followed by irrigation, fuels, fertilizers, pesticides and labour [14]. The impact of orchard management activities and products on the use of resources and energy as well as on GHG emission was studied in the peach production sector of Italy, and both fuel consumption and GHG-emissions were found to be the most significant inputs due to the energy use for water pumping and for the maintenance of agricultural equipment [16].
Comparing the three cultivars, the highest energy input was found for the mid-season ‘Andross’, and the lowest for the early ripening ‘Catherina’ (Table 6, Table 7 and Table 8). Concerning irrigation, ‘Andross’ consumed the highest and ‘Everts’ the lowest energy use. The energy use for irrigation depended on irrigation events, water quantity used, pumping depth, irrigation network pressure, pump rated power, pump discharge rate, ripening period of the cultivar and soil texture (Table S1). Because of the earlier ripening period of ‘Catherina’ and limited postharvest irrigation, the farm was irrigated fewer times than the other cultivars. In the case of ‘Andross’, the soil texture of the farm was light, and this justifies the higher frequency of irrigation compared to the late ripening ‘Everts’. In the case of ‘Everts’, irrigation water supply came from the Local Organization for Land Reclamation resulting in lower energy use for irrigation compared to the other cultivars. In addition, the irrigation method used for ‘Everts’ can be characterized as inefficient, because the farmer irrigated sparsely with low irrigation water quantities (on a farm with heavy soil), and this resulted in low electricity use for this farm. The insufficient irrigation volume of ‘Everts’ could also be ascertained from the low yield and vigour of the trees observed in situ. In contrast, the ‘Andross’ yield was high, but the irrigation method and fertilization could still be improved, because in situ observations showed very dense and vigorous shoot growth, causing problems such as increased needs for pruning and plant protection.
Fertilization, especially in the farmers’ practice, was a major energy input because of the application of high quantities of fertilizers. It is crucial to manage tree mineral nutrition to optimize fruit yield and quality [38]. As shown in Table S1, farmers in the study area commonly apply excessive amounts of fertilizers, and also spread the fertilizers around the tree canopy, not only on the irrigation zone. In particular, the manager of the ‘Everts’ farm used mainly, and in very high quantities, nitrogen fertilizers resulting in the highest energy input from fertilization compared to the ‘Andross’ and ‘Catherina’ farms (Table S1, Table 6, Table 7 and Table 8). As irrigation of the ‘Everts’ trees was limited (one sprinkler with low water supply per tree), fertilizer use efficiency was low, given also the low yield. Excessive use of fertilizers results in low use efficiency of fertilizers and possible environmental contamination, but also increased cultivation and energy costs. A correct nutrient supply should take into account expected fruit yield (including fruit quality and storage issues) and environmental concerns (to minimise leaching, soil pollution and volatile emissions) [38]. Fertilizer inputs should be based on periodical soil and leaf analysis, expected yield and tree vegetative growth, and an upper limit to annual fertilizer applications should be set [38].
The energy consumption for plant protection for the three cultivars depended on the frequency of pesticide applications, the kind of pesticide, machinery use and the fuel consumption by the tractor (Table S1). Thus, the ‘Andross’ farm showed the highest energy use for plant protection, while the ‘Everts’ farm had the lowest. Concerning weed management, ‘Catherina’ farm presented the lowest energy use compared to the other cultivars, as weeds on the tree row were mowed with a handheld mower without any herbicide use (Table S1). Energy use for pruning was also the lowest at the ‘Catherina’ farm, because the farmer used only electric scissors instead of aero-scissors that the other farmers used. For all the above cultivation practices, fuel became one of the most important production coefficients for all farms and both cultivation systems (Table 9, Table 10 and Table 11). In all farms, fuel consumption was due mainly to the use of tractor for plant protection, foliar fertilization, weed management, and, to a lower degree, pruning and pruning shredding (Table S1).
Alternative fertilization and irrigation practices significantly reduced energy use compared to farmers’ practices (Table 6, Table 7 and Table 8). Regulated deficit irrigation has been studied in peach orchards in various production regions as a strategy to reduce water use in dry climates [39]. This approach induces a moderate stress to decrease vegetative growth and increase water savings at particular physiological stages without influencing yields [40]. Water stress-tolerant stages for peach have been reported as stage II (pit hardening and the lag phase of fruit growth) and postharvest. In the current study, the application of deficit irrigation during pit hardening for ‘Andross’ and ‘Everts’, or during postharvest for ‘Catherina’, decreased electricity and water consumption by 10% compared to farmers’ practice, without any negative effect on fruit yield (Table 6, Table 7 and Table 8). It was reported that RDI in peaches at pit hardening could be effective for maintaining fruit yield by reducing vegetative growth, but it was also pointed out that trees should have recovered from water stress before stage III. In addition, postharvest deficit irrigation in early-maturing cultivars is a practice to save water during the long postharvest period rather than in the preharvest period, and does not interfere with fruit growth in the same season, given that there will be no negative effect on the subsequent year’s yield [41].
The application of alternative fertilization was targeted to a complete and balanced tree nutrition based on tree needs and in doses during the season. The foliar application of N, P, B and Zn in autumn (Table S1) was conducted for tree preparation for next spring’s shoot and fruit growth. The alternative fertilization resulted in a reduction of the quantity of fertilizers and a significant reduction of energy input by fertilization compared to farmers’ fertilization. Alternative fertilization caused slightly higher fuel consumption because of the extra foliar fertilization in repeated applications until September that increased the use of a tractor and sprayer (Table S1, Table 9, Table 10 and Table 11). Alternative fertilization increased fruit yield, resulting in higher fertilizer use efficiency, compared to farmers’ fertilization practices.
Energy indices, including energy use efficiency, energy productivity and specific energy, revealed that alternative fertilization in combination with deficit irrigation was more energy efficient compared to farmers’ practices in all cultivars (Table 9, Table 10 and Table 11). In addition, alternative fertilization with deficit irrigation slightly increased fruit yield in all farms, thus increasing energy outputs (Table 9, Table 10 and Table 11). Comparing the three farms (and farmers’ vs alternative practices), the ‘Catherina’ farm was found to be the most energy efficient, followed by the ‘Andross’ farm, while the least efficient was the ‘Everts’ farm.
Other researchers have found lower total energy for peach production in Iran, i.e., 47,951.52 MJ ha−1 with the highest share of energy consumption due to chemical fertilizers (35.37%) and energy use efficiency, energy productivity, specific energy and net energy calculated as 0.433, 0.228 (kg MJ−1), 4.38 (MJ kg−1) and −27,161.722 (MJ ha−1), respectively [11]. In another area of Iran, total energy consumption for peach production was 37,536.96 MJ ha−1, lower than that found in the current study, where the diesel fuel had the highest contribution on energy consumption (26.32%) and peach production was less energy efficient because energy use efficiency, energy productivity, specific energy and net energy were 0.55, 0.29 kg MJ−1, 3.41 MJ kg−1 and −16,642.03 MJ ha−1, respectively [42]. In Turkey, the total energy requirement for peach production on average was 36,284.51 MJ ha−1, lower than our findings. Total energy input use decreased as orchard size increased, and energy input from fertilizers was the largest energy input, followed by diesel oil and pesticides for all orchard sizes [6]. Research on Sicilian peaches documented that the largest impact on environmental and economic sustainability for peach production was due to irrigation, as large volumes of water and energy were used, and thus GHG emissions could be reduced by improving irrigation practices and agricultural machinery use. Other significant factors were land transformation, fertilizer and pesticide production and use [16]. A comparison of energy efficiency among conventional, integrated and organic farming systems of peach orchards in Greece, and the effect of the farming systems on GHG emissions, proved that organic farming resulted in lower GHG emissions and energy inputs in a more efficient way [14]. In another study, comparative energy use and an economic analysis of peach production using good agricultural practices showed that total energy consumption was 28,416.08 MJ ha−1 when good agricultural practices were applied, compared with 40,036.94 MJ ha−1 for local practices, proving that using good agricultural practices in peach farming is advantageous [12]. In that study, fertilizers and diesel fuel contributed significantly to total energy consumption, especially when good agricultural practices were not applied.

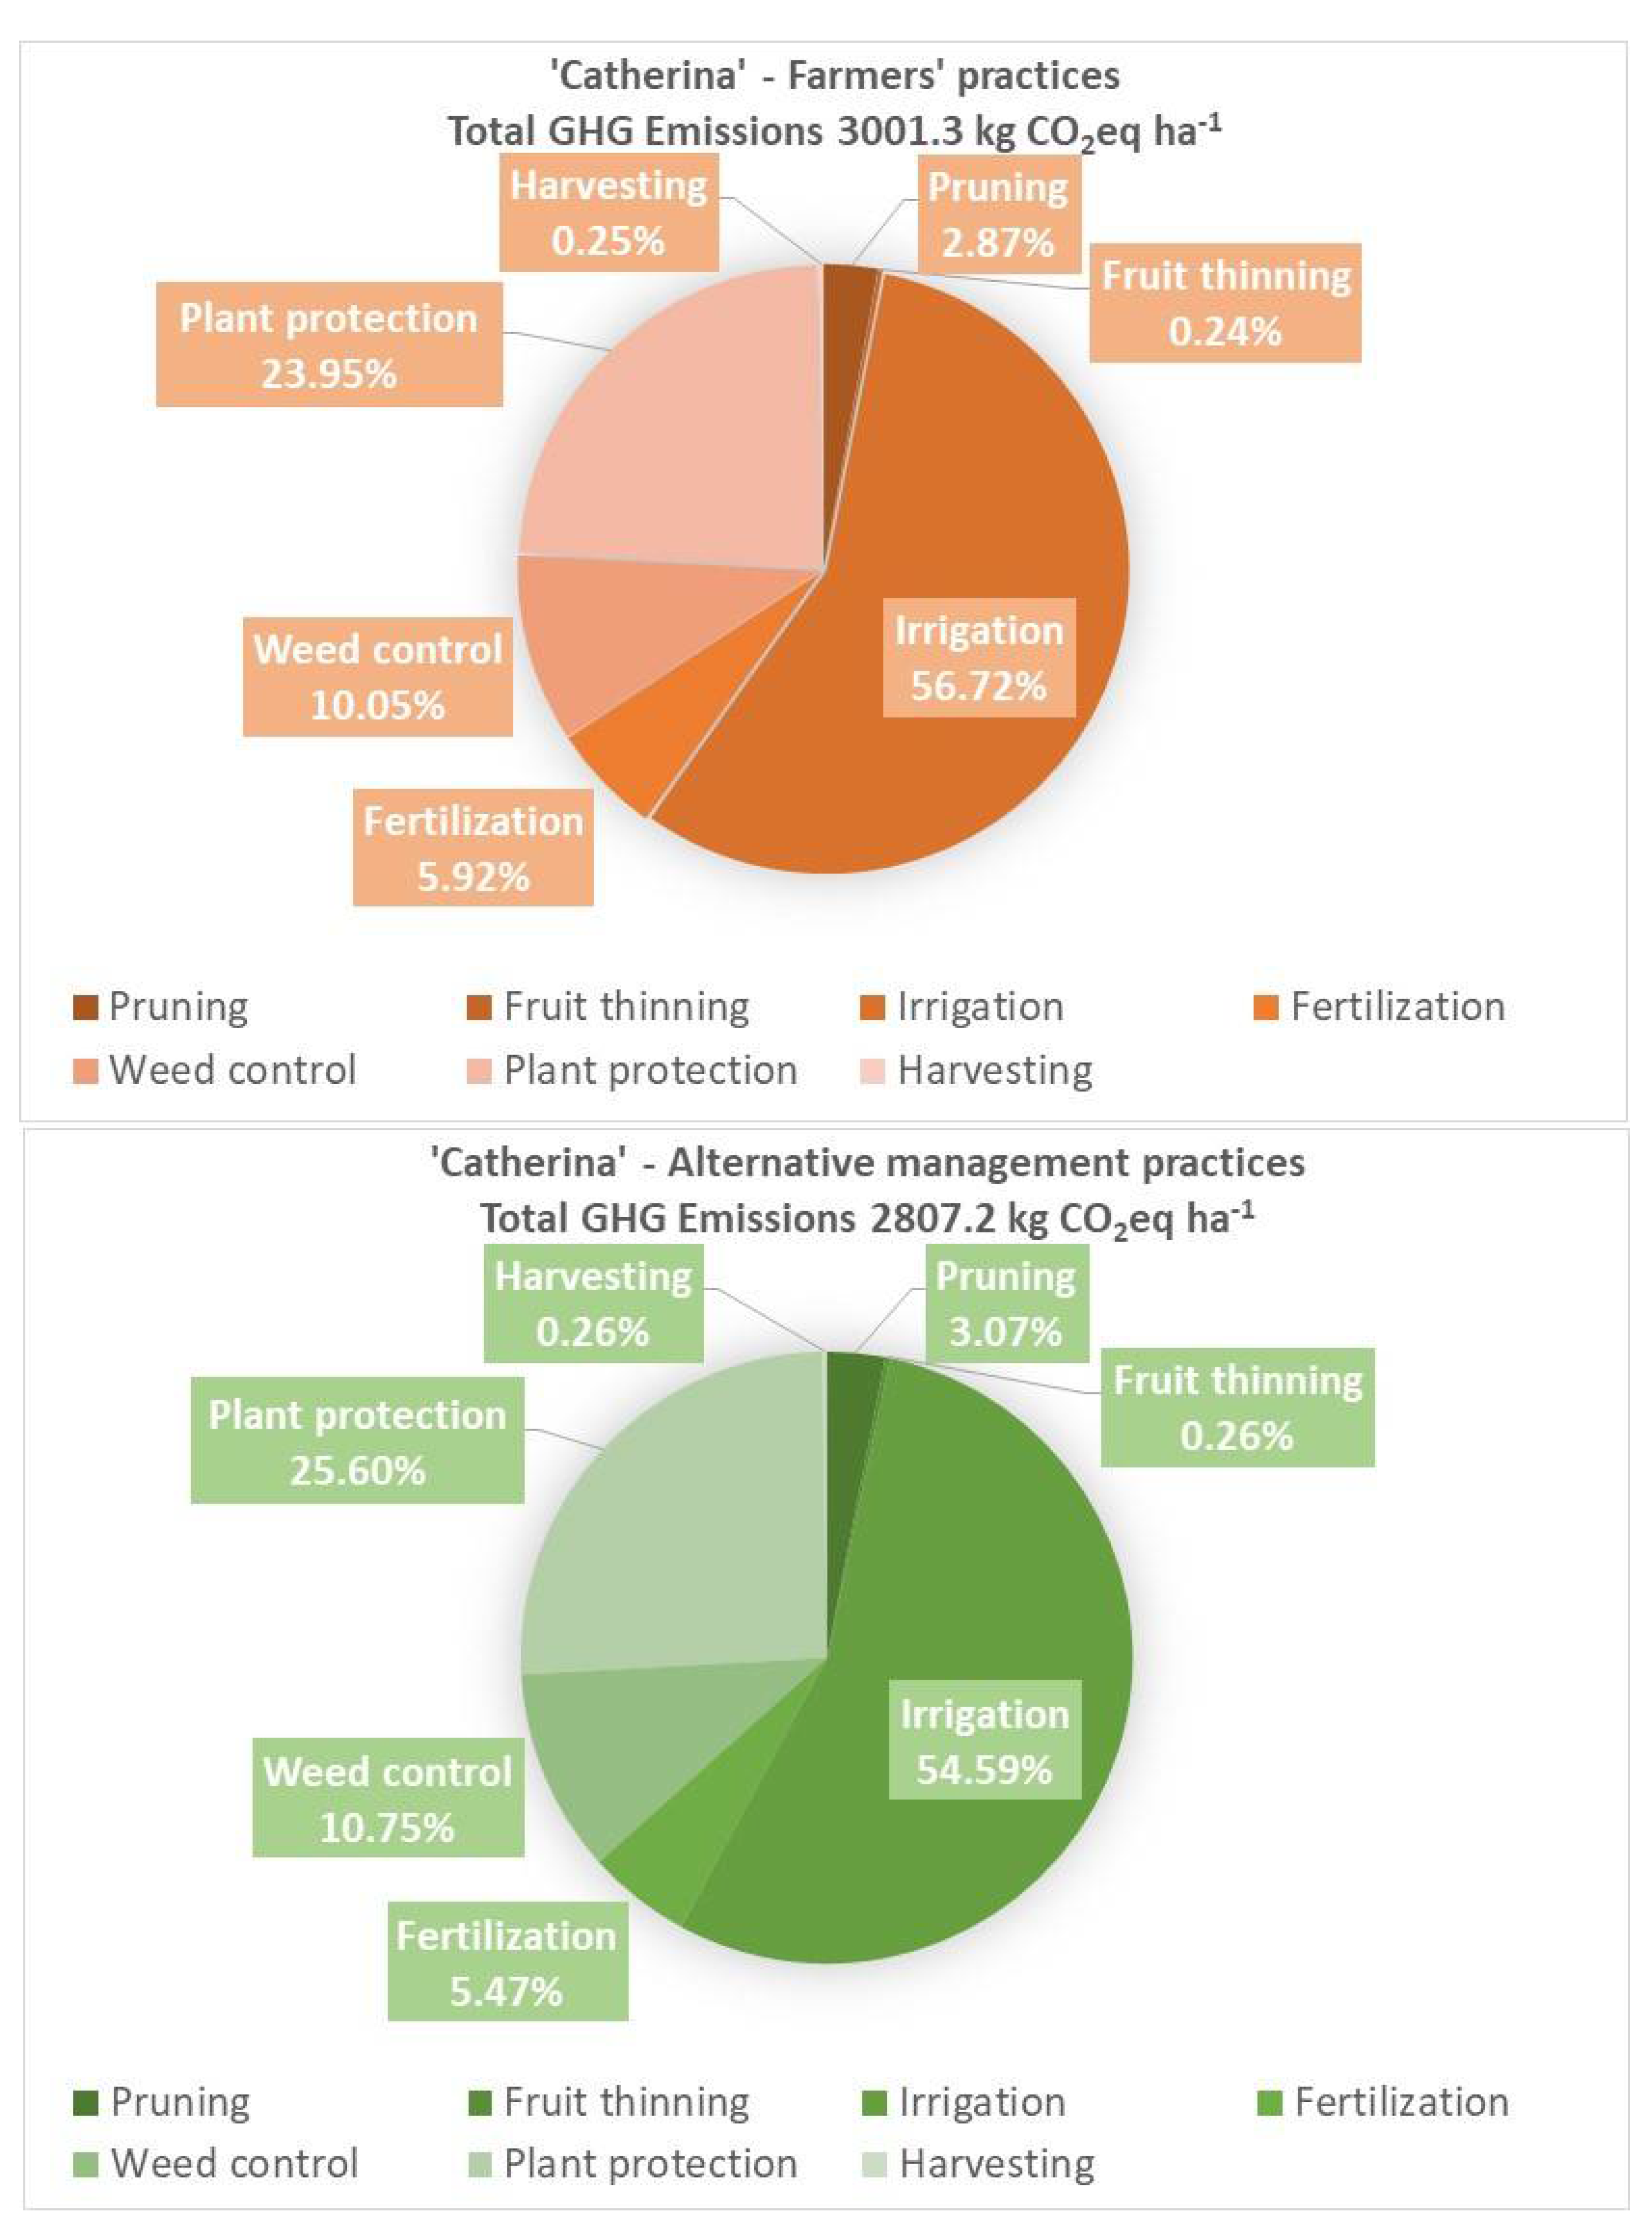
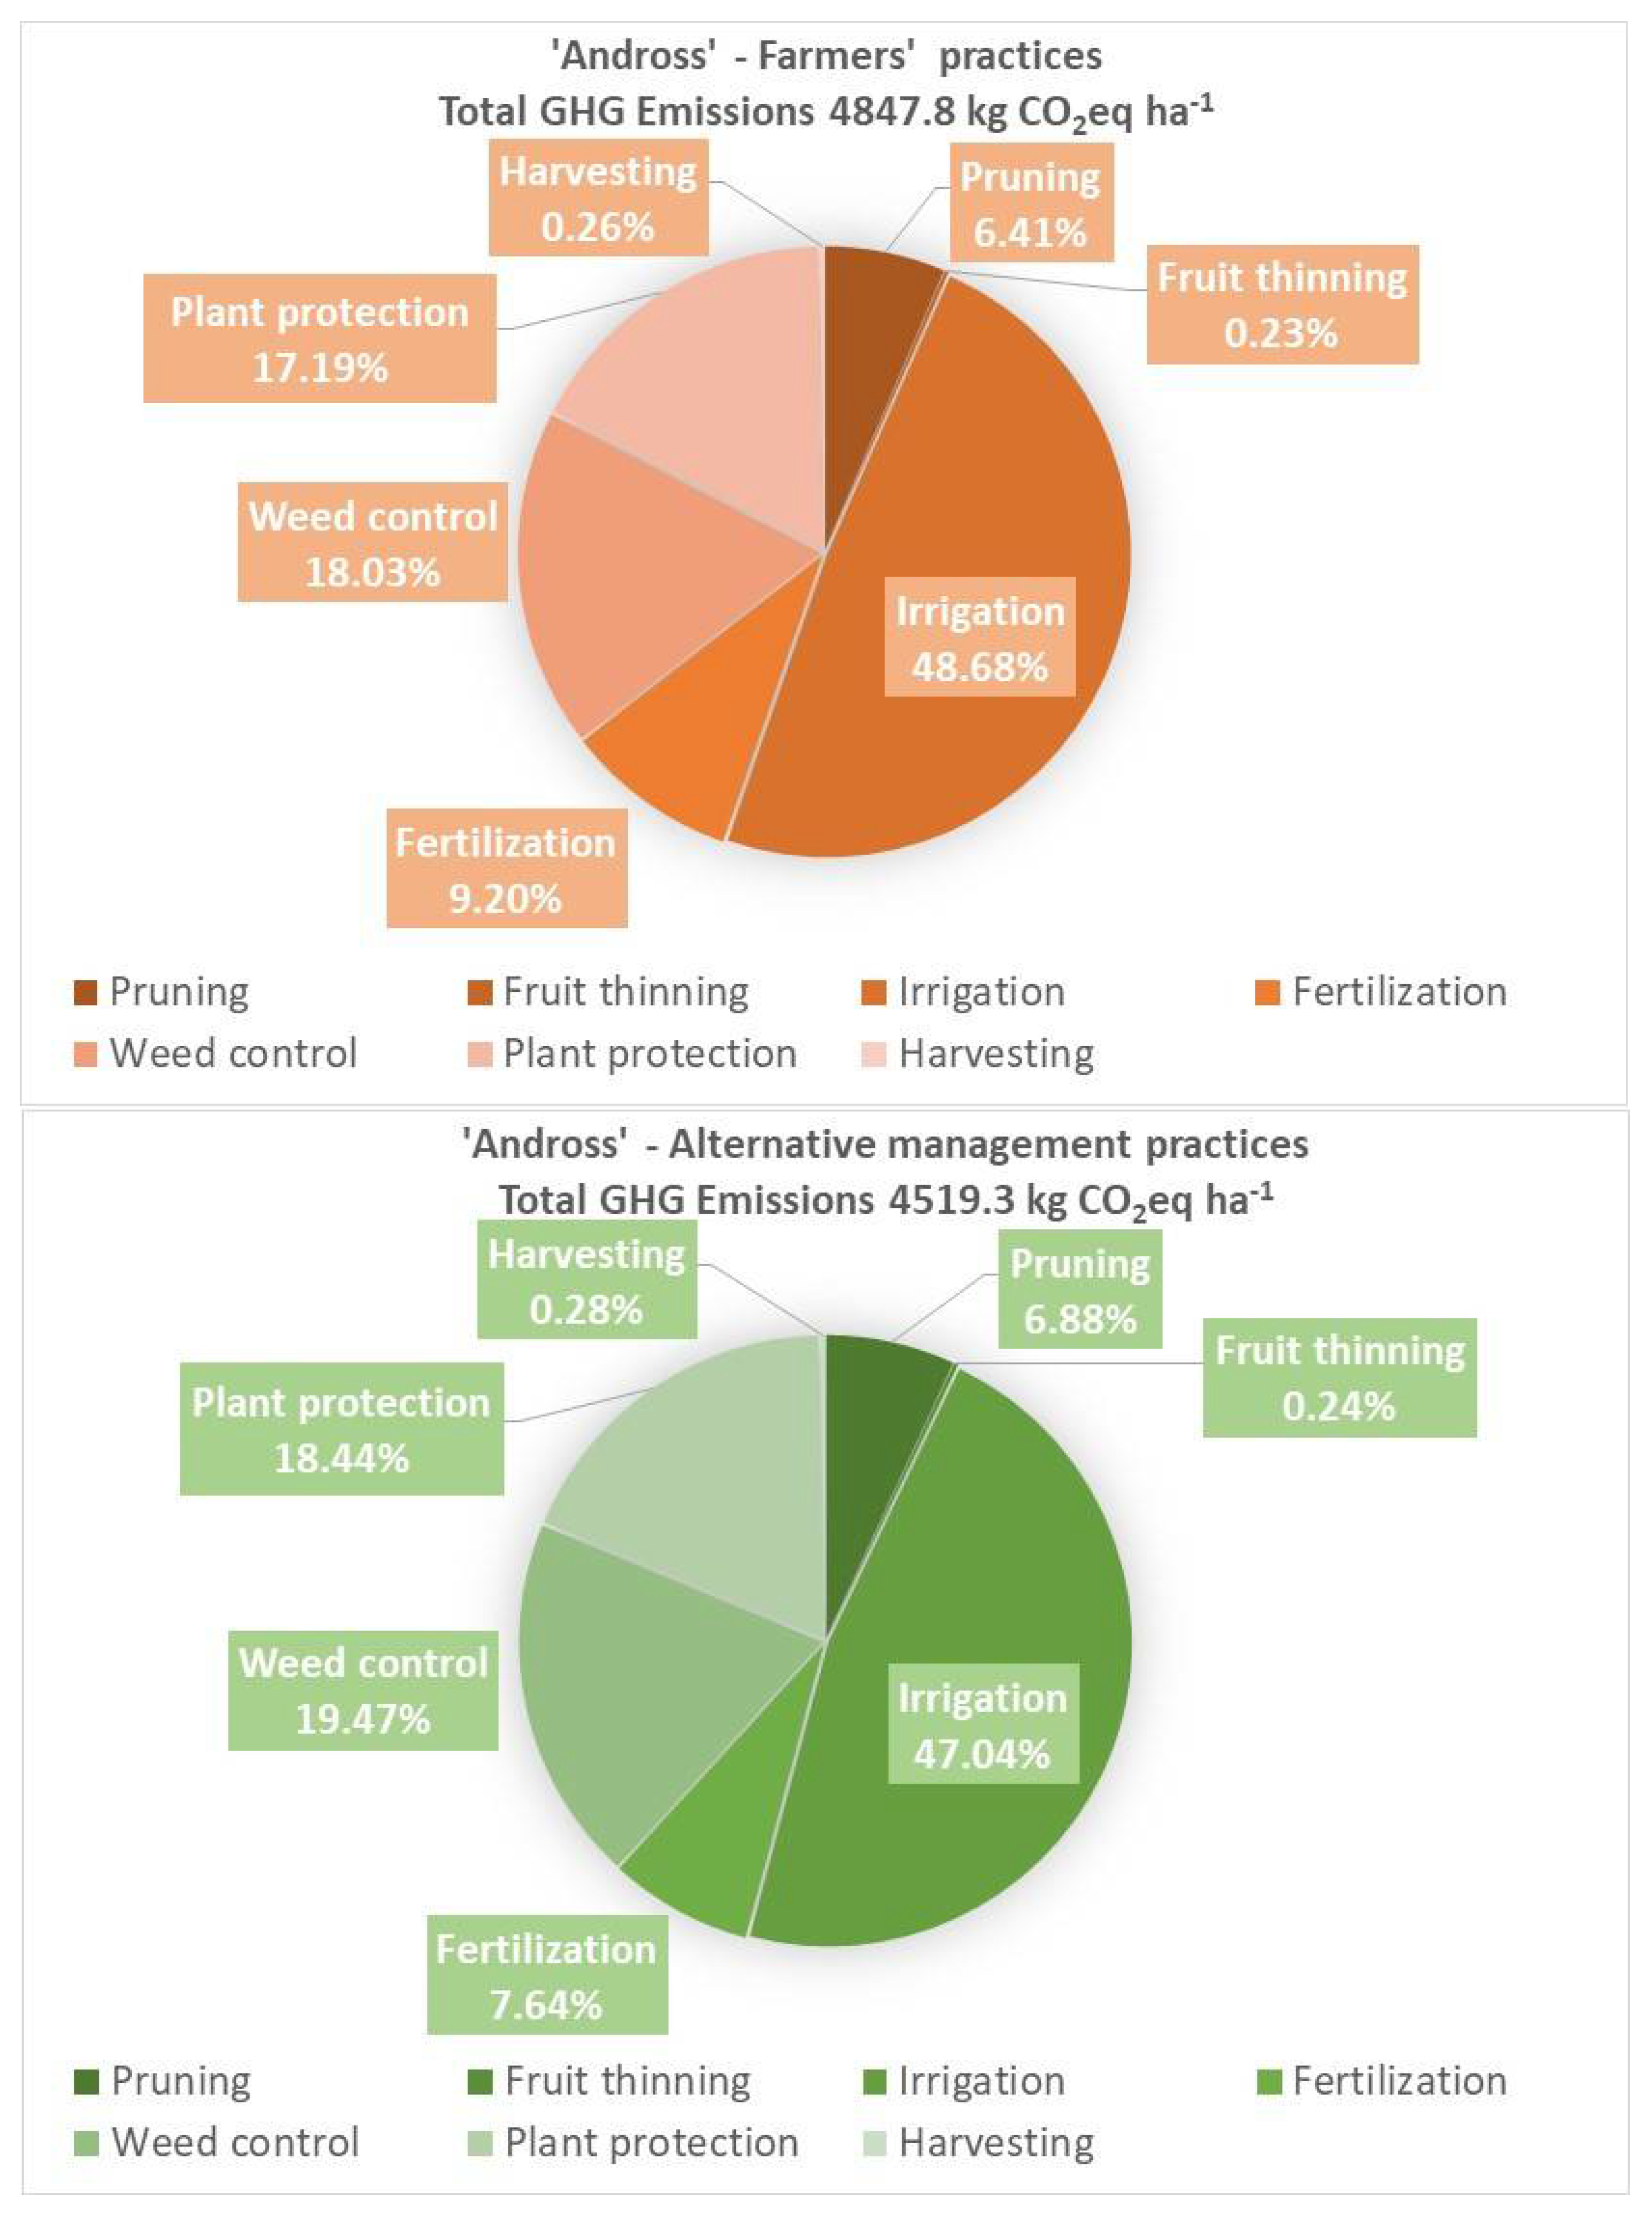
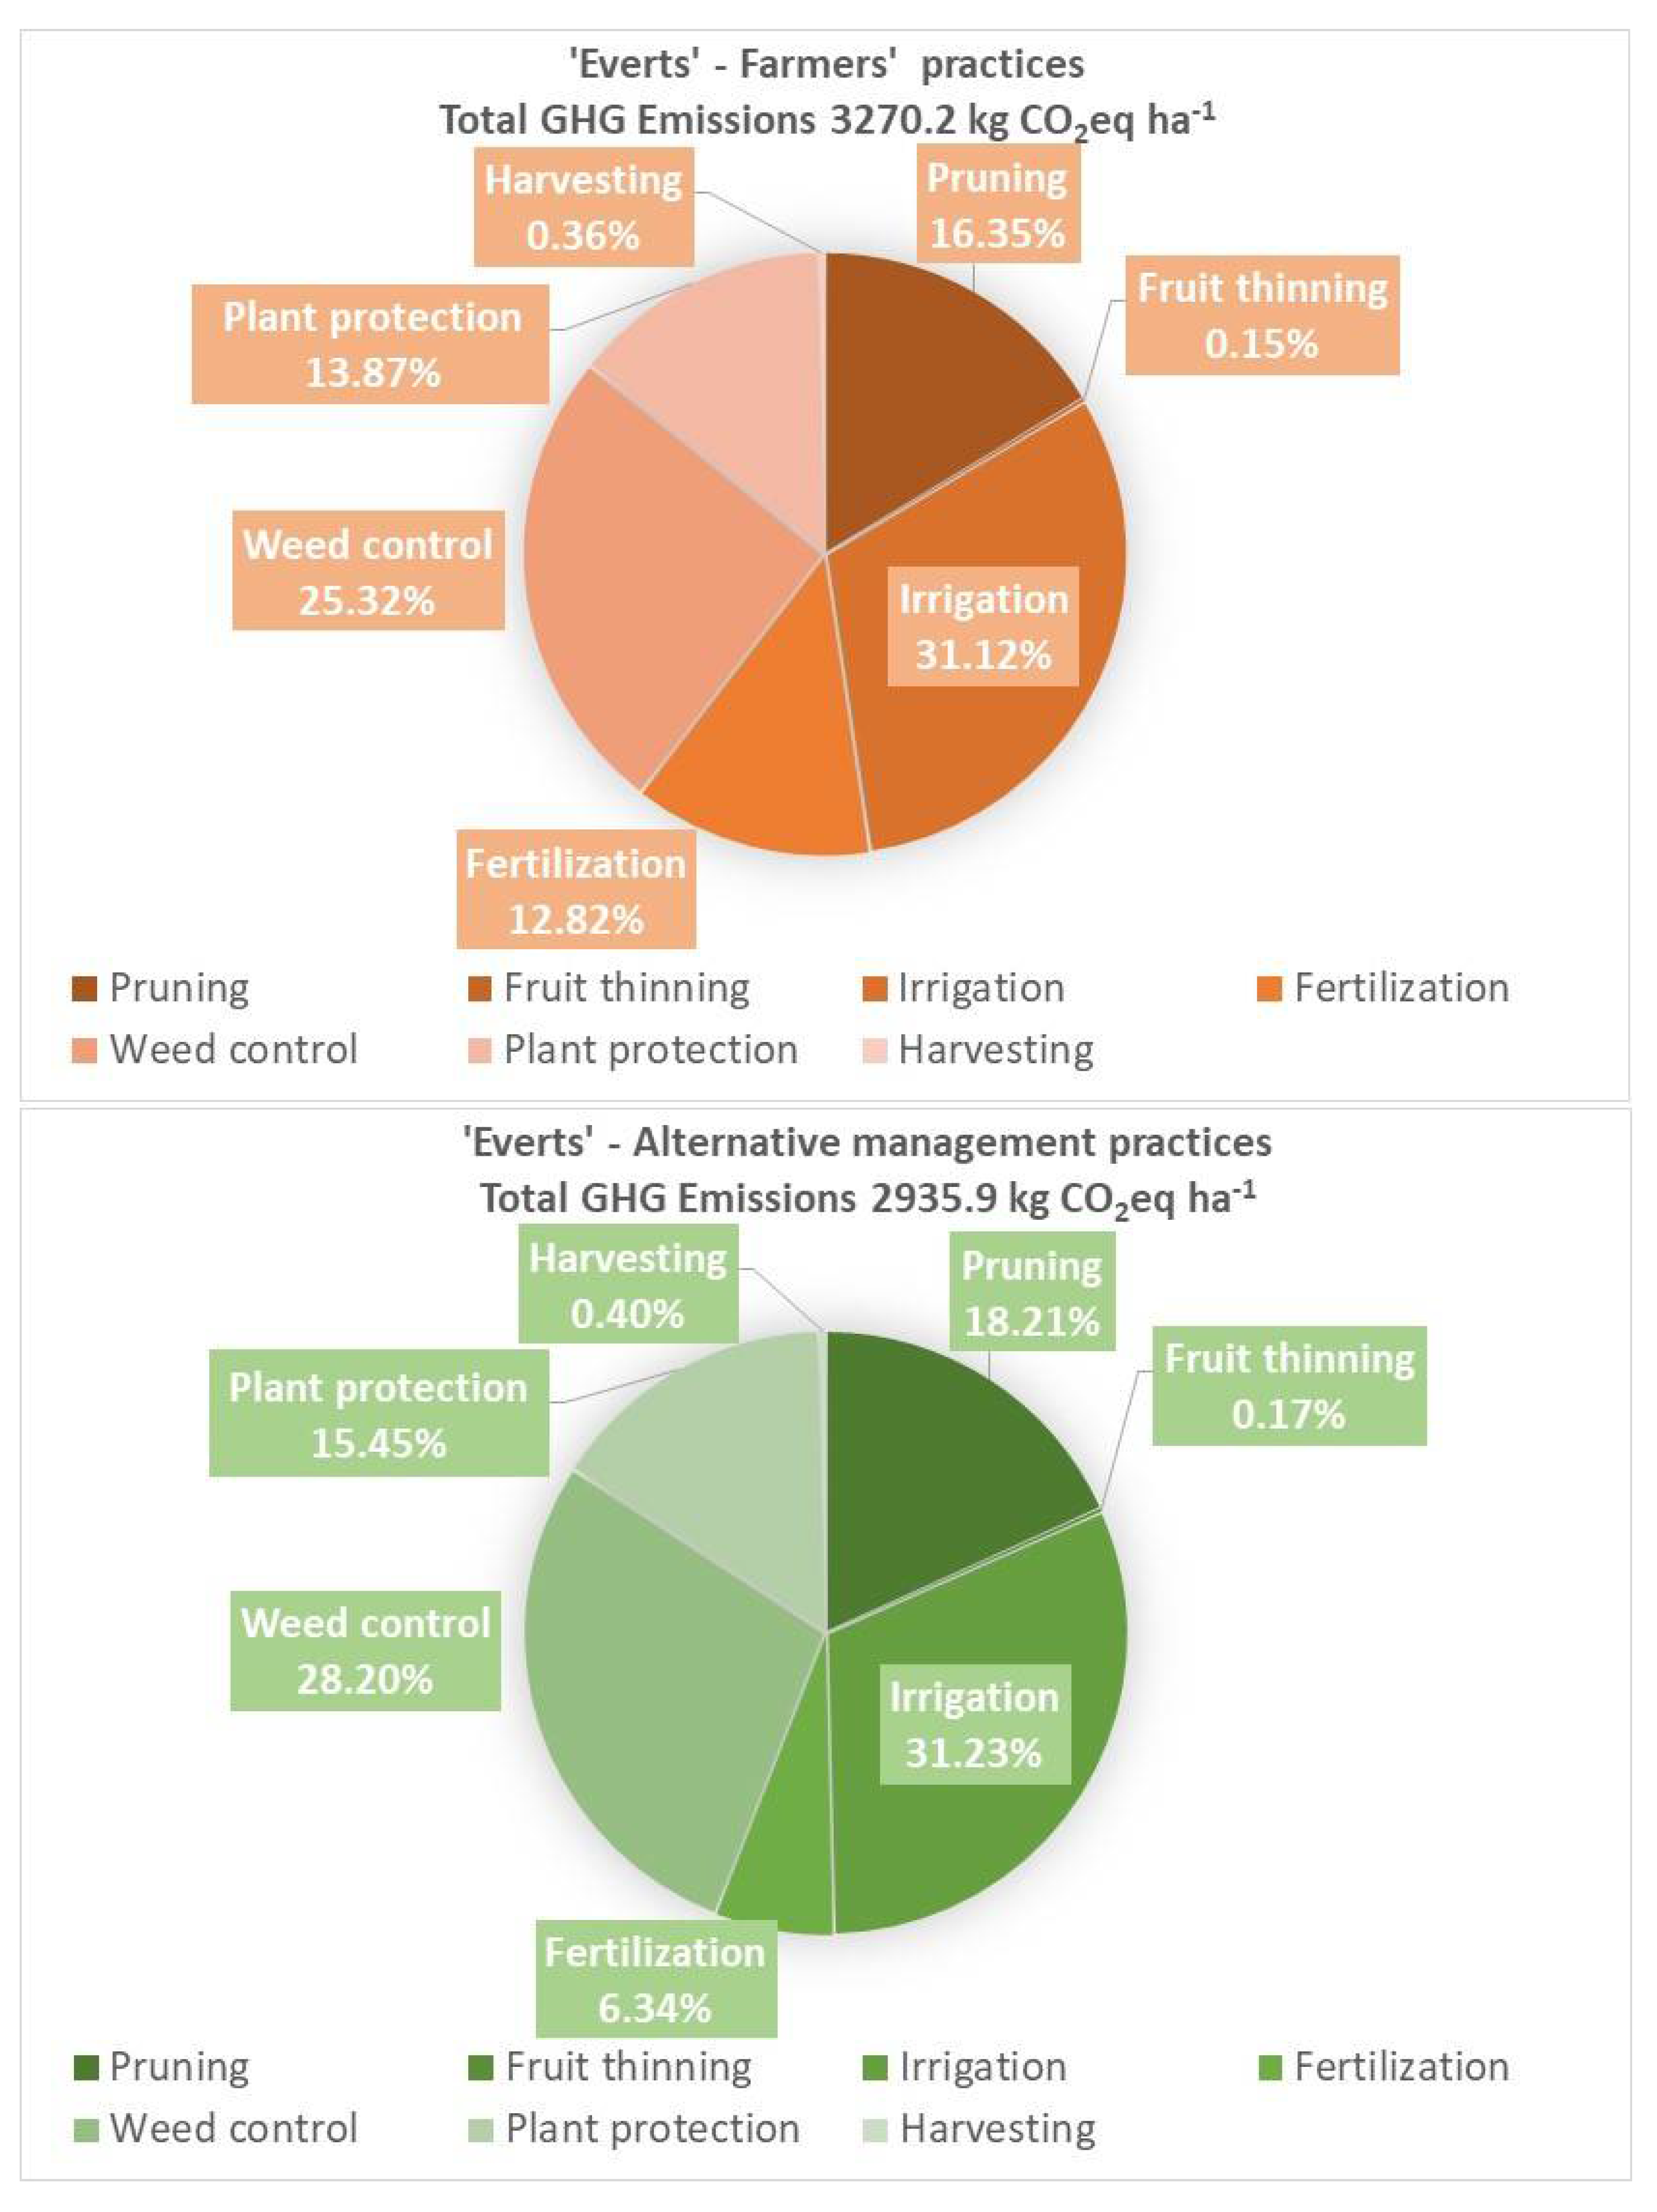
3.2. Analysis of GHG Emissions

The farm with cv. ‘Catherina’ presented the lowest total GHG emissions (kg CO2eq ha−1), followed by that with cv. ‘Everts’, while the farm with cv. ‘Andross’ presented the highest GHG emissions (Table 12, Table 13 and Table 14, Figure 2, Figure 3 and Figure 4). The difference in total GHG emissions per ha among the peach cultivars was not associated with the different maturation period, but with the different cultivation practices applied by the farmers. Yield output was also found to be responsible for the differences in kg CO2eq emissions per kg of peach fruit among cultivars. Compared with other studies, the results of our study of the GHG emissions at the farms for the three cultivars are close to those derived from a multiyear LCA analysis of a peach orchard in Spain, where CO2 emissions per kg of peach value were 0.15–0.20 kg CO2eq kg−1 [43]. Higher GHG emissions from peach orchards in major peach-producing regions of China have been reported [44]. They found that GHG emissions from peach orchards of different regions ranged from 15,668 to 580 kg CO2eq ha−1, with corresponding carbon footprints from 0.48 kg CO2eq ha−1 to 0.20 kg CO2eq ha−1, respectively. Fertilizer inputs, fuel consumption, cultivar and yield output were the reasons for these large GHG differences [44]. In Iran, an LCA analysis of peach production to evaluate cradle-to-gate environmental impact showed that to produce 1 Mg of peaches, 172.16 kg CO2eq were emitted [45]. Thus, in northern Greece, the carbon footprint of canning peach orchards was relatively low compared with other areas around the world.
Irrigation was the cultivation practice with the highest impact on GHG emissions for all the cultivars and both cultivation systems (Table 12, Table 13 and Table 14; Figure 2, Figure 3 and Figure 4), followed by plant protection, weed control and fertilization. It is clear that the cultivation practices (either farmers’ practices or alternative practices) with the highest impact on carbon footprint for the three cultivars are the ones most demanding of fuel consumption and electricity (for irrigation). Electricity and fuel were the production coefficients with the highest contribution to energy inputs, and this is related to the increased GHG emissions of the practices with high consumption of electricity and fuel. The proper sizing of agricultural machinery in a farm is proposed in order to minimise GHG emissions from diesel consumption [46]. Ingrao et al. [16] also found that the most significant sources of environmental impact for Sicilian peach production were electricity and diesel fuel consumption, as well as production and the use of fertilizers and pesticides. Vinyes et al. [43] reported that fertilizers represented the input with the highest GHG contribution in a 15-year LCA analysis of a peach orchard, due mainly to high emissions during industrial production. The main contributor of GHG emissions in major peach-producing regions of China was fertilizer, followed by electricity, pesticides, and diesel [44].
The reduction of total GHG emissions achieved by the alternative fertilization alone was 13.6% for ‘Catherina’, 22.5% for ‘Andross’ and 55.6% for ‘Everts’ (Table 12, Table 13 and Table 14; Figure 2, Figure 3 and Figure 4). In addition, the reduction of GHG emissions by the deficit irrigation practice was around 10% for all cultivars. Alternative fertilization and regulated deficit irrigation decreased the intensity (kg CO2eq kg−1 of fruit) of the emitted GHG, compared to farmers’ practices by 10.5% for ‘Catherina’, 13.1% for ‘Andross’ and 16.8% for ‘Everts’. Fiore et al. [47] found that fertilization accounted for most GHG emissions from a peach orchard, suggesting that improving nitrogen use efficiency is crucial for the carbon footprint reduction of peaches, together with any available low-carbon intensity processes for fertilizer production. In a review article, it was reported that applying intensive cultivation practices to achieve high yields with efficient nutrient uptake was identified as an effective way to achieve reductions in GHG emissions [48]. Vilarrasa-Nogué et al. [49] found that N2O and N2O + N2 emissions were linked to fertilization and increased with N dose. According to Xiloyannis et al. [50], further reduction of GHG emissions could be achieved by the adoption by the farmers of more sustainable practices such as no-till farming, cover crops, incorporation of organic matter back into fields and reduction of chemical fertilizers [50]. Thus, it is highly important to optimize nutrient and irrigation management, including the proper selection of fertilizer rates and types combined with water-saving irrigation practices, to increase fertilizer and water use efficiency and to maintain a sustainable peach production system [44].

4. Conclusions

Canning peach production is of high importance for the Greek economy and provides the major income for the farmers of northern Greece. In most Greek peach orchards, integrated crop management is insufficiently applied, with empirical fertilization and irrigation (usually applied in excess) increasing energy use and GHG emissions. The aim of this study was to suggest alternative fertilization and irrigation practices for canning peach orchards to improve nutrient use efficiency and save irrigation water, and to assess yield, energy input–output and the carbon footprint of the alternative cultivation practices for three important processing cultivars: the early ripening ‘Catherina’, the mid-season ‘Andross’, and the late-season ‘Everts’. Energy use analysis revealed that the cultivation practice with the highest energy use was almost always irrigation, followed by fertilization, plant protection, weed control and pruning in all the farms and for both cultivation systems. Regarding production coefficients, electricity, fuels, fertilizers and machinery presented the highest energy requirements for all cultivars and cultivation systems. Irrigation was the cultivation practice with the highest impact on GHG emissions for all the cultivars and both cultivation systems due to electricity use. Plant protection, weed control and fertilization also presented significant GHG emissions. Alternative fertilization in combination with deficit irrigation was more energy efficient compared to farmers’ practices for all cultivars. These alternative practices also decreased the intensity (kg CO2eq kg−1) of the emitted GHG compared to farmers’ practices. Differences in energy use and GHG emissions per ha among the peach cultivars were not associated with the different maturation period but with the different cultivation practices followed by the farmers. Yield output was also found to be responsible for the difference in kg CO2eq per kg of peach fruit among cultivars. In conclusion, alternative fertilization and irrigation practices improved energy use efficiency and decreased the carbon footprint of the canning peach orchards, in addition to improving yield. Thus, optimization of nutrient supply and irrigation in peach orchards should be applied based on existing scientific knowledge and guidance.

Supplementary Materials

The following supporting information can be downloaded at: https://www.mdpi.com/article/10.3390/su14148583/s1. Table S1. Agricultural practices applied by the farmer and alternative agricultural practices for the three canning cvs: the early ripening ‘Catherina’, the mid-season ‘Andross’ and the late-season ‘Everts’.

Author Contributions

Conceptualization, G.D.N. and P.M.; methodology, P.M., C.C. and V.G.; investigation, G.D.N. and P.M.; data curation, P.M., C.C. and V.G.; writing—original draft preparation, P.M.; writing—review and editing, G.D.N.; supervision, G.D.N. All authors have read and agreed to the published version of the manuscript.

Funding

This research has been co-financed by the European Regional Development Fund of the European Union and Greek national funds through the Operational Program Competitiveness, Entrepreneurship and Innovation, under the call RESEARCH—CREATE—INNOVATE (project code: T1EDK-04591), entitled ‘Integrated improvement of clingstone peach cultivation and fruit quality, by developing an innovative infrastructure of distributed field data collection and analysis’.

Institutional Review Board Statement

Not applicable.

Informed Consent Statement

Not applicable.

Data Availability Statement

Not applicable.

Acknowledgments

The authors would like to acknowledge the farmers for providing their farms for the experiment and the personal interviews for data collection.

Conflicts of Interest

The authors declare no conflict of interest. The funders had no role in the design of the study; in the collection, analyses, or interpretation of data; in the writing of the manuscript; or in the decision to publish the results.

References

  1. Minagric. Data of Production and Processing of Clingstone Peach of Greece for the Periods 2006–2018. Available online: http://www.minagric.gr/images/stories/docs/agrotis/Oporokipeytika/stat_rodakino_2006eos2018.pdf (accessed on 3 July 2021).
  2. Ingram, D.L.; Fernandez, R. Life Cycle Assessment: A tool for determining the environmental impact of horticultural crop production. HortTechnology 2012, 22, 275–279. [Google Scholar] [CrossRef] [Green Version]
  3. Roussos, P.A. Climate change impacts on fruit trees and mitigation strategies of adverse effects. AgroLife Sci. J. 2020, 9, 269–276. [Google Scholar]
  4. Van der Werf, H.M.G.; Garnett, T.; Corson, M.S.; Hayashi, K.; Huisingh, D.; Cederberg, C. Towards eco-efficient agriculture and food systems: Theory, praxis and future challenges. J. Clean. Prod. 2014, 73, 1–9. [Google Scholar] [CrossRef]
  5. Platis, D.P.; Anagnostopoulos, C.D.; Tsaboula, A.D.; Menexes, G.C.; Kalburtji, K.L.; Mamolos, A.P. Energy analysis, and carbon and water footprint for environmentally friendly farming practices in agroecosystems and agroforestry. Sustainability 2019, 11, 1664. [Google Scholar] [CrossRef] [Green Version]
  6. Gündoğmuş, E. Does energy efficiency increase with orchard size? A case study from peach production. Energy Effic. 2014, 7, 833–839. [Google Scholar] [CrossRef]
  7. Strapatsa, A.V.; Nanos, G.D.; Tsatsarelis, C.A. Energy flow for integrated apple production in Greece. Agric. Ecosyst. Environ. 2006, 116, 176–180. [Google Scholar] [CrossRef]
  8. Guzmán, G.I.; Alonso, A.M. A comparison of energy use in conventional and organic olive oil production in Spain. Agric. Syst. 2008, 98, 167–176. [Google Scholar] [CrossRef]
  9. Kaltsas, A.M.; Mamolos, A.P.; Tsatsarelis, C.A.; Nanos, G.D.; Kalburtji, K.L. Energy budget in organic and conventional olive groves. Agric. Ecosyst. Environ. 2007, 122, 243–251. [Google Scholar] [CrossRef]
  10. Cerutti, A.K.; Bruun, S.; Beccaro, G.L.; Bounous, G. A review of studies applying environmental impact assessment methods on fruit production systems. J. Environ. Manag. 2011, 92, 2277–2286. [Google Scholar] [CrossRef]
  11. Ghatrehsamani, S.; Ebrahimi, R.; Kazi, S.N.; Badry, A.B.; Sadeghinezhad, E. Optimization model of peach production relevant to input energies—Yield function in Chaharmahalva Bakhtiari province, Iran. Energy 2016, 99, 315–321. [Google Scholar] [CrossRef]
  12. Aydin, B.; Aktürk, D. Energy use efficiency and economic analysis of peach and cherry production regarding good agricultural practices in Turkey: A case study in Çanakkale province. Energy 2018, 158, 967–974. [Google Scholar] [CrossRef]
  13. Litskas, V.D.; Mamolos, A.P.; Kalburtji, K.L.; Tsatsarelis, C.A.; Kiose-Kampasakali, E. Energy flow and greenhouse gas emissions in organic and conventional sweet cherry orchards located in or close to Natura 2000 sites. Biomass Bioenergy 2011, 35, 1302–1310. [Google Scholar] [CrossRef]
  14. Michos, M.C.; Mamolos, A.P.; Menexes, G.C.; Tsatsarelis, C.A.; Tsirakoglou, V.M.; Kalburtji, K.L. Energy inputs, outputs and greenhouse gas emissions in organic, integrated and conventional peach orchards. Ecol. Indic. 2012, 13, 22–28. [Google Scholar] [CrossRef]
  15. Aguilera, E.; Guzmán, G.; Alonso, A. Greenhouse gas emissions from conventional and organic cropping systems in Spain. II. Fruit tree orchards. Agron. Sustain. Dev. 2015, 35, 725–737. [Google Scholar] [CrossRef] [Green Version]
  16. Ingrao, C.; Matarazzo, A.; Tricase, C.; Clasadonte, M.T.; Huisingh, D. Life cycle assessment for highlighting environmental hotspots in Sicilian peach production systems. J. Clean. Prod. 2015, 92, 109–120. [Google Scholar] [CrossRef]
  17. Yan, M.; Cheng, K.; Yue, Q.; Yan, Y.; Rees, R.M.; Pan, G. Farm and product carbon footprints of China’s fruit production-life cycle inventory of representative orchards of five major fruits. Environ. Sci. Pollut. Res. 2016, 23, 4681–4691. [Google Scholar] [CrossRef]
  18. Vinyes, E.; Asin, L.; Alegre, S.; Gasol, C.M.; Munoz, P. Carbon footprint and profitability of two apple cultivation training systems: Central axis and Fruiting wall. Sci. Hortic. 2018, 229, 233–239. [Google Scholar] [CrossRef]
  19. Alluvione, F.; Moretti, B.; Sacco, D.; Grignani, C. EUE (energy use efficiency) of cropping systems for a sustainable agriculture. Energy 2011, 36, 4468–4481. [Google Scholar] [CrossRef]
  20. Gemtos, T.A.; Cavalaris, C.; Karamoutis, C.; Tagarakis, A.C.; Fountas, S. Energy analysis of three energy crops in Greece. Agric. Eng. Int. CIGR J. 2013, 15, 52–66. [Google Scholar]
  21. Fluck, R.C. Energy of human labor. In Energy in World Agriculture. Energy in Farm Production, 1st ed.; Fluck, R.C., Ed.; Elsevier: Amsterdam, The Netherlands, 1992; pp. 31–37. [Google Scholar] [CrossRef]
  22. Bowers, W. Agricultural field equipment. In Energy in World agriculture, Energy in Farm Production, 1st ed.; Fluck, R.C., Ed.; Elsevier: Amsterdam, The Netherlands, 1992; Volume 10, pp. 117–129. [Google Scholar] [CrossRef]
  23. Pimentel, D.L.; Hurd, E.; Belloti, A.L.; Forster, M.J.; Oka, J.N.; Sholes, O.D.; Whitman, R.J. Food production and the energy crisis. Science 1973, 182, 443–449. [Google Scholar] [CrossRef]
  24. Fluck, R.C. Energy sequestered in repairs and maintenance of agricultural machinery. Trans. ASAE 1985, 28, 738–744. [Google Scholar] [CrossRef]
  25. ASABE. Agricultural Machinery Management Data; ASABE D 497.5 FEB; ASABE: St. Joseph, MI, USA, 2006. [Google Scholar]
  26. Lockeretz, W. Energy inputs for nitrogen, phosphorus and potash fertilizers. Ιn Handbook of Energy Utilization in Agriculture; Pimentel, D., Ed.; CRC Press: New York, NY, USA, 1980; pp. 15–21. [Google Scholar]
  27. Tsatsarelis, C.A. Energy inputs and outputs for soft winter wheat production in Greece. Agric. Ecosyst. Environ. 1993, 43, 109–118. [Google Scholar] [CrossRef]
  28. Wells, C. Total Energy Indicators of Agricultural Sustainability: Dairy Farming Case Study; Technical Paper 2001/3; Ministry of Agriculture and Forestry: Wellington, New Zealand, 2001.
  29. Pimentel, D. Handbook of Energy Utilization in Agriculture; CRC Press: New York, NY, USA, 1980. [Google Scholar]
  30. Fluck, R.C. Energy of agricultural products. In Energy in World Agriculture. Energy in Farm Production, 1st ed.; Fluck, R.C., Ed.; Elsevier: Amsterdam, The Netherlands, 1992; Volume 4, pp. 39–43. [Google Scholar] [CrossRef]
  31. Pimentel, D. Energy Inputs in Production Agriculture. In Energy in World Agriculture, Energy in Farm Production, 1st ed.; Fluck, R.C., Ed.; Elsevier: Amsterdam, The Netherlands, 1992; Volume 2, pp. 13–29. [Google Scholar] [CrossRef]
  32. Tzilivakis, J.; Warner, D.J.; May, M.; Lewis, K.A.; Jaggard, K. An assessment of the energy inputs and greenhouse gas emissions in sugar beet (Beta vulgaris) production in the UK. Agric. Syst. 2005, 85, 101–119. [Google Scholar] [CrossRef] [Green Version]
  33. Anaya, C.A.; Burgos, A.L. Energy consumption in the management of avocado orchards in Michoacán, Mexico. Rev. Chapingo Ser. Hortic. 2015, 21, 5–20. [Google Scholar] [CrossRef]
  34. Alonso, A.M.; Guzmán, G.J. Comparison of the efficiency and use of energy in organic and conventional farming in Spanish agricultural systems. J. Sustain. Agric. 2010, 34, 312–338. [Google Scholar] [CrossRef]
  35. Lal, R. Carbon emission from farm operations. Environ. Int. 2004, 30, 981–990. [Google Scholar] [CrossRef]
  36. Martin-Gorriz, B.; Soto-García, M.; Martínez-Alvarez, V. Energy and greenhouse-gas emissions in irrigated agriculture of SE (southeast) Spain. Effects of alternative water supply scenarios. Energy 2014, 77, 478–488. [Google Scholar] [CrossRef]
  37. Bascetincelik, A.; Yaldiz, O.; Ozturk, H.H.; Zeren, Y. Energy use in field crops of Turkey. In Proceedings of the International Congress of Agricultural Machinery and Energy, Kusadasi, Turkey, 11–14 October 1993. [Google Scholar]
  38. Tagliavini, M.; Marangoni, B. Major nutritional issues in deciduous fruit orchards of Northern Italy. HortTechnology 2002, 12, 26–31. [Google Scholar] [CrossRef] [Green Version]
  39. Lopez, G.; Arbones, A.; Del Campo, J.; Mata, M.; Vallverdu, X.; Girona, J.; Marsal, J. Responses of peach trees to regulated deficit irrigation during stage II of fruit development and summer pruning. Span. J. Agric. Res. 2008, 6, 479–491. [Google Scholar] [CrossRef] [Green Version]
  40. Crisosto, C.H.; Johnson, R.S.; Luza, J.G.; Crisosto, G.M. Irrigation regimes affect fruit soluble solids concentration and rate of water loss of ‘O’Henry’ peaches. HortScience 1994, 29, 1169–1171. [Google Scholar] [CrossRef] [Green Version]
  41. Behboudian, M.H.; Marsal, J.; Girona, J.; Lopez, G. Quality and yield responses of deciduous fruits to reduce irrigation. Hortic. Rev. 2011, 38, 149–189. [Google Scholar] [CrossRef]
  42. Royan, M.; Khojastehpour, M.; Emadi, B.; Mobtaker, H.G. Investigation of energy inputs for peach production using sensitivity analysis in Iran. Energy Conver. Manag. 2012, 64, 441–446. [Google Scholar] [CrossRef]
  43. Vinyes, E.; Gasol, C.M.; Asin, L.; Alegre, S.; Muñoz, P. Life cycle assessment of multiyear peach production. J. Clean. Prod. 2015, 104, 68–79. [Google Scholar] [CrossRef] [Green Version]
  44. Guo, C.; Wang, X.; Li, Y.; He, X.; Zhang, W.; Wang, J.; Shi, X.; Chen, X.; Zhang, Y. Carbon footprint analyses and potential carbon emission reduction in China’s major peach orchards. Sustainability 2018, 10, 2908. [Google Scholar] [CrossRef] [Green Version]
  45. Nikkhah, A.; Royan, M.; Khojastehpour, M.; Bacenetti, J. Environmental impacts modeling of Iranian peach production. Renew. Sust. Energ. Rev. 2017, 75, 677–682. [Google Scholar] [CrossRef]
  46. Martin-Gorriz, B.; Maestre-Valero, J.F.; Almagro, M.; Boix-Fayos, C.; Martínez-Mena, M. Carbon emissions and economic assessment of farm operations under different tillage practices in organic rainfed almond orchards in semiarid Mediterranean conditions. Sci. Hortic. 2020, 261, 108978. [Google Scholar] [CrossRef]
  47. Fiore, A.; Dichio, B.; Celano, G.; Modarelli, A.; Palese, A.; Quinto, G.; Pergola, M.; Xiloyannis, C. A more comprehensive greenhouse gas accounting methodology for peach productive chain: Toward a certification of low-carbon fruits. Acta Hortic. 2015, 1084, 539–548. [Google Scholar] [CrossRef]
  48. Snyder, C.S.; Bruulsema, T.W.; Jensen, T.L.; Fixen, P.E. Review of greenhouse gas emissions from crop production systems and fertilizer management effects. Agric. Ecosyst. Environ. 2009, 133, 247–266. [Google Scholar] [CrossRef]
  49. Vilarrasa-Nogué, M.; Teira-Esmatges, M.R.; Pascual, M.; Villar, J.M.; Rufat, J. Effect of N dose, fertilisation duration and application of a nitrification inhibitor on GHG emissions from a peach orchard. Sci. Total Environ. 2020, 699, 134042. [Google Scholar] [CrossRef]
  50. Xiloyannis, C.; Fiore, A.; Mininni, A.N.; Xylogiannis, E.; Montanaro, G.; Dichio, B. Effect of sustainable production systems on carbon and water footprint in fruit tree orchards. Acta Hortic. 2016, 1130, 19–24. [Google Scholar] [CrossRef]
Figure 1. System boundaries and information retrieved by farmer interviews.
Sustainability 14 08583 g001
Figure 2. GHG emissions per cultivation practice as percentage (%) of the Total GHG emissions for alternative management practices compared to farmers’ practices, for ‘Catherina’ peach production.
Sustainability 14 08583 g002
Figure 3. GHG emissions per cultivation practice as percentage (%) of the Total GHG emissions for alternative management practices compared to farmers’ practices, for ‘Andross’ peach production.
Sustainability 14 08583 g003
Figure 4. GHG emissions per cultivation practice as percentage (%) of the Total GHG emissions for alternative management practices compared to farmers’ practices, for ‘Everts’ peach production.
Sustainability 14 08583 g004
Table 1. Soil analysis of ‘Catherina’, ‘Andross’ and ‘Everts’ farms.
Farm‘Catherina’‘Andross’‘Everts’
Soil typeSilty loamSandy loamClay loam
Sand (%)19.261.931.5
Silt (%)57.327.039.0
Clay (%)23.511.129.5
pH7.847.927.58
Electrical Conductivity (mmhos/cm)0.270.240.24
CaCO3 (%)6.825.720.44
Organic Matter (%)1.201.621.58
P (mg kg−1)36413
K (mg kg−1)237219172
Ca (mg kg−1)400534112523
Mg (mg kg−1)587721787
Zn (mg kg−1)0.782.521.82
Fe (mg kg−1)8.027.669.72
Mn (mg kg−1)7.883.8612.5
Table 2. Estimation of direct energy inputs based on fuel consumption reported by the farmers.
ItemFuel TypeFuel Consumption(L h−1)Direct Energy Use (MJ h−1)
Vehicles
Farm tractor (75–95 hp)DieselDepending on the specific tasks
Farm car (half loaded)Gasoline4.08172.7
Truck (half loaded)Diesel4.2200.7
Machinery
MowerDiesel10.83517.5
Pruning shredderDiesel13.15628.3
Handheld weed mowerGasoline1.6268.6
Fertilizer spreaderDiesel6.81325.4
Orchard sprayerDiesel11.39544.2
Pruning shears (2 workers) with air compressorGasoline3.35160.1
Irrigation
Centrifugal pump with electric motorElectricity 92–231 1
1 MJ h−1 ha−1.
Table 3. Estimation of indirect energy inputs (MJ h−1) based on farmer interviews, machinery manuals, and information from the literature.
ItemMass 1 (kg)Estimated Life (h)SourceIndirect Energy Use (MJ h−1)
Vehicles
Farm tractor (75–95 hp)3350–424016,000[25]18.1–22.3
Farm car12007500Current estimations13.9
Truck20007500Current estimations23.1
Machinery
Mower280–3502000[25]12.1–15.2
Pruning shredder8501500[14]49.2
Handheld weed mower101500[14]0.58
Fertilizer spreader150–2201200[25]10.8–14.5
Orchard sprayer750–9502000[25]32.5–41.2
Aero-scissors (2 workers) with air compressor150–1801500[14]8.7–10.4
Irrigation
Centrifugal pump with electric motor70–1502160[20] adapted15.4–18.5
1 From farmer interviews and from manufacturer manuals.
Table 4. Energy content of agricultural commodities.
ItemEnergy Content (MJ kg−1)Source
Nitrogen74.2[26,27]
Phosphate13.7[26,27]
Potassium9.7[26,27]
Sulphur5[28]
Calcium8.82[29]
Herbicides238[30]
Fungicides99[30]
Insecticides363[30]
Mineral oil43.2[31]
Lime sulphur1.3[32]
Bordeaux mixture2.35[33] adapted
Polyethylene pipes0.092 1[24,25]
1 MJ hm−1.
Table 5. Greenhouse gas (GHG) emissions coefficients of each input.
InputUnitGHG Coefficient (kg CO2eq/unit)Reference
Nitrogenkg1.2[35]
Phosphate (P2O5)kg0.2[35]
Potassium (K2O)kg0.15[35]
Calciumkg0.16[35]
Sulphurkg0.3[28]
Herbicideskg9.1[35]
Insecticideskg5.1[35]
Fungicideskg3.9[35]
Bordeaux mixturekg1.2[28]
Lime sulphurkg0.04[28]
DieselMJ0.0741[36]
GasolineMJ0.0693[28]
Machinery/toolsMJ0.08[28]
ElectricityMJ0.0581[28]
Waterm30.6[37]
Table 6. Energy input use per cultivation practice for alternative management practices compared to farmers’ practices, for ‘Catherina’ peach production.
‘Catherina’
Farmers’ PracticesAlternative Management Practices
PracticeEnergy Input (MJ ha−1)% of Total Energy InputEnergy
Input (MJ ha−1)
% of Total
Energy Input
Pruning1566.22.71561.33.1
Fruit thinning888.11.5888.11.7
Irrigation30,890.452.527,806.454.5
Fertilization10,284.917.55598.911.0
Weed control4554.87.74547.28.9
Plant protection10,274.217.510,215.120.1
Harvesting361.60.6361.60.7
Total energy input58,820.2 50,978.7
Table 7. Energy input use per cultivation practice for alternative management practices compared to farmers’ practices, for ‘Andross’ peach production.
‘Andross’
Farmers’ PracticesAlternative Management Practices
PracticeEnergy Input (MJ ha−1)% of Total Energy InputEnergy Input (MJ ha−1)% of Total Energy Input
Pruning4615.35.24615.36.1
Fruit thinning537.90.6537.90.7
Irrigation40,138.745.036,161.947.9
Fertilization18,840.521.19099.912.1
Weed control12,032.713.512,032.716.0
Plant protection12,354.313.912,369.516.4
Harvesting609.00.7609.00.8
Total energy input89,128.4 75,426.2
Table 8. Energy input use per cultivation practice for alternative management practices compared to farmers’ practices, for ‘Everts’ peach production.
‘Everts’
Farmers’ PracticesAlternative Management Practices
PracticeEnergy Input (MJ ha−1)% of Total Energy InputEnergy Input (MJ ha−1)% of Total Energy Input
Pruning7371.910.97371.914.7
Fruit thinning263.80.4263.80.5
Irrigation17,354.525.815,594.131.1
Fertilization22,932.634.07402.514.8
Weed control12,021.417.812,021.424.0
Plant protection6684.29.96699.413.4
Harvesting726.11.1726.11.5
Total energy input67,354.5 50,079.2
Table 9. Energy input use per production coefficient and energy output for alternative management practices compared to farmers’ practices, for ‘Catherina’ peach production.
‘Catherina’
Farmers’ PracticesAlternative Management
Practices
InputsEnergy Input (MJ ha−1)% of Total Energy
Input
Energy Input
(MJ ha−1)
% of Total Energy Input
Fertilizers
N9349.2 3554.2
P247.4 113.110.0
K676.317.51009.6
Other fertilizers 422.9
Fungicides870.31.5870.31.7
Insecticides1503.42.61503.42.9
Herbicides0000
Irrigation water2009.73.41808.73.5
Tools80.10.180.10.2
Human labour1560.72.61562.33.1
Electricity27,720.047.124,948.048.9
Fuels12,590.621.413,028.525.5
Machinery2212.53.82149.14.2
Total energy input58,820.2 51,050.3
Outputs
Yield (t ha−1)41.65 43.50
Total energy output (MJ ha−1)140,360.5 146,595.0
Energy indices
Net energy (MJ)81,540.3 95,544.7
Energy efficiency (MJ MJ−1)2.39 2.87
Energy productivity (kg MJ−1)0.71 0.85
Specific energy (MJ kg−1)1.41 1.17
Table 10. Energy input use per production coefficient and energy output for alternative management practices compared to farmers’ practices, for ‘Andross’ peach production.
‘Andross’
Farmers’ PracticesAlternative Management Practices
InputsEnergy Input
(MJ ha−1)
% of Total Energy InputEnergy Input (MJ ha−1)% of Total Energy Input
Fertilizers
N14,927.4 4429.9
P518.418.7191.58.4
K1160.1 1263.2
Other fertilizers7.4 438.1
Fungicides754.80.8754.81.0
Insecticides1958.12.21958.12.6
Herbicides535.20.6535.20.7
Irrigation water2116.82.41905.12.5
Tools90.10.190.10.1
Human labour1625.41.81627.52.2
Electricity30,744.034.527,669.636.7
Fuels24,334.527.324,842.532.9
Machinery10,356.311.69721.012.9
Total energy input89,128.4 75,426.2
Outputs
Yield (t ha−1)48.0 51.5
Total energy output (MJ ha−1)161,760.0 173,550.0
Energy indices
Net energy (MJ)72,631.6 98,123.8
Energy efficiency (MJ MJ−1)1.81 2.30
Energy productivity (kg MJ−1)0.54 0.68
Specific energy (MJ kg−1)1.86 1.46
Table 11. Energy input use per production coefficient and energy output for alternative management practices compared to farmers’ practices, for ‘Everts’ peach production.
‘Everts’
Farmers’ PracticesAlternative Management Practices
InputsEnergy Input (MJ ha−1)% of Total Energy InputEnergy Input
(MJ ha−1)
% of Total Energy Input
Fertilizers
N21,748.0 5194.0
P32.434.0191.514.3
K57.2 1263.2
Other fertilizers1060.0 504.7
Fungicides660.71.0660.71.3
Insecticides1632.02.41632.03.3
Herbicides1713.62.51713.63.4
Irrigation water963.91.4867.51.7
Tools78.10.178.10.2
Human labour1021.41.51022.22.0
Electricity13,248.019.711,880.023.8
Fuels18,685.827.818,891.937.7
Machinery6453.49.66179.912.3
Total energy input67,354.5 50,079.2
Outputs
Yield (t ha−1)35.0 37.80
Total energy output (MJ ha−1)117,950.0 127,386.0
Energy indices
Net energy (MJ)50,595.5 77,306.8
Energy efficiency (MJ MJ−1)1.75 2.54
Energy productivity (kg MJ−1)0.52 0.75
Specific energy (MJ kg−1)1.92 1.32
Table 12. GHG emissions per cultivation practice for alternative management practices compared to farmers’ practices, for ‘Catherina’ peach production.
‘Catherina’
Farmers’ PracticesAlternative Management Practices
PracticeGHG Emissions
(kg CO2eq ha−1)
GHG Emissions
(kg CO2eq ha−1)
Pruning86.286.2
Fruit thinning7.27.2
Irrigation1702.31532.3
Fertilization177.8153.6
Weed control301.7301.7
Plant protection718.7718.7
Harvesting7.47.4
Total GHG emissions3001.32807.2
Yield (t ha−1)41.6543.50
kg CO2eq kg−10.07210.0645
Table 13. GHG emissions per cultivation practice for alternative management practices compared to farmers’ practices, for ‘Andross’ peach production.
‘Andross’
Farmers’ PracticesAlternative Management Practices
PracticeGHG Emissions
(kg CO2eq ha−1)
GHG Emissions
(kg CO2eq ha−1)
Pruning310.8310.8
Fruit thinning11.011.0
Irrigation2359.92126.0
Fertilization445.8345.4
Weed control874.2879.9
Plant protection833.4833.4
Harvesting12.812.8
Total GHG emissions4847.84519.3
Yield (t ha−1)48.0051.50
kg CO2eq kg−10.1010.0878
Table 14. GHG emissions per cultivation practice for alternative management practices compared to farmers’ practices, for ‘Everts’ peach production.
‘Everts’
Farmers’ PracticesAlternative Management Practices
PracticeGHG Emissions
(kg CO2eq ha−1)
GHG Emissions
(kg CO2eq ha−1)
Pruning534.7534.7
Fruit thinning5.05.0
Irrigation1017.8917.1
Fertilization419.3186.1
Weed control828.0828.0
Plant protection453.5453.5
Harvesting11.811.8
Total GHG emissions3270.22935.9
Yield (t ha−1)35.0037.80
kg CO2eq kg−10.09340.0777
Publisher’s Note: MDPI stays neutral with regard to jurisdictional claims in published maps and institutional affiliations.

