
Research on Flow Field Characteristics in Water Jet Nozzle and Surface Damage Caused by Target Impact

School of Mechanical Engineering, Nantong University, Nantong 226019, China
*
Author to whom correspondence should be addressed.
Sustainability 2022, 14(15), 9074; https://doi.org/10.3390/su14159074
Submission received: 4 July 2022
/
Revised: 19 July 2022
/
Accepted: 20 July 2022
/
Published: 25 July 2022
(This article belongs to the Special Issue Ocean and Hydropower)
Abstract
:As a new processing method, water jet processing technology has risen rapidly due to its wide range of applications, no pollution, and zero discharge. In this paper, the flow characteristics and failure characteristics of ultra-high-pressure gas-liquid jet in the range of 300 MPa are analyzed by numerical calculation. The research conclusion shows that the jet atomization diffusion is caused by the friction between the liquid medium and the surrounding gas, the mixed flow of broken water droplets and cavitation. The jet diffusion process is essentially the energy exchange process between the jet in the core area and the turbulent flow in the atomization area. The distribution of the turbulent kinetic energy in the atomization area can determine the degree of jet diffusion and the rate of energy decay. The water jet impacted the surface of the target to form a crater-like annular erosion pit. With the increase of the impact pressure, the deformation showed an overall increasing trend, and the increasing trend increased significantly. The central depression of the erosion area is caused by the damage of the material by the stagnation pressure in the core area. The flow characteristics of gas-liquid flow in the process of formation and diffusion in the high-pressure water jet nozzle are explored from the microscopic point of view, and it also provides a theoretical basis for equipment optimization in engineering.
1. Introduction
Water jet is a high-pressure or ultra-high-pressure pump that pressurizes water or a mixed fluid with solid medium, and then ejects it at supersonic or subsonic speed through a nozzle to form one or more high-speed water jets to achieve cleaning and cutting, rock-breaking mining and other purposes [1,2,3,4]. In the process of promoting industrial green development, ultra-high-pressure water rust removal is one of the most representative process innovation measures currently being practiced.
T. Mabrouki et al. [5] presented a numerical study to explore the impact of water jet on the impact erosion of non-coated and coated metal sheets, and they developed a finite element model to study and analyze in detail the impact of water jet on the material. Mabrouki and Raissi [6] performed numerical calculations using the Dyna 3D program to simulate the interaction of the jet with the target. Chillman et al. [7] used ultra-high-pressure water jet technology to remove the coating of titanium alloy without damaging the substrate. The jet removal effect of titanium alloys was evaluated by the test method and surface micro-morphology analysis. Guha et al. [8] studied the effects of different target distances on pressure attenuation and pressure distribution through experimental and numerical studies, and concluded that there is a linear relationship between the pressure attenuation on the jet axis and the target distance. In the field of theoretical analysis of jet impingement and coating removal mechanism, Kunaporn et al. [9] established a mathematical model to analyze the pressure distribution of water jet impinging on the aluminum alloy surface under different target distances, and used it to predict the contact pressure range. Glover et al. [10] established a mathematical model for calculating the width of the impurity layer removed by fixed and moving jets, and used high-speed photography to measure the jet cleaning width under different exposure times, and verified the calculation results. Azhari et al. [11] analyzed the three-dimensional surface micro-morphology of 304 stainless steel treated with different pressure jets, and found that repeated cleaning with different pressure jets can improve the surface finish and hardness of the workpiece and prolong the fatigue life of the workpiece. Nayak et al. [12] verified the influence of parameters such as target distance, pressure, abrasive grain size and abrasive flow on the material removal rate and surface in water jet machining, and obtained the law of the change of material surface machining quality with water jet parameters. Rihem et al. [13] developed and verified the transient finite element three-dimensional simulation of water jet, and proved that the results of multi group droplet simulation are closer to the experimental surface performance than that of single group droplet simulation. Barsukov et al. [14] simulated and analyzed the abrasive water jet, and studied the effects of abrasive particles, contact angle and other factors on water jet cutting and abrasive spalling. Hamid et al. [15] provided experimental and mathematical data, found that the cross-sectional velocity distribution of the free jet emitted from the conical nozzle is similar. Aganin et al. [16] studied the efficiency and effect of water jet. At the same time, they proposed theoretical calculation formulas for flow, velocity and contraction coefficient. Mieszala et al. [17] analyzed the erosion mechanism during abrasive water jet machining and found that different crystal structures and surface microstructures have an impact on material removal.
However, for ultra-high-pressure water jets, the linear smooth solution of the Navier-Stokes equations has not been a breakthrough. Many of these phenomena have not been fully understood, especially the understanding of ultra-high-pressure jet flow characteristics is quite superficial, and the research conclusions at the mechanism level are not perfect [18,19,20,21]. In this paper, through numerical calculation, the flow characteristics and damage characteristics of ultra-high- pressure jets in the range of 300 MPa have been studied in many aspects. Under the existing equipment and technical conditions, the water jet rust removal efficiency and quality can be improved, and the water jet rust removal cost can be reduced. It is of great significance to realize the large-scale promotion and application of high-pressure water jet rust removal on the surface of ships.
2. Theoretical Model and Calculation Method
2.1. Geometry and Meshing
In the research of water jet, the jet flow field is usually divided into an inner flow field and an outer flow field with the jet nozzle as the boundary. The inner flow field is mainly the inner flow field of the nozzle and the inlet section. The inner flow field is mainly used to study the formation process of the jet. The outer flow field is mainly composed of a complete jet beam, external air and workpiece. The outer flow field is mainly used to explore the processing performance of the water jet process and the divergence of the jet outside the nozzle. Therefore, the overall internal and external flow domains are simplified and established as shown in Figure 1. The main fluid domain is divided into four regions: the inlet section, the nozzle section, the target area, and the outlet section.
Since the hemispherical water body in the inlet section is not suitable for structured grid division, the overall grid adopts a hybrid grid. The Pointwise 18.3R1 software (Pointwise, Fort Worth, TX, USA) is used for mesh generation. The CFX 2020 software (ANSYS, Canonsburg, PA, USA) is used for numerical calculation. The hemisphere of the inlet section is meshed with unstructured meshes, and the rest is meshed with structured meshes. The wall boundary of the nozzle area is locally densified. The grid independence test is evaluated based on the maximum pressure of the impacted surface of the target. The results are shown in Table 1.
Under the principle of ensuring that the grid error is less than 1% and reducing the amount of calculation as much as possible, the number of grids is finally determined to be between 1 million and 2 million.
2.2. Boundary Conditions and Parameter Settings
For practical conditions, the inlet section should use a pressure inlet. However, if the pressure inlet is directly used, an overflow error will occur. Therefore, most experts and scholars convert the pressure inlet to the velocity inlet through the Bernoulli equation through Equation (1):
In the formula: is the position of the fluid, is the pressure of the fluid, is the density of the fluid, is the acceleration of gravity, is the velocity of the fluid, and C is a constant.
However, there is a problem with this approach. The Bernoulli equation comes from the conservation of energy at its root. The Bernoulli equation applies to incompressible ideal fluids [22]. And for ultra-high-pressure water jets, since water becomes compressible at a high enough pressure, the calculations will suffer from compressibility. Under the pressure of 250 MPa, the compressibility of the ultra-high-pressure water jet reaches 0.08715 [16,23], so the following three equations are used to calculate the jet velocity with water as the compressible liquid:
where is the density of water at 25 degrees Celsius under standard atmospheric pressure, is the density index, is the reference bulk modulus to describe the compressibility of water, which depends on temperature and pressure. is the jet velocity of the incompressible water body derived from Bernoulli’s equation. is the theoretical jet velocity considering compressibility. can be expressed as:
After consulting the literature [24,25,26], we determined that the shape of the inlet is hemispherical. On the one hand, it can effectively prevent the occurrence of overflow errors, and on the other hand, the velocity of the internal flow field is closer to the real situation. In terms of inlet velocity, the pressure curve is programmed so that the inlet pressure of the hemisphere changes gradually over time. Under this equation, the inlet pressure changes with a linear uniform acceleration. After the pressure change process ends, the high-pressure water jet will continue to impact the target with an inlet pressure of 300 MPa (as shown in Figure 2b). The outlet section adopts an open boundary, and the set pressure value is one atmosphere.
From the point of view of the jetting method, the jet belongs to the free intercepting flow of one medium injected into another medium. The development of this kind of flow is influenced by the interaction of corresponding fluid theory such as nozzle pressure fluctuation, liquid surface tension, and gas-liquid phase shear. Among them, the solution of various equations for jet breaking (hereinafter referred to as the breaking mechanism) is more complicated and cumbersome. For the relatively mature jet breaking calculation, experts and scholars classify and calculate the jet according to the breaking mechanism through the jet characteristics such as Reynolds number, Weber number, and Ohnesorge number. The classification basis is shown in Table 2.
When high-pressure water flows through the microfluidic channel of the nozzle, the water pressure energy is converted into kinetic energy, forming a high-speed water jet. Due to the dynamic viscosity of the fluid and the friction of the air, the velocity of the micro-water jet at the front end will gradually decay. The microflow at the edge of the jet is slowed down due to air friction and entrainment. The microfluidic velocity in the flow field is reduced to zero, while the jet beam is broken into droplets. Of course, jet breakage and atomization will greatly affect the rust removal effect of water jet. However, since the detailed mechanism of spray atomization is still unclear, most of the existing atomization models are empirical or semi-empirical models, and it is difficult to comprehensively predict the spray characteristics under a wide range of conditions. In addition, there is another difficulty that the parameter calibration is relatively complicated when using the atomization model under various injection conditions. Therefore, the crushing model and the atomization model used in this paper are compared and verified to prove the predictive performance of these models.
3. Results and Analysis of Numerical Calculation
3.1. Analysis of Flow Field Calculation Results
In the numerical simulation, the crushing model is divided into primary crushing and secondary crushing. The turbulent primary crushing theory adopts the classical Kelvin-Helmholtz (KH) crushing model. It can predict with high fidelity the morphological transition of liquid column to liquid droplet under different injection pressure and ambient pressure conditions. For the secondary crushing of the droplets, the KH-RT atomization model derived by Kelvin-Helmholtz (KH) and Rayleigh-Taylor (RT) was used. The crushing model and the atomization model are calculated in low-speed and high-speed water jets, respectively. The liquid column using the KH atomization model is broken once at a low speed, and the trajectory of the liquid droplet and the breaking point are clearly visible, as shown in Figure 3a. In the high-speed state, the small droplets appear atomization after the secondary crushing, as shown in Figure 3b.
A partial enlarged view of the jet velocity vector of the flow field in the nozzle is shown in Figure 4. Six planes are intercepted at equal distances from the cylindrical section of the nozzle to the axis of the diffuser section. We can see that when the fluid flows through the nozzle, there is no vector arrow of the vapor velocity from the constricted section of the nozzle to the cylindrical section. The position where the vapor flow rate first begins to be generated is at the edge of the junction of the cylindrical section and the diffuser section, which generally presents a ring shape (as shown in Figure 4a NO.1–NO.2). This indicates that cavitation do not form inside the nozzle under the boundary condition of the high pressure inlet. When the fluid passes through the nozzle cylindrical section to the nozzle diffusion section, the liquid medium at the edge of the high-pressure water column produces friction with the surrounding gas medium. This causes the liquid at the edge of the high-pressure water column to gradually break up into discrete droplets. The liquid at the edge mixes with the surrounding gas medium to form a gas-liquid mixed flow. In addition, the pressure release of the nozzle diffuser produces a large velocity gradient, which reduces the pressure to below the saturated vapor pressure. The liquid forms cavitation based on the vapor.
In order to prove the existence of cavitation bubbles, the author also conducts a separate submerged jet calculation for the nozzle section. Even if the flow field is submerged in water to ensure that there is no gas medium in the nozzle, it can be clearly found in the figure that the gas-liquid mixed fluid still exists, and the result is shown in the Figure 4b shown. At the same time, a red part of the liquid in the shape of a copper coin is returned on the lower end face of the diffusion section, and the backflow position is between NO.5–NO.6 in Figure 4a. This indicates that the liquid in the diffusion section is between the positions of NO.2 and NO.4, and the discontinuity of the water jet is mainly guided by the mixing of cavitation bubbles and high-pressure water jets. At the position of NO.5–NO.6, the reflux gas and the broken small liquid droplets start to mix, resulting in the turbulent atomization of the water jet. That is, whether it is a free water jet in the air or a submerged water jet, the generation of cavitation bubbles will cause the discontinuity of the water jet and dominate the flow field inside the nozzle [9,27,28,29].
Figure 5 is a cloud diagram of the spatial distribution of the velocity field of the ultra-high-pressure water jet impacting the target. In order to completely analyze the causes of jet energy attenuation and the water beam diffusion mechanism, the obtained results were shielded in the low-velocity domain, and the water jet impact was studied in blocks. The internal and external flow fields are divided into three parts: cavitation jet (I), free jet (II), stagnation, and high-speed diffusion (III) in the nozzle.
It can be clearly seen from Figure 5 that after the jet enters the external flow field from the nozzle, the jet gradually begins to diverge, the velocity in the central region gradually decreases, and the area of the turbulent region increases rapidly. This is due to the violent friction between the edge of the high-speed jet and the air, which reduces the continuity of the jet, and the liquid column is broken into liquid droplets and mixed with the air. This discrete liquid phase and gas phase also have great speed and energy. It is mixed in the outer layer of the jet and has a great disturbance in the core region. As the distance of the jet increases, the liquid inside the jet is disturbed and gradually diffuses into the turbulent region until the jet is completely atomized. It can be seen that the gas-liquid turbulence in the outer layer of the jet is the main characterization of the jet diffusion. A detailed analysis of the turbulent kinetic energy characteristics of the inner and outer layers in the diameter direction of the jet and the turbulent kinetic energy characteristics of the flow along the axis direction.
The free jet in the outer flow field can be divided into a cluster section, a diffuser section, and a diverging section along the nozzle axis direction. The direction perpendicular to the nozzle axis can be divided into core area and atomization area.
In order to better analyze the free jet flow law in the external flow field, the spatial distribution of the turbulent kinetic energy of the water jet was calculated, and then the turbulent kinetic energy cloud map in the direction of the nozzle axis was intercepted, as shown in Figure 6. It can be clearly found from Figure 6 that there is a clear boundary between the core area and the atomization area. There is a vigorous energy exchange at the boundary, and the closer to the interface, the more intense the energy interaction. Therefore, it can be approximated that the peak region of turbulent kinetic energy can be used as the separation surface of the inner and outer jets, and the valley region of turbulent kinetic energy can be regarded as the separation surface of the outer jet and the air. At the same time, it is found that the disturbance in the core area of the jet at the nozzle outlet exists but the disturbance is small, indicating that the extremely high velocity in the nozzle is the dominant effect in the cluster section. In the jet diffusion section, the disturbance of the jet core area increases, the radius of the core area decreases, and the velocity decreases, and finally merges with the turbulent area completely.
3.2. Numerical Simulation Analysis of Matrix Damage
The stagnation and high-speed diffusion zone is a special fluid domain formed by the target blocking the high-pressure water jet, which is subdivided into two parts. As the pressure of water increases to more than 300 MPa, it is compressed and accelerated by the cylindrical section of the nozzle to form a continuous jet with a velocity of 800 m/s or even greater. After the flow direction of the original water jet is blocked, part of the fluid is sputtered around, and there is a huge energy to form a circular high-speed diffusion zone. The high-pressure water jet in the center of the core area forms a high-pressure stagnation area due to the wrapping and stagnation of the peripheral flow field, and the extremely high pressure generated by it causes the material to fail and deform.
Fluid-structure interaction can only deform through surface pressure conduction, and cannot simulate the damage of stagnation pressure to materials and the accumulated damage of materials. Therefore, the pressure data obtained in the flow field simulation is fitted through the data, and the pressure surface pressure of 200 MPa–300 MPa is transmitted to Abaqus through the cylindrical coordinate system for solid field simulation. The ultra-high-pressure water jet impinges on the target, extracts the pressure value on the impacted surface, and obtains the jet intensity diagram, as shown in Figure 7a. The pressure curve of the high-pressure water jet impact surface is fitted along the radial direction, and the fitting curve adopts a quartic polynomial, as shown in Figure 7b, to ensure that the correlation coefficient R2 reaches more than 0.99. The overall time is 0.1 s to minimize the effect of accumulated damage on the surface of the material.
The plastic deformation of the target in the depth direction at 0.1 s was collected under different pressures, and the deformation curve was drawn as shown in Figure 8. It can be clearly seen from Figure 8 that with the increase of the impact pressure, the deformation generally presents an increasing trend. And the increasing trend is obviously rising, which shows that the ultra-high pressure water jet pressure has a great influence on the impact damage of the substrate surface. Since the surface of the substrate is not constrained, the impacted surface is a free boundary, the formation of the central jet causes the material close to the central jet to expand to the side away from the center, and micro-bulges appear at the edge of the impact center area. In terms of three-dimensional space, the impacted surface presents a ring shape.
In terms of action time, the maximum deformation amount in the depth direction in the process of 0–0.1 s under different pressures was collected, and the graph was drawn as shown in Figure 9. The deformation increment is analyzed and compared. When the pressure just touches the target at 0.01 s, the deformation has not yet reached the level visible to the naked eye. From 0.01 to 0.08 s, the pressure acts on the surface of the target, and the deformation increases rapidly, reaching the level of 10−3 mm and producing tiny pits. The material in the depth direction pushes and accumulates in the breadth direction, forming a crater-shaped impact corrosion surface.
4. Experimental Analysis
4.1. Experimental Design
The ultra-high pressure water jet experiment was carried out on the PJ2000/15ES experimental platform, and the experimental platform is shown in Figure 10. The experimental platform is located in the Institute of Fluid Machinery and Marine Engineering Equipment of Nantong University (Nantong, China). The manufacturer of the experimental platform is Jiangsu Water Energy Metal Technology Company (Changzhou, China). The experimental system is mainly composed of high-pressure pump, high-pressure pipeline, control system, protection device, water inlet system and other main components. The high pressure pump and motor are connected by elastic coupling. High pressure water is delivered to the nozzle through high pressure pipes. The rated pressure of the experimental platform is 200 MPa, and the rated flow rate is 15 L/min. The sample material is structural steel.
4.2. Analysis of Experimental Results
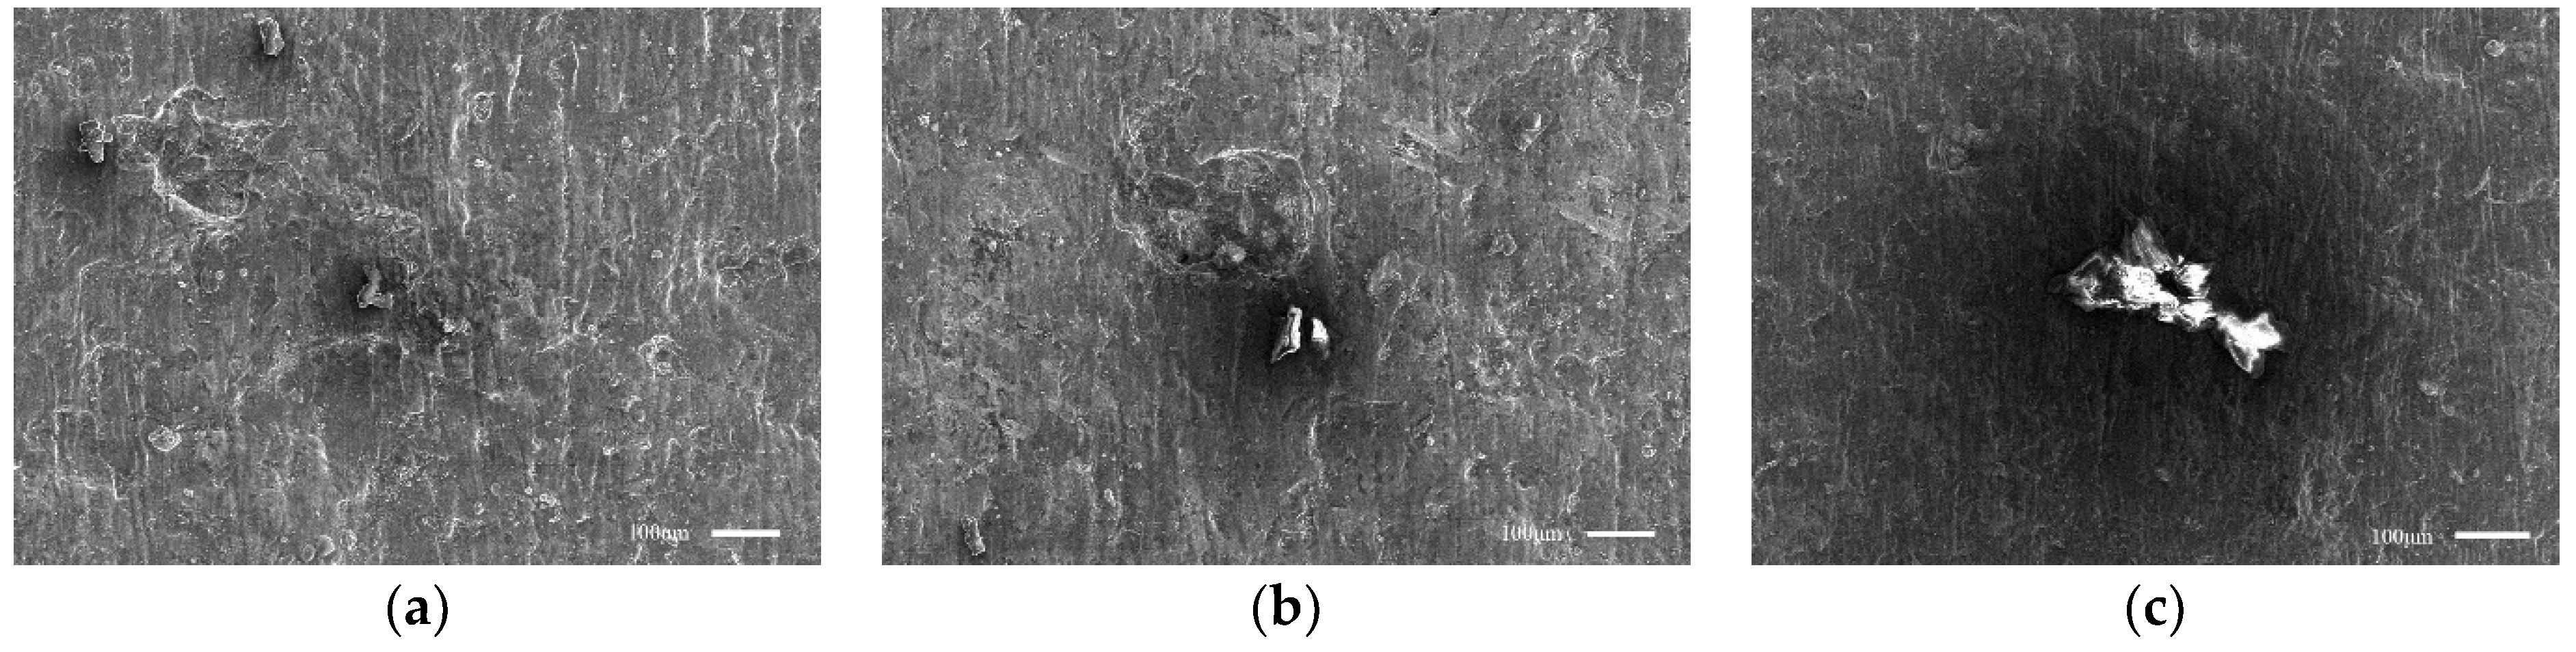
In the continuous jet condition, Figure 11 shows the surface morphology of the sample after the experiment. Due to the impact of high-speed water jets, the pressure in the depth direction extends to the width direction. The pressure accumulates below the surface layer, producing plastic strain. The matrix forms a crater-like surface morphology. This is consistent with the surface morphology produced by the experiment, as shown in Figure 11. In terms of the shape of surface pits, the experimental results are well correlated with the finite element simulation results. This shows the validity of the finite element model of ultra-high-pressure water jet.
It can be clearly seen from Figure 11 that under the impact pressure of 200 MPa, the surface of the sample is damaged, and the damage range is small. Under the impact pressure of 240 MPa, the damage range of the sample surface increases. Under the impact pressure of 300 MPa, the damage range of the sample surface increases significantly. With the increase of the impact pressure, the overall deformation showed an increasing trend, and the increasing trend increased significantly. This shows that the ultra-high-pressure water jet pressure has a great influence on the impact damage of the substrate surface. When the water jet impinges on the workpiece surface, the fluid velocity drops sharply. Fluid flow is blocked in the stagnation zone. The ultra-high pressure in the stagnation zone leads to the destruction of the matrix.
5. Conclusions
- (1)
- The water jet is divided into three regions along the axial direction: the cavitation jet in the nozzle, the free jet, and the stagnation zone. It is divided into a core area and an atomization area along the radial direction. The distribution of turbulent kinetic energy in the atomization area can be used as the basis for judging the degree of jet diffusion and the rate of energy decay. The peak point of turbulent kinetic energy can be used as the boundary between the inner and outer jets.
- (2)
- After the water jet impactes the surface of the target, a crater-like crater is formed. With the increase of impact pressure, the overall deformation showes an increasing trend. And the increasing trend is obviously rising. Without considering the accumulated damage, the jet pressure is the most important factor.
- (3)
- The depression of the erosion area is caused by the destruction of the material by the stagnation pressure. Accumulated damage has a serious impact on the surface erosion damage of the target.
Author Contributions
Conceptualization, Z.S., W.S., Z.X., L.T. and Y.Y.; Data curation, Q.Z., Z.S. and W.S.; Investigation, Z.S., W.S., Z.X., L.T. and Y.Y.; Methodology, W.S., Z.X., L.T. and Y.Y.; Project administration, W.S. and L.T.; Resources, Z.S. and W.S.; Software, Q.Z. and Z.S.; Supervision, W.S. and Y.Y.; Writing—original draft, Q.Z.; Writing—review & editing, Q.Z. All authors have read and agreed to the published version of the manuscript.
Funding
This work was supported by the National Key R&D Program of China (Grant No. 2019YFB2005300), National High-tech Ship Scientific Research Project of China (Grant No. MC-202031-Z07), National Natural Science Foundation of China (Grant Nos. 51979138, 52109106).
Conflicts of Interest
The authors declare no conflict of interest.
References
- Duplessis, M.P.; Hashish, M. High Energy Water Jet Cutting Equations for Wood. J. Eng. Ind. 1978, 100, 452. [Google Scholar] [CrossRef]
- Leu, M.C.; Meng, P.; Geskin, S.; Tismeneskiy, L. Mathematical Modeling and Experimental Verification of Stationary Waterjet Cleaning Process. J. Manuf. Sci. Eng. 1998, 120, 571–579. [Google Scholar] [CrossRef]
- Meng, P.; Geskin, E.S.; Leu, M.C.; Li, F.; Tismeneskiy, L. An Analytical and Experimental Study of Cleaning with Moving Waterjets. J. Manuf. Sci. Eng. 1998, 120, 580–589. [Google Scholar] [CrossRef]
- Guha, A.; Barron, R.M.; Balachandar, R. Numerical simulation of high-speed turbulent water jets in air. J. Hydraul. Res. 2010, 48, 119–124. [Google Scholar] [CrossRef]
- Mabrouki, T.; Raissi, K.; Cornier, A. Numerical simulation and experimental study of the interaction between a pure high-velocity waterjet and targets: Contribution to investigate the decoating process. Wear 2000, 239, 260–273. [Google Scholar] [CrossRef]
- Mabrouki, T.; Raissi, K. Stripping process modelling: Interaction between a moving waterjet and coated target. Int. J. Mach. Tools Manuf. 2002, 42, 1247–1258. [Google Scholar] [CrossRef] [Green Version]
- Ramulu, M.; Hashish, M.; Cantrell, A. High Pressure Waterjets—An Innovative Means of Alpha Case Removal for Superplastically Formed Titanium Alloys. Key Eng. Mater. 2010, 433, 103–111. [Google Scholar]
- Guha, A.; Barron, R.M.; Balachandar, R. An experimental and numerical study of water jet cleaning process. J. Mater. Process. Technol. 2011, 211, 610–618. [Google Scholar] [CrossRef] [Green Version]
- Kunaporn, S.; Ramulu, M.; Hashish, M. Mathematical Modeling of Ultra-High-Pressure Waterjet Peening. J. Eng. Mater. Technol. 2005, 127, 186–191. [Google Scholar] [CrossRef]
- Glover, H.; Brass, T.; Bhagat, R.; Davidson, J.; Pratt, L.; Wilson, D. Cleaning of complex soil layers on vertical walls by fixed and moving impinging liquid jets. J. Food Eng. 2016, 178, 95–109. [Google Scholar] [CrossRef] [Green Version]
- Azhari, A.; Schindler, C.; Hilbert, K.; Godard, C.; Kerscher, E. Influence of waterjet peening and smoothing on the material surface and properties of stainless steel 304. Surf. Coat. Technol. 2014, 258, 1176–1182. [Google Scholar] [CrossRef] [Green Version]
- Nayak, B.B.; Abhishek, K.; Mahapatra, S.S.; Das, D. Application of WPCA based taguchi method for multi-response optimization of abrasive jet machining process. Mater. Today Proc. 2018, 5, 5138–5144. [Google Scholar] [CrossRef]
- Amri, R.; Laamouri, A.; Manchoul, S.; Fathallah, R. Transient dynamic finite element simulation for prediction of surface integrity induced by waterjet peening. Proc. Inst. Mech. Eng. Part L J. Mater. Des. Appl. 2019, 234, 105–119. [Google Scholar] [CrossRef]
- Barsukov, G.V.; Zhuravleva, T.A.; Kozhus, O.G. The Research and Simulation (Modelling) of the Destruction of a Single Abrasive Particle during Waterjet Cutting. Mater. Sci. Forum 2020, 989, 235–241. [Google Scholar] [CrossRef]
- Hamid, A.; Atan, R. Spray characteristics of jet–swirl nozzles for thrust chamber injector. Aerosp. Sci. Technol. 2009, 13, 192–196. [Google Scholar] [CrossRef]
- Aganin, A.; Guseva, T. The Influence of the End Shape of the Liquid Jet on Its Impact onto a Dry Wall. Uchenye Zap. Kazan. Univ. Ser. Fiz.-Mat. Nauki 2019, 161, 39–52. [Google Scholar] [CrossRef]
- Mieszala, M.; Torrubia, P.L.; Axinte, D.; Schwiedrzik, J.; Guo, Y.; Mischler, S.; Michler, J.; Philippe, L. Erosion mechanisms during abrasive waterjet machining: Model microstructures and single particle experiments. J. Mater. Process. Technol. 2017, 247, 92–102. [Google Scholar] [CrossRef] [Green Version]
- Thakur, R.K.; Singh, K.K.; Ramkumar, J. Impact of nanoclay filler reinforcement on CFRP composite performance during abrasive water jet machining. Mater. Manuf. Process. 2021, 36, 1264–1273. [Google Scholar] [CrossRef]
- Lohar, S.R.; Kubade, P.R. Investigation of Effect of Abrasive Water Jet Machining (AWJM) Process Parameters on Performance Characteristics of High Carbon High Chromium Steel (AISI D3). IARJSET 2017, 4, 152–158. [Google Scholar] [CrossRef]
- Liu, J.; Chen, Y.; Zhu, Y. Breaking Mechanism and Damage Evolution Rule of Ultra-High-Pressure Water Jet Impacting Steel Fiber Reinforced Concrete. Adv. Civ. Eng. 2021, 2021, 6697409. [Google Scholar] [CrossRef]
- Zhang, Y.; Zang, W.; Zheng, J.; Cappietti, L.; Zhang, J.; Zheng, Y.; Fernandez-Rodriguez, E. The influence of waves propagating with the current on the wake of a tidal stream turbine. Appl. Energy 2021, 290, 116729. [Google Scholar] [CrossRef]
- Sembrat, J.; Miller, P.; Skavdahl, J.; Frenzel, L. Conservation of Historic Metals by Waterjetting Techniques. J. Archit. Conserv. 2005, 11, 121–146. [Google Scholar] [CrossRef]
- Han, Y.; Zhou, L.; Bai, L.; Shi, W.; Agarwal, R. Comparison and validation of various turbulence models for U-bend flow with a magnetic resonance velocimetry experiment. Phys. Fluids 2021, 33, 125117. [Google Scholar] [CrossRef]
- Chillman, A.; Ramulu, M.; Hashish, M. Waterjet and Water-Air Jet Surface Processing of a Titanium Alloy: A Parametric Evaluation. J. Manuf. Sci. Eng. 2010, 132, 011012. [Google Scholar] [CrossRef]
- Ayed, Y.; Robert, C.; Germain, G.; Ammar, A. Development of a numerical model for the understanding of the chip formation in high-pressure water-jet assisted machining. Finite Elem. Anal. Des. 2016, 108, 1–8. [Google Scholar] [CrossRef] [Green Version]
- Yildizeli, A.; Cadirci, S. Multi-objective optimization of multiple impinging jet system through genetic algorithm. Int. J. Heat Mass Transf. 2020, 158, 119978. [Google Scholar] [CrossRef]
- Znamenskaya, I.A.; Nersesyan, D.A.; Sysoev, N.N.; Koroteeva, E.Y.; Shirshov, Y.N. An optical study of high-pressure water-jet dynamics. Mosc. Univ. Phys. Bull. 2016, 71, 405–412. [Google Scholar] [CrossRef]
- Henning, A.; Liu, H.T.; Olsen, C. Economic and Technical Efficiency of High Performance Abrasive Waterjet Cutting. J. Press. Vessel Technol. 2012, 134, 21405. [Google Scholar] [CrossRef]
- Chillman, A.; Hashish, M.; Ramulu, M. Energy Based Modeling of Ultra High-Pressure Waterjet Surface Preparation Processes. J. Press. Vessel Technol. 2011, 133, 061205. [Google Scholar] [CrossRef]
Figure 1.
Geometry model and meshing.
Figure 2.
Setting of inlet boundary conditions. (a) Velocity field of the flow field in the nozzle. (b) Inlet pressure curve.
Figure 2.
Setting of inlet boundary conditions. (a) Velocity field of the flow field in the nozzle. (b) Inlet pressure curve.
Figure 3.
Calculation results of the crushing model and the atomization model. (a) Numerical simulation of KH crushing model. (b) Numerical simulation of KH-RT atomization model.
Figure 3.
Calculation results of the crushing model and the atomization model. (a) Numerical simulation of KH crushing model. (b) Numerical simulation of KH-RT atomization model.

Figure 4.
Cloud diagram of the flow field in the nozzle. (a) The velocity vector cloud diagram of the flow field in the nozzle. (b) Cloud diagram of the volume fraction of the flow field in the nozzle.
Figure 4.
Cloud diagram of the flow field in the nozzle. (a) The velocity vector cloud diagram of the flow field in the nozzle. (b) Cloud diagram of the volume fraction of the flow field in the nozzle.
Figure 5.
The spatial distribution cloud diagram of the velocity field of the ultra-high-pressure water jet impacting the target body.
Figure 5.
The spatial distribution cloud diagram of the velocity field of the ultra-high-pressure water jet impacting the target body.

Figure 6.
Turbulent kinetic energy cloud diagram in the axial direction of the water jet nozzle.
Figure 7.
Jet intensity and fitting curve diagram. (a) Jet intensity diagram. (b) Fitting curve.

Figure 8.
The plastic deformation curve of the target under different pressures.
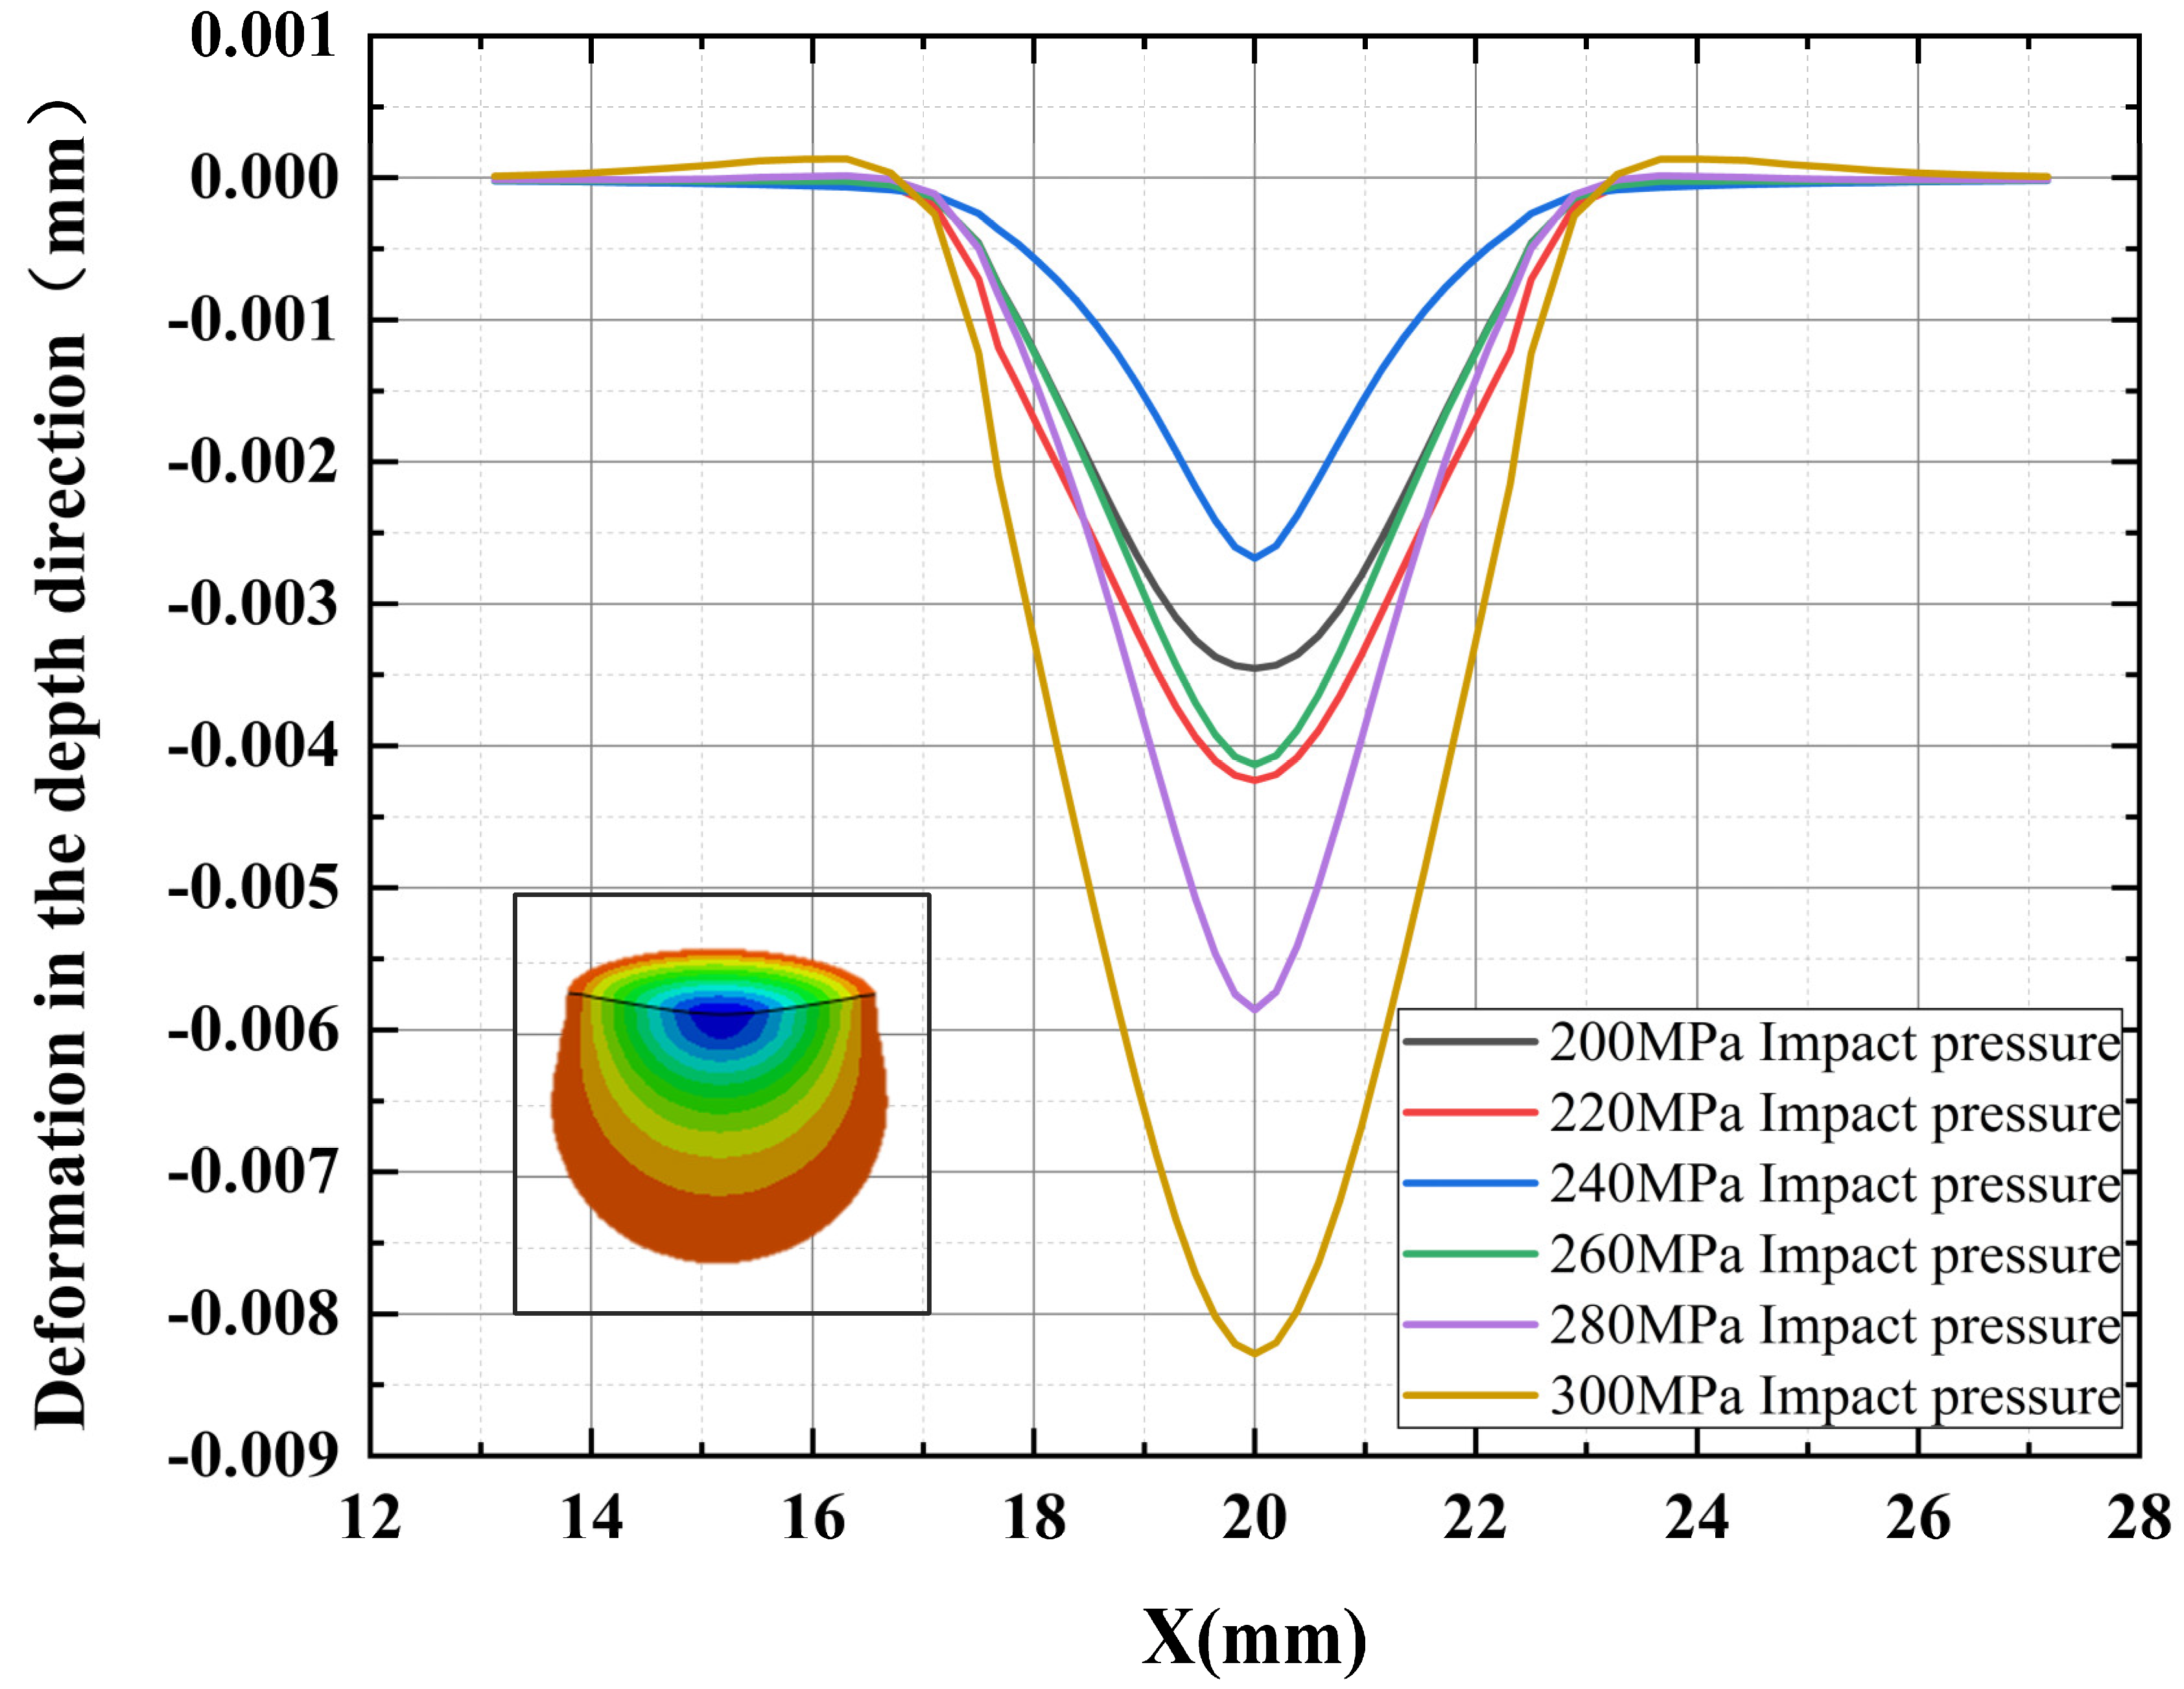
Figure 9.
Plastic deformation diagram under different action time.
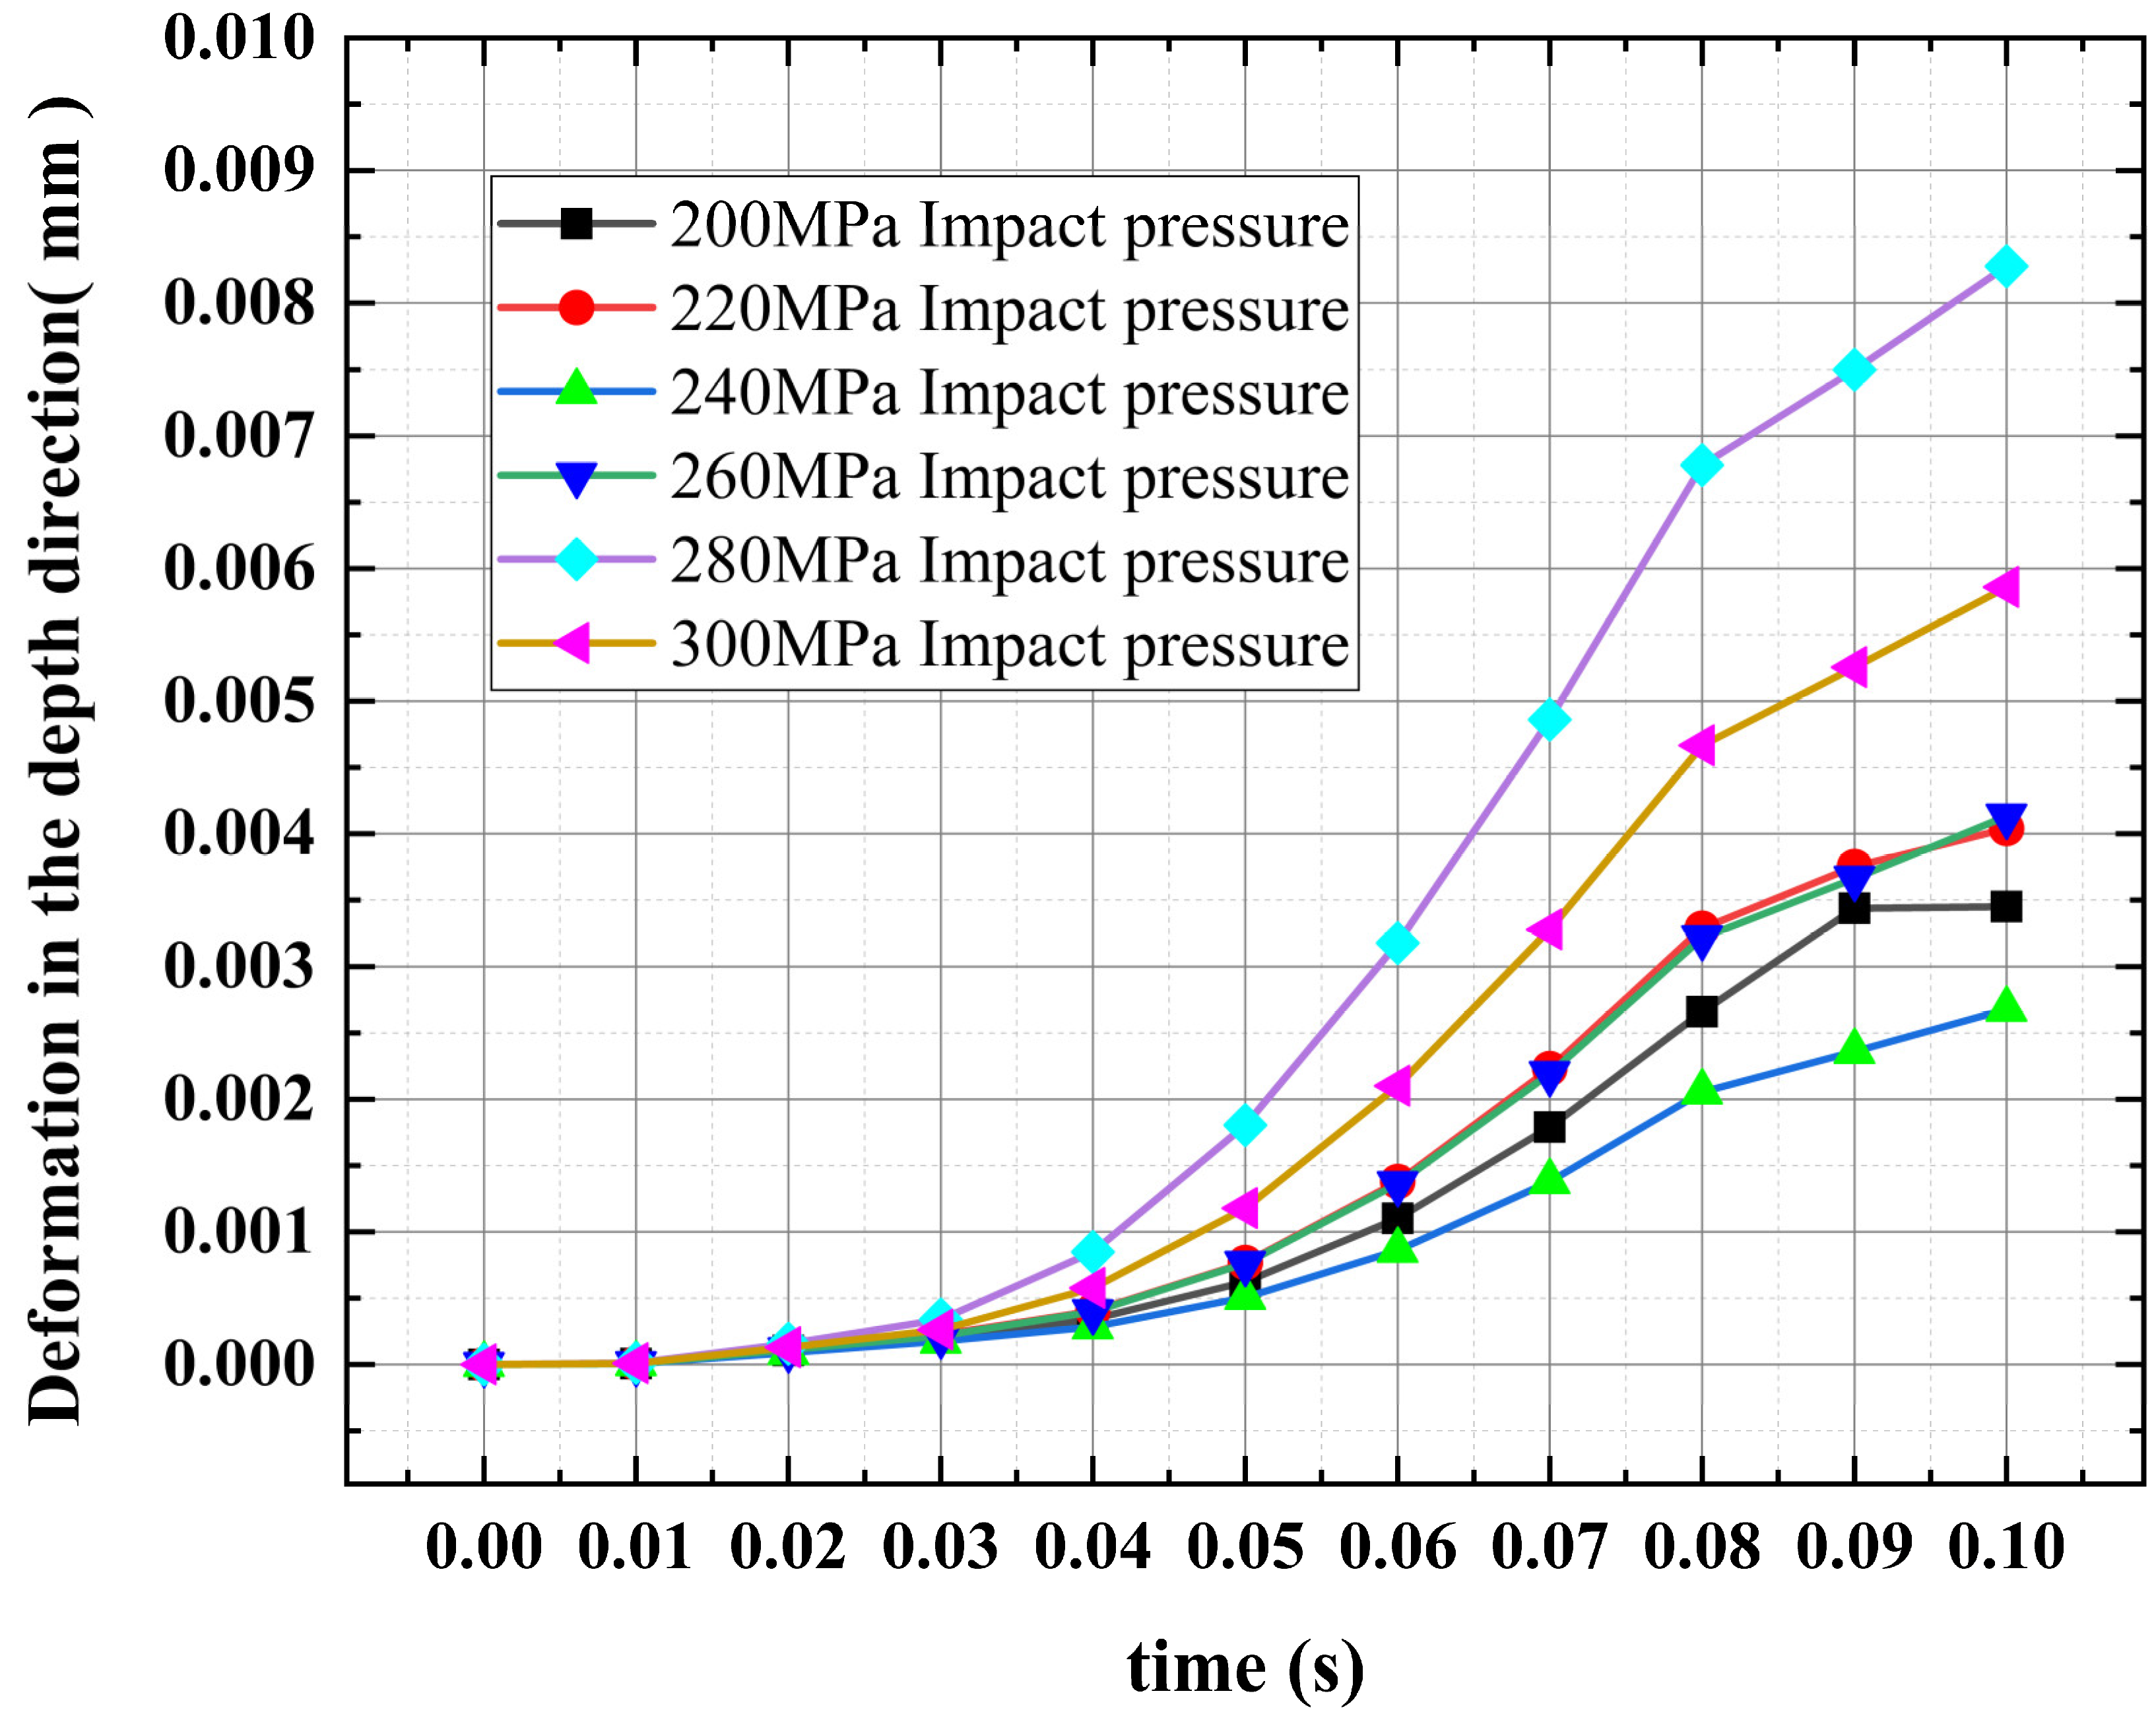
Figure 10.
Water jet experimental platform. (a) Control system. (b) ultra-high pressure pump.
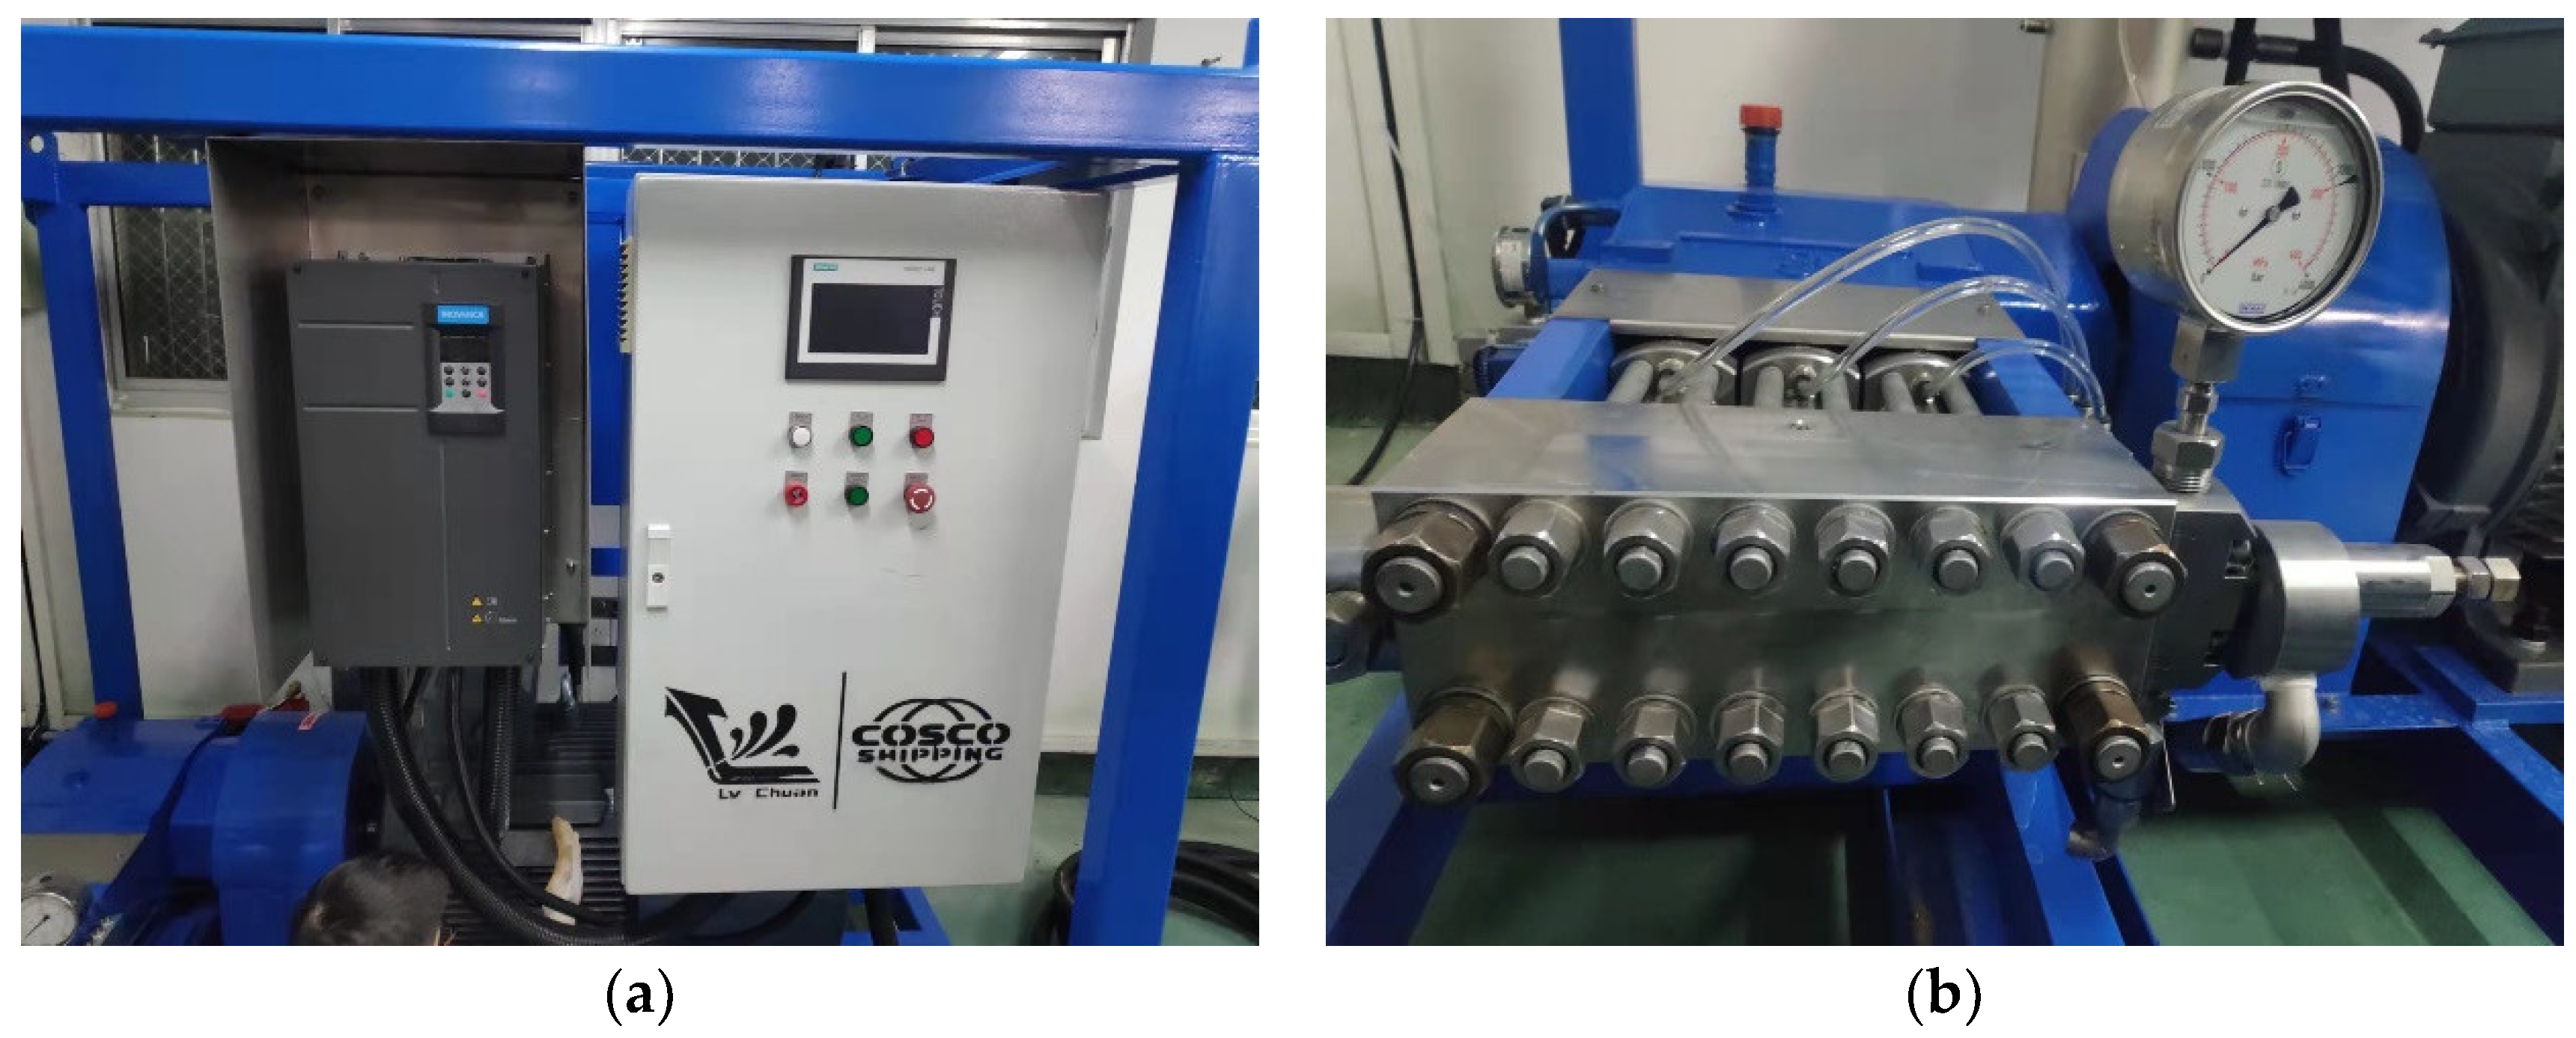
Figure 11.
SEM images of the material surface after water jet erosion at different pressures. (a) 200 MPa pressure. (b) 240 MPa pressure. (c) 300 MPa pressure.
Figure 11.
SEM images of the material surface after water jet erosion at different pressures. (a) 200 MPa pressure. (b) 240 MPa pressure. (c) 300 MPa pressure.

Table 1.
Grid independence test.
| Test Group | Number of Grid Cells | Maximum Pressure of the Impacted Surface of the Target (MPa) |
|---|---|---|
| A1 | 324,651 | 59.439 |
| A2 | 632,218 | 71.965 |
| A3 | 975,376 | 79.731 |
| A4 | 1,262,945 | 82.686 |
| A5 | 1,794,662 | 83.127 |
| A6 | 2,036,387 | 83.238 |
| A7 | 2,560,398 | 83.367 |
Table 2.
Classic crushing mode.
| Broken Mode | Jet Characteristics |
|---|---|
| Rayleigh broken | liquid Weber number and the air Weber number |
| Atomization and crushing | Air Weber number |
Publisher’s Note: MDPI stays neutral with regard to jurisdictional claims in published maps and institutional affiliations. |
© 2022 by the authors. Licensee MDPI, Basel, Switzerland. This article is an open access article distributed under the terms and conditions of the Creative Commons Attribution (CC BY) license (https://creativecommons.org/licenses/by/4.0/).
Share and Cite
MDPI and ACS Style
Zhang, Q.; Shi, Z.; Shi, W.; Xie, Z.; Tan, L.; Yang, Y. Research on Flow Field Characteristics in Water Jet Nozzle and Surface Damage Caused by Target Impact. Sustainability 2022, 14, 9074. https://doi.org/10.3390/su14159074
AMA Style
Zhang Q, Shi Z, Shi W, Xie Z, Tan L, Yang Y. Research on Flow Field Characteristics in Water Jet Nozzle and Surface Damage Caused by Target Impact. Sustainability. 2022; 14(15):9074. https://doi.org/10.3390/su14159074
Chicago/Turabian StyleZhang, Qinghong, Zhouhao Shi, Weidong Shi, Zhanshan Xie, Linwei Tan, and Yongfei Yang. 2022. "Research on Flow Field Characteristics in Water Jet Nozzle and Surface Damage Caused by Target Impact" Sustainability 14, no. 15: 9074. https://doi.org/10.3390/su14159074
Note that from the first issue of 2016, this journal uses article numbers instead of page numbers. See further details here.