
Accomplishing Sustainability in Manufacturing System for Small and Medium-Sized Enterprises (SMEs) through Lean Implementation

 , ,
, ,  and
and 
Abstract
:1. Introduction
2. Literature Review
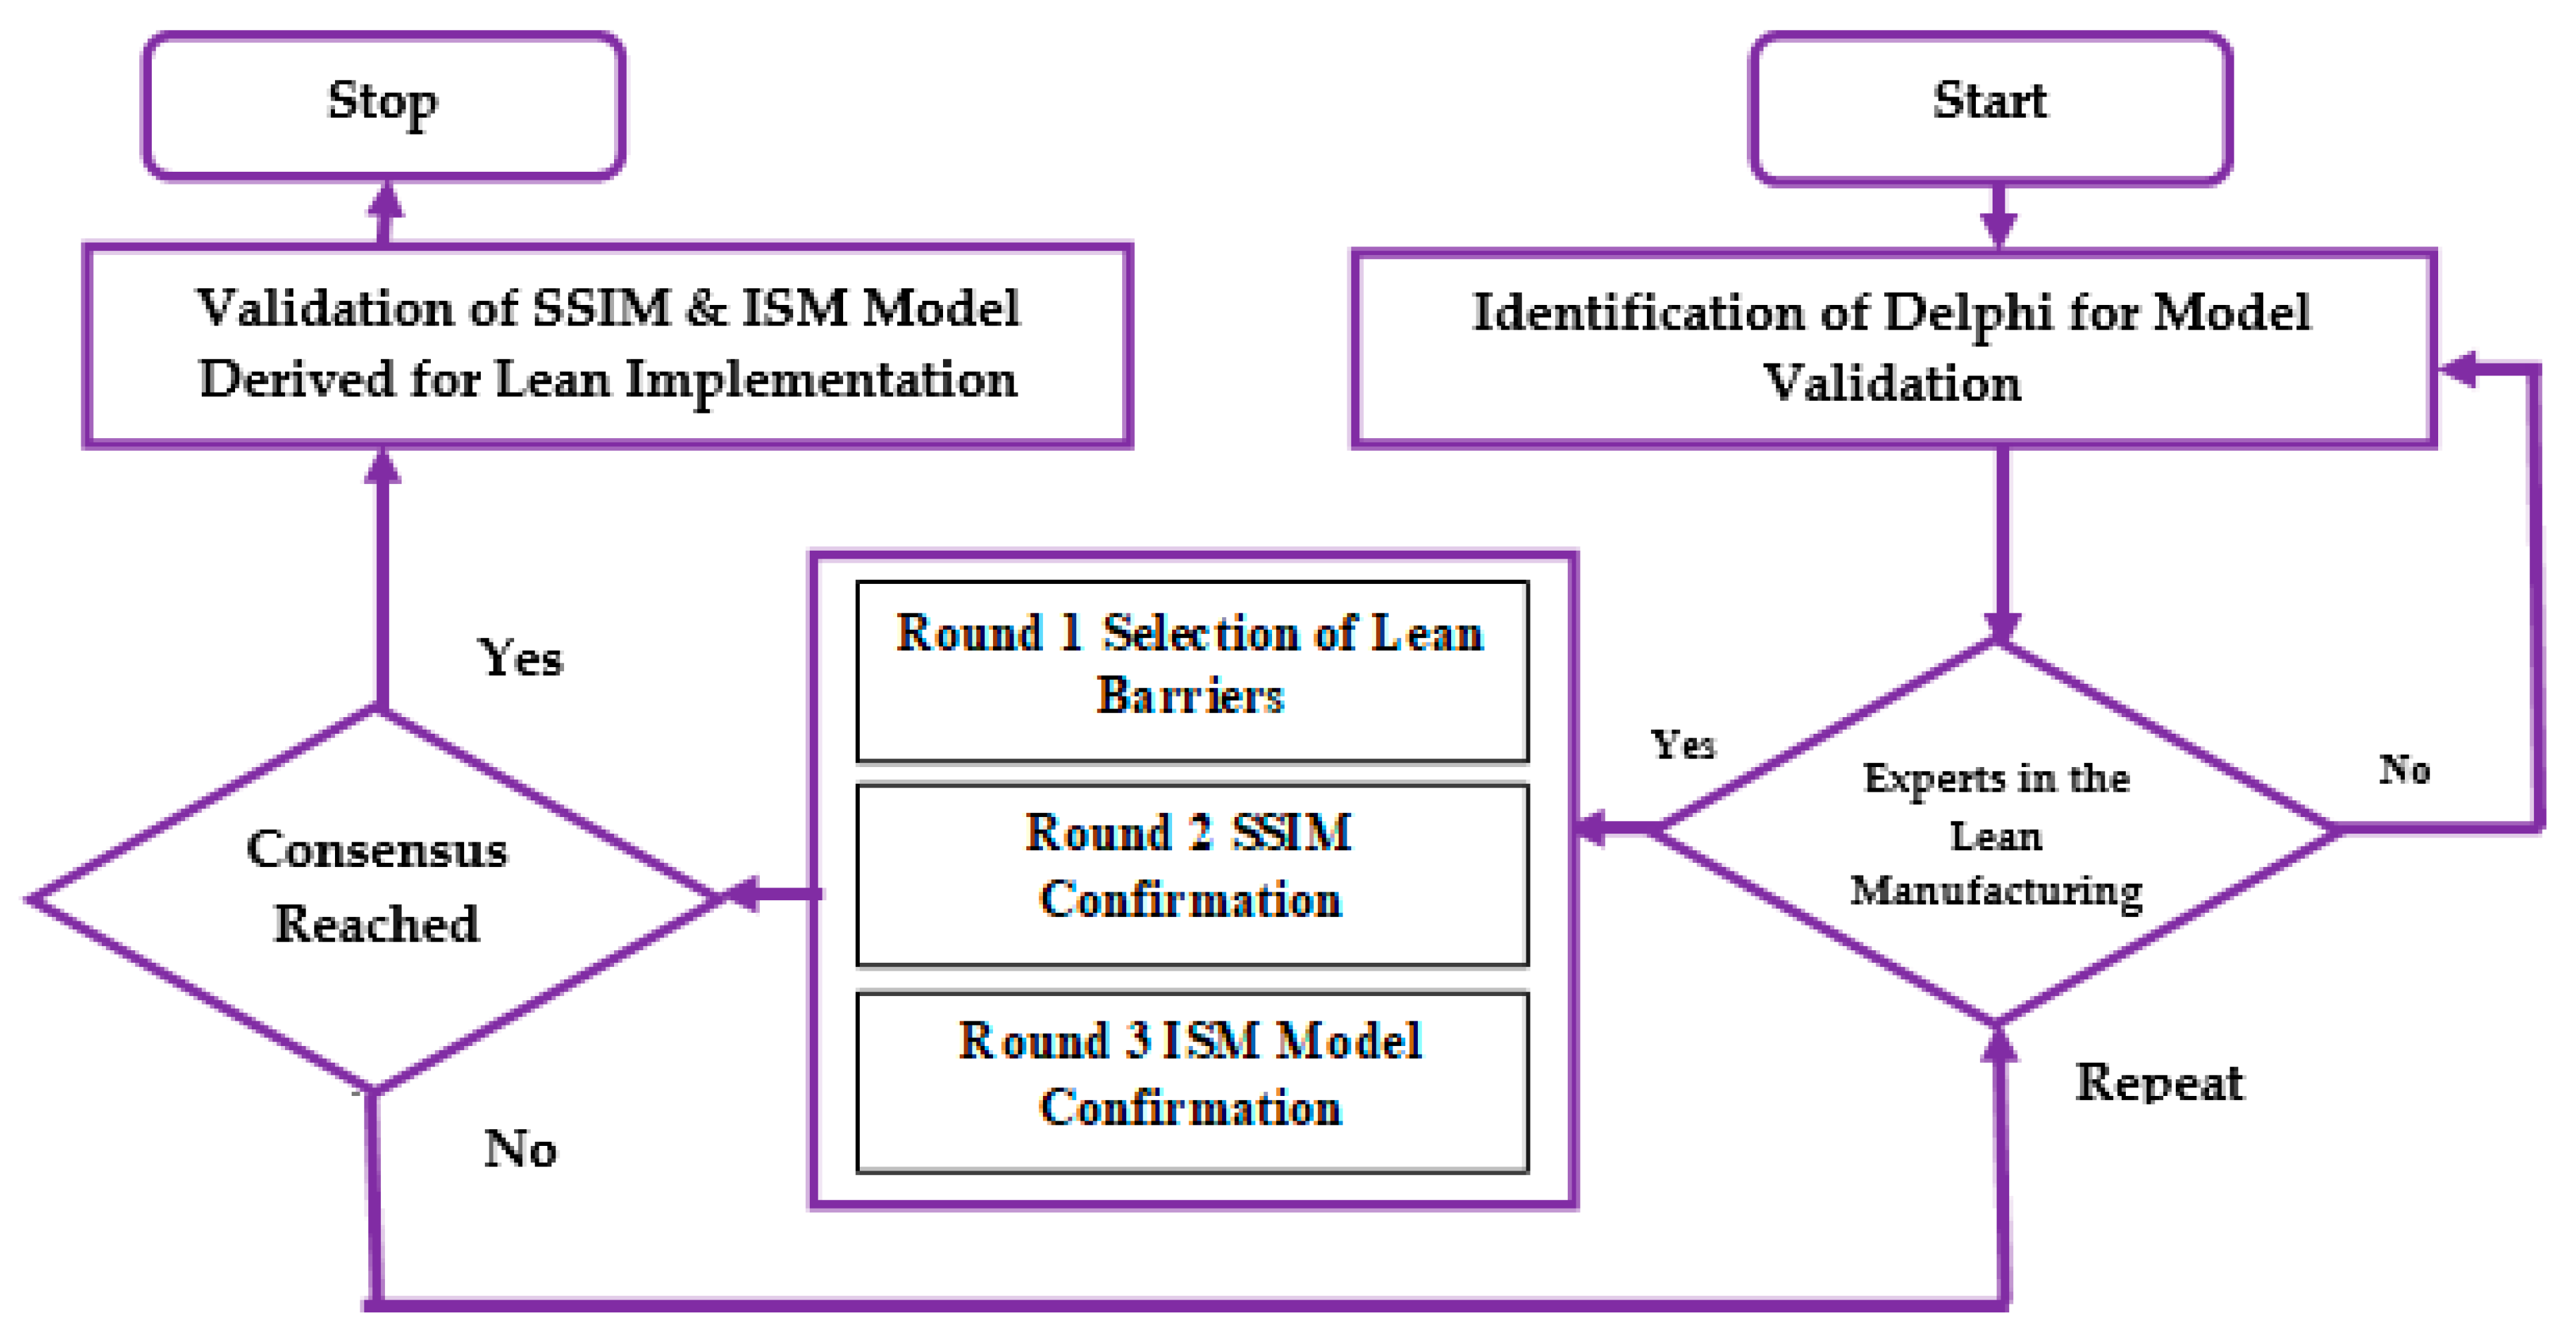
3. Research Methodology
- −
- If the SSIM’s (x, y) entry is ‘V’, the reachability matrix’s (x, y) entry becomes 1 and the (y, x) entry becomes 0.
- −
- If the SSIM’s (x, y) entry is ‘A’, the reachability matrix’s (x, y) entry becomes 0 and the (y, x) entry becomes 1.
- −
- If the SSIM’s (x, y) entry is ‘X’, the reachability matrix’s (x, y) entry becomes 1, and the (y, x) entry similarly becomes 1.
- −
- If the SSIM’s (x, y) entry is ‘O’, the reachability matrix’s (x, y) entry becomes 0, and the (y, x) entry similarly becomes 0.
4. Results
4.1. Phase 1
4.2. Phase 2
4.3. Phase 3
5. Discussion
6. Conclusions
Author Contributions
Funding
Institutional Review Board Statement
Informed Consent Statement
Data Availability Statement
Acknowledgments
Conflicts of Interest
References
- Elkhairi, A.; Fedouaki, F.; El Alami, S. Barriers and critical success factors for implementing lean manufacturing in SMEs. IFAC-Pap. 2019, 52, 565–570. [Google Scholar] [CrossRef]
- Yadav, V.; Jain, R.; Mittal, M.L.; Panwar, A.; Lyons, A.C. The propagation of lean thinking in SMEs. Prod. Plan. Control. 2019, 30, 854–865. [Google Scholar] [CrossRef]
- Achanga, P.; Shehab, E.; Roy, R.; Nelder, G. Critical success factors for lean implementation within SMEs. J. Manuf. Technol. Manag. 2006, 17, 460–471. [Google Scholar] [CrossRef]
- Raju, G.S.; Vanteru, M.K.; Naik, A.C. Lean manufacturing for SMEs-A study with reference to SMEs. AIP Conf. Proc. 2021, 2317, 050017. [Google Scholar] [CrossRef]
- Swarnakar, V.; Singh, A.R.; Tiwari, A.K. Assessment of manufacturing process through lean manufacturing and sustainability indicators: Case studies in Indian perspective. In Emerging Trends in Mechanical Engineering; Springer: Berlin/Heidelberg, Germany, 2020; pp. 253–263. [Google Scholar]
- Yuik, C.J.; Perumal, P.A.; Feng, C.J. Exploring critical success factors for the implementation of lean manufacturing in machinery and equipment SMEs. Eng. Manag. Prod. Serv. 2020, 12, 77–91. [Google Scholar] [CrossRef]
- Mathiyazhagan, K.; Gnanavelbabu, A.; Agarwal, V. A framework for implementing sustainable lean manufacturing in the electrical and electronics component manufacturing industry: An emerging economies country perspective. J. Clean. Prod. 2022, 334, 130169. [Google Scholar] [CrossRef]
- De La Vega, M.; Baez-Lopez, Y.; Limon-Romero, J.; Tlapa, D.; Flores, D.L.; Borbón, M.I.R.; Maldonado-Macías, A.A. Lean manufacturing critical success factors for the transportation equipment manufacturing industry in Mexico. IEEE Access 2020, 8, 168534–168545. [Google Scholar] [CrossRef]
- Matt, D.T.; Rauch, E. Implementation of lean production in small sized enterprises. Procedia Cirp 2013, 12, 420–425. [Google Scholar] [CrossRef]
- Kamble, S.; Gunasekaran, A.; Dhone, N.C. Industry 4.0 and lean manufacturing practices for sustainable organisational performance in Indian manufacturing companies. Int. J. Prod. Res. 2020, 58, 1319–1337. [Google Scholar] [CrossRef]
- Resta, B.; Dotti, S.; Gaiardelli, P.; Boffelli, A. Lean manufacturing and sustainability: An integrated view. In Proceedings of the IFIP International Conference on Advances in Production Management Systems, Iguassu Falls, Brazil, 3–7 September 2016; Springer: Cham, Switzerland, 2016; pp. 659–666. [Google Scholar]
- Ramadas, T.; Satish, K.P. Identification and modeling of process barriers: Implementing lean manufacturing in small-and medium-size enterprises. Int. J. Lean Six Sigma 2018, 12, 61–77. [Google Scholar]
- Burawat, P. The mediate effect of lean manufacturing on the relationship between transaformational leadership and sustainability performance in thai SMEs. Int. J. Appl. Eng. Res. 2017, 12, 11647–11657. Available online: https://www.scopus.com/inward/record.uri?eid=2-s2.0-85040242142&partnerID=40&md5=49ce63b0d192190736e1d5ae4028c7db (accessed on 1 May 2022).
- Houti, M.; El Abbadi, L.; Abouabdellah, A. Critical success factors for lean implementation “projection on SMEs”. In Proceedings of the International Conference on Industrial Engineering and Operations Management, Pilsen, Czech Republic, 23–26 July 2019; pp. 526–537. Available online: https://www.scopus.com/inward/record.uri?eid=2-s2.0-85077344882&partnerID=40&md5=388e57f9712e882425f7af04f2105067 (accessed on 1 May 2022).
- Thanki, S.; Govindan, K.; Thakkar, J. An investigation on lean-green implementation practices in Indian SMEs using analytical hierarchy process (AHP) approach. J. Clean. Prod. 2016, 135, 284–298. [Google Scholar] [CrossRef]
- Dora, M.; Kumar, M.; Van Goubergen, D.; Molnar, A.; Gellynck, X. Operational performance and critical success factors of lean manufacturing in European food processing SMEs. Trends Food Sci. Technol. 2013, 31, 156–164. [Google Scholar] [CrossRef]
- Jeyaraman, K.; Teo, L.K. A conceptual framework for critical success factors of lean Six Sigma: Implementation on the performance of electronic manufacturing service industry. Int. J. Lean Six Sigma 2010, 1, 191–215. [Google Scholar] [CrossRef]
- Kumar, N.; Mathiyazhagan, K.; Mathivathanan, D. Modelling the interrelationship between factors for adoption of sustainable lean manufacturing: A business case from the Indian automobile industry. Int. J. Sustain. Eng. 2020, 13, 93–107. [Google Scholar] [CrossRef]
- Maware, C.; Parsley, D.M. The Challenges of Lean Transformation and Implementation in the Manufacturing Sector. Sustainability 2022, 14, 6287. [Google Scholar] [CrossRef]
- Dora, M.; Kumar, M.; Gellynck, X. Determinants and barriers to lean implementation in food-processing SMEs—A multiple case analysis. Prod. Plan. Control. 2016, 27, 1–23. [Google Scholar] [CrossRef]
- Mane, A.M.; Jayadeva, C.T. 5S implementation in Indian SME: A case study. Int. J. Process Manag. Benchmarking 2015, 5, 483–498. [Google Scholar] [CrossRef]
- Pearce, A.; Pons, D.; Neitzert, T. Implementing lean-Outcomes from SME case studies. Oper. Res. Perspect. 2018, 5, 94–104. [Google Scholar] [CrossRef]
- Rose, A.N.M.; Deros, B.M.; Rahman, M.N.A. Lean manufacturing practices implementation in Malaysians SME automotive component industry. Appl. Mech. Mater. 2013, 315, 686–690. [Google Scholar] [CrossRef]
- Ulewicz, R.; Kucȩba, R. Identification of problems of implementation of Lean concept in the SME sector. Eng. Manag. Prod. Serv. 2016, 8, 19–25. [Google Scholar] [CrossRef] [Green Version]
- Xu, L.X.X.; Wang, F.Y.; Lim, R.; Toh, M.H.; Valliappan, R. Lean implementation in small and medium enterprises-A Singapore context. In Proceedings of the IEEE International Conference on Industrial Engineering and Engineering Management, Bangkok, Thailand, 10–13 December 2013; pp. 1592–1596. [Google Scholar] [CrossRef]
- Yadav, V.; Jain, R.; Mittal, M.L.; Panwar, A.; Lyons, A. The impact of lean practices on the operational performance of SMEs in India. Ind. Manag. Data Syst. 2019, 119, 317–330. [Google Scholar] [CrossRef] [Green Version]
- Dora, M.; Gellynck, X. Lean Six Sigma Implementation in a Food Processing SME: A Case Study. Qual. Reliab. Eng. Int. 2015, 31, 1151–1159. [Google Scholar] [CrossRef]
- Kumar, M.; Antony, J.; Singh, R.K.; Tiwari, M.K.; Perry, D. Implementing the Lean Sigma framework in an Indian SME: A case study. Prod. Plan. Control. 2006, 17, 407–423. [Google Scholar] [CrossRef] [Green Version]
- Lande, M.; Shrivastava, R.L.; Seth, D. Critical success factors for Lean Six Sigma in SMEs (small and medium enterprises). TQM J. 2016, 4, 613–635. [Google Scholar] [CrossRef]
- Fercoq, A.; Lamouri, S.; Carbone, V. Lean/Green integration focused on waste reduction techniques. J. Clean. Prod. 2016, 137, 567–578. [Google Scholar] [CrossRef]
- Gunasekharan, S.; Elangovan, D.; Parthiban, P. Critical success factors for implementation of lean and green in medium scale manufacturing industries. Appl. Mech. Mater. 2014, 592, 2588–2595. [Google Scholar] [CrossRef]
- Jaiswal, P.; Kumar, A. Assessment of drivers to implement integrated lean green manufacturing system in Indian SMEs through IF-TOPSIS approach. Int. J. Manag. Decis. Mak. 2018, 17, 224–243. [Google Scholar] [CrossRef]
- Johansson, G.; Winroth, M. Lean vs. Green manufacturing: Similarities and differences. In Proceedings of the 16th International Annual EurOMA Conference, Implementation Realizing Operations Management Knowledge, Göteborg, Sweden, 14–17 June 2009. [Google Scholar]
- Thanki, S.; Thakkar, J.J. An investigation on lean–green performance of Indian manufacturing SMEs. Int. J. Product. Perform. Manag. 2020, 69, 489–517. [Google Scholar] [CrossRef]
- Sindhwani, R.; Mittal, V.K.; Singh, P.L.; Aggarwal, A.; Gautam, N. Modelling and analysis of barriers affecting the implementation of lean green agile manufacturing system (LGAMS). Benchmarking Int. J. 2019, 26, 498–529. [Google Scholar] [CrossRef]
- Kaswan, M.S.; Rathi, R. Analysis and modeling the enablers of green lean six sigma implementation using interpretive structural modeling. J. Clean. Prod. 2019, 231, 1182–1191. [Google Scholar] [CrossRef]
- Alaskari, O.; Ahmad, M.M.; Pinedo-Cuenca, R. Analysis of the CSFs of lean tools and ERP systems in improving manufacturing performance in SMEs. Lect. Notes Mech. Eng. 2013, 7, 1401–1412. [Google Scholar] [CrossRef]
- Belhadi, A.; Touriki, F.E.; Elfezazi, S. Evaluation of critical success factors (CSFs) to lean implementation in SMEs using AHP: A case study. Int. J. Lean Six Sigma 2019, 10, 803–829. [Google Scholar] [CrossRef]
- Belhadi, A.; Touriki, F.E.; El Fezazi, S. Prioritizing the solutions of lean implementation in SMEs to overcome its barriers: An integrated fuzzy AHP-TOPSIS approach. J. Manuf. Technol. Manag. 2017, 28, 1115–1139. [Google Scholar] [CrossRef]
- Achanga, P.; Shehab, E.; Roy, R.; Nelder, G. A fuzzy-logic advisory system for lean manufacturing within SMEs. Int. J. Comput. Integr. Manuf. 2012, 25, 839–852. [Google Scholar] [CrossRef] [Green Version]
- Van Landeghem, H. A management system for sustainable lean implementation. In Handbook of Research on Design and Management of Lean Production Systems; IGI Global: Bratislava, Slovakia, 2014. [Google Scholar] [CrossRef]
- Rose, A.M.N.; Md Deros, B.; Nordin, N. Lean manufacturing best practices in SMEs. In Proceedings of the 2011 International Conference on Industrial Engineering and Operations Management, Kuala Lumpur, Malaysia, 21–24 January 2011; pp. 872–877. [Google Scholar]
- Rymaszewska, A.D. The challenges of lean manufacturing implementation in SMEs. Benchmarking Int. J. 2014, 21, 987–1002. [Google Scholar] [CrossRef]
- Barclay, R.C.; Cudney, E.A.; Shetty, S.; Antony, J. Determining critical success factors for lean implementation. Total Qual. Manag. Bus. Excell. 2022, 33, 818–832. [Google Scholar] [CrossRef]
- Dora, M.; Van Goubergen, D.; Molnar, A.; Gellynck, X.; Kumar, M. Adoptability of lean manufacturing among small and medium food processing enterprises. In Proceedings of the 62nd IIE Annual Conference and Expo 2012, Orlando, FL, USA, 19–23 May 2012; pp. 806–814. Available online: http://hdl.handle.net/1854/LU-3103755 (accessed on 1 May 2022).
- Sahwan, M.A.; Ab Rahman, M.N.; Deros, B.M. Barriers to implement lean manufacturing in Malaysian automotive industry. J. Teknologi 2012, 59, 107–110. [Google Scholar] [CrossRef] [Green Version]
- Bon, A.T.; Kee, T.S. Implementation of Lean manufacturing for productivity improvement in Malaysia. In Proceedings of the 2015 International Conference on Industrial Engineering and Operations Management (IEOM), Dubai, United Arab Emirates, 3–5 March 2015; pp. 1–6. [Google Scholar]
- Nordin, N.; Deros, B.M.; Wahab, D.A.; Rahman, M.N.A. A framework for organisational change management in lean manufacturing implementation. Int. J. Serv. Oper. Manag. 2012, 12, 101–117. [Google Scholar] [CrossRef]
- Hibadullah, S.N.; Habidin, N.F.; Zamri, F.I.M.; Fuzi, N.M.; Desa, A.F.N.C. Critical success factors of lean manufacturing practices for the Malaysian automotive manufacturers. Int. J. Qual. Innov. 2014, 2, 256–271. [Google Scholar] [CrossRef]
- Jasti, N.V.K.; Kodali, R. An empirical study for implementation of lean principles in Indian manufacturing industry. Benchmarking Int. J. 2016, 23, 183–207. [Google Scholar] [CrossRef]
- Alok, S.; Kabra, A.; Mudam, A. Predicting the behavioural intention to adopt lean practices: An empirical study in the manufacturing industry. Int. J. Serv. Oper. Manag. 2018, 29, 557–578. [Google Scholar] [CrossRef]
- Sharma, S.S.; Shukla, D.D.; Sharma, B.P. Analysis of Lean Manufacturing Implementation in SMEs: A “5S” Technique; Shanker, K., Shankar, R., Sindhwani, R., Eds.; Advances in Industrial and Production Engineering; Lecture Notes in Mechanical Engineering; Springer: Singapore, 2019. [Google Scholar] [CrossRef]
- Womack, J.P.; Jones, D.T. Lean thinking-banish waste and create wealth in your corporation. J. Oper. Res. Soc. 1997, 48, 1148. [Google Scholar] [CrossRef]
- Vinodh, S.; Arvind, K.R.; Somanaathan, M. Tools and techniques for enabling sustainability through lean initiatives. Clean Technol. Environ. Policy 2011, 13, 469–479. [Google Scholar] [CrossRef]
- Sterling, A.; Boxall, P. Lean production, employee learning and workplace outcomes: A case analysis through the ability-motivation-opportunity framework. Hum. Resour. Manag. J. 2013, 23, 227–240. [Google Scholar] [CrossRef]
- Nulty, D.D. The adequacy of response rates to online and paper surveys: What can be done? Assess. Eval. High. Educ. 2008, 33, 301–314. [Google Scholar] [CrossRef] [Green Version]
- Luthra, S.; Garg, D.; Haleem, A. An analysis of interactions among critical success factors to implement green supply chain management towards sustainability: An Indian perspective. Resour. Policy 2015, 46, 37–50. [Google Scholar] [CrossRef]
- Sushil, D. Interpretive ranking process. Glob. J. Flex. Syst. Manag. 2009, 10, 1–10. [Google Scholar] [CrossRef]
- Thanki, S.J.; Thakkar, J. Interdependence analysis of lean-green implementation challenges: A case of Indian SMEs. J. Manuf. Technol. Manag. 2018, 29, 295–328. [Google Scholar] [CrossRef]
- Demeter, K.; Losonci, D.; Matyusz, Z.; Jenei, I. The impact of lean management on business level performance and competitiveness. In Rapid Modelling for Increasing Competitiveness; Springer: London, UK, 2009; pp. 177–198. [Google Scholar]
- Kariuki, B.M.; Mburu, D.K. Role of Lean manufacturing on organization competitiveness. Ind. Eng. 2013, 3, 81–82. [Google Scholar]


| Lean-Based Approaches | References |
|---|---|
| Lean | [3,20,21,22,23,24,25,26] |
| Lean six-sigma | [27,28,29] |
| Lean-green | [15,30,31,32,33,34] |
| Lean-green-agile | [35] |
| Lean-green six-sigma | [36] |
| Sr. No. | Lean Implementation CSFs | Descriptions | References |
|---|---|---|---|
| 1 | Top management support and commitment | It is top management’s proactive support for the effective implementation of various performance-related measures. | [3,8,18,20,26] |
| 2 | Organization strategies and policies | Organizational strategies and policies will drive employees towards the company’s mission and vision. | [46] |
| 3 | Change management and organizational culture | Change management helps individuals or teams prepare for and support organizational change. Organizational culture teaches employee behavior in an organization to inculcate values and traits. | [3,20,26,31,33,47] |
| 4 | Organization structure | It provides the system to fulfill any activities within the system to accomplish the targeted organizational goals. | [3] |
| 5 | effective communication | Effective communication helps to share and utilize the information for better decision-making and performance improvement. | [47,48] |
| 6 | Employee attitude | It has a powerful influence on individual performance and positive relationships with subordinates, colleagues, and superiors, having inculcated values in one job performance. | [3] |
| 7 | Supplier involvement management | Involving suppliers in product design and development, processes, testing, etc., enhances product value addition due to the proactive approach of the supplier in outsourcing management. | [31,49] |
| 8 | Customer focus | Increased customer focus will engage the customer in product design and development to ensure needs and expectations. | [8,49,50] |
| 9 | adoption of soft practices and lean tools | It deals with personal behavior with all stakeholders and enhances sociocultural in an organization, whereas lean tools provide hard practices providing scientific methods/techniques and statistical tools. | [51,52] |
| 10 | Value addition | It refers to adding extra features to the given product or enhancing the economic value that lures the customers, thus enhancing markets share, sales, profit, etc. | [3] |
| 11 | Waste minimization | They are the group of processes and standard practices meant to eliminate waste from the processes or system. | [53] |
| 12 | Sustainability in manufacturing system | It is the self-sufficiency of the manufacturing system for profit and competitiveness. | [10,54] |
| 13 | Employee motivation | Employee motivation is the proactive involvement of employees with creativity and enthusiasm. | [46,47,48] |
| 14 | Government support | Government supports financial loans, tax benefits, and rules and policies to foster SME development. | [31] |
| 15 | Resource capability | It provides the process resources to meet the requirement of each operation. The creation of resource copiability will help allocate aid in the system. | [3] |
| 16 | Skill and expertise | Skill and expertise are the set of deliverables in fulfilling the activities. | [3,31] |
| 17 | Training and education | Employment training ensures expectations and commitment from the employee towards fulfilling the activities. | [8,26,49] |
| 18 | Financial capability | Financial capabilities ensure management takes proactive investment decisions in strategic planning, employee training, and equipment or consultant hiring. | [3,26,31,47] |
| 19 | Employee involvement | The employee’s proactive participation in fulfilling the vision and mission of the organization by undertaking efforts for problem solving, idea building, and applying innovative ideas. | [20,31,33,47,49] |
| 20 | Worker empowerment and engagement | Employee empowerment provides support to employees to take the decision or corrective action, whereas employee engagement is the involvement of employees towards productivity improvement, performance enhancement, and reduction in employee turnover. | [22,55] |
| No. | Critical Success Factors | Code | Mean | SD | Corrected Item-Total Correlation | Cronbach’s Alpha |
|---|---|---|---|---|---|---|
| 1 | Organization structure | CSF1 | 4.23 | 0.853 | 0.318 | 0.855 |
| 2 | Financial capability | CSF2 | 4.24 | 0.882 | 0.549 | 0.843 |
| 3 | Government support | CSF3 | 4.15 | 0.960 | 0.314 | 0.856 |
| 4 | Adoption of soft practices and lean tools | CSF4 | 4.16 | 0.929 | 0.296 | 0.857 |
| 5 | Top management support and commitment | CSF5 | 4.02 | 0.937 | 0.471 | 0.847 |
| 6 | Supplier involvement management | CSF6 | 4.09 | 0.885 | 0.514 | 0.845 |
| 7 | Waste minimization | CSF7 | 4.45 | 0.776 | 0.481 | 0.847 |
| 8 | Customer focus | CSF8 | 4.36 | 0.820 | 0.454 | 0.848 |
| 9 | Change management and organizational Culture | CSF9 | 4.13 | 0.880 | 0.684 | 0.836 |
| 10 | Employee attitude | CSF10 | 4.10 | 0.902 | 0.701 | 0.834 |
| 11 | Employee motivation | CSF11 | 4.07 | 0.899 | 0.671 | 0.836 |
| 12 | Skill and expertise | CSF12 | 4.07 | 0.899 | 0.671 | 0.836 |
| 13 | Training and education | CSF13 | 4.04 | 0.888 | 0.414 | 0.850 |
| 14 | Employee involvement | CSF14 | 4.05 | 0.856 | 0.425 | 0.850 |
| 15 | Sustainability in manufacturing system | CSF15 | 4.04 | 0.888 | 0.414 | 0.850 |
| CSF | Lean Implementation CSFs | 15 | 14 | 13 | 12 | 11 | 10 | 9 | 8 | 7 | 6 | 5 | 4 | 3 | 2 |
|---|---|---|---|---|---|---|---|---|---|---|---|---|---|---|---|
| 1 | Organization structure | V | V | O | O | O | O | O | V | O | V | O | V | A | A |
| 2 | Financial capability | V | V | O | O | V | V | V | V | O | V | D | V | A | |
| 3 | Government support | V | V | V | V | V | V | V | V | D | V | V | V | ||
| 4 | Adoption of soft practices and lean tools | V | V | A | V | O | O | A | D | O | V | A | |||
| 5 | Top management support and commitment | V | V | V | V | V | V | O | V | V | V | ||||
| 6 | Supplier involvement management | V | O | A | O | A | A | A | V | O | |||||
| 7 | Waste minimization | V | O | O | A | A | O | O | O | ||||||
| 8 | Customer focus | V | A | O | O | A | A | A | |||||||
| 9 | Change management and organizational culture | V | V | O | O | O | O | ||||||||
| 10 | Employee attitude | V | V | V | O | O | |||||||||
| 11 | Employee motivation | V | V | V | V | ||||||||||
| 12 | Skill and expertise | V | O | A | |||||||||||
| 13 | Training and education | V | V | ||||||||||||
| 14 | Employee involvement | V | |||||||||||||
| 15 | Sustainability in manufacturing system |
| CSF | Lean Implementation CSFs | 1 | 2 | 3 | 4 | 5 | 6 | 7 | 8 | 9 | 10 | 11 | 12 | 13 | 14 | 15 |
|---|---|---|---|---|---|---|---|---|---|---|---|---|---|---|---|---|
| 1 | Organization structure | 1 | 0 | 0 | 1 | 0 | 1 | 0 | 1 | 0 | 0 | 0 | 0 | 0 | 1 | 1 |
| 2 | Financial capability | 1 | 1 | 0 | 1 | 1 | 1 | 0 | 1 | 1 | 1 | 1 | 0 | 0 | 1 | 1 |
| 3 | Government support | 1 | 1 | 1 | 1 | 1 | 1 | 1 | 1 | 1 | 1 | 1 | 1 | 1 | 1 | 1 |
| 4 | Adoption of soft practices and lean tools | 0 | 0 | 0 | 1 | 0 | 1 | 0 | 1 | 0 | 0 | 0 | 1 | 0 | 1 | 1 |
| 5 | Top management support and commitment | 0 | 0 | 0 | 1 | 1 | 1 | 1 | 1 | 0 | 1 | 1 | 1 | 1 | 1 | 1 |
| 6 | Supplier involvement management | 0 | 0 | 0 | 0 | 0 | 1 | 0 | 1 | 0 | 0 | 0 | 0 | 0 | 0 | 1 |
| 7 | Waste minimization | 0 | 0 | 0 | 0 | 0 | 0 | 1 | 0 | 0 | 0 | 0 | 0 | 0 | 0 | 1 |
| 8 | Customer focus | 0 | 0 | 0 | 0 | 0 | 0 | 0 | 1 | 0 | 0 | 0 | 0 | 0 | 0 | 1 |
| 9 | Change management and organizational culture | 0 | 0 | 0 | 1 | 0 | 1 | 0 | 1 | 1 | 0 | 0 | 0 | 0 | 1 | 1 |
| 10 | Employee attitude | 0 | 0 | 0 | 0 | 0 | 1 | 0 | 1 | 0 | 1 | 0 | 0 | 1 | 1 | 1 |
| 11 | Employee motivation | 0 | 0 | 0 | 0 | 0 | 1 | 1 | 1 | 0 | 0 | 1 | 1 | 1 | 1 | 1 |
| 12 | Skill and expertise | 0 | 0 | 0 | 0 | 0 | 0 | 1 | 1 | 1 | 1 | 1 | 1 | 0 | 0 | 1 |
| 13 | Training and education | 0 | 0 | 0 | 1 | 0 | 1 | 0 | 0 | 0 | 0 | 0 | 1 | 1 | 1 | 1 |
| 14 | Employee involvement | 0 | 0 | 0 | 0 | 0 | 0 | 0 | 1 | 0 | 0 | 0 | 0 | 0 | 1 | 1 |
| 15 | Sustainability in manufacturing system | 0 | 0 | 0 | 0 | 0 | 0 | 0 | 0 | 0 | 0 | 0 | 0 | 0 | 0 | 1 |
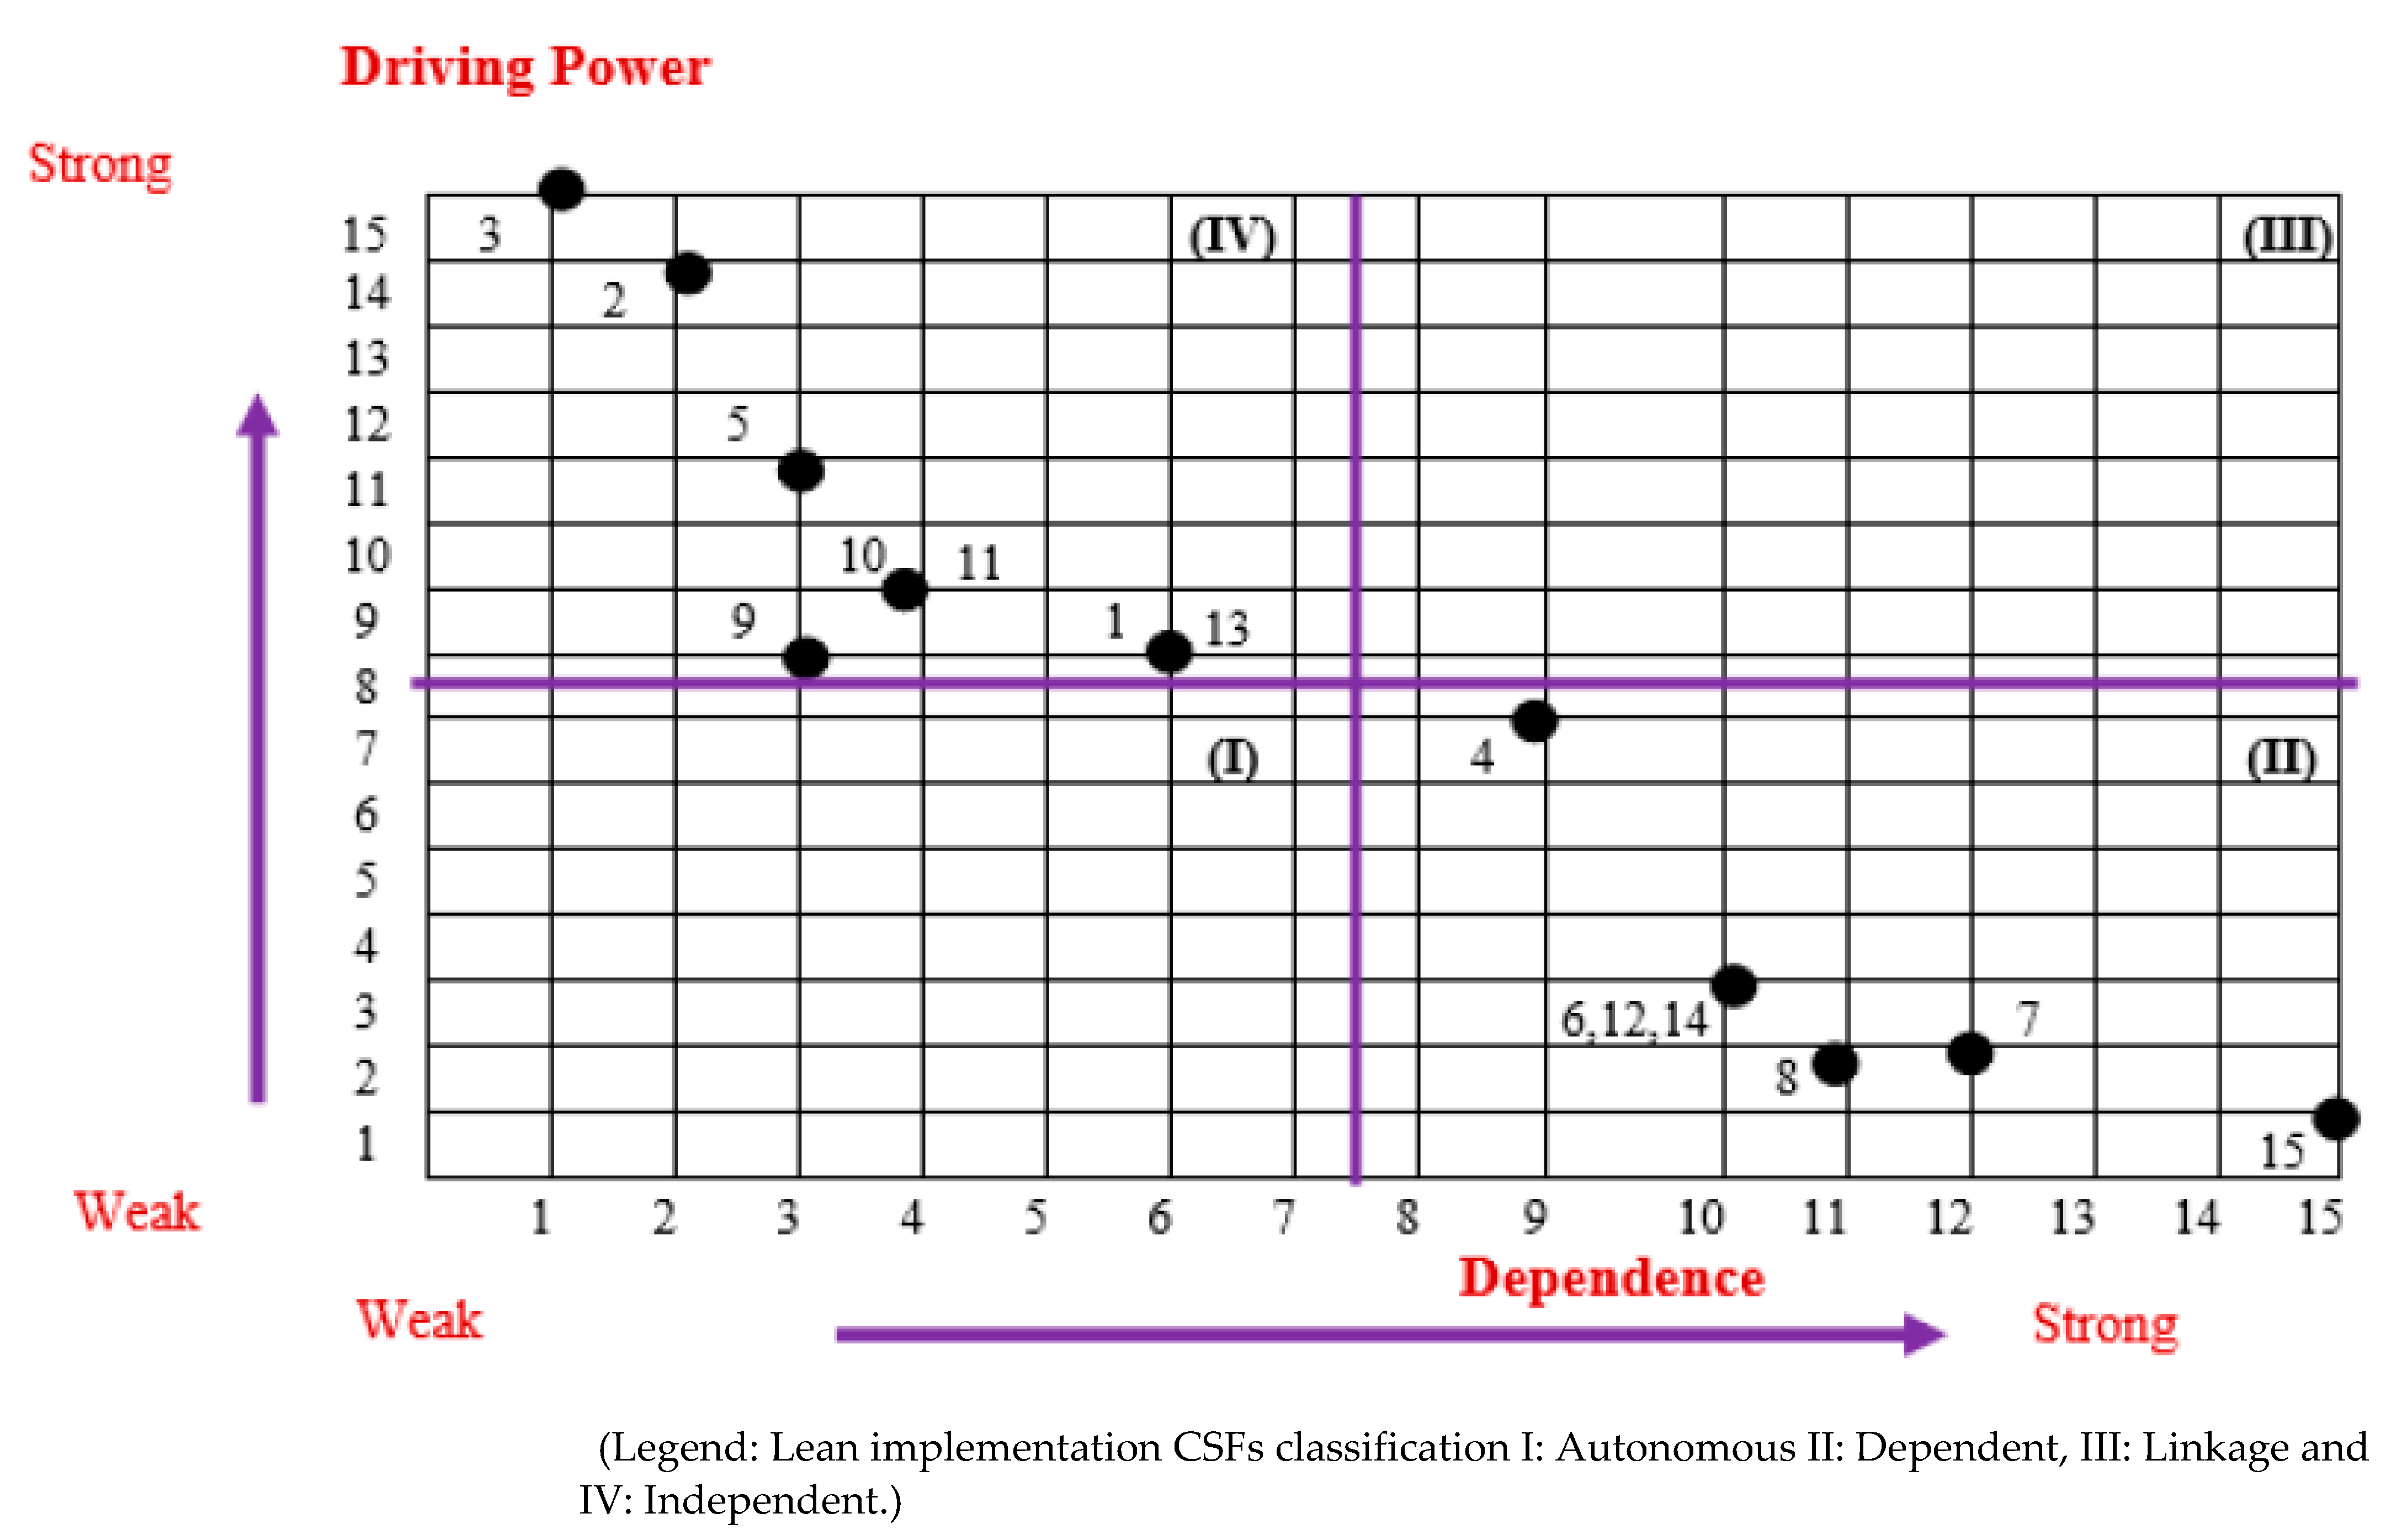
| CSF | Lean Implementation CSFs | 1 | 2 | 3 | 4 | 5 | 6 | 7 | 8 | 9 | 10 | 11 | 12 | 13 | 14 | 15 | Total Driving Power |
|---|---|---|---|---|---|---|---|---|---|---|---|---|---|---|---|---|---|
| 1 | Organization structure | 1 | 0 | 0 | 1 | 0 | 1 | 1 * | 1 | 0 | 0 | 0 | 1 * | 0 | 1 | 1 | 8 |
| 2 | Financial capability | 1 | 1 | 0 | 1 | 1 | 1 | 1 * | 1 | 1 | 1 | 1 | 1 * | 1 * | 1 | 1 | 14 |
| 3 | Government support | 1 | 1 | 1 | 1 | 1 | 1 | 1 | 1 | 1 | 1 | 1 | 1 | 1 | 1 | 1 | 15 |
| 4 | Adoption of soft practices and lean tools | 0 | 0 | 0 | 1 | 0 | 1 | 1 * | 1 | 0 | 0 | 0 | 1 | 0 | 1 | 1 | 7 |
| 5 | Top management support and commitment | 0 | 0 | 0 | 1 | 1 | 1 | 1 | 1 | 0 | 1 | 1 | 1 | 1 | 1 | 1 | 11 |
| 6 | Supplier involvement management | 0 | 0 | 0 | 0 | 0 | 1 | 0 | 1 | 0 | 0 | 0 | 0 | 0 | 0 | 1 | 3 |
| 7 | Waste minimization | 0 | 0 | 0 | 0 | 0 | 0 | 1 | 0 | 0 | 0 | 0 | 0 | 0 | 0 | 1 | 2 |
| 8 | Customer focus | 0 | 0 | 0 | 0 | 0 | 0 | 0 | 1 | 0 | 0 | 0 | 0 | 0 | 0 | 1 | 2 |
| 9 | Change management and organizational culture | 0 | 0 | 0 | 1 | 0 | 1 | 1 * | 1 | 1 | 0 | 0 | 1 * | 0 | 1 | 1 | 8 |
| 10 | Employee attitude | 0 | 0 | 0 | 1 * | 0 | 1 | 1 * | 1 | 0 | 1 | 0 | 1 * | 1 | 1 | 1 | 9 |
| 11 | Employee motivation | 0 | 0 | 0 | 1 * | 0 | 1 | 1 | 1 | 0 | 0 | 1 | 1 | 1 | 1 | 1 | 9 |
| 12 | Skill and expertise | 0 | 0 | 0 | 0 | 0 | 0 | 1 | 1 | 1 | 1 | 1 | 1 | 0 | 0 | 1 | 3 |
| 13 | Training and education | 0 | 0 | 0 | 1 | 0 | 1 | 1 * | 1 * | 0 | 0 | 0 | 1 | 1 | 1 | 1 | 8 |
| 14 | Employee involvement | 0 | 0 | 0 | 0 | 0 | 0 | 0 | 1 | 0 | 0 | 0 | 0 | 0 | 1 | 1 | 3 |
| 15 | Sustainability in manufacturing system | 0 | 0 | 0 | 0 | 0 | 0 | 0 | 0 | 0 | 0 | 0 | 0 | 0 | 0 | 1 | 1 |
| Total (Dependence) | 3 | 2 | 1 | 9 | 3 | 10 | 11 | 12 | 3 | 4 | 4 | 10 | 6 | 10 | 15 | ||
| CSF | Reachability Set | Antecedent Set | Intersection Set | Level |
|---|---|---|---|---|
| CSF1 | 1, 4, 6, 7, 8, 12, 14, 15 | 1, 2, 3 | -- | -- |
| CSF 2 | 1, 2, 4, 5, 6, 7, 8, 9, 10, 11, 12, 13, 14, 15 | 2, 3 | -- | -- |
| CSF 3 | 1, 2, 3, 4, 5, 6, 7, 8, 9, 10, 11, 12, 13, 14, 15 | 3 | -- | -- |
| CSF 4 | 4, 6, 7, 8, 12, 14, 15 | 1, 2, 3, 4, 5, 9, 10, 11, 13 | -- | -- |
| CSF 5 | 4, 5, 6, 7, 8, 10, 11, 12, 13, 14, 15 | 2, 3, 5 | -- | -- |
| CSF 6 | 6, 8, 15 | 1, 2, 3, 4, 5, 6, 9, 10, 11, 13 | -- | -- |
| CSF 7 | 7, 15 | 2, 3, 4, 5, 7, 11, 12, 13 | -- | -- |
| CSF 8 | 8, 15 | 1, 2, 3, 4, 5, 6, 8, 9, 10, 11, 13, 14 | -- | -- |
| CSF 9 | 4, 6, 8, 9, 12, 14, 15 | 2, 3, 9 | -- | -- |
| CSF 10 | 4, 6, 8, 10, 12, 13, 14, 15 | 2, 3, 5, 10 | -- | -- |
| CSF 11 | 4, 6, 7, 8, 11, 12, 13, 14, 15 | 2, 3, 5, 10, 11 | -- | -- |
| CSF 12 | 7, 12, 15 | 1, 2, 3, 4, 5, 9, 10, 11, 12, 13 | -- | -- |
| CSF 13 | 4, 6, 7, 8, 12, 13, 14, 15 | 2, 3, 5, 10, 11, 13 | -- | -- |
| CSF 14 | 8, 14, 15 | 1, 2, 3, 4, 5, 9, 10, 11, 13, 14 | -- | -- |
| CSF 15 | 15 | 1, 2, 3, 4, 5, 6, 7, 8, 9, 10, 11, 12, 13, 14, 15 | 15 | I |
| Iteration | CSFs | Reachability Set | Antecedent Set | Intersection Set | Level |
|---|---|---|---|---|---|
| ii | 7 | 7 | 2, 3, 4, 5, 7, 11, 12, 13 | 7 | II |
| ii | 8 | 8 | 1, 2, 3, 4, 6, 8, 9, 10, 11, 13, 14 | 8 | II |
| iii | 6 | 6 | 1, 2, 3, 4, 5, 6, 9, 10, 11, 13 | 6 | III |
| iii | 12 | 12 | 1, 2, 3, 4, 5, 9, 10, 11, 12, 13 | 12 | III |
| iii | 14 | 14 | 1, 2, 3, 4, 5, 9, 10, 11, 13, 14 | 14 | III |
| iv | 4 | 4 | 1, 2, 3, 4, 5, 9, 10, 11, 13 | 4 | IV |
| v | 1 | 1 | 1, 2, 3 | 1 | V |
| v | 9 | 9 | 2, 3, 9 | 9 | V |
| v | 13 | 13 | 2, 3, 5, 10, 11, 13 | 13 | V |
| vi | 10 | 10 | 2, 3, 5, 10 | 10 | VI |
| vi | 11 | 11 | 2, 3, 5, 10, 11 | 11 | VI |
| vii | 5 | 5 | 2, 3, 5 | 5 | VII |
| viii | 2 | 2 | 2, 3 | 2 | VII |
| ix | 3 | 3 | 3 | 3 | IX |
| CSF | Lean Implementation CSFs | 15 | 7 | 8 | 6 | 12 | 14 | 4 | 1 | 9 | 13 | 10 | 11 | 5 | 2 | 3 |
|---|---|---|---|---|---|---|---|---|---|---|---|---|---|---|---|---|
| 15 | Sustainability in manufacturing system | 1 | 0 | 0 | 0 | 0 | 0 | 0 | 0 | 0 | 0 | 0 | 0 | 0 | 0 | 0 |
| 7 | Waste minimization | 1 | 1 | 0 | 0 | 0 | 0 | 0 | 0 | 0 | 0 | 0 | 0 | 0 | 0 | 0 |
| 8 | Customer focus | 1 | 0 | 1 | 0 | 0 | 0 | 0 | 0 | 0 | 0 | 0 | 0 | 0 | 0 | 0 |
| 6 | Supplier involvement management | 1 | 0 | 1 | 1 | 0 | 0 | 0 | 0 | 0 | 0 | 0 | 0 | 0 | 0 | 0 |
| 12 | Skill and expertise | 1 | 1 | 1 | 0 | 1 | 0 | 0 | 0 | 1 | 0 | 1 | 1 | 0 | 0 | 0 |
| 14 | Employee involvement | 1 | 0 | 1 | 0 | 0 | 1 | 0 | 0 | 0 | 0 | 0 | 0 | 0 | 0 | 0 |
| 4 | Adoption of soft practices and lean tools | 1 | 1 | 1 | 1 | 1 | 1 | 1 | 0 | 0 | 0 | 0 | 0 | 0 | 0 | 0 |
| 1 | Organization structure | 1 | 1 | 1 | 1 | 1 | 1 | 1 | 1 | 0 | 0 | 0 | 0 | 0 | 0 | 0 |
| 9 | Change management and organizational culture | 1 | 1 | 1 | 1 | 1 | 1 | 1 | 0 | 1 | 0 | 0 | 0 | 0 | 0 | 0 |
| 13 | Training and education | 1 | 1 | 1 | 1 | 1 | 1 | 1 | 0 | 0 | 1 | 0 | 0 | 0 | 0 | 0 |
| 10 | Employee attitude | 1 | 1 | 1 | 1 | 1 | 1 | 1 | 1 | 0 | 1 | 1 | 0 | 0 | 0 | 0 |
| 11 | Employee motivation | 1 | 1 | 1 | 1 | 1 | 1 | 1 | 0 | 0 | 1 | 0 | 1 | 0 | 0 | 0 |
| 5 | Top management support and commitment | 1 | 1 | 1 | 1 | 1 | 1 | 1 | 1 | 0 | 1 | 1 | 1 | 1 | 0 | 0 |
| 2 | Financial capability | 1 | 1 | 1 | 1 | 1 | 1 | 1 | 1 | 1 | 1 | 1 | 1 | 1 | 1 | 0 |
| 3 | Government support | 1 | 1 | 1 | 1 | 1 | 1 | 1 | 1 | 1 | 1 | 1 | 1 | 1 | 1 | 1 |
| Lean CSFs | P1 | P2 | P3 | P4 | P5 | P6 | P7 | P8 |
|---|---|---|---|---|---|---|---|---|
| CSF1 | 1 | 1 | 0 | 0 | 0 | 0 | 1 | 1 |
| CSF2 | 0 | 1 | 0 | 0 | 1 | 1 | 0 | 0 |
| CSF3 | 1 | 0 | 0 | 0 | 0 | 1 | 0 | 1 |
| CSF4 | 1 | 1 | 0 | 1 | 0 | 0 | 0 | 1 |
| CSF5 | 0 | 1 | 1 | 0 | 0 | 0 | 0 | 1 |
| CSF6 | 1 | 1 | 1 | 0 | 0 | 0 | 0 | 1 |
| CSF7 | 0 | 1 | 0 | 0 | 1 | 1 | 1 | 0 |
| CSF8 | 0 | 1 | 0 | 0 | 1 | 0 | 0 | 0 |
| CSF9 | 0 | 1 | 0 | 0 | 0 | 1 | 1 | 0 |
| CSF10 | 0 | 1 | 0 | 0 | 0 | 0 | 0 | 1 |
| CSF11 | 1 | 0 | 0 | 0 | 0 | 0 | 0 | 1 |
| CSF12 | 0 | 1 | 0 | 1 | 0 | 0 | 0 | 0 |
| CSF13 | 0 | 1 | 1 | 0 | 0 | 0 | 0 | 0 |
| CSF14 | 0 | 0 | 0 | 1 | 0 | 0 | 1 | 1 |
| CSF15 | 0 | 1 | 0 | 1 | 1 | 0 | 0 | 1 |
| CSFs/Performance Criteria | Quality Management | Production Volume Linked Productivity | Manufacturing Lead-Time | Product-Related Design and Development Process | Profitability | Brand Value in the Market | Market Share | Customer Satisfaction |
|---|---|---|---|---|---|---|---|---|
| P1 | P2 | P3 | P4 | P5 | P6 | P7 | P8 | |
| CSF1 | Relationship between higher authority and workers leads to good-quality products | Its interaction and continuous interaction motivate the employee to complete the work fast | It promotes employee empowerment and improves levels of job satisfaction leading to a higher market position | A healthy and supportive environment leads to good service, on-time delivery leads to customer satisfaction | ||||
| CSF2 | It increases the efficiency of the production, saving money on materials | Focusing more on waste reduction rather than waste disposal can save more money on materials, packaging, and technology | Promoting minimum wastage, protecting the environment, and promoting green increase its brand value | |||||
| CSF3 | Governments’ standardization and policies help in producing good quality products | Governments provide the guidelines which help to maintain goods and services and increase brand value and promotion of brands | Standardized government products earn customer’s trust | |||||
| CSF4 | Identifying all types of waste, product defects and eliminating them leads to good quality products with no compromise | It increases the flow of information and products with reduced waiting times | All level employees work together to improve or make a new product design | Eliminating non-value-added activity leads to customer satisfaction | ||||
| CSF5 | Determines the flow of information at all levels within the company, thus improving communication, increasing efficiency | Removes duplication of work, more excellent employee performance, faster decisions making, reduces lead time | Promotes better communication and transparency, better after services, leading to satisfied customers | |||||
| CSF6 | They help in finding better options for the raw materials, thus helping in maintaining a low inventory level | It helps in boosting the production and saves the company costs | It shortens the lead time | Good quality goods and services lead to satisfied customers | ||||
| CSF7 | Prevent the employees from making small mistakes, thus prevent from time wastage | Educated workers increase the profit because of their excellent skills and education, leading to better performance | Employees constantly progressing gives the company more value | Educated and skilled employees increase the market value | ||||
| CSF8 | Employees’ performance, commitment, and involvement increase the productivity | It is an influential and essential tool that, when managed well, can lead to an increase in profitability | ||||||
| CSF9 | It helps in reducing cost | Lowers the risk in the supply chain and increases brand value | Sustainability helps in increasing the market value | |||||
| CSF10 | It leads to creativity and innovation that increase the productivity | Good employee, better service, and helpfulness lead to customer satisfaction | ||||||
| CSF11 | Good quality of raw materials leads to good quality products | More options and varieties for the customers make customers happy | ||||||
| CSF12 | Motivated and happy employees help increase the productivity | Employee involvement leads to design improvement/new design | ||||||
| CSF13 | Educated and trained employees work efficiently and perform their daily jobs well | Skill workers reduce the lead time | ||||||
| CSF14 | To understand the customer needs and help them honestly | Loyal customers help save costs and increase profits | Happy customers promote the brand increasing its market value | Enhancing customer satisfaction and building customer relationship | ||||
| CSF15 | Motivated employees can increase productivity by increasing the production and higher quantity of work | Motivated employees create new designs and products with their talents and creativity | Employee commitment and company loyalty lead to profitability |
| Dominance Comparison of CSFs | Performance Indicator(s) Influenced | Dominance Comparison of CSFs | Performance Indicator(s) Influenced |
|---|---|---|---|
| 1 Dominating 2 | P2 | 8 Dominating 11 | P5 |
| 1 Dominating 3 | P1 | 8 Dominating 12 | P2 |
| 1 Dominating 6 | P1, P2, P8 | 9 Dominating 1 | P2, P7 |
| 1 Dominating 11 | P1, P8 | 9 Dominating 2 | P2, P6 |
| 1 Dominating 14 | P7, P8 | 9 Dominating 3 | P6 |
| 1 Dominating 15 | P2, P8 | 9 Dominating 4 | P2, P6 |
| 2 Dominating 3 | P8 | 9 Dominating 5 | P2 |
| 2 Dominating 10 | P2, P8 | 9 Dominating 6 | P2 |
| 2 Dominating 11 | P8 | 9 Dominating 10 | P2 |
| 2 Dominating 14 | P4 | 9 Dominating 14 | P7 |
| 2 Dominating 15 | P2, P5 | 10 Dominating 1 | P2, P8 |
| 3 Dominating 7 | P6 | 10 Dominating 3 | P8 |
| 3 Dominating 11 | P1 | 10 Dominating 6 | P2, P8 |
| 3 Dominating 12 | P8 | 10 Dominating 7 | P2 |
| 3 Dominating 13 | P4 | 10 Dominating 8 | P2 |
| 3 Dominating 15 | P3 | 10 Dominating 13 | P2 |
| 4 Dominating 1 | P1, P2, P8 | 10 Dominating 14 | P8 |
| 4 Dominating 2 | P2 | 11 Dominating 6 | P1, P8 |
| 4 Dominating 3 | P1 | 11 Dominating 7 | P7 |
| 4 Dominating 5 | P2, P8 | 11 Dominating 9 | P7 |
| 4 Dominating 6 | P1, P2, P8 | 11 Dominating 10 | P8 |
| 4 Dominating 7 | P2 | 11 Dominating 12 | P2 |
| 4 Dominating 10 | P2, P8 | 11 Dominating 13 | P2 |
| 4 Dominating 11 | P1, P8 | 11 Dominating14 | P8 |
| 4 Dominating 12 | P2, P4 | 12 Dominating 1 | P8 |
| 4 Dominating 13 | P2 | 12 Dominating 2 | P2 |
| 4 Dominating 15 | P2, P4, P8 | 12 Dominating 5 | P2 |
| 5 Dominating 1 | P2, P8 | 12 Dominating 6 | P2 |
| 5 Dominating 2 | P2 | 12 Dominating 7 | P2 |
| 5 Dominating 3 | P8 | 12 Dominating 9 | P2 |
| 5 Dominating 6 | P2, P3, P8 | 12 Dominating 10 | P2 |
| 5 Dominating 7 | P2 | 12 Dominating 13 | P2 |
| 5 Dominating 10 | P2, P8 | 12 Dominating 14 | P4 |
| 5 Dominating 11 | P8 | 13 Dominating 1 | P2 |
| 5 Dominating 15 | P2, P8 | 13 Dominating 2 | P2 |
| 6 Dominating 2 | P2, P8 | 13 Dominating 5 | P2, P3 |
| 6 Dominating 3 | P1, P2, P8 | 13 Dominating 6 | P2, P4 |
| 6 Dominating 7 | P2 | 13 Dominating 8 | P2 |
| 7 Dominating 1 | P2, P7 | 13 Dominating 9 | P2 |
| 7 Dominating 2 | P2, P5, P6 | 13 Dominating 14 | P4 |
| 7 Dominating 8 | P2 | 14 Dominating 3 | P8 |
| 7 Dominating 9 | P2, P6, P7 | 14 Dominating 4 | P8 |
| 7 Dominating 13 | P2 | 14 Dominating 5 | P8 |
| 7 Dominating 14 | P7 | 14 Dominating 6 | P8 |
| 7 Dominating 15 | P2, P5 | 14 Dominating 8 | P5 |
| 8 Dominating 1 | P2 | 15 Dominating 6 | P2, P8 |
| 8 Dominating 2 | P2 | 15 Dominating 8 | P2, P5 |
| 8 Dominating 3 | P6 | 15 Dominating 9 | P2 |
| 8 Dominating 4 | P2 | 15 Dominating 10 | P2, P8 |
| 8 Dominating 5 | P2 | 15 Dominating 11 | P8 |
| 8 Dominating 6 | P2 | 15 Dominating 12 | P2, P4 |
| 8 Dominating 9 | P2 | 15 Dominating 13 | P2 |
| 15 Dominating 14 | P4, P8 |
| CSF | 1 | 2 | 3 | 4 | 5 | 6 | 7 | 8 | 9 | 10 | 11 | 12 | 13 | 14 | 15 |
|---|---|---|---|---|---|---|---|---|---|---|---|---|---|---|---|
| 1 | P1,P7,P8 | P2,P8 | P1,2,P8 | P1 | P7 | P1,P8 | P1,P7,P8 | P1,P2,P8 | P1,P7,P8 | P1,P2,P7 | P1,P7,P8 | P1,P7,P8 | P1,P2 | P1,P7 | |
| 2 | P2,P6,P5 | P2,P5,P6 | P2,P5,P6 | P2,P5,P6 | P2,P5,P6 | P2,P5,P6 | P6 | P2,P5,P6 | P2,P5,P6 | P2,P5,P6 | P2,P5,P6 | P2,P5,P6 | P2,P5,P6 | P2,P5,P6 | |
| 3 | P1,P5,P6 | P1,P8 | P5,P6 | P1,P5,P6 | P1,P5,P6 | P1,P5,P6 | P1,P6 | P1,P5,P6 | P1,P5,P6 | P1,P5,P6 | P1,P5,P6 | P1,P5,P6 | P1,P5,P6 | P1,P5,P6 | |
| 4 | P8 | P1,P4,P8 | P1,P2,P4,P8 | P3 | P1,P2,P4,P8 | P1,P2,P4,P8 | P1,P2,P4,P8 | P1,P4,P8 | P1,P4 | P2,P4 | P1,P8 | P1,P4,P8 | P1,P2 | P1 | |
| 5 | P2,P3,P8 | P3,P8 | P2,P3,P8 | P2,P8 | P1 | P8 | P3,P8 | P3,P8 | P3 | P2,P3 | P3,P8 | P8 | P2,P3 | P2,P3 | |
| 6 | P1,P2,P3,P8 | P1,P3,P8 | P2,P3,P8 | P3 | P2,P3,P8 | P1,P2,P3,P8 | P1,P3,P8 | P1,P3,P7,P8 | P1,P3 | P2,P3 | P1,P3,P8 | P1,P8 | P1,P2,P3 | P1,P3,P5 | |
| 7 | P5,P6,P7 | P7 | P2,P7 | P5,P6,P7 | P2,P5,P6,P7 | P5,P6,P7 | P6,P7 | P5 | P2,P5,P6,P7 | P2,P5,P6,P7 | P5,P6,P7 | P5,P6,P7 | P5,P6,P7 | P5,P6,P7 | |
| 8 | P2,P5 | P2,P5 | P5 | P5 | P2,P5 | P2,P5 | P2,P5 | P6,P7 | P5 | P2,P5 | P5 | P3 | P2,P5 | P2,P5 | |
| 9 | P2,P6,P7 | P7 | P2,P57 | P2,P6,P7 | P2,P6,P7 | P2,P6,P7 | P2,P6,P7 | P2,P6,P7 | P6,P7,P8 | P2,P6,P7 | P6,P7 | P6,P7 | P2,P6 | P6,P7 | |
| 10 | P2,P8 | P8 | P2,P8 | P2,P8 | P2,P8 | P2,P8 | P2,P8 | P1,P2,P8 | P2 | P2 | P8 | P8 | P2 | P4,P5 | |
| 11 | P1,P8 | P1,P8 | P8 | P1,P8 | P1,P8 | P1,P8 | P1,P8 | P2,P8 | P1,P8 | P1,P8 | P1,P8 | P1,P8 | P1 | P1 | |
| 12 | P2,P4 | P4 | P2,P4 | P2,P4 | P2,P4 | P2,P4 | P2,P4 | P2,P4 | P2,P4 | P2,P4 | P2,P4 | P2,P4 | P2 | P2 | |
| 13 | P2,P3 | P3 | P2,P3 | P2,P3 | P2,P3 | P2,P3 | P2,P3 | P2,P3 | P2,P3 | P2,P3 | P2,P3 | P2,P3 | P2,P3 | P3 | |
| 14 | P4,P7,P8 | P4,P7,P8 | P4,P7,P8 | P4,P7,P8 | P4,P7,P8 | P4,P7,P8 | P4,P7,P8 | P4,P7,P8 | P4,P7,P8 | P4,P7,P8 | P4,P7,P8 | P4,P7,P8 | P4,P7,P8 | P7 | |
| 15 | P2,P4,P5,P8 | P4,P8 | P2,P4,P8 | P2,P4,P5,P8 | P2,P4,P5,P8 | P2,P4,P5,P8 | P2,P4,P5,P8 | P2,P4,P5,P8 | P2,P4,P5,P8 | P2,P4,P5,P8 | P2,P4,P5,P8 | P2,P4,P5,P8 | P2,P4,P5,P8 | P2,P4,P5,P8 |
| CSF | 1 | 2 | 3 | 4 | 5 | 6 | 7 | 8 | 9 | 10 | 11 | 12 | 13 | 14 | 15 | (D) * | (D–B) ** | Rank |
|---|---|---|---|---|---|---|---|---|---|---|---|---|---|---|---|---|---|---|
| 1 | 3 | 2 | 3 | 1 | 1 | 2 | 3 | 3 | 3 | 3 | 3 | 3 | 2 | 2 | 34 | −4 | 8 | |
| 2 | 3 | 3 | 3 | 3 | 3 | 3 | 1 | 3 | 3 | 3 | 3 | 3 | 3 | 3 | 40 | 13 | 2 | |
| 3 | 3 | 2 | 2 | 3 | 3 | 3 | 2 | 3 | 3 | 3 | 3 | 3 | 3 | 3 | 39 | 6 | 4 | |
| 4 | 1 | 3 | 4 | 1 | 4 | 4 | 4 | 3 | 2 | 2 | 2 | 3 | 2 | 1 | 36 | 3 | 6 | |
| 5 | 3 | 2 | 3 | 2 | 1 | 1 | 2 | 2 | 1 | 2 | 2 | 1 | 2 | 2 | 26 | −11 | 12 | |
| 6 | 4 | 3 | 3 | 1 | 3 | 4 | 3 | 4 | 2 | 2 | 3 | 2 | 3 | 3 | 40 | 5 | 5 | |
| 7 | 4 | 1 | 2 | 3 | 4 | 3 | 2 | 1 | 4 | 4 | 3 | 3 | 3 | 3 | 40 | 3 | 6 | |
| 8 | 2 | 2 | 1 | 1 | 2 | 2 | 2 | 2 | 1 | 2 | 1 | 1 | 2 | 2 | 23 | −13 | 14 | |
| 9 | 3 | 1 | 2 | 3 | 3 | 3 | 3 | 3 | 3 | 3 | 2 | 2 | 2 | 2 | 35 | 0 | 7 | |
| 10 | 2 | 1 | 2 | 2 | 2 | 2 | 2 | 3 | 1 | 1 | 1 | 1 | 1 | 2 | 23 | −12 | 13 | |
| 11 | 2 | 2 | 1 | 2 | 3 | 2 | 2 | 2 | 2 | 2 | 2 | 2 | 1 | 1 | 26 | −10 | 11 | |
| 12 | 2 | 1 | 2 | 2 | 2 | 2 | 2 | 2 | 2 | 2 | 2 | 2 | 1 | 1 | 25 | −9 | 10 | |
| 13 | 2 | 1 | 2 | 2 | 3 | 2 | 2 | 2 | 2 | 2 | 2 | 2 | 2 | 1 | 27 | −6 | 9 | |
| 14 | 3 | 3 | 3 | 3 | 3 | 3 | 3 | 3 | 3 | 3 | 3 | 3 | 3 | 1 | 40 | 9 | 3 | |
| 15 | 4 | 2 | 3 | 4 | 4 | 4 | 4 | 4 | 4 | 4 | 4 | 4 | 4 | 4 | 53 | 26 | 1 | |
| (B) *** | 38 | 27 | 33 | 33 | 37 | 35 | 37 | 36 | 35 | 35 | 36 | 34 | 33 | 31 | 27 |
Publisher’s Note: MDPI stays neutral with regard to jurisdictional claims in published maps and institutional affiliations. |
© 2022 by the authors. Licensee MDPI, Basel, Switzerland. This article is an open access article distributed under the terms and conditions of the Creative Commons Attribution (CC BY) license (https://creativecommons.org/licenses/by/4.0/).
Share and Cite
Qureshi, K.M.; Mewada, B.G.; Alghamdi, S.Y.; Almakayeel, N.; Qureshi, M.R.N.; Mansour, M. Accomplishing Sustainability in Manufacturing System for Small and Medium-Sized Enterprises (SMEs) through Lean Implementation. Sustainability 2022, 14, 9732. https://doi.org/10.3390/su14159732
Qureshi KM, Mewada BG, Alghamdi SY, Almakayeel N, Qureshi MRN, Mansour M. Accomplishing Sustainability in Manufacturing System for Small and Medium-Sized Enterprises (SMEs) through Lean Implementation. Sustainability. 2022; 14(15):9732. https://doi.org/10.3390/su14159732
Chicago/Turabian StyleQureshi, Karishma M., Bhavesh. G. Mewada, Saleh Y. Alghamdi, Naif Almakayeel, Mohamed Rafik N. Qureshi, and Mohamed Mansour. 2022. "Accomplishing Sustainability in Manufacturing System for Small and Medium-Sized Enterprises (SMEs) through Lean Implementation" Sustainability 14, no. 15: 9732. https://doi.org/10.3390/su14159732