
Spatial Pattern and Influencing Factors of Rural Settlements in Qinba Mountains, Shaanxi Province, China


1
College of Resource and Environment, Northwest A&F University, Yangling 712100, China
2
The College of Geography and Environmental Science, Henan University, Kaifeng 475004, China
*
Author to whom correspondence should be addressed.
Sustainability 2022, 14(16), 10095; https://doi.org/10.3390/su141610095
Submission received: 27 June 2022
/
Revised: 5 August 2022
/
Accepted: 9 August 2022
/
Published: 15 August 2022
(This article belongs to the Section Sustainable Urban and Rural Development)
Abstract
:Spatial patterns and the influencing determinants of rural settlements are the most important indicators for understanding the constituent structure of rural regional systems. However, there is little knowledge addressing the characteristics from the settlement perspective by realizing the spatial reconstruction and sustainable development of rural settlements. Therefore, in this study, we analyzed the geographical, size, and morphological properties of rural settlement patterns in the Qinba Mountains in southern Shaanxi Province, China, using rural settlement and remote sensing data through spatial measurement index, gradient transects, demographic-economic index, and geodetector analysis. The results show the following: (1) Overall, rural settlements have spatial characteristics of “high-density multi-core clusters (0.8–1.6/km2) and low-density broadly scattered (<0.08/km2)”. There is a significant positive correlation between the scale of rural settlement density and the characteristics of high-value agglomeration. (2) The spatial disparities of morphological traits of settlement shapes are significant. Furthermore, 1840 NP/piece of plain basin landform types provide high-value areas for each settlement feature value, and locations with moderate slopes are best for settlement dispersal. Moreover, rivers, roads, and distance from township centers are all examples of beneficial directivity. There is consistency between the spatial differentiation of rural settlement areas per capita and the distribution of settlement scale. Conversely, the settlement density is inconsistent with the agricultural production value density’s spatial distribution features. (3) The impact of geographical factors on the diversification of settlement characteristics has significant spatial differences. Moreover, natural ecological characteristics such as elevation and landform and the distribution of cultivated land strongly influence the spatial pattern of the study region. Finally, the study findings can be beneficial for land and space planning and rural governments to develop sustainable rural settlements.
1. Introduction
Rural society has been the primary social type of human beings for thousands of years before the industrial revolution. Although global urbanization is rising, about half of the world’s population still live in rural areas. In contrast to the large-scale aggregation of populations in urban systems, the agricultural population often collects in small-scale rural settlements, which are scattered and mosaicked [1]. It is found in the farming substrate and has become a common component of agricultural landscapes [2]. A rural settlement is a complex natural–human landscape system under specific geographical conditions and has a long period of natural, economic, social, and cultural factors. Rural settlement research will improve land-use planning and residential layout, as well as provide insight into the relationships between settlement form, environment, and production [3]. Relevant studies conducted abroad have focused on the following: the relationships between the spatial patterns of rural settlements, rural industries, and settlements in the research area of morphological differences and the rural population; the evolution of rural settlement landscapes [4,5]; the impact of the shape of rural settlements on public services [6,7]; and the behavior of rural settlements, along with the increasing significance of the socialization and reconstruction of rural settlements in rural settlement geography around the world [8,9,10]. In China, recent research has focused on the following aspects: first, the evolution of rural settlements during China’s industrialization and urbanization process [11,12]; then, the system and structure of rural settlements in typical areas (geographical types of rural settlements) [13,14,15]; and, finally, the rural settlement ecology [16]. In response to the government’s recent policy of constructing a new socialist countryside, studies on rural communities, rural urbanization, the hollowing out of rural settlements, and the optimized regulation of rural settlements have become increasingly important [17,18].
The social relationship between urban and rural areas has changed dramatically owing to global industrialization, urbanization, and population increase, with variances in the layout of rural communities becoming a regular phenomenon as a result of rapid urbanization [19,20]. For a long time, developed countries and areas of the world have paid attention to rural settlements and made progress in their studies in this field. The description of village distribution and original shape has been turned into quantitative analysis, the behavioral revolution, and cultural transformation in terms of methodologies [21]. GIS technology is used to investigate the landscape types and land use patterns of rural settlements, while landscape ecology and kernel density analysis are frequently used in rural settlements [22]. The international community has long been worried about changes in the size and quantity of rural communities in terms of content. For example, researchers in Central and Eastern Europe and the United States have studied and analyzed rural communities and discovered that the size of rural settlements is typically increasing, with some villages progressively expanding into significant settlements [23,24,25,26,27,28].
Consequently, the temporal and spatial pattern, landscape characteristics, and evolution mechanism of rural settlements are key issues in rural geography [19]. The spatial pattern of rural settlements in China has significant regional differentiation and resource dependence owing to the complexity of the natural environment and the diversity of the evolution process [29]. Revealing the spatial pattern differentiation characteristics of rural settlements and their driving factors is significant for cognizing the element structure of the rural regional system and realizing the spatial reconstruction of rural settlements [30].
The spatial pattern of rural settlements is affected by geographical and socio-economic factors [31]. Moreover, the focus and influence of various factors vary with basic factors such as geographic conditions [32]. The mountainous area of China accounts for two-thirds of the country’s total area, and rural settlements are the main form of settlement for the mountain population. Owing to the influence of natural attributes such as energy gradients, surface fragmentation, and spatial heterogeneity in mountainous areas, the effect of geographical factors on rural settlements in mountainous areas has an important role [33], laying the basic historical pattern of the spatial distribution of mountainous settlements, which is expressed as topography, roads, and rivers, to name a few. Those more closely related to the spatial distribution of settlements are interactively coupled with factors such as population and economy [34], making the temporal and spatial characteristics of rural settlements and the relationship between people and land in mountainous areas far more complex than those in plain areas. For a long time, because of such factors as complex natural ecology and social and economic marginalization, research on mountain settlements has lagged far behind densely populated plain places and economically developed areas [35]. It can be seen that socioeconomic, cultural and historical, and physical factors are all essential to consider when analyzing the distribution of the rural settlement on large regional scales from the macro scale.
Therefore, it is necessary to study the spatial pattern and driving factors of rural settlements for their protection and development in the future. The study on the spatial distribution of rural settlements, in particular, can serve as a scientific reference for future spatial planning and management of rural settlements. Rural settlements preserve the essence of traditional culture, which is required for rural revitalization. Nevertheless, in recent decades, relentless urban expansion has resulted in the rapid decrease, and even elimination, of these rural settlements. For the conservation and development of rural settlements, it is vital to analyze the spatial pattern and affecting elements. The consideration of the determining factors of rural settlements can aid in the excavation and development of more rural settlements. Rural settlement protection is important not only for preserving the diversity of Chinese rural settlements, but also for contributing to the rehabilitation of rural areas around the world. It can, in particular, make significant contributions to expanding exchanges and mutual learning between diverse civilizations in the countries.
This study mainly focuses on the Qinba mountainous area in Shaanxi Province as the research area. This study has two objectives: to explore the spatial patterns of rural settlements in Qinba mountains and to check the influence of the factors that are responsible for the distribution of rural settlements there. Therefore, the authors analyzed rural settlement data to explore the spatial pattern differentiation and its influencing factors of rural settlements in the Qinba mountainous area using GIS spatial analysis, the landscape pattern index method, and geographic detector analysis. This can provide a theoretical basis for the optimization direction and reasonable layout of typical mountainous rural settlements and lay a foundation for realizing rural revitalization, consolidating, and expanding the results for rural planning and community rebuilding, especially in less-developed areas.
2. Study Area
Overview of the Study Area
The Qinba mountainous area is located in central China, spanning five provinces and one city in Gansu, Sichuan, Shaanxi, Chongqing, Henan, and Hubei. It is a transitional area between the humanities, geography, and climate of China. The research area is the Qinba mountainous area in Shaanxi Province (Figure 1). The area’s main body is located in southern Shaanxi (31°40′–34°23′ N, 105°30′–111°2′ E). There are 31 counties/districts, 459 towns, and villages, with a total area of 75,900 km2, including the three cities of Shangluo, Ankang, and Hanzhong, and the three counties of Zhouzhi, Taibai, and Fengxian. In terms of the natural environment, the entire area is located on the northern edge of the western subtropical zone, with an average annual precipitation of 610–1200 mm and an average annual temperature of 7.5–14.2 °C. The terrain is high in the north and south and low in the middle, forming a “two mountains and one river” pattern. There is a great disparity, and the types of landforms are diverse. The predominant land-use type is mainly forest land, followed by cultivated land. There are major rivers, including the Han River, Jialing River, and Dan River, in the area, all of which have abundant water resources. The registered population of the study area was 10.142 million as of the end of 2020, with the rural population accounting for 66.89%. The regional GDP is 258.699 billion yuan, and the per capita GDP is 29,300 yuan [36], which is affected by natural and geographical conditions such as landforms and climate. The research area is dominated by the planting structure of “food crops and traditional cash crops” and traditional breeding. The regional economic development and industrial industries are relatively backward, and it is one of the Chinese contiguous poverty-stricken areas.
3. Materials and Methods
The data of rural settlements, rural settlement area per capita, and gross agricultural production density were analyzed using GIS spatial analysis. To improve the study’s accuracy, in Figure 2 and Figure 3, the fishnet analysis method was used by spatial analysis, and the net margin of the net cells was 5000 m. The landscape shape index (LSI) was quantitatively analyzed with the help of Fragstats 4.2 software, Fragstast was developed in 1995 by Dr. McGarigal and Barbara Marks of Oregon State University, Corvallis, OR, USA. Then, a quantitative analysis of the spatial pattern of rural settlements was conducted using the spatial measurement index. Finally, the influence of influencing factors on the distribution of rural settlements was analyzed by the geographic detector model.
3.1. Data Source and Processing
3.1.1. Rural Settlement Data
Based on 2020 Google Earth remote sensing imagery with 0.12 m spatial resolution, the authors used visual interpretation to obtain vector data of rural settlements, cropland, road, and rivers. The GIS spatial analysis “feature to point” function was applied to obtain the point data of rural residential patches in order to study the spatial distribution characteristics of rural settlements.
3.1.2. Geomorphic Slope and Location Data
The geomorphic type data were collected from “Geography Chronicles” by the Shaanxi Provincial Chronicles. There are 16 geomorphic subregions in the study area according to the classification of Geography Chronicles [37], which are merged and vectorized into three geomorphic types: plain basin, low hills, and middle and high mountains. The elevation data come from the geospatial data cloud (http://www.gscloud.cn/, accessed on 24 July 2021), with a resolution of 30 m, and the slope data were extracted by elevation, combined with the actual situation of the study area and topographic features, at equal intervals of 600 m in elevation, with a slope of 5°, and so forth. The intervals were divided into six categories. The central point data of towns and villages were obtained by picking up the geographic coordinates of the government location, and the shortest distances from the rural settlements to rivers, roads, and town centers were calculated. A 3 km radius was used for multilevel buffer analysis.
3.1.3. Demographic and Economic Data
Demographic (population) and economic (agricultural population and agricultural GDP) data were collected from the Statistical Yearbook of each county/district in Shaanxi Province and the National Economic and Social Economic Development Bulletin.
3.2. Average Nearest Neighbor Index
The average nearest neighbor index (ANN) analysis was the primary method to verify the uniformity of the geographical distribution of rural settlements based on the ratio of the observed value of the average distance between the nearest neighbors and the expected value of the random distribution of rural settlements [38]. The Z value of this index was processed to measure the significance of spatial agglomeration or dispersion. The formula is as follows:
In the above formula, is the average value observed at the nearest neighbors, is the expected value of the random distribution of settlements, is the number of settlements, is the distance between the the settlement and its neighbors, is the density of the settlement, is the total area of the settlement, and is the average distance standard error. ANN = 1 is a random distribution state, and ANN = 0 is a complete agglomeration distribution. When Z > 2.58 or Z < −2.58, it means that the Z value is statistically significant at a 99% confidence level. On the contrary, there is no significant difference between the observed value and the expected value.
3.3. Spatial Measurement Index
3.3.1. Spatial “Clustering” Detection
High/low clustering (Getis-Ord General G) was used to measure the clustering degree of global spatial settlements tending to high and low values [39]. The formula is as follows:
In the above formula, is the distance between settlements; is the spatial weight; and and are the regional observation values of and respectively; for standardization , and are the expectation and variance of , respectively. If the value of is positive and statistically significant, and the observed value of is greater than the expected value, the regional rural settlements will show a high-value agglomeration; otherwise, they will show a low-value agglomeration.
3.3.2. Spatial “Hot Spot” Analysis
Hot spot analysis (Getis-Ord Gi) identifies statistically significant hot and cold spots by giving a set of weighted elements [39]. The formula is as follows:
In the formula above, the parameter meaning is the same as in Formula (3). If the value is positive and statistically significant, it indicates that the surrounding value of the area is higher than the average value and belongs to the hot spot area with high-value clusters; otherwise, it belongs to the cold spot area with low-value clusters.
3.4. Gradient Transect Analysis
Characteristic heterogeneity was ensured by selecting planar squares along a specific direction. This study chooses two south–north transects I and II from west to east, and two east–west transects III and IV from south to north based on the regional geomorphological characteristics and settlement spatial characteristics. The designed transects cover all of the villages as much as possible. A settlement was selected according to the actual situation in the study area and existing research [8]; each sample is set as a square with a side length of 15 km (Figure 1), with 23 numbers for the south–north sample I and II (total length 345 km) and the east–west sample. There are 14 numbers with III and IV (total length 210 km). the landscape shape index (LSI) reflects the complexity of the settlement shape. The larger the value, the more complicated the shape [40]. This index is selected, and the spatial difference of the settlement shape is quantitatively analyzed with the help of Fragstats 4.2 software.
3.5. Demographic-Economic Index Analysis
3.5.1. Rural Settlement Area Per Capita
Rural settlement area per capita (PCRA) presents the interaction between the agricultural population and settlements in rural areas and the land usage of rural settlements. It also shows the relationship between people and land in the countryside [41]. The formula is as follows:
It can be seen that RA is the area of rural settlements, and RP is the rural population. The higher the value of the rural settlement area per capita, the smaller the agricultural population in the region and the higher the level of rural social development. On the other hand, the opposite case leads to a lower level of social development in the area.
3.5.2. Gross Agricultural Production Density
The density of gross agricultural production (GAPD) is an important indicator of the level of economic development in rural areas, and it is calculated by dividing the total agricultural production value by the average rural settlement area to reflect differences in the economic development level of rural settlements [42]; the formula is as follows:
As can be seen from the calculation, AGDP represents the total agricultural output value, while RA denotes the area of rural settlements. The higher the level of agricultural development in the rural region, the smaller the value of agricultural production density and, vice versa, the lower the level of agricultural economic development in the area.
3.6. Impact Factor Analysis
3.6.1. Buffer Analysis
Rivers, road line elements, and urban center point elements were used for multilevel buffer analysis. It is used to calculate the spatial distribution characteristics of rural settlements in different districts and analyze the influencing factors of differences in spatial patterns. According to the research requirements, the buffer radius is set to form a certain range and multiple levels of polygon entities around geographic elements. The same buffer attribute value can be integrated into the information expansion method [40]. For a given geographic feature A, its buffer zone can be defined as follows:
In this formula, is the total distance of the multi-level buffer zone; is the set distance or radius; and is the number of levels of the multi-level buffer zone.
3.6.2. Geodetector Analysis
Geodetector is a set of statistical methods for detecting spatial differentiation and revealing the factors influencing it, including risk detection, factor detection, ecological detection, and interactive detection [43]. This paper uses factor detection to determine whether a specific geographic location factor is the main reason for rural settlements’ differentiation. The formula is as follows:
Clearly, and are the number of regional samples and variance; is the number of partitions; and is the number of samples in the ( = 1, 2, …, )-level region. The value range of Q is [0,1], and the degree of influence of each factor can be judged according to the Q value. The larger the Q value, the greater the impact on the differentiation of rural settlement characteristics.
4. Results
4.1. Spatial Characteristics of Rural Settlements
Being the space for rural population gathering, rural settlements have great differences in the spatial distribution characteristics of agricultural production and life, as there are great differences in natural resources, natural environment, and social and economic development within the study area [44]. The ANN index and density analysis were used to reveal the spatial characteristics of settlements from two aspects based on rural settlements’ data: the spatial distribution state and the density distribution (Figure 2). The results show that the rural settlements in Shaanxi’s Qinba Mountains are of the agglomeration distribution pattern. The average nearest neighbor index is 0.48, with a p-value of <0.001, and standardized Z value of −65.90, significantly less than −2.58. This indicates that regional agglomeration is significant, with a probability of random occurrence only 1% or less. The high-density core areas (0.38–0.68/km2) of rural settlements are located in the plain basin area in the middle and east of Hanzhong, the northern part of Zhouzhi County, Hantai District, the central part of Chenggu County, and the southeast of Shangzhou District. This is because of the alluvial formation of the Han River and its tributaries the Hanzhong Basin and Xixiang Basin in the region, as well as the flat terrain, rich water resources, being close to the administrative center and economic center of the city, convenient transportation, and being the most densely distributed settlements. The higher density area (0.217–0.379/km2) surrounds the high-density core area distributed in sequence; medium-density areas (0.105–0.216/km2) are scattered in bands or clumps in the eastern and western parts of the study area. The topography of the area is obviously undulating, and the valleys are crisscrossed. The valleys often form flat and open valley bottoms, which is called “dam land” by the local people. Settlements are mostly distributed in these wide valley dam land. Low-density areas (<0.037/km2) are widely distributed in the study area within the Qinling Mountains and Daba Mountains at the northern and southern border. Because of the troubles brought by steep mountains, steep terrain, inconvenient transportation, frequent landslides, debris flows, and other geological disasters, there is only a sparse population distribution along the roads, which accounts for 82.44%. The overall density of rural settlements in the study area presents the spatial characteristics of “high-density multicore agglomeration, low-density widely distributed”. Ren et al. also identified that, in rural settlements, the topographic gradient differentiation of the spatial pattern was distinct [44].
4.2. Characteristics of the Scale of Rural Settlements
Hot spot analysis was used to reveal the characteristics of the scale of rural settlements using high/low clustering through the settlement area. The results show that the characteristics of high-value agglomeration of rural settlements in the Qinba Mountains of Shaanxi are significant. According to the analysis results of the “hot spots” displayed on the grid (Figure 3), the three clusters in the northern part of Zhouzhi County, the junction of Hantai District and Mian County, the middle part of Chengdu County, and the southwestern part of Yang County are the “hot spots”, with a high value and high concentration. The rest are mostly scattered; low-value and low-poly “cold spots” are widely distributed throughout the study area; while second-high and second-low-value areas are mainly distributed around high-value and low-value areas. The study area’s spatial distribution of rural settlement scale and density is positively correlated and consistent, with “high-density large-scale agglomeration distribution, low-density small-scale agglomeration distribution” characteristics as the overall scale distribution. Similar to this finding, Luo et al. also indicated that spatial agglomeration characteristics of rural settlements in poor mountainous areas of southwest China have high-density, large-scale agglomeration distribution and low-density, small-scale agglomeration distribution characteristics [45].
4.3. Shape Characteristics of Rural Settlements
The landscape shape index (LSI) was used to analyze the shape characteristics of rural settlements in the Qinba Mountains of Shaanxi based on gradient transects. The results are as follows: the LSI values of the south–north transect I and II are between 2.4 and 21.3, with significant fluctuations as shown in Figure 4a. Figure 4b shows that the east–west transects III and IV have LSI values ranging from 3.3 to 33.1, slightly larger than the south–north transects. In terms of spatial distribution (Figure 1), the high-value areas of LSI in the transects I, II, III, and IV are the same as the spatial agglomeration and high-density core areas in Figure 2 and Figure 3. The shape characteristics of large-scale densely distributed rural settlements are more complicated. Similar to this finding, previous studies in the Svetislav Popović also reported that, in terms of the shape characteristics of rural settlements, the LSI value is higher and the spatial agglomeration is greater [46].
4.4. Topographic and Location Factor Characteristics of Rural Settlements
The statistical results of the different topography and location factors of Qinba Mountains’ rural settlements are shown in Table 1. The landform of the plains and basins is the dominant area for rural settlements, accounting for 62.39% of the area, with an average area of 0.17 km2 and a density of 0.45/km2. This type of settlement presents large-scale and high-density characteristics; low-mountain hilly areas and middle-high-mountain areas are mainly small-scale and scattered. This area has 2505 rural settlements accounting for only 37.61% of the total area, and the density and average area are lower than the overall level. The low mountain and hilly areas have a lower LSI value than other landform types, and the shape of the settlement is relatively simple. The gentle slope is a suitable area for rural settlements. In terms of quantity, more than half of the settlements are distributed in the <5° slope range. When the slope is >25°, the number of settlements only accounts for 7.2% of the total. However, more than 80% of the settlements are distributed in the <10° slope area. The density, average area, and shape index of rural settlements show a decreasing trend with the increasing slope, and the measured values have an upward trend in the slope range of 15–20°. The reason is that, in the mountainous of the study area, most of the cultivated land and settlements are distributed in the plains basin, wide valley dam land, and hilly areas, with a relatively gentle slope and abundant water resources, which is conducive to agricultural construction. With the increase in slope, the probability of geological disasters such as collapse, landslide, debris flow, and soil erosion increases; the area of arable land suitable for farming decreases; and the number of rural settlements also decreases. The study of Veronica et al. in the Apuseni Mountains has also indicated that the rural settlements in the basin and plateau transects show the trend of spatial expansion to low-elevation and low-slope areas over time [47].
We used equal 3 km intervals in the GIS buffer analysis for a five-level Qinba mountainous area rural settlement road, river buffer distance, and urban center buffer area. The results show that, within the 3 km road buffer distance, as the road buffer distance increases, the number of rural settlements (NP) gradually decreases. Moreover, NP within the 12 km buffer distance is inversely proportional to the road distance. The closer the distance to the road, the more obvious the agglomeration feature. Moreover, when the buffer distance is >12 km, NP and LSI gradually increase with the increase in the road buffer distance. They decrease and slightly increase when >12 km, indicating that the impact of roads on the average area of rural settlements mean patch size (MPS) and landscape shape index (LSI) of the settlement is reduced after a certain range. However, within the buffer distance of 6 km from the river, as the distance from the river increases, the NP gradually decreases and reaches the minimum value at >12 km, indicating that the settlements in the Qinba mountainous area present near-water source distribution characteristics. Moreover, MPS shows a decreasing trend with the increase in river distance, indicating that the settlement density and scale characteristics are inversely proportional to the river distance. In contrast, the area close to the water source shows high-density and large-scale high agglomeration characteristics, while the area far away from the water source shows low-density and small-scale low-density agglomeration characteristics. However, MSI fluctuates with the distance, indicating that there is no obvious increasing or decreasing relationship between settlement morphology and river distance. Thus, the range of 0–6 km from the center of the town is the main area of settlement distribution. Among them, there are more than 2000 NPs in the 0–3 km buffer zone, which is a high-density area (Figure 2), with an MPS of 0.13 and an LSI of more than 48, indicating the buffers of the settlements in this area present comprehensive spatial characteristics of high-density, large-scale, and complex shapes. As the number of buffer levels in the urban center increases, NP, MPS, and LSI show a decreasing trend, and settlements tend to cluster closer to the urban center as a whole. Chen’s study also showed that rural settlements in Baota District were located near the county seat and township seat, near a river, farmland, and county-level road, on sunny slopes [48].
4.5. Demographic and Economic Characteristics of Rural Settlements
According to the per capita settlement area (PCRA), it is an important measure of the magnitude of rural communities and the social development index [49]. It may properly depict the settlements’ growth trend and future characteristics. The PCRA was calculated using a township as a unit (Figure 5), and the results are as follows: the number of townships with PCRA > 30 m2/person in Hanzhong, Ankang, and Shangluo is 9, 1, and 0, respectively, accounting for 5%, 1%, and 0%, respectively, of all townships in each metropolitan area; the PCRA is 25–30 m2/person. Moreover, the PCRA is 20–25 m2/person, and the number of townships is 13, 3, and 6, respectively, making up 3 percent, 5 percent, and 5 percent, respectively, of the total number of townships in each urban area. Meanwhile, in 7%, 3%, and 7% of the total districts and towns, respectively, the PCRA is 15–20 m2/person. Similarly, the total number of townships in each urban area is 10, 7, and 5, respectively, occupying 6% of the total number of towns, and PCRA is less than 15 m2/person. However, there are 142, 93, and 71 townships, respectively, in each urban region, constituting 79 percent, 85 percent, and 82 percent of townships, respectively. Hanzhong city has the biggest PCRA, whereas Shangluo city has the smallest owing to settlements’ density and scale and spatial dispersion trend. The result is aligned with Dax, T., who reported that the distribution of the population plays a significant role in the formation and development of rural settlements’ distribution. The index of rural settlements and nearest neighbor distance among rural settlements points were high [50].
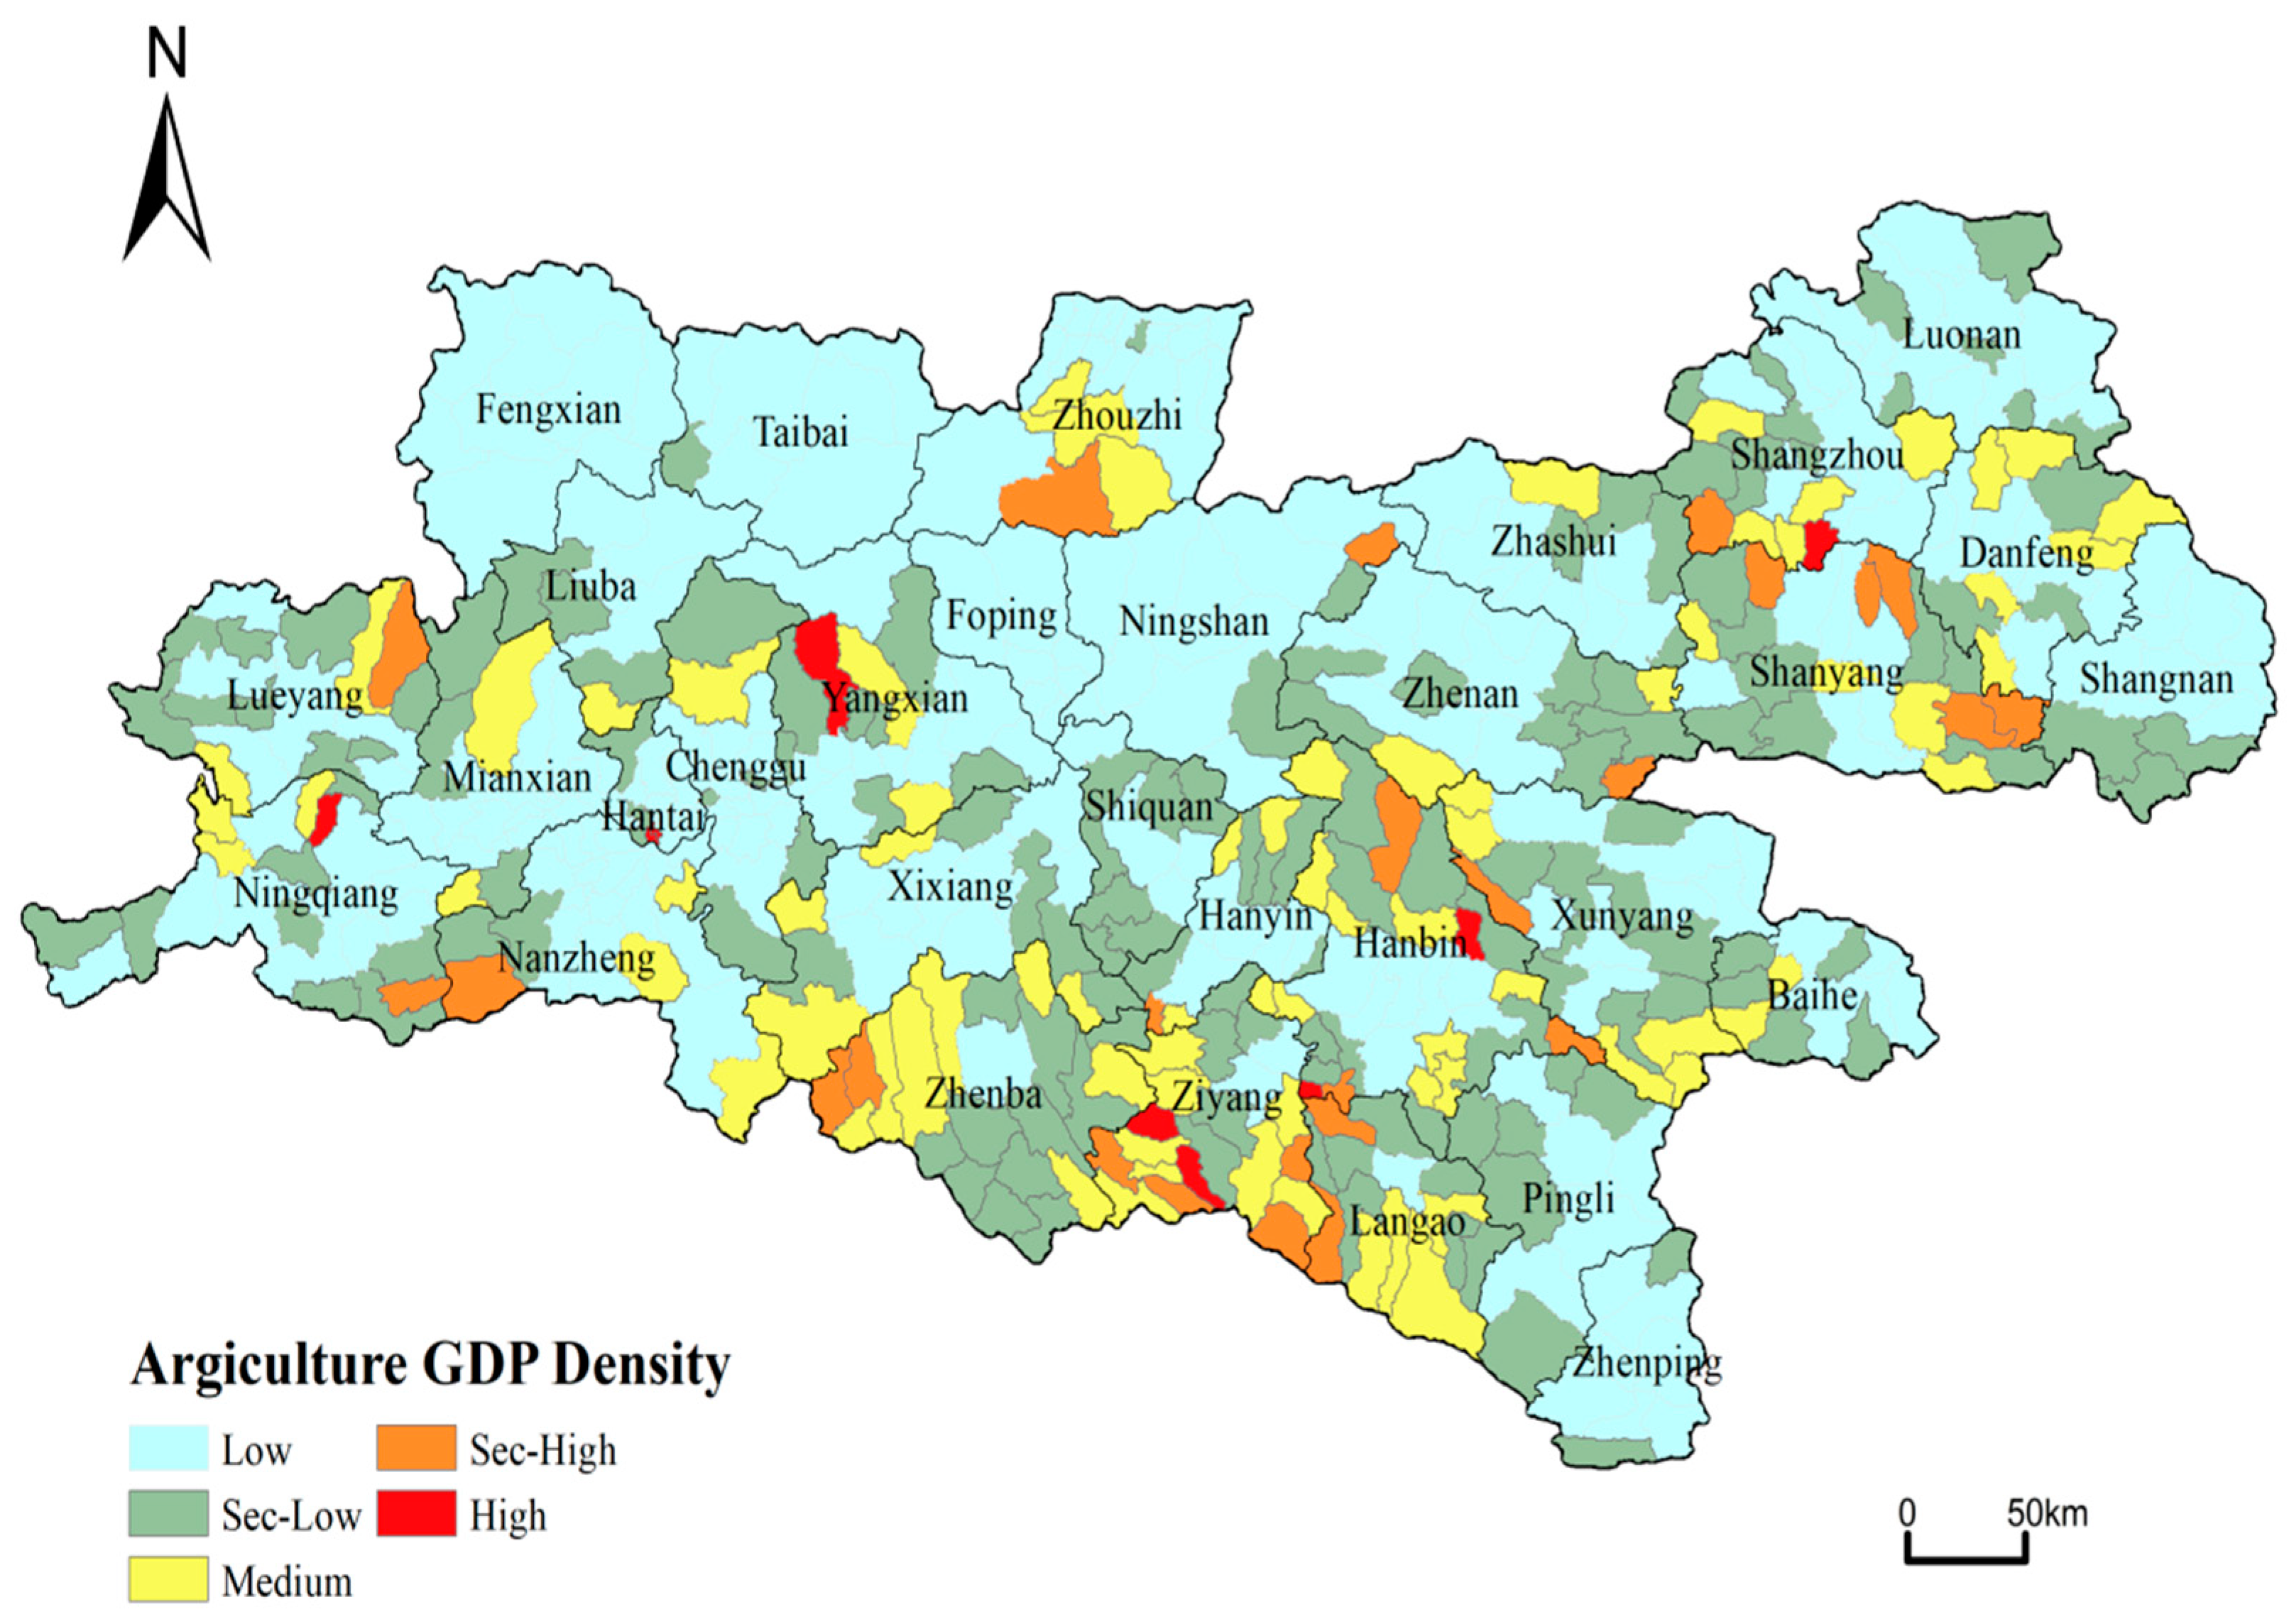
As rural settlements are based on agricultural economy and agricultural production, there are often more agricultural settlements near the agglomeration of agricultural economy and production, so as to facilitate agricultural production. The gross agriculture product density (GAPD) indicates rural economic growth in terms of spatial differences [43]. According to the density of the agricultural production value in the study area of the township statistics (Figure 6), the distribution findings are low-density areas (2 million yuan/km2), second-low-density areas (2–5 million yuan/km2), medium-density areas (5–10 million yuan/km2), sub-high-density areas (10–15 million yuan/km2), and high-density areas (>15 million yuan/km2). Hanzhong city’s low-density districts accounted for 65% of urban townships, while the second-low-density region made up 23%, the medium-density area occupied 7%, and the second-high-density area constituted 3%. The high-density area accounted for 2%. Moreover, the percentage of the density area was 21% of total urban townships, while those of the second-low-density, the medium-density area, the second-high-density area, and the high-density area were 43%, 20%, 12%, and 4%, correspondingly. However, the number of low-density areas in Shangluo city accounted for 43%. Similarly, the second-low-density area accounted for 38% of the total number of townships in the urban area, while the medium-density area, the second-high-density area, and the high-density area made up 16%, 5%, and 3%, respectively. This demonstrates that, contrary to the hot spots of settlement density and size, the GAPD distribution is Shangluo city > Ankang city > Hanzhong city. The study of Qu et al. in rural settlements of Qingdao and Yantai also indicated that, in terms of the agricultural production function, high-value areas were mainly located in the special crop production belt [16].
4.6. Analysis of the Influence of Rural Settlement Factors
Geographic factors and population economic factors were analyzed using the geographic detector model to determine the influence of the above factors on settlements’ spatial distribution characteristics. The results are shown in Table 2.
Many factors contribute to the spatial distribution characteristics of rural settlements. However, the influence of various factors on the characteristics of the settlements in the study area varies significantly (all passed the p < 0.001 significance test). Table 2 shows that the influence of various factors on the spatial differentiation of rural settlements in the Qinba Mountains of southern Shaanxi varies from large to small. The following is the sequence: landform (0.613) > slope (0.393) > total agricultural output value (0.285) > distance from main roads (0.202) > agricultural population (0.175) > distance from urban centers (0.169) > distance from major rivers (0.061). In terms of geographic factors, topographical factors have the most significant impact on the spatial pattern of settlements. However, the distance from the main road has a lower impact on the settlement. In addition, the distance from the town center has a weaker impact. Similarly, the distance from the main river has a significantly lower p-value. According to the comparison of population economic factors, the spatial pattern characteristics of the study area are more affected by the level of economic development than the population factor. Jones, E.E. also reported that rural settlements’ distribution is affected by traditional factors as well as economic development. Elevation and the condition of water resources are basic natural factors that also affect the distribution of rural settlements [51]. Amanda Hoffman-Hall also identified that rural settlements are denser in plains, whereas they are sparser in mountainous areas. The majority of the villages are scattered throughout areas of the countryside that are rich in water and grass or in places that have convenient transportation [52]. Likewise, Almisano, G.O. et al. identified that developed areas with non-agricultural industries have increased in terms of population concentration, and villages have conglomerated into larger settlements [53]. E. Shcherbina also indicated that, in traditional economic conditions, the leading factors that affect spatial distribution are the range of activities and social ties between rural settlements [54].
5. Discussion
5.1. Analysis of the Characteristics of the Spatial Pattern of the Settlements
The findings of this study revealed a consistent spatial distribution of the scale and density of rural settlements in the Qinba Mountains of southern Shaanxi; high density corresponds to large-scale areas, and low density corresponds to small-scale areas. The geographical environment to which the study area belongs is the mountainous landform type. The plain basin area was the main type of distribution of rural settlements. This is because low altitude areas are convenient for farmers to live and engage in production activities [55]. The area is flat, with superior water and soil conditions and strong livability. The spatial distribution of settlements presents agglomeration characteristics, such as the Weihe Plain in the northern part of Zhouzhi County. The Hanzhong-Ankang Basin in the central part of the area and the settlement scale is large and has a high density. This is because rural settlements’ density is higher and the process of urbanization is more rapid in densely populated areas. However, the ecological environment in this area is fragile [56]. The river valleys are mostly “V”-shaped, the altitude is high, the slope is large, the farming conditions are poor, and the rural settlements are mostly scattered, resulting in low-density and small-scale consistency in the spatial distribution. The study area is a region with a type of mountainous landform that is part of the natural environment. High-density and extensive rural settlements have certain economic benefits in terms of social economy. Regional cultivated land resources are significant natural resources that represent the fundamental state of regional social and economic development, as well as the compatibility between cultivated land resources and landforms. Arable land resources, being in line with the primary direction of agricultural production, can aid in the growth of the rural economy [56]. If the rate of regional urbanization is high, the combination of labor, capital, technology, and other factors may be used to propel the growth of nearby settlements, creating a high-density and expansive space. As small rural communities lack the aforementioned benefits, they exhibit low density [47]. Moreover, high-density and large-scale rural settlements have certain economic advantages due to their geographic location. The regional arable land resources are abundant, which are consistent with the main agricultural production direction. Therefore, rural economic development could be promoted with the help of the regional urbanization rate, labor, capital, and technology, which is consistent with the research results of Zhou et al. [57].
The convergence of factors can drive the development of surrounding settlements, resulting in high-density and large-scale spatial characteristics. Because small-scale rural settlements lack the above advantages, they have low-density characteristics. The study area’s settlement shape shows higher high-density and large-scale LSI values. This is because the area is mostly flat, free of the terrain’s constraints. The spatial distribution pattern presents randomness and dispersion and is distributed in irregular shapes. Furthermore, the area’s multilevel rivers converge, and the roads at all levels are interlaced, resulting in a complicated shape, which is consistent with the research results of Qu Yanbo et al. [56].
5.2. Analysis of the Influence of the Spatial Pattern
The characteristic differentiation of rural settlements has obvious location advantages. With the rapid progress of urbanization, the differentiation and location advantage of regional socio-economic development emerged gradually [58]. The distance from major roads had the greatest impact. This is because the road traffic infrastructure serves as a spatial material carrier as well as a link between regions, between cities, and between cities and villages [59]. Transportation development has promoted the expansion of rural settlement space and changed the external form of the countryside. It is also the primary support power for expanding modern rural space [60]. Furthermore, the greater the distance from the road, the fewer the settlement patches and the lower the settlement density. In contrast, the closer the distance to the road, the higher the concentration of residential areas, which was consistent with the research results of Ma, X et al. [58]. As a medium and channel for internal communication and external communication of rural settlements, roads are conducive to the facilitation of production and life internally, and the input of high-quality production factors externally, thereby promoting the openness and activity of rural endogenous space, as well as externally beneficial food crops. The export of similar agricultural and sideline products and communication between rural internal personnel and the outside world occurs. The closer to the road, the higher the number and the greater the area of rural settlements [44]; at the same time, however, the road will inevitably have a cutting effect on the face-to-face settlements, resulting in the tendency of rural settlements to be fragmented and complicated in spatial form; for example, it will weaken the status of rural settlements without traffic stations and make them more marginalized [35], under the influence of both positive and negative aspects. Located in the Qinba Mountains, southern Shaanxi has a rugged terrain and great spatial barriers to social and economic exchanges, which increase the cost of social and economic exchanges between urban and rural areas and between regions. Rural social and economic development is more dependent on the transportation network. For the road network in southern Shaanxi, the effect of changes on the spatial distribution of rural areas is more obvious than that in other regions [51]. Consequently, the internal structure of the settlement is constantly changing as a result of road factors, and the settlement form is constantly updated as a result.
The frequent flow areas of people, logistics and information flow, cities and towns, exchanges, and cooperation between cities and towns have promoted the rapid development of the core city economy and population [24]. In the rural area, towns and villages serve as central places with regional functions such as market, science and education, culture and health, consumption, and public services. They have a greater impact on rural economic and social development, which impacts the evolution and development of rural settlement space [52]. The countryside in the study area adjacent to the central city can enjoy the radiation drive and trickle-down effect from the city [13]. There is a positive correlation between rural settlements and the distance from the township center. Villages in the suburbs have more opportunities for development [12]. This is because towns and villages have a strong radiation effect on rural settlements. Because of the obvious economic advantages of township centers, they have a “gravitational” effect on neighboring rural settlements and can attract manpower, material, financial resources, and so forth from surrounding areas. There is a fact that, the closer to the township center, the larger the size and the greater the number of settlements, which is consistent with the findings of Marcelo Scolari Gosch et al. [59].
The agricultural production structure in the Qinba Mountains is determined by its dependence on water sources, as rivers play an important role in the formation of settlements. In the study area, the irrigation water system is dense, the rivers are vertical and horizontal, and the distribution of settlements has significant “hydrophilicity”. It not only plays a pivotal role in agricultural irrigation and agricultural development, but also provides important support for the life, production, and ecological functions of settlements, and is an important factor affecting the distribution of settlements [22]. Dense villages are frequently formed around large river basins in an agricultural society. In addition to the production structure, the regional population and material flow caused by convenient shipping conditions also affect the formation and distribution of villages [42]. Furthermore, Feng, R et al. [60] pointed out that “living by water” is a significant feature of the spatial distribution of settlements in the Qinba mountainous area of southern Shaanxi, and rivers are necessary for settlement site selection. However, it can be seen from Table 2 that the influence of rivers on the settlement morphology is relatively low, which is because of the low degree of urbanization and industrialization in the early stages of urbanization and industrialization. The development of rural settlements is less dependent on natural conditions in the later stages of rapid industrialization and urbanization, which is consistent with the findings of Li Ning et al. [61].
Settlement density and scale hotspot spatial distribution trends are consistent with the PCRA in the Qinba mountainous area. This is because the distribution of the population plays a significant role in the formation and development of rural settlements’ distribution [46,47]. The key elements of rural settlement development lie in population and industry. Population quantity and population structure are the supporting elements of rural labor force [53]; agricultural labor force is the core element of the rural human–land relationship, but in China, it is limited by the dual urban–rural household registration and land system, education, and medical systems [29], thus more farmers choose part-time production methods [34], which reduces agricultural labor productivity and hinders the process of agricultural modernization and the transformation of industrial structure. For the study area, because most of the areas are located in mountainous areas and in areas with inconvenient traffic on the edge of towns, such as Zhenping, Zhenba, and other counties, the problems of population aging and population loss are serious, and the population structure is unbalanced, resulting in extremely low population density. In addition, the local industrial development is still in its infancy, and the village lacks technical talents and capital resources, which means its development is far behind the areas with a higher level of economic development such as the distance from the urban area. The population’s massive concentration and rapid growth will result in villages’ spatial formation and spread. As the population increases, it will inevitably increase the demand for housing and food. Farmers build new houses to meet the housing demand, expanding the area of arable land to meet the food demand [43]. Still, they will also build some production buildings, resulting in the development of rural settlements [42]. The settlement area is primarily due to an increase in the agricultural population. Later, as a large proportion of the agricultural population moved to urban areas and the intensity of the retreat from rural areas increased, the agricultural population rapidly declined, which is consistent with the research results of Li, F et al. [12].
In the Qinba Mountains, the distribution of a GAPD is inversely proportional to the settlement density and scale of the hot spots. Gross agricultural product is an important indicator of the level of economic development in a region, which can provide capital accumulation for regional reproduction, thereby driving the transformation and development of regional and rural areas. Regions with better natural resource endowments and geographical location are favorable for the development of the agricultural economy, while regions with relatively poor conditions tend to have lower levels of agricultural economic development and urbanization [45]. In recent years, with the improvement in agricultural technology and the support of agricultural policies, the agricultural economy in the study area has grown significantly. For example, the surrounding villages of Hanzhong City, Ankang City, and Shangluo City are the core areas of agricultural economic growth and areas with high population density in the study area, with a high development level of urbanization and agricultural modernization, and with great changes in population and industrial structure [30], creating favorable conditions for agricultural economic growth and labor transfer. The overall characteristics of the agricultural economic development level’s spatial distribution pattern are multi-core, imbalanced, and fragmented. This is because the agricultural contribution to economic development is lower in areas with stronger economic development. Rural settlements are formed on the basis of the economy [43]. Rural settlements’ spatial distribution is closely related to their economic development. It is also the main criterion for measuring the degree of development of rural settlements as well as the material basis and realistic benchmark for their design and construction of rural settlements [62]. Moreover, the spatial distribution of economic development and the size of rural settlement patches in each township shows a positive correlation. Settlements with a high level of economic development and high agricultural output value have a higher overall density and scale of rural settlements, which is similar to Levin and the research results of Gude et al. [63].
5.3. Implications for Rural Settlements
The findings reveal that the land use pattern of rural residential areas in southern Shaanxi is diverse; the land patch form is irregular; and the residential areas are scattered around the city as the center, indicating a lack of advance planning. Rural areas in remote locations lack a large-scale agglomeration and are heavily reliant on transportation. As a result, the following two points should be considered in the future development of rural settlements in southern Shaanxi.
The first one is rational planning of rural settlements and improvement of rural governance capacity. In the construction of rural residential areas, the government should engage in reasonable planning, combine the theoretical and practical research results, strictly grasp the occupation of various types of land, and ensure the balance of occupation and supplement [53]. The authority should integrate ecological protection with the improvement of people’s livelihood [54], involve villagers in rural governance, strengthen publicity and education, protect the local ecological environment, strictly control the red line for ecological protection, and build a “beautiful countryside”.
In addition, there is a need to enhance infrastructure and encourage high-quality rural development. To achieve rural revitalization in southern Shaanxi, local decision-makers should rely on a variety of policies to improve the construction of urban and rural road networks from gathering centers for rural residential areas and encourage residents with poor living conditions to relocate to areas with relatively better environments [59], in order to achieve high-quality rural development in southern Shaanxi.
5.4. Limitations and Future Work
This study has a few limitations. One of the key limitations is that, in the process of researching driving factors, quantitative methods were primarily used to analyze social and economic factors, with no qualitative research. In the follow-up study, relevant information will be gathered, field research should be conducted, and qualitative research will be conducted. In addition, rural settlements are a dynamic process, whereas the study only uses data from one period to explain the spatial pattern characteristics of rural settlements in southern Shaanxi. Moreover, future research will focus on mobility to better understand the rural settlement dispersion patterns in this area. The following study will analyze multi-period data to reveal the spatial pattern evolution characteristics of rural settlements in southern Shaanxi. In light of the two shortcomings above, additional research will be conducted in order to provide a reference for the rational planning of rural settlements and the improvement of the human settlement environment in southern Shaanxi.
6. Conclusions
The geographical distribution of rural villages in the Qinba mountainous area of southern Shaanxi is described using an agglomeration distribution model. The rural settlement distribution has significant spatial agglomeration patterns of “high-density multi-core agglomeration and broad low-density distribution” according to this study, yet its spatial distribution has significant variations. The northern part of Zhouzhi County, the junction of Hantai District and Mian County, and the central part of Chengdu County have a higher density of rural settlements, whereas the rest of Chengdu County has a lower density. It reflects “high-density large-scale agglomeration and low-density small-scale agglomeration” in terms of scale. At different spatial scales, however, the agglomeration level differs. In the scale distribution, there is substantial low-value clustering. The northern portion of Zhouzhi County, the confluence of Hantai District and Mian County, the central part of Chengdu County, and the southwestern part of Yang County are home to large-scale villages, while small villages are found throughout the study area. Rural settlements have a rather regular morphological distribution with high connectivity and integrity, although the spatial variance of the morphology is anisotropic. Moreover, in terms of shape, the space has reached a significant difference. In general, the degree of agglomeration is higher, the degree of fragmentation is lower, and the spatial layout is distinct and irregular.
Overall, the spatial pattern of rural settlements in the study area was significantly affected by factors such as slope, road, distance from township center, distance from major rivers, population, and economy. As a result, the influence of natural ecological conditions such as topography, landform, and population distribution on the spatial pattern of rural settlements in the Qinba Mountains is dominant. Moreover, this region mainly comprises hilly, forest and cultivated land, and a river network, and has local agricultural production based mainly on food crops and traditional cash crops. Therefore, the rural settlements tend to have a centralized distribution. Moreover, rural residents are inclined to live within their clans influenced by the regimen of kinship ties, leading to large-scale settlements with good regularity and connection.
Rural settlements in Shaanxi’s Qinba Mountains are classified as high-density, large-scale agglomeration distribution or low-density, small-scale agglomeration distribution based on density, scale, and shape. For these, it is well-advised to accelerate rural settlement consolidation, optimize spatial layout, and increase the intensity of land use; additionally, there is a need to boost agricultural industrialization and promote the construction of new rural communities, together with raising the level of rural public service; finally, it is strongly recommended to advance rural urbanization, encourage population and industry to congregate in small towns, as well as to build a network of new villages and small towns.
Author Contributions
Conceptualization, S.C. and Y.G.; Methodology, S.C.; Software, S.L.; Validation, S.C., S.L. and Y.G.; Formal analysis, S.C.; Investigation, S.C.; Resources, Y.G.; Data curation, S.C.; Writing—original draft preparation, S.C.; Writing—review and editing, Y.G. and M.S.M.; Visualization, S.C.; Supervision, Y.G.; Project administration, Y.G.; Funding acquisition, Y.G. All authors participated in the discussion of the results and contributed to the writing of the final version of the manuscript. All authors have read and agreed to the published version of the manuscript.
Funding
This research was funded by National Key R&D Program, grant number “2020YFC1701300”.
Informed Consent Statement
Informed consent was obtained from all subjects involved in the study.
Data Availability Statement
All the data used for several analyses are freely available and resources are mentioned within the paper.
Acknowledgments
The authors would like to thank the editors and referees for their constructive comments on this paper.
Conflicts of Interest
The authors declare that they have no known competing financial interests or personal relationships that could have appeared to influence the work reported in this paper.
References
- Azhdari, A.; Sasani, M.A.; Soltani, A. Exploring the Relationship between Spatial Driving Forces of Urban Expansion and Socioeconomic Segregation: The Case of Shiraz. Habitat Int. 2018, 81, 33–44. [Google Scholar] [CrossRef]
- Ferdous, L.; Kafy, A.-A.; Raihan Gafur, A.M.; Wakil, A.; Gafur, A.M.R.; Abdul, W. An Analysis on Influencing Factors of Rural Housing and Settlement Pattern in Rajshahi, Bangladesh. Landsc. Archit. Reg. Plan. 2017, 2, 99–109. [Google Scholar] [CrossRef]
- Li, X.; Li, H.; Zhang, Y.; Yang, L. Spatial Patterns and the Regional Differences of Rural Settlements in Jilin Province, China. Sustainability 2017, 9, 2170. [Google Scholar] [CrossRef]
- Shinde, N.N.; Gajhans, D.S. Distribution Pattern of Rural Settlement of Jalgoan District. Indian Streams Res. J. 2015, 4, 1–7. [Google Scholar]
- Nelson, P.B. Rural Restructuring in the American West: Land Use, Family and Class Discourses. J. Rural Stud. 2001, 17, 395–407. [Google Scholar] [CrossRef]
- Sevenant, M.; Antrop, M. Settlement Models, Land Use and Visibility in Rural Landscapes: Two Case Studies in Greece. Landsc. Urban Plan. 2007, 80, 362–374. [Google Scholar] [CrossRef]
- Vesterby, M.; Krupa, K.S. Rural Residential Land Use: Tracking Its Growth. Available online: https://eurekamag.com/research/003/923/003923834.php (accessed on 20 June 2022).
- Sathi Sampad, R.; Jana, N.C. Impact of Geomorphic Attributes on Rural Settlement Distribution: A Case Study of Baghmundi Block in Purulia District, West Bengal. Int. J. Innov. Res. Dev. 2015, 4, 121–132. [Google Scholar]
- Hosseini, S.B.; Faizi, M.; Norouzian-Maleki, S.; Karimi Azari, A.R. Impact Evaluation of Rural Development Plans for Renovating and Retrofitting of Rural Settlements: Case Study: Rural Districts of Tafresh in Iran. Environ. Earth Sci. 2015, 73, 3033–3042. [Google Scholar] [CrossRef]
- Walters, B.B. Explaining Rural Land Use Change and Reforestation: A Causal-Historical Approach. Land Use Policy 2017, 67, 608–624. [Google Scholar] [CrossRef]
- Wegren, S.K.; O’Brien, D.J.; Patsiorkovsky, V.V. The Economics of Rural Households in Russia: Impact of Village Location. Eurasian Geogr. Econ. 2013, 49, 200–214. [Google Scholar] [CrossRef]
- Li, Y.; Long, H.; Liu, Y. Spatio-Temporal Pattern of China’s Rural Development: A Rurality Index Perspective. J. Rural Stud. 2015, 38, 12–26. [Google Scholar] [CrossRef]
- Liu, H. Changing Regional Rural Inequality in China 1980–2002. Area 2006, 38, 377–389. [Google Scholar] [CrossRef]
- Liu, D.; Tang, W.; Liu, Y.; Zhao, X.; He, J. Optimal Rural Land Use Allocation in Central China: Linking the Effect of Spatiotemporal Patterns and Policy Interventions. Appl. Geogr. 2017, 86, 165–182. [Google Scholar] [CrossRef]
- Long, H.; Liu, Y.; Wu, X.; Dong, G. Spatio-Temporal Dynamic Patterns of Farmland and Rural Settlements in Su–Xi–Chang Region: Implications for Building a New Countryside in Coastal China. Land Use Policy 2009, 26, 322–333. [Google Scholar] [CrossRef]
- Zhou, G.; He, Y.; Tang, C.; Yu, T.; Xiao, G.; Zhong, T. Dynamic Mechanism and Present Situation of Rural Settlement Evolution in China. J. Geogr. Sci. 2013, 23, 513–524. [Google Scholar] [CrossRef]
- Zhu, F.; Zhang, F.; Li, C.; Zhu, T. Functional Transition of the Rural Settlement: Analysis of Land-Use Differentiation in a Transect of Beijing, China. Habitat Int. 2014, 41, 262–271. [Google Scholar] [CrossRef]
- Song, W.; Liu, M. Assessment of Decoupling between Rural Settlement Area and Rural Population in China. Land Use Policy 2014, 39, 331–341. [Google Scholar] [CrossRef]
- Antrop, M. Landscape Change and the Urbanization Process in Europe. Landsc. Urban Plan. 2004, 67, 9–26. [Google Scholar] [CrossRef]
- Carrión-Flores, C.; Irwin, E.G. Determinants of Residential Land-Use Conversion and Sprawl at the Rural-Urban Fringe. Am. J. Agric. Econ. 2004, 86, 889–904. [Google Scholar] [CrossRef]
- Marull, J.; Pino, J.; Tello, E.; Cordobilla, M.J. Social Metabolism, Landscape Change and Land-Use Planning in the Barcelona Metropolitan Region. Land Use Policy 2010, 27, 497–510. [Google Scholar] [CrossRef]
- Forleo, M.B.; Giaccio, V.; Giannelli, A.; Mastronardi, L.; Palmieri, N. Socio-Economic Drivers, Land Cover Changes and the Dynamics of Rural Settlements: Mt. Matese Area (Italy). Eur. Countrys. 2017, 9, 435–457. [Google Scholar] [CrossRef]
- Rosner, A.; Wesołowska, M. Deagrarianisation of the Economic Structure and the Evolution of Rural Settlement Patterns in Poland. Land 2020, 9, 523. [Google Scholar] [CrossRef]
- Grau, H.R.; Aide, M. Globalization and Land-Use Transitions in Latin America. Ecol. Soc. 2008, 13, 16. [Google Scholar] [CrossRef]
- Oldfield, P. Rural Settlement and Economic Development in Southern Italy: Troia and Its Contado, c.1020–c.1230. J. Mediev. Hist. 2005, 31, 327–345. [Google Scholar] [CrossRef]
- Milesi, C.; Elvidge, C.D.; Nemani, R.R.; Running, S.W. Assessing the Impact of Urban Land Development on Net Primary Productivity in the Southeastern United States. Remote Sens. Environ. 2003, 86, 401–410. [Google Scholar] [CrossRef]
- White, E.M.; Morzillo, A.T.; Alig, R.J. Past and Projected Rural Land Conversion in the US at State, Regional, and National Levels. Landsc. Urban Plan. 2009, 89, 37–48. [Google Scholar] [CrossRef]
- Lichter, D.T.; Johnson, K.M. Emerging Rural Settlement Patterns and the Geographic Redistribution of America’s New Immigrants. Rural Sociol. 2006, 71, 109–131. [Google Scholar] [CrossRef]
- Qu, Y.; Jiang, G.; Zhao, Q.; Ma, W.; Zhang, R.; Yang, Y. Geographic Identification, Spatial Differentiation, and Formation Mechanism of Multifunction of Rural Settlements: A Case Study of 804 Typical Villages in Shandong Province, China. J. Clean. Prod. 2017, 166, 1202–1215. [Google Scholar] [CrossRef]
- Ma, X.; Qiu, F.; Li, Q.; Shan, Y.; Cao, Y. Spatial Pattern and Regional Types of Rural Settlements in Xuzhou City, Jiangsu Province, China. Chin. Geogr. Sci. 2013, 23, 482–491. [Google Scholar] [CrossRef]
- Tang, C.; He, Y.; Zhou, G.; Zeng, S.; Xiao, L. Optimizing the Spatial Organization of Rural Settlements Based on Life Quality. J. Geogr. Sci. 2018, 28, 685–704. [Google Scholar] [CrossRef]
- Tan, S.; Zhang, M.; Wang, A.; Ni, Q. Spatio-Temporal Evolution and Driving Factors of Rural Settlements in Low Hilly Region—A Case Study of 17 Cities in Hubei Province, China. Int. J. Environ. Res. Public Health 2021, 18, 2387. [Google Scholar] [CrossRef] [PubMed]
- Li, H.; Song, W. Pattern of Spatial Evolution of Rural Settlements in the Jizhou District of China during 1962–2030. Appl. Geogr. 2020, 122, 102247. [Google Scholar] [CrossRef]
- Yang, Y.; Liu, Y.; Li, Y.; Du, G. Quantifying Spatio-Temporal Patterns of Urban Expansion in Beijing during 1985–2013 with Rural-Urban Development Transformation. Land Use Policy 2018, 74, 220–230. [Google Scholar] [CrossRef]
- Li, Y.; Jia, L.; Wu, W.; Yan, J.; Liu, Y. Urbanization for Rural Sustainability—Rethinking China’s Urbanization Strategy. J. Clean. Prod. 2018, 178, 580–586. [Google Scholar] [CrossRef]
- Shaanxi Provincial-Local Chronicles Compilation Committee Shanxi Province Publication Chronicles: Geography. Available online: http://cbkx.whu.edu.cn/jwk3/cbkx/EN/abstract/abstract1730.shtml (accessed on 20 June 2022).
- WU Chuanjun Man-Land Relationship and Economic Allocation (Collected Works of Wu Chuanjun). Available online: https://www.amazon.com/man-relations-economic-layout-Collection/dp/7507700747 (accessed on 20 June 2022).
- Hu, Q.; Wang, C. Quality Evaluation and Division of Regional Types of Rural Human Settlements in China. Habitat Int. 2020, 105, 102278. [Google Scholar] [CrossRef]
- Peeters, A.; Zude, M.; Käthner, J.; Ünlü, M.; Kanber, R.; Hetzroni, A.; Gebbers, R.; Ben-Gal, A. Getis–Ord’s Hot- and Cold-Spot Statistics as a Basis for Multivariate Spatial Clustering of Orchard Tree Data. Comput. Electron. Agric. 2015, 111, 140–150. [Google Scholar] [CrossRef]
- Song, W.; Li, H. Spatial Pattern Evolution of Rural Settlements from 1961 to 2030 in Tongzhou District, China. Land Use Policy 2020, 99, 105044. [Google Scholar] [CrossRef]
- Zhang, Y.; Wang, P.; Wang, T.; Cai, C.; Li, Z.; Teng, M. Scenarios Simulation of Spatio-Temporal Land Use Changes for Exploring Sustainable Management Strategies. Sustainability 2018, 10, 1013. [Google Scholar] [CrossRef]
- Fu, J.; Zhou, J.; Deng, Y. Heritage Values of Ancient Vernacular Residences in Traditional Villages in Western Hunan, China: Spatial Patterns and Influencing Factors. Build. Environ. 2021, 188, 107473. [Google Scholar] [CrossRef]
- Xiao, H.; Liu, Y.; Li, L.; Yu, Z.; Zhang, X. Spatial Variability of Local Rural Landscape Change under Rapid Urbanization in Eastern China. ISPRS Int. J. Geo-Inf. 2018, 7, 231. [Google Scholar] [CrossRef]
- Yang, R.; Liu, Y.; Long, H.; Qiao, L. Spatio-Temporal Characteristics of Rural Settlements and Land Use in the Bohai Rim of China. J. Geogr. Sci. 2015, 25, 559–572. [Google Scholar] [CrossRef]
- Luo, G.; Wang, B.; Luo, D.; Wei, C. Spatial Agglomeration Characteristics of Rural Settlements in Poor Mountainous Areas of Southwest China. Sustainability 2020, 12, 1818. [Google Scholar] [CrossRef]
- Popović, S.; Djurovic, N.; Murgul, V. Formation, Development and Issues of Montenegro Rural Settlements in the Case of Village Orja Luka in Bjelopavlici. Procedia Eng. 2015, 117, 832–840. [Google Scholar] [CrossRef]
- Constantin, V.; Ştefănescu, L.; Kantor, C.M. Vulnerability Assessment Methodology: A Tool for Policy Makers in Drafting a Sustainable Development Strategy of Rural Mining Settlements in the Apuseni Mountains, Romania. Environ. Sci. Policy 2015, 52, 129–139. [Google Scholar] [CrossRef]
- Chen, Z.; Liu, Y.; Feng, W.; Li, Y.; Li, L. Study on Spatial Tropism Distribution of Rural Settlements in the Loess Hilly and Gully Region Based on Natural Factors and Traffic Accessibility. J. Rural Stud. 2022, 93, 441–448. [Google Scholar] [CrossRef]
- Xu, D.; Wang, Z. Identifying Land Restoration Regions and Their Driving Mechanisms in Inner Mongolia, China from 1981 to 2010. J. Arid. Environ. 2019, 167, 79–86. [Google Scholar] [CrossRef]
- Dax, T.; Fischer, M. An Alternative Policy Approach to Rural Development in Regions Facing Population Decline. Eur. Plan. Stud. 2017, 26, 297–315. [Google Scholar] [CrossRef]
- Jones, E.E. An Analysis of Factors Influencing Sixteenth and Seventeenth Century Haudenosaunee (Iroquois) Settlement Locations. J. Anthropol. Archaeol. 2010, 29, 1–14. [Google Scholar] [CrossRef]
- Li, N.; Jiang, S. Study on Spatial Pattern of Rural Settlements in Wuling Mountainous Area Based on GIS. Wirel. Pers. Commun. 2018, 102, 2745–2757. [Google Scholar] [CrossRef]
- Ottomano Palmisano, G.; Govindan, K.; Loisi, R.V.; Dal Sasso, P.; Roma, R. Greenways for Rural Sustainable Development: An Integration between Geographic Information Systems and Group Analytic Hierarchy Process. Land Use Policy 2016, 50, 429–440. [Google Scholar] [CrossRef]
- Shcherbina, E.; Gorbenkova, E. Factors Influencing the Rural Settlement Development. IFAC-PapersOnLine 2019, 52, 231–235. [Google Scholar] [CrossRef]
- Zhao, F.; Zhang, S.; Du, Q.; Ding, J.; Luan, G.; Xie, Z. Assessment of the Sustainable Development of Rural Minority Settlements Based on Multidimensional Data and Geographical Detector Method: A Case Study in Dehong, China. Socio-Econ. Plan. Sci. 2021, 78, 101066. [Google Scholar] [CrossRef]
- Yanbo, Q.; Guanghui, J.; Wenqiu, M.; Zitong, L. How Does the Rural Settlement Transition Contribute to Shaping Sustainable Rural Development? Evidence from Shandong, China. J. Rural Stud. 2021, 82, 279–293. [Google Scholar] [CrossRef]
- Zhou, R.; Zhang, H.; Ye, X.Y.; Wang, X.J.; Su, H.L. The Delimitation of Urban Growth Boundaries Using the CLUE-S Land-Use Change Model: Study on Xinzhuang Town, Changshu City, China. Sustainability 2016, 8, 1182. [Google Scholar] [CrossRef]
- Ma, W.; Jiang, G.; Wang, D.; Li, W.; Guo, H.; Zheng, Q. Rural Settlements Transition (RST) in a Suburban Area of Metropolis: Internal Structure Perspectives. Sci. Total Environ. 2018, 615, 672–680. [Google Scholar] [CrossRef]
- Gosch, M.S.; Parente, L.L.; dos Santos, C.O.; Mesquita, V.V.; Ferreira, L.G. Landsat-Based Assessment of the Quantitative and Qualitative Dynamics of the Pasture Areas in Rural Settlements in the Cerrado Biome, Brazil. Appl. Geogr. 2021, 136, 102585. [Google Scholar] [CrossRef]
- Feng, R.; Wang, F.; Wang, K.; Xu, S. Quantifying Influences of Anthropogenic-Natural Factors on Ecological Land Evolution in Mega-Urban Agglomeration: A Case Study of Guangdong-Hong Kong-Macao Greater Bay Area. J. Clean. Prod. 2021, 283, 125304. [Google Scholar] [CrossRef]
- Li, F.; Ye, Y.; Song, B.; Wang, R. Evaluation of Urban Suitable Ecological Land Based on the Minimum Cumulative Resistance Model: A Case Study from Changzhou, China. Ecol. Model. 2015, 318, 194–203. [Google Scholar] [CrossRef]
- Yang, R.; Xu, Q.; Long, H. Spatial Distribution Characteristics and Optimized Reconstruction Analysis of China’s Rural Settlements during the Process of Rapid Urbanization. J. Rural Stud. 2016, 47, 413–424. [Google Scholar] [CrossRef]
- Gude, P.H.; Hansen, A.J.; Rasker, R.; Maxwell, B. Rates and Drivers of Rural Residential Development in the Greater Yellowstone. Landsc. Urban Plan. 2006, 77, 131–151. [Google Scholar] [CrossRef]
Figure 1.
Geographical location in the Qinba Mountains (southern Shaanxi).

Figure 2.
Density distribution of rural settlements in the Qinba Mountains.
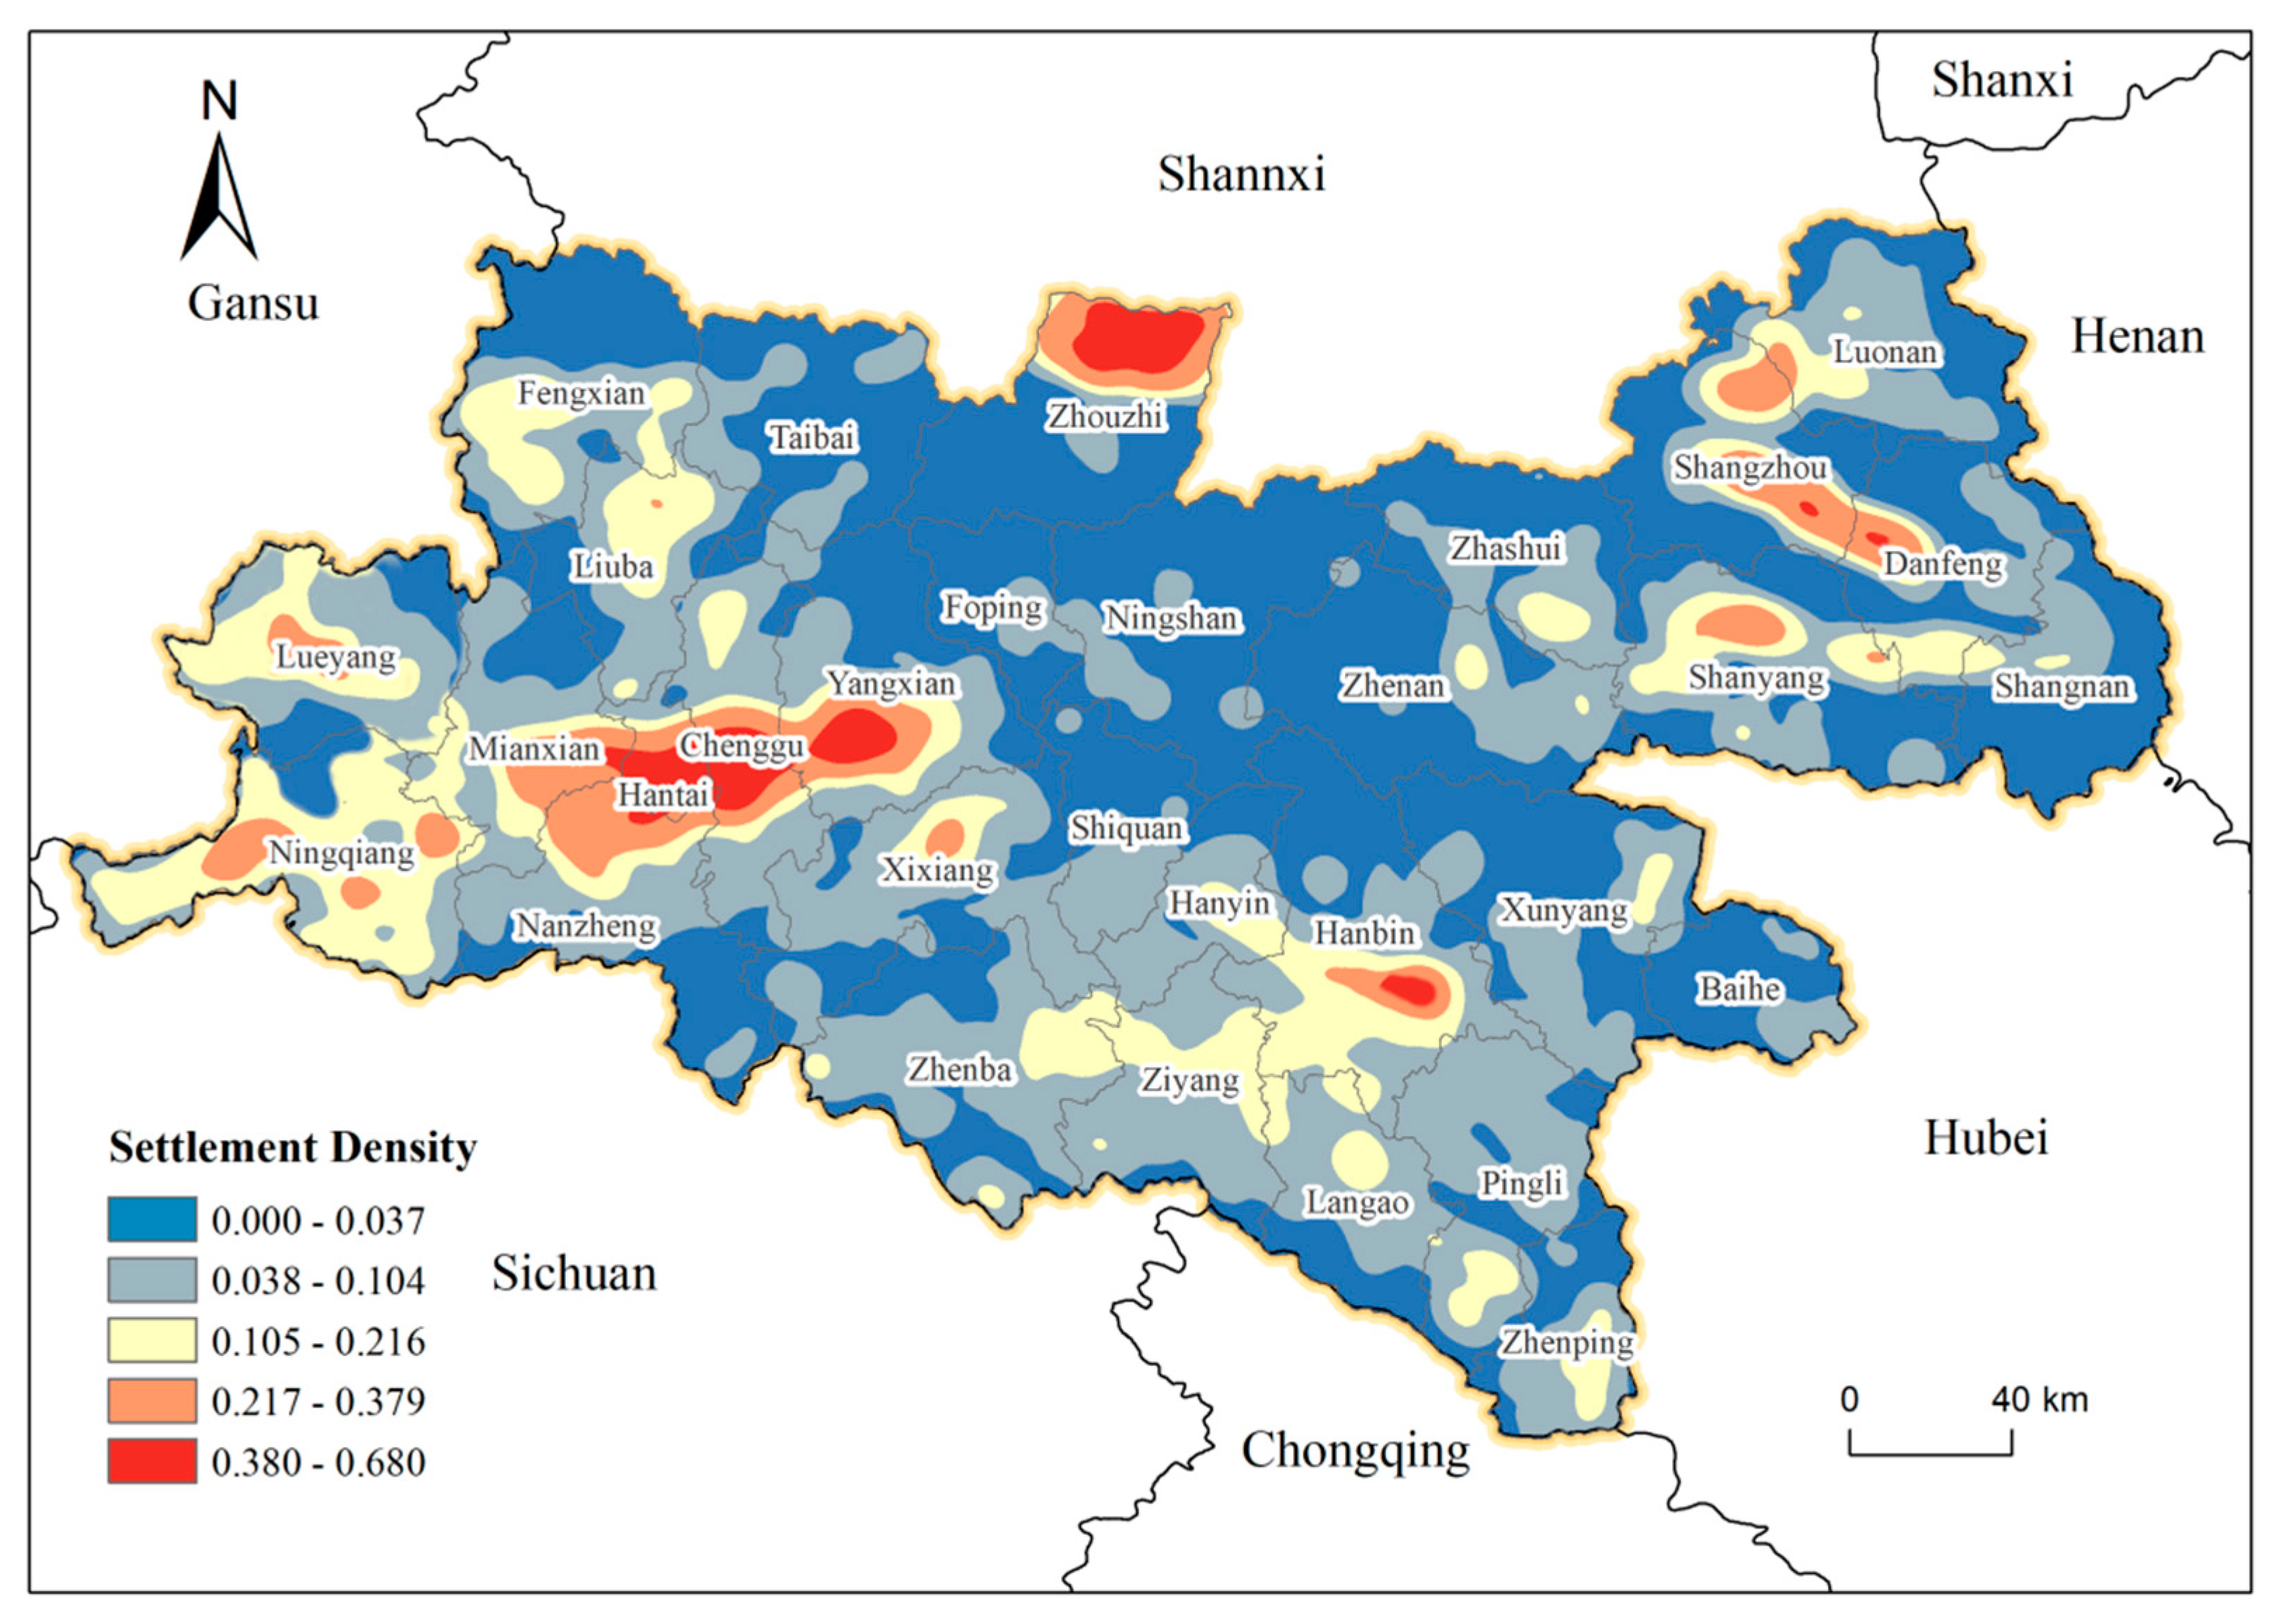
Figure 3.
Grid-based “hot spot” map of rural settlements in the Qinba Mountains.
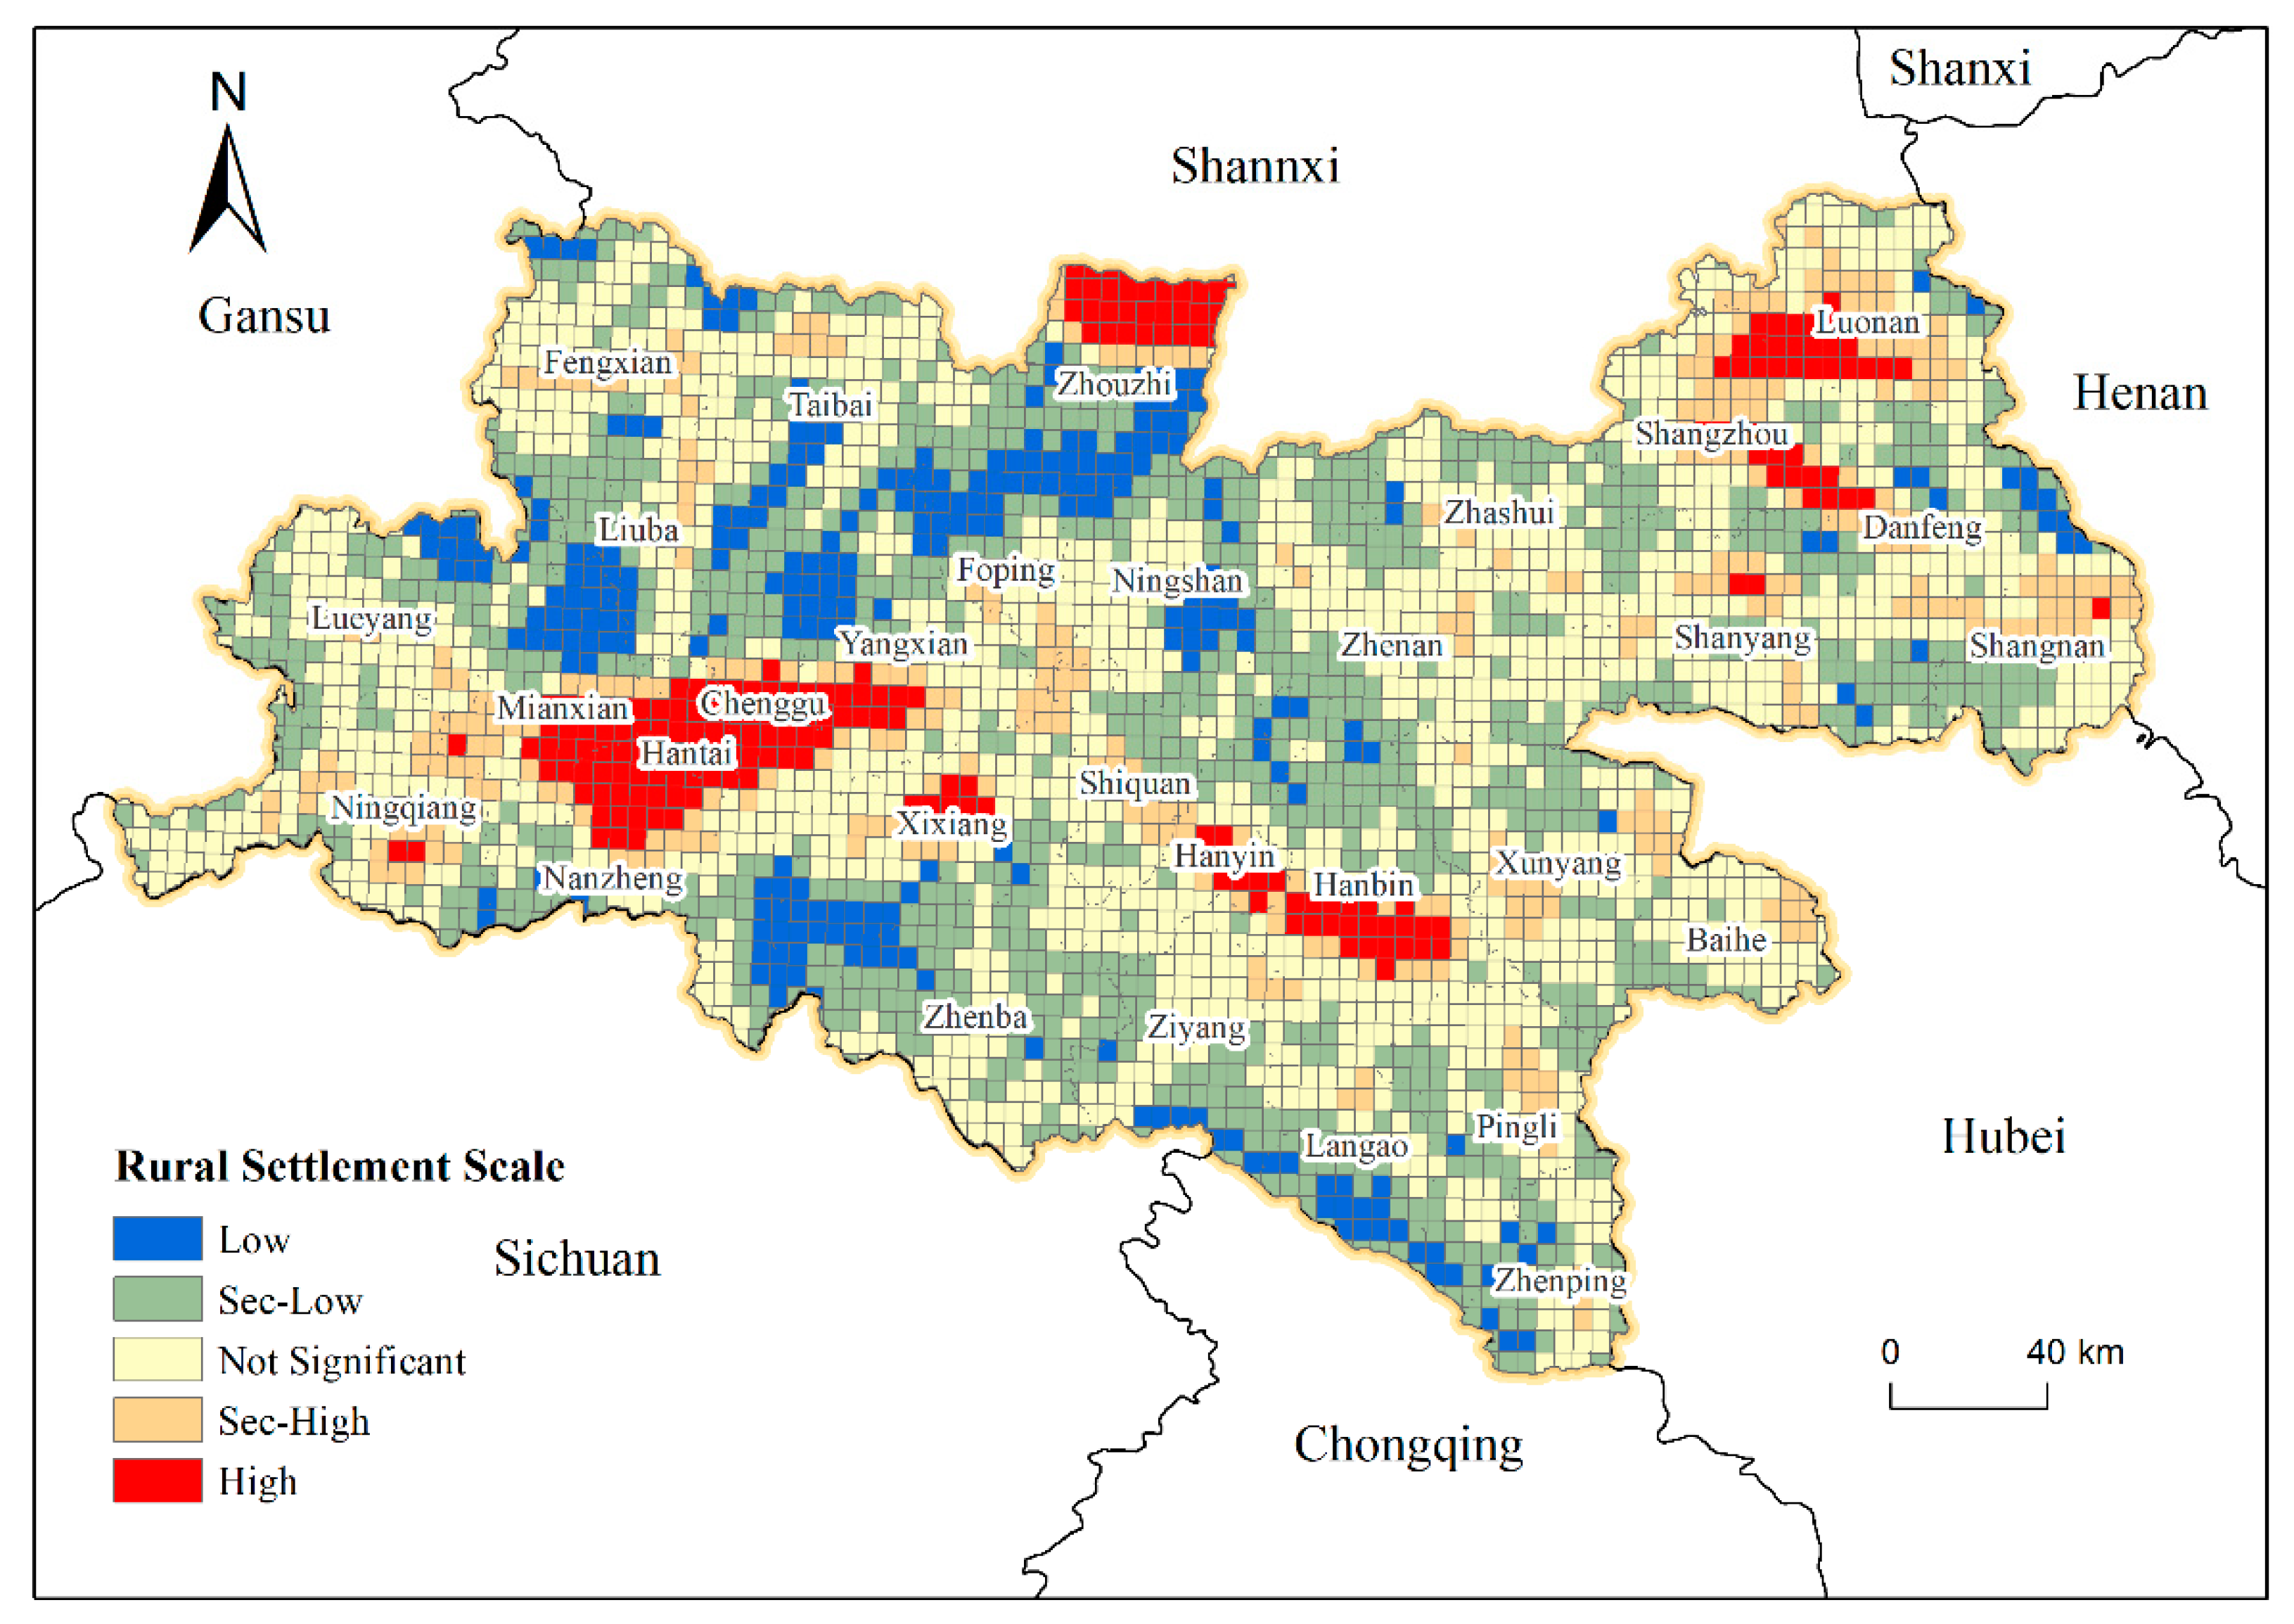
Figure 4.
Belt transect analysis of morphological characteristics of rural settlements in the Qinba Mountains. (a) The LSI value of I, II Sample Number. (b) The LSI value of III, IV Sample Number.
Figure 4.
Belt transect analysis of morphological characteristics of rural settlements in the Qinba Mountains. (a) The LSI value of I, II Sample Number. (b) The LSI value of III, IV Sample Number.
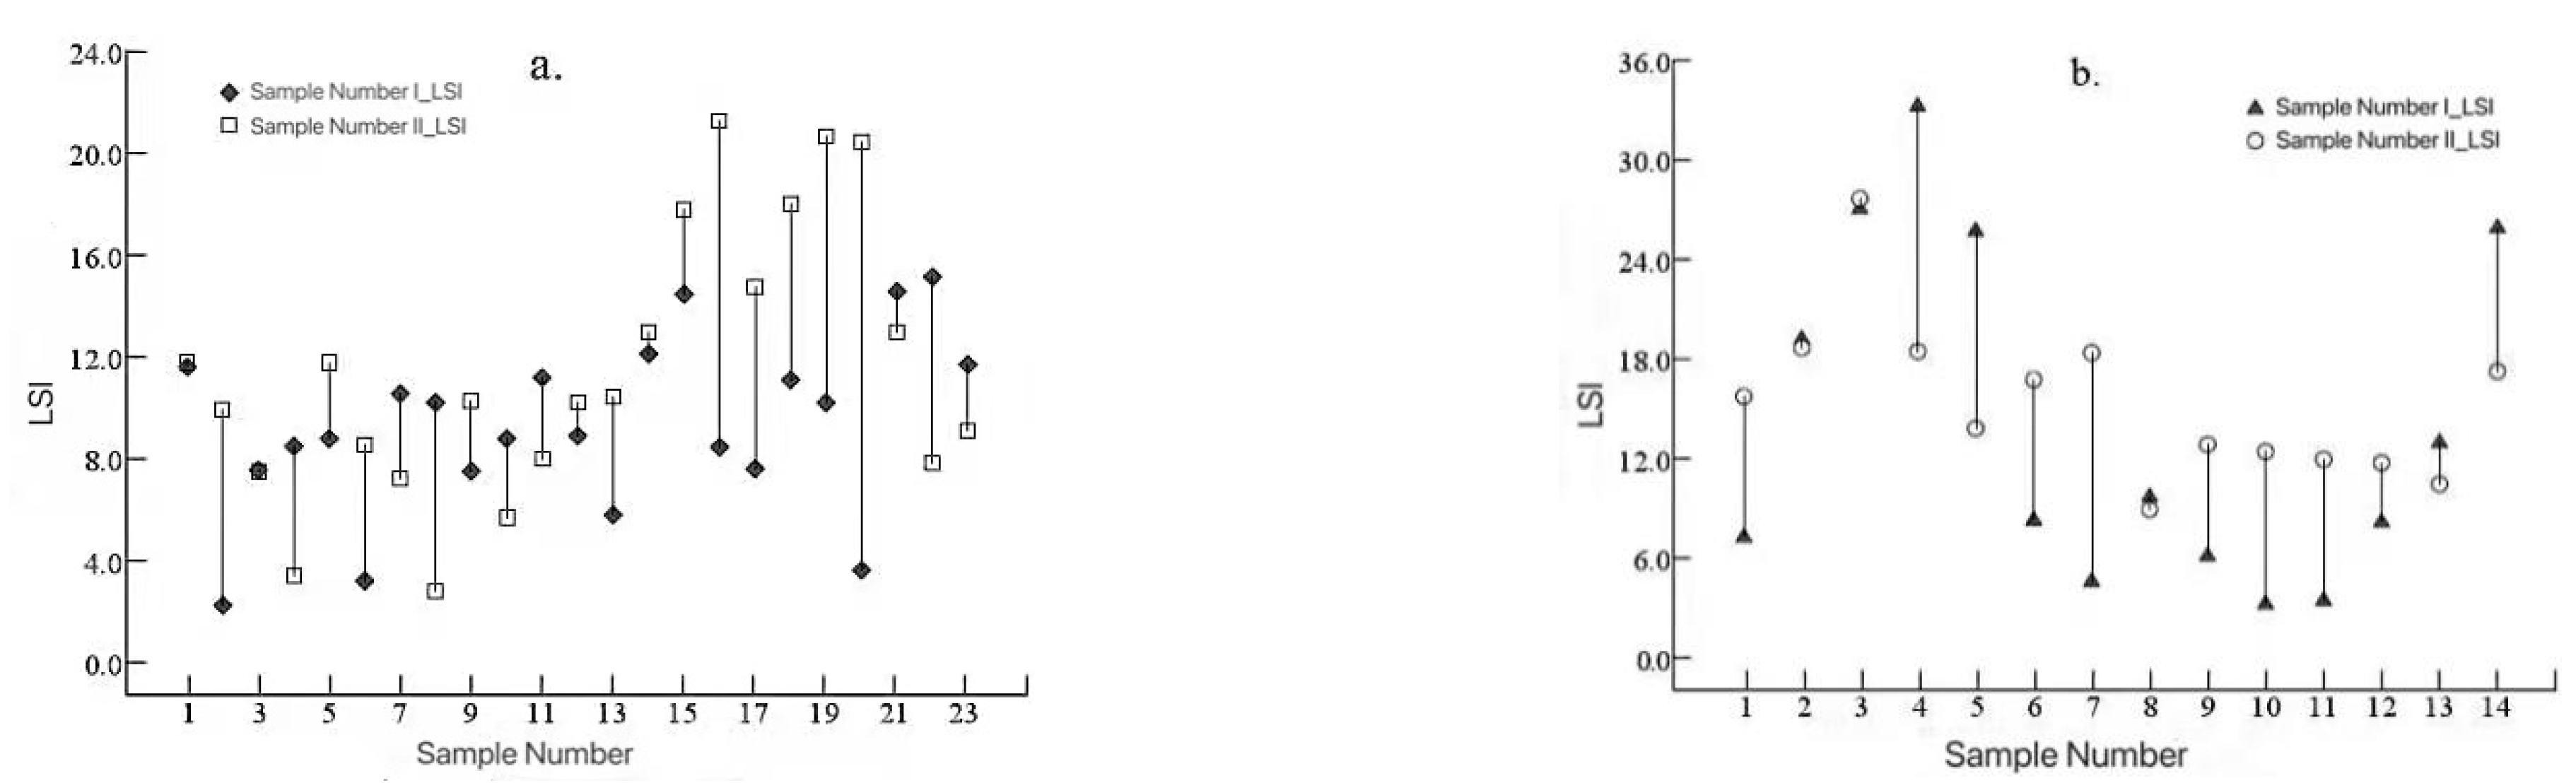
Figure 5.
Spatial distribution map of PCRA.

Figure 6.
Spatial distribution map of GAPD.

Table 1.
Statistics on the spatial pattern characteristics of rural settlements with different topography and location factors in the Qinba Mountains.
Table 1.
Statistics on the spatial pattern characteristics of rural settlements with different topography and location factors in the Qinba Mountains.
| Factor Type | Scope | Number of Rural Settlements (NP)/Piece | Area Ratio/% | The Density of Rural Settlements (PD)/Piece km2 | The Average Area of Rural Settlements (MPS)/km2 | Shape Index of Rural Settlements (LSI) |
|---|---|---|---|---|---|---|
| Landform | Plain basin | 1840 | 62.39 | 0.45 | 0.17 | 46.83 |
| Low hills | 956 | 17.32 | 0.05 | 0.09 | 33.39 | |
| Middle and high mountains | 1549 | 20.29 | 0.03 | 0.06 | 42.28 | |
| Slope/° | 0–5 | 2211 | 68.70 | 0.40 | 0.15 | 51.18 |
| 5–10 | 695 | 11.81 | 0.10 | 0.08 | 28.98 | |
| 10–15 | 460 | 6.01 | 0.05 | 0.06 | 22.83 | |
| 15–20 | 659 | 9.74 | 0.03 | 0.07 | 26.62 | |
| >25 | 313 | 3.73 | 0.01 | 0.06 | 18.61 | |
| Buffer distance from township center/km | 0–3 | 2037 | 56.55 | 0.17 | 0.13 | 48.81 |
| 3–6 | 1616 | 34.18 | 0.06 | 0.10 | 42.63 | |
| 6–9 | 488 | 7.21 | 0.03 | 0.07 | 22.99 | |
| 9–12 | 133 | 1.40 | 0.01 | 0.05 | 11.85 | |
| >12 | 64 | 0.67 | 0.01 | 0.05 | 8.46 | |
| Buffer distance from major rivers/km | 0–3 | 2152 | 55.47 | 0.10 | 0.13 | 50.22 |
| 3–6 | 864 | 19.77 | 0.05 | 0.11 | 30.91 | |
| 6–9 | 651 | 12.85 | 0.04 | 0.10 | 26.43 | |
| 9–12 | 462 | 8.82 | 0.05 | 0.09 | 22.34 | |
| >12 | 209 | 3.09 | 0.02 | 0.07 | 14.97 | |
| Buffer distance from main road/km | 0–3 | 2507 | 69.48 | 0.12 | 0.14 | 54.07 |
| 3–6 | 727 | 13.67 | 0.05 | 0.09 | 27.97 | |
| 6–9 | 369 | 6.57 | 0.04 | 0.09 | 19.95 | |
| 9–12 | 227 | 3.59 | 0.03 | 0.08 | 16.27 | |
| >12 | 509 | 6.69 | 0.02 | 0.06 | 24.28 |
Table 2.
The result of factors based on geodetector analysis.
| Factor | Landform | Slope | Distance to Main Road/km | Agricultural Registered Population | Distance from Town Center/km | Distance to Main River/km |
|---|---|---|---|---|---|---|
| Q value | 0.613 | 0.393 | 0.202 | 0.175 | 0.169 | 0.061 |
Publisher’s Note: MDPI stays neutral with regard to jurisdictional claims in published maps and institutional affiliations. |
© 2022 by the authors. Licensee MDPI, Basel, Switzerland. This article is an open access article distributed under the terms and conditions of the Creative Commons Attribution (CC BY) license (https://creativecommons.org/licenses/by/4.0/).
Share and Cite
MDPI and ACS Style
Chen, S.; Mehmood, M.S.; Liu, S.; Gao, Y. Spatial Pattern and Influencing Factors of Rural Settlements in Qinba Mountains, Shaanxi Province, China. Sustainability 2022, 14, 10095. https://doi.org/10.3390/su141610095
AMA Style
Chen S, Mehmood MS, Liu S, Gao Y. Spatial Pattern and Influencing Factors of Rural Settlements in Qinba Mountains, Shaanxi Province, China. Sustainability. 2022; 14(16):10095. https://doi.org/10.3390/su141610095
Chicago/Turabian StyleChen, Sen, Muhammad Sajid Mehmood, Shuchen Liu, and Yimin Gao. 2022. "Spatial Pattern and Influencing Factors of Rural Settlements in Qinba Mountains, Shaanxi Province, China" Sustainability 14, no. 16: 10095. https://doi.org/10.3390/su141610095
Note that from the first issue of 2016, this journal uses article numbers instead of page numbers. See further details here.