Author Contributions
Conceptualization, G.B., S.S. and R.P.; methodology, R.P. and R.G.; software, R.P. and R.G.; validation, G.B., R.P., R.G. and S.S.; formal analysis, R.P. and R.G.; investigation, G.B., R.P., R.G. and S.S.; resources, G.B. and S.S.; data curation, R.P. and R.G.; writing—original draft preparation, R.P. and R.G.; writing—review and editing, G.B., R.P. and S.S.; visualization, G.B. and S.S.; supervision, G.B. and S.S. All authors have read and agreed to the published version of the manuscript.
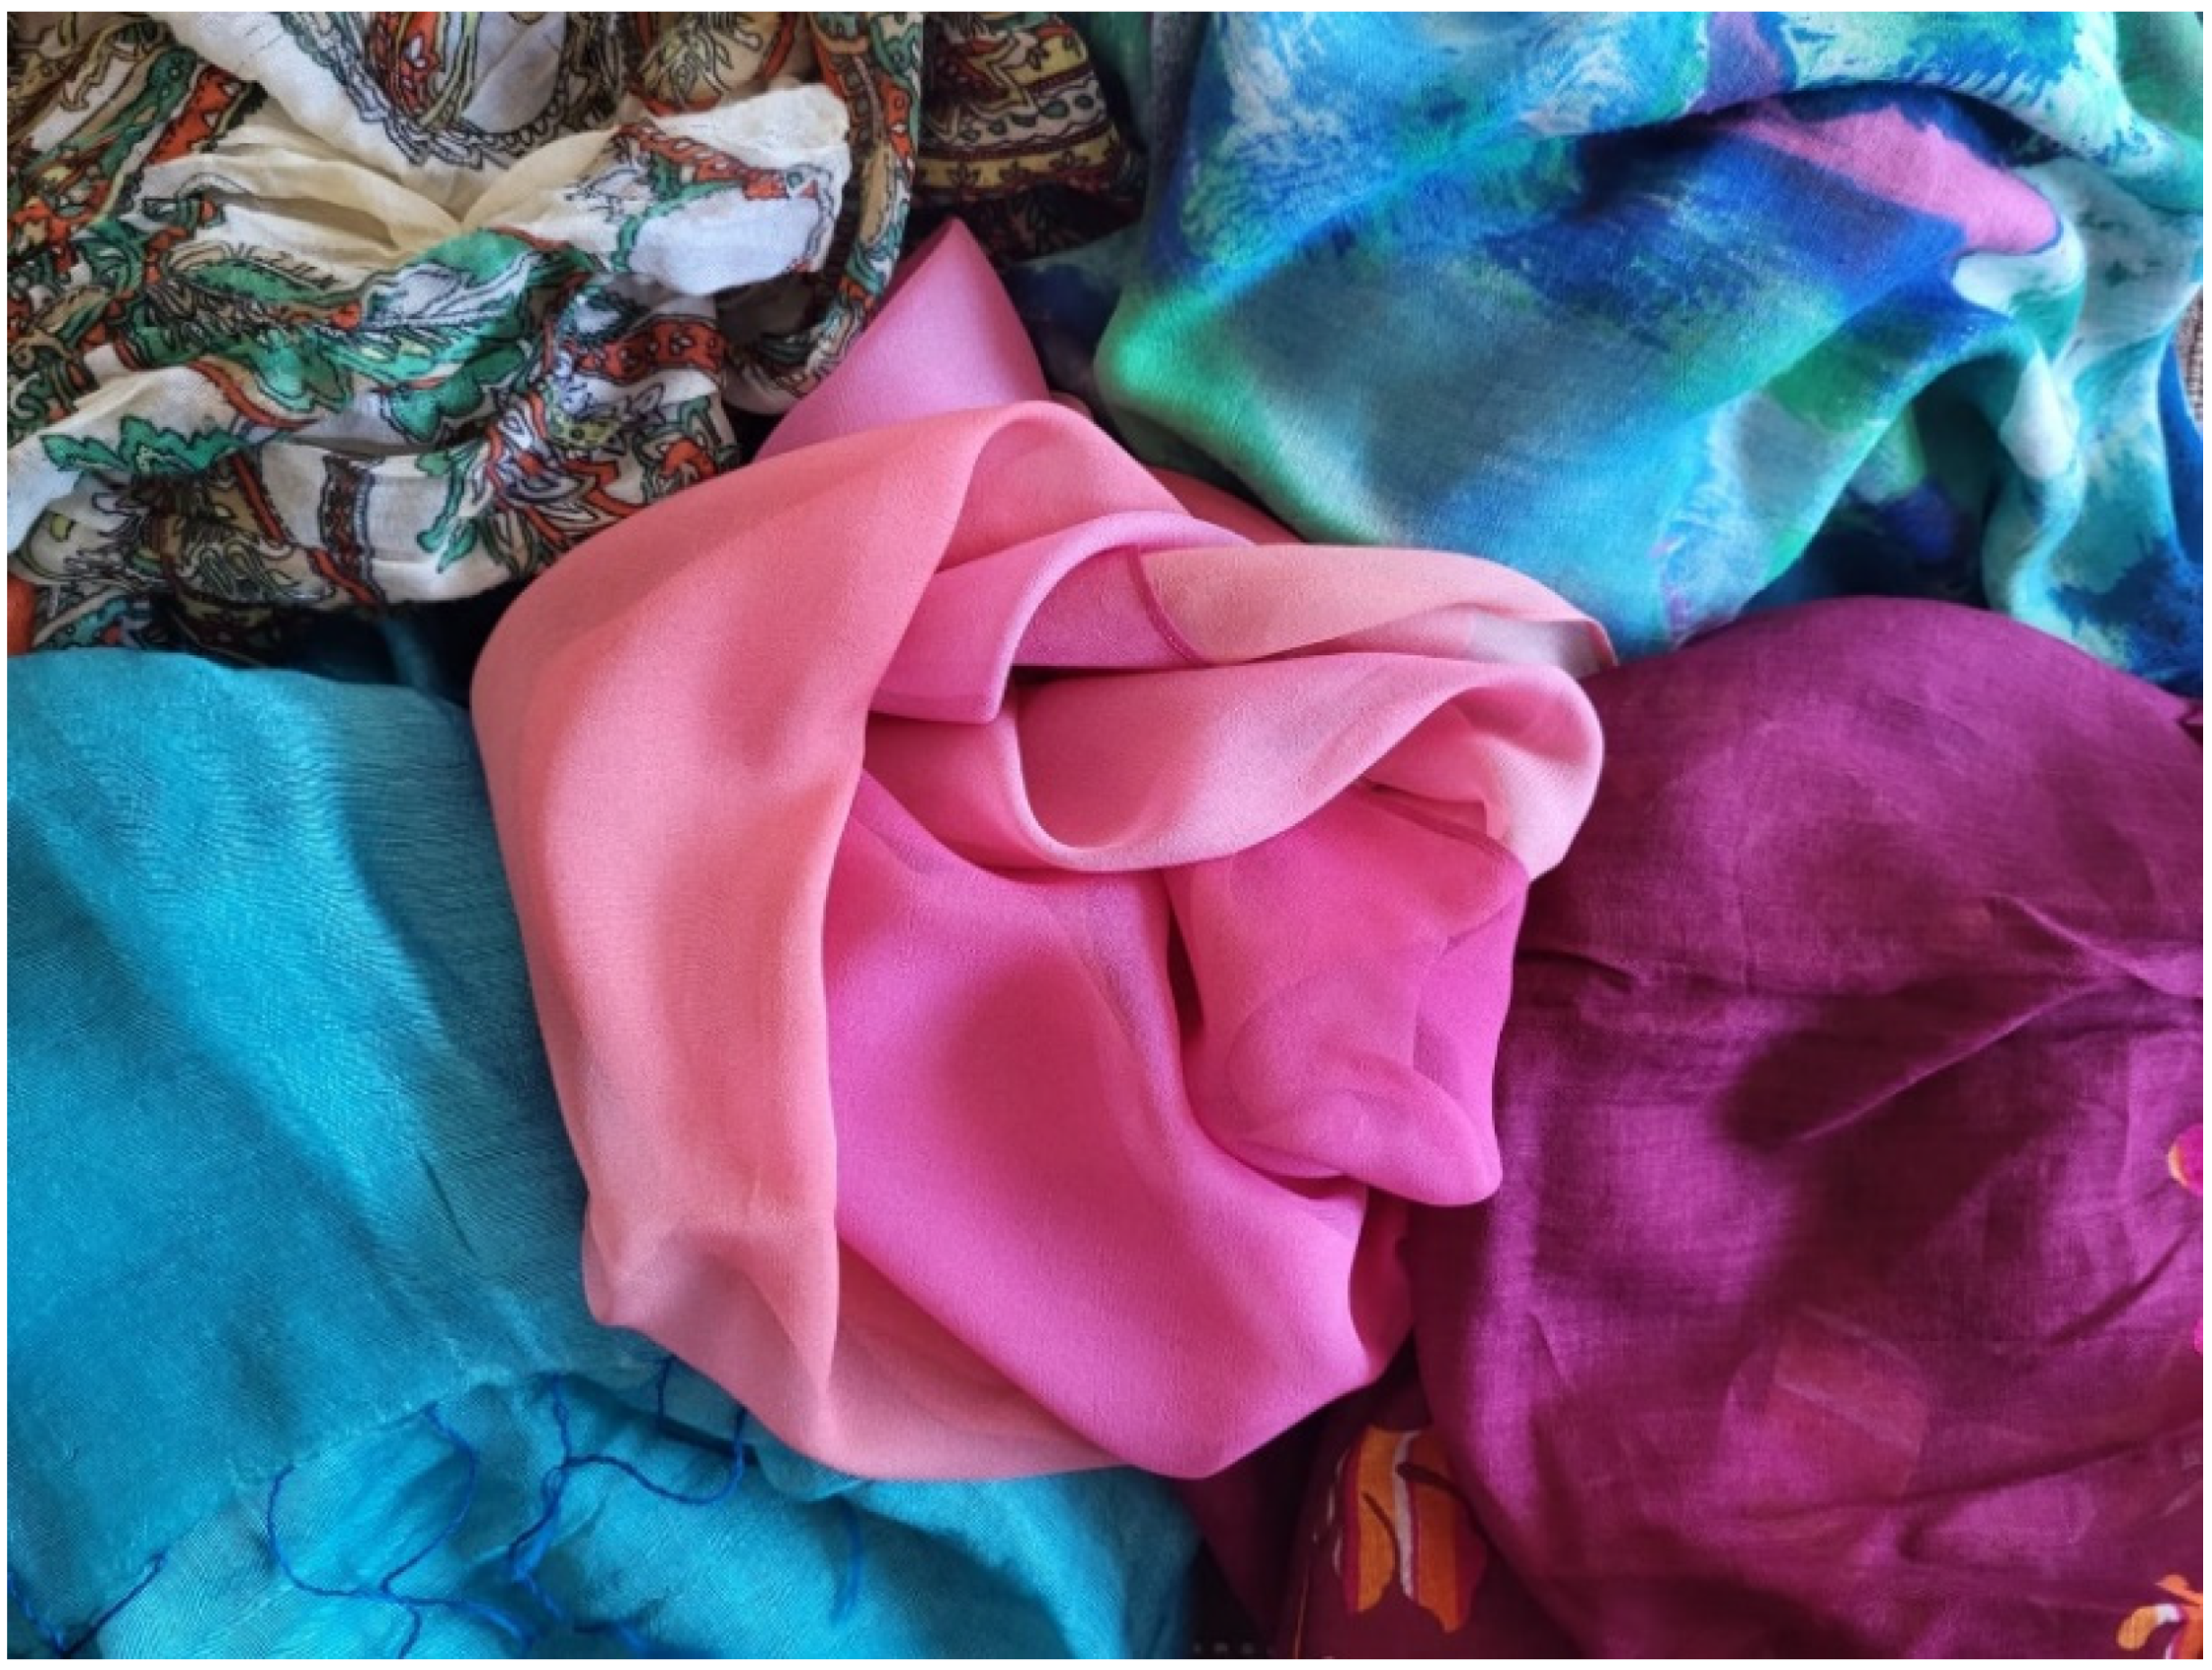
Figure 1.
Selected end-of-life textile apparel.
Figure 1.
Selected end-of-life textile apparel.
Figure 2.
Regions of Interest (ROIs) used to create the training (red dotted area) and the validation (blue dotted area) images for each experimental set-up.
Figure 2.
Regions of Interest (ROIs) used to create the training (red dotted area) and the validation (blue dotted area) images for each experimental set-up.
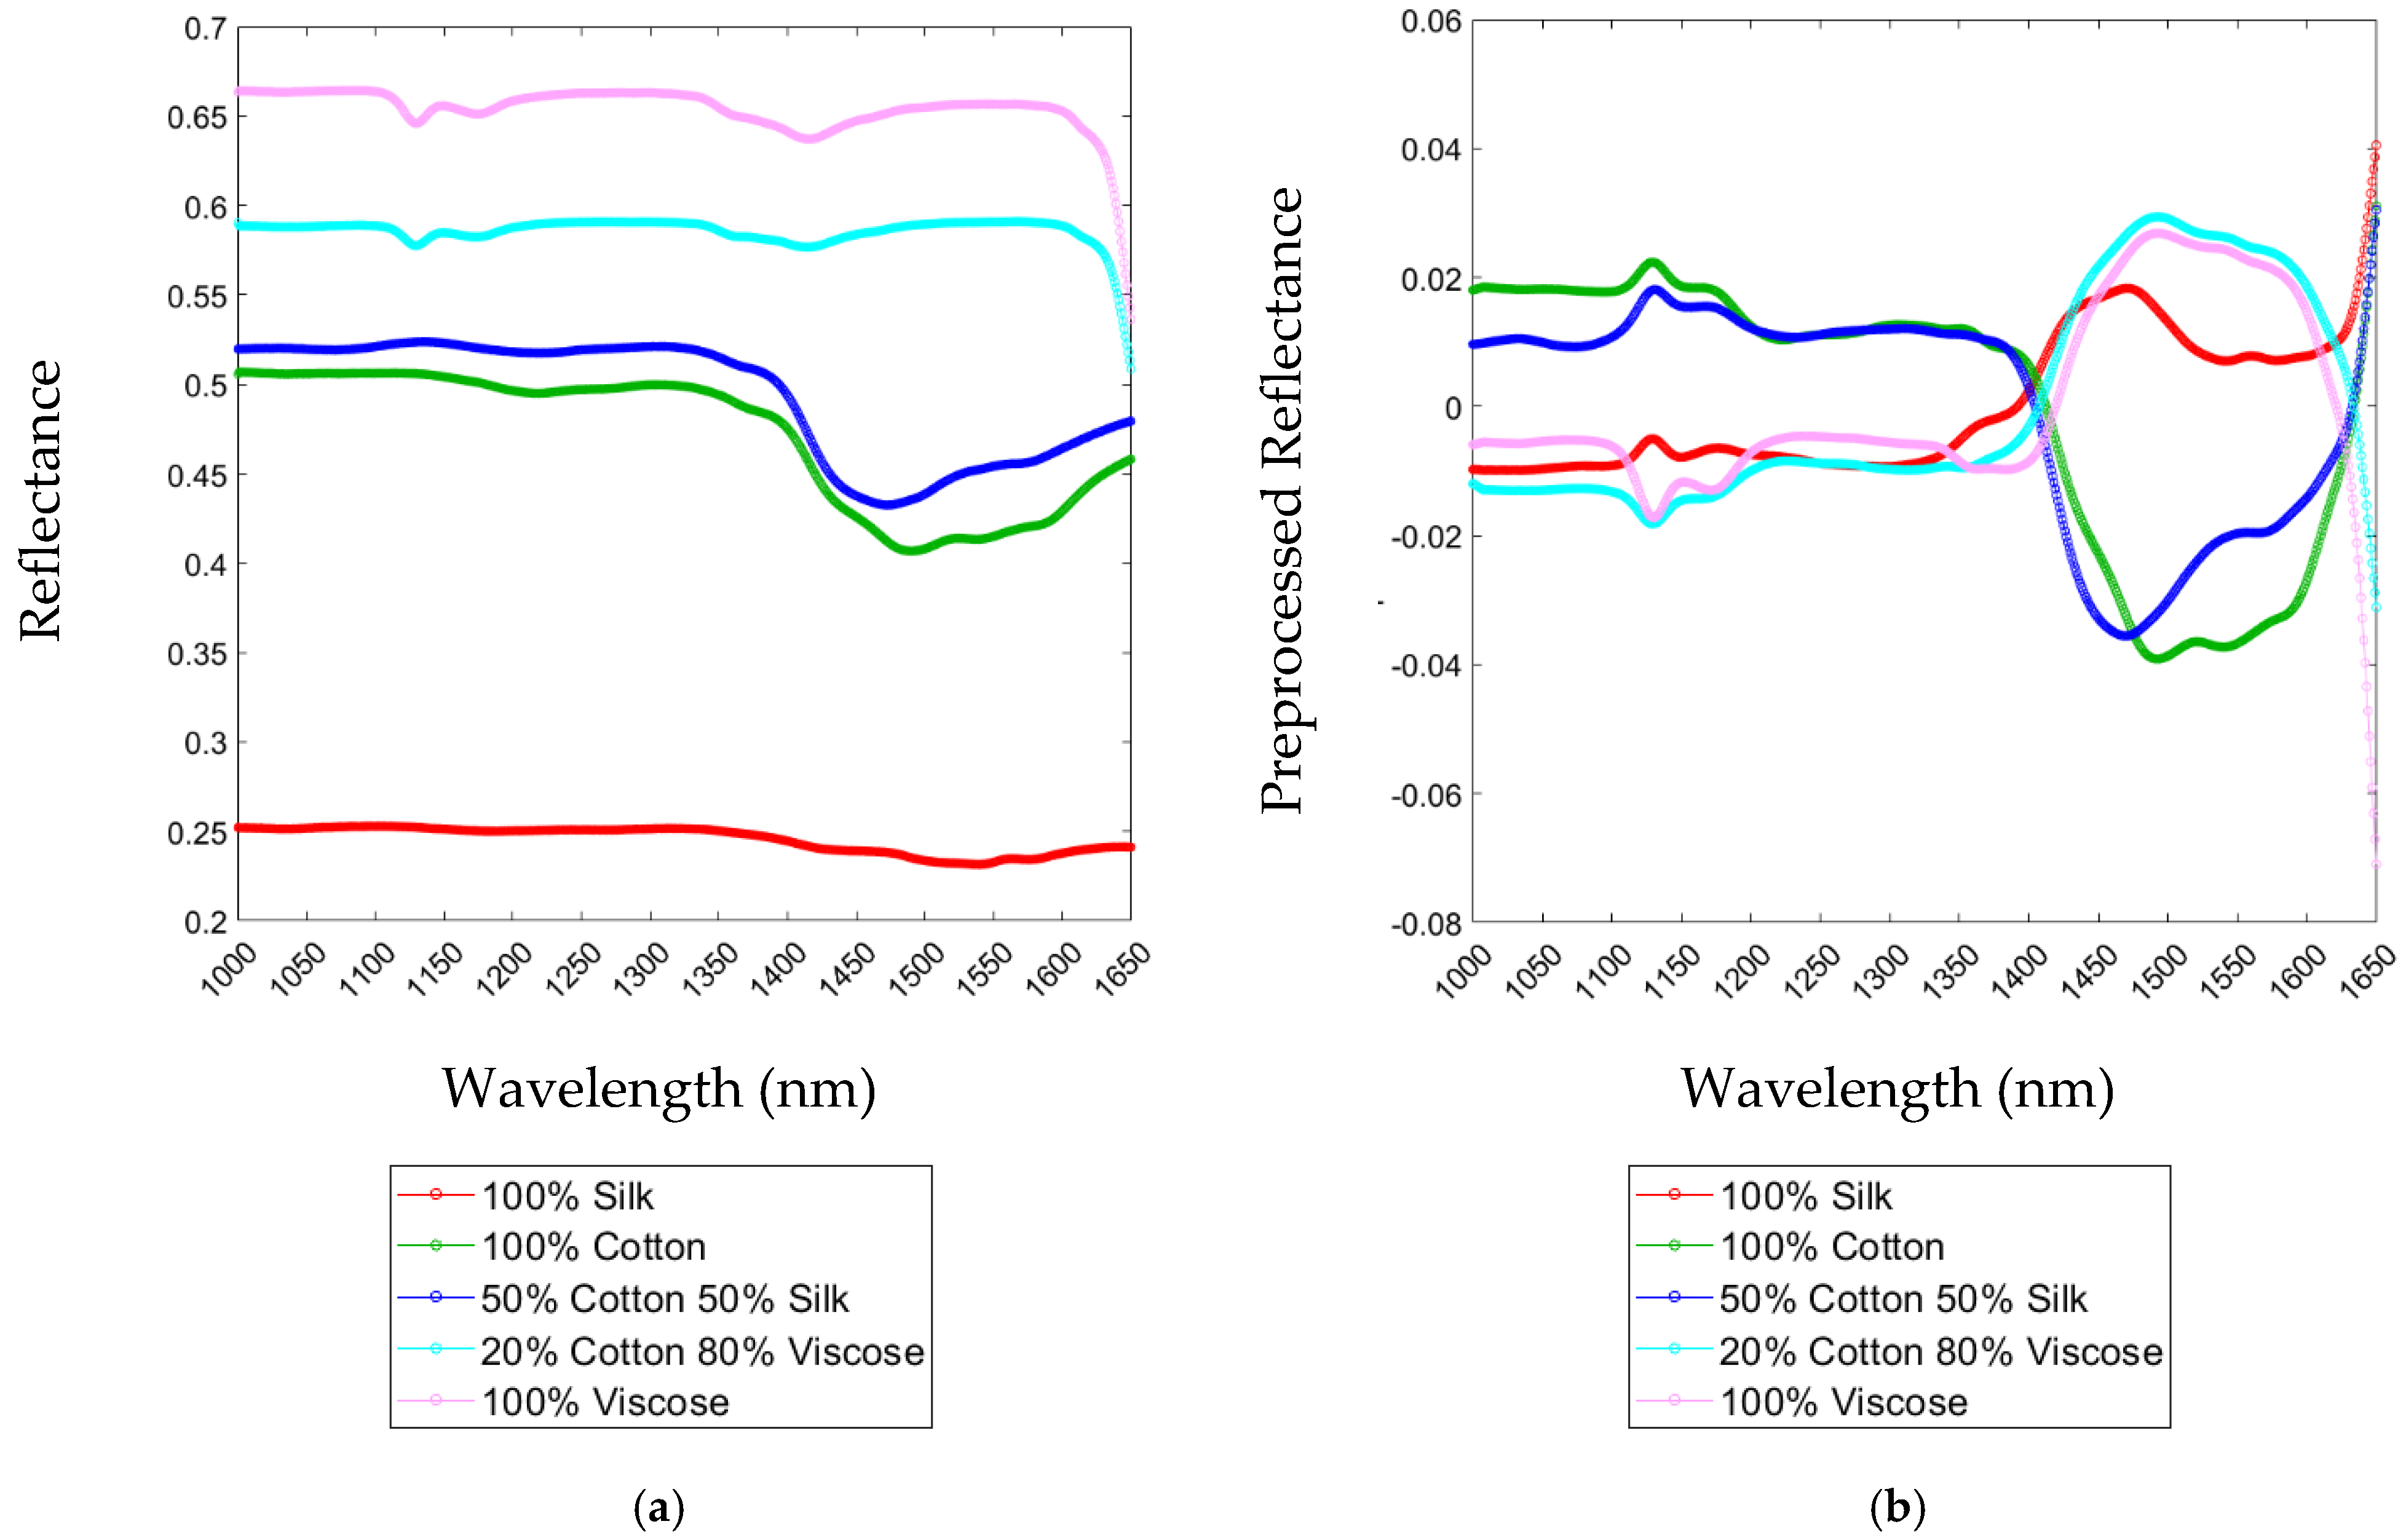
Figure 3.
Raw (a) and preprocessed spectra (b) after the application of Detrend, Smoothing, and Mean Center algorithms of “100% Cotton”, “50% Cotton–50% Silk”, “20% Cotton–80% Viscose”, “100% Viscose”, and “100% Silk” samples.
Figure 3.
Raw (a) and preprocessed spectra (b) after the application of Detrend, Smoothing, and Mean Center algorithms of “100% Cotton”, “50% Cotton–50% Silk”, “20% Cotton–80% Viscose”, “100% Viscose”, and “100% Silk” samples.
Figure 4.
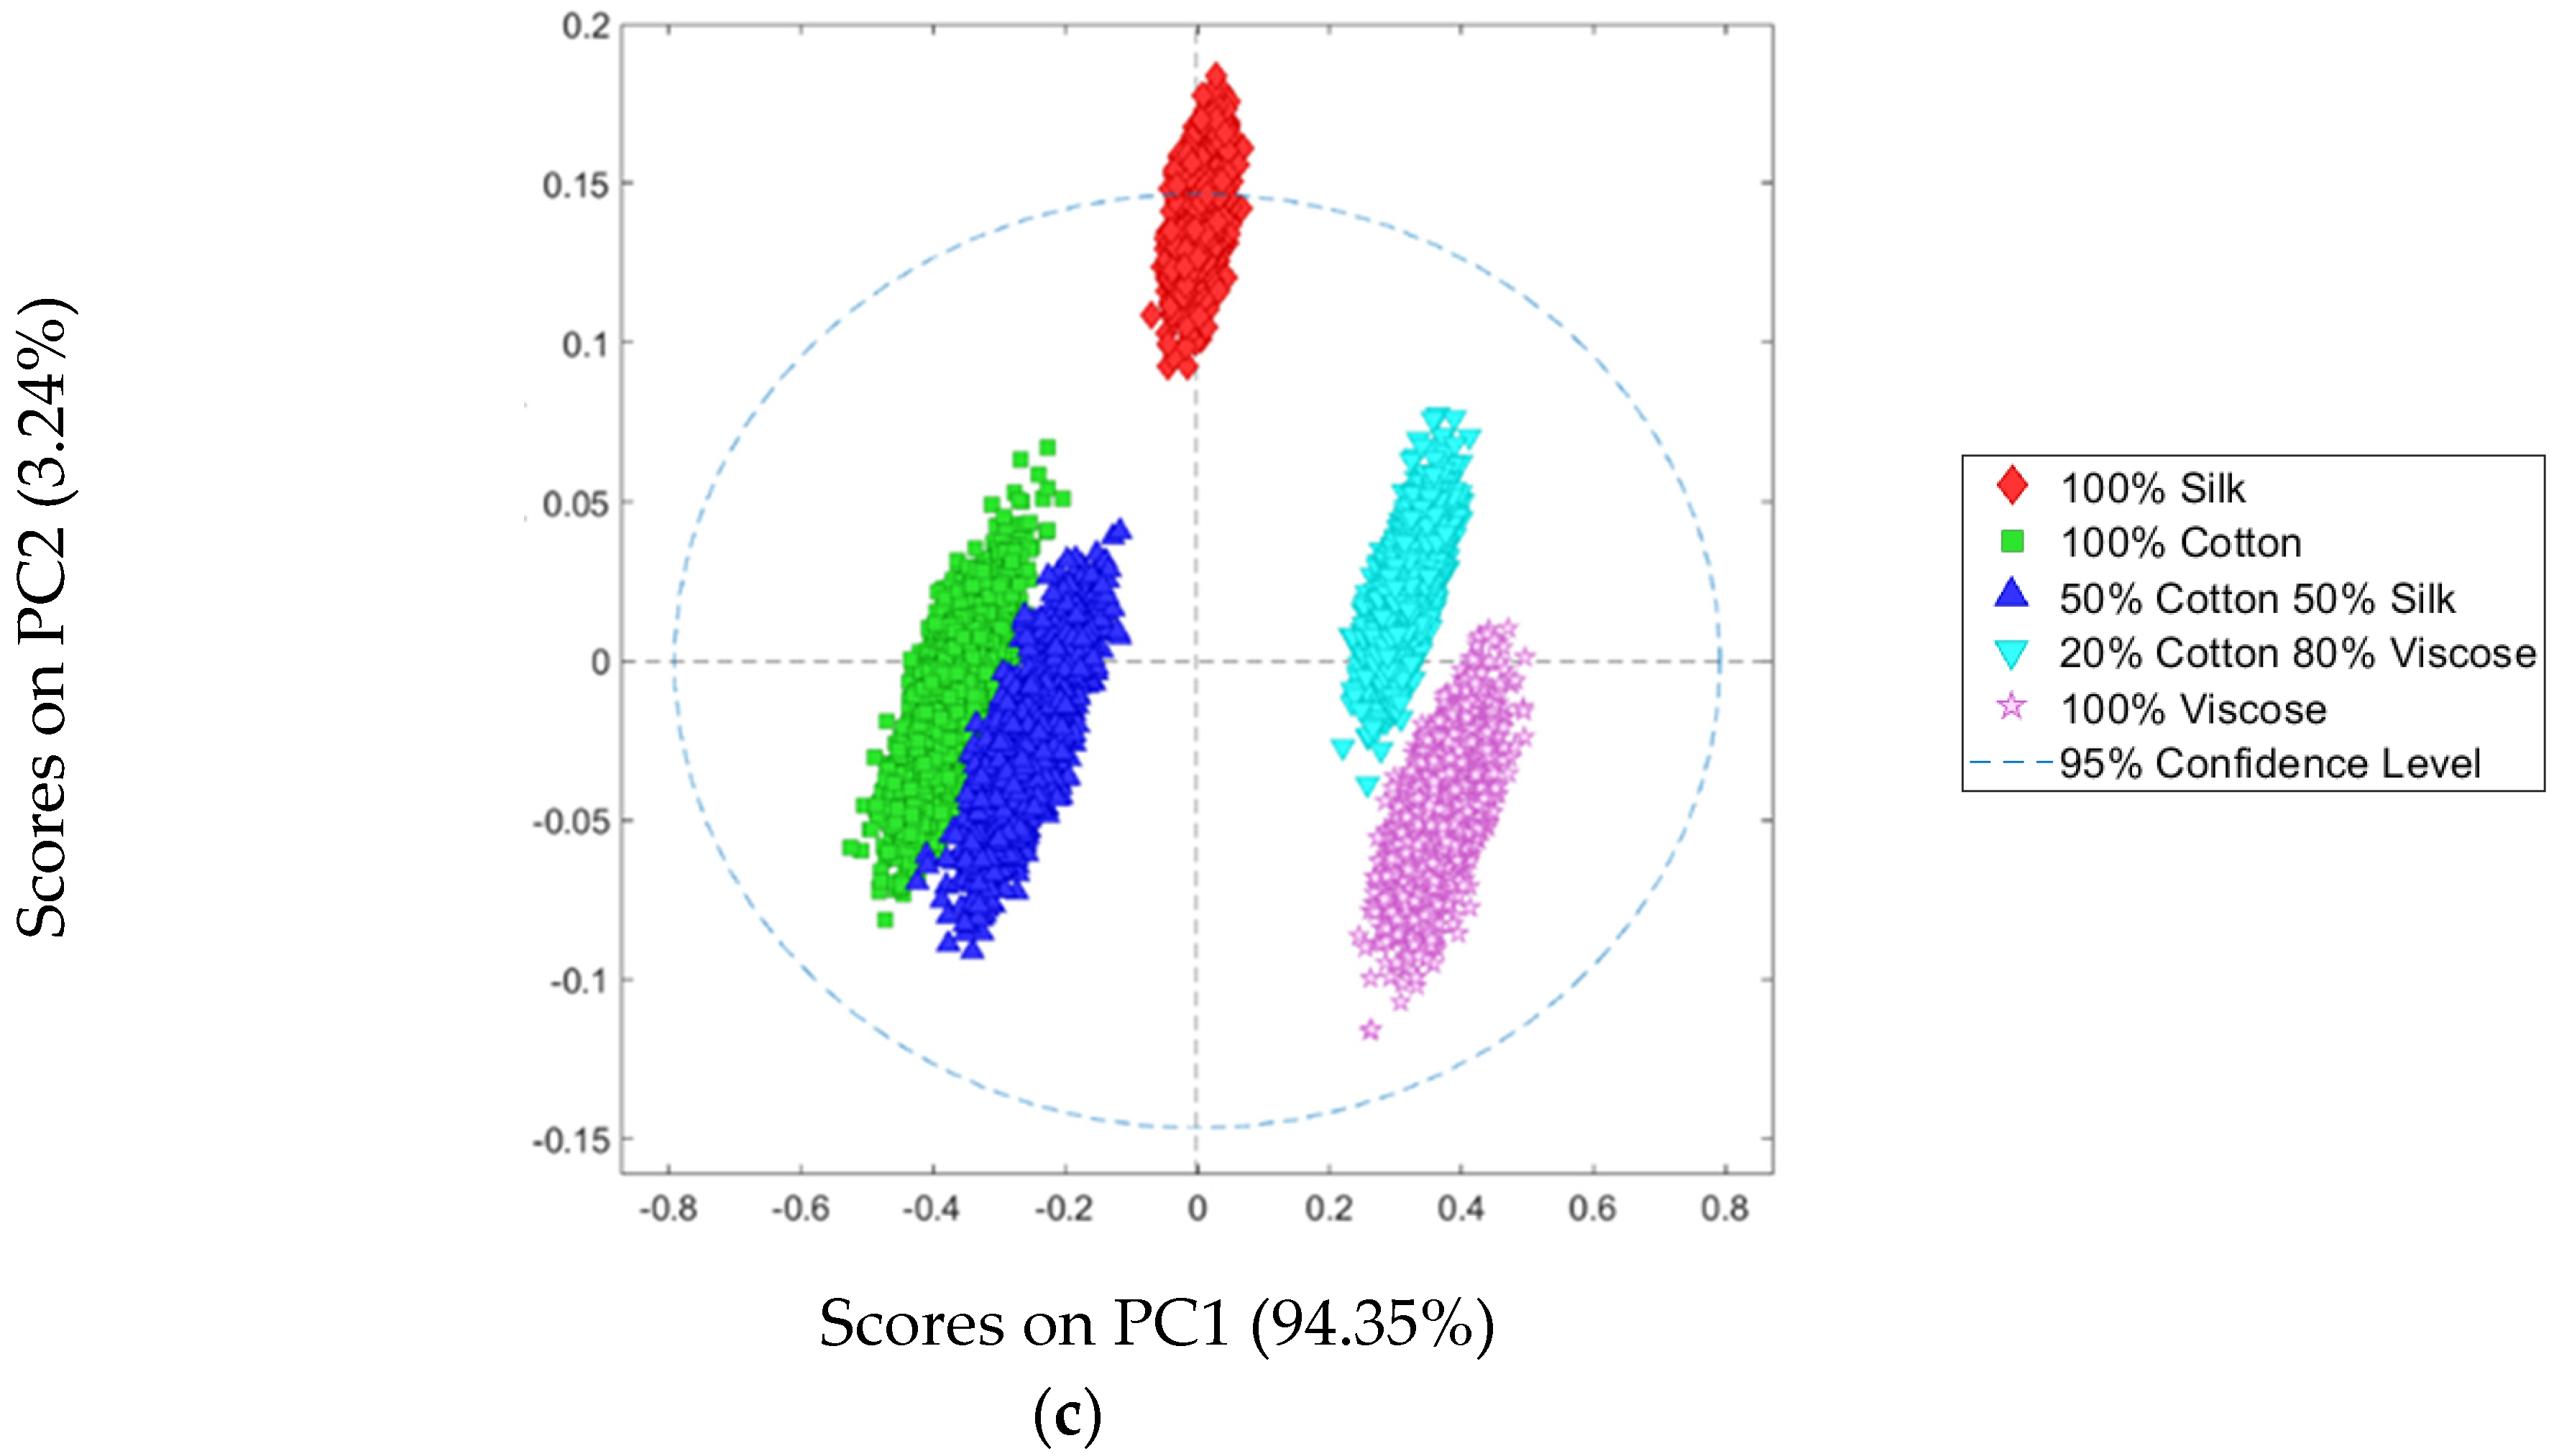
PCA score plot (PC1–PC2) for the 1st Experimental setup (a), the 2nd Experimental setup (b), and the 3rd Experimental set up (c) of the HSI average spectral signature in the NIR wavelength region (1000–1700 nm).
Figure 4.
PCA score plot (PC1–PC2) for the 1st Experimental setup (a), the 2nd Experimental setup (b), and the 3rd Experimental set up (c) of the HSI average spectral signature in the NIR wavelength region (1000–1700 nm).
Figure 5.
Digital image (a) and predicted image (b) of the three different analyzed textile types (i.e., “100% Cotton”, “20% Cotton–80% Viscose 80%”, and “100% Viscose”) corresponding to the 1st Experimental setup.
Figure 5.
Digital image (a) and predicted image (b) of the three different analyzed textile types (i.e., “100% Cotton”, “20% Cotton–80% Viscose 80%”, and “100% Viscose”) corresponding to the 1st Experimental setup.
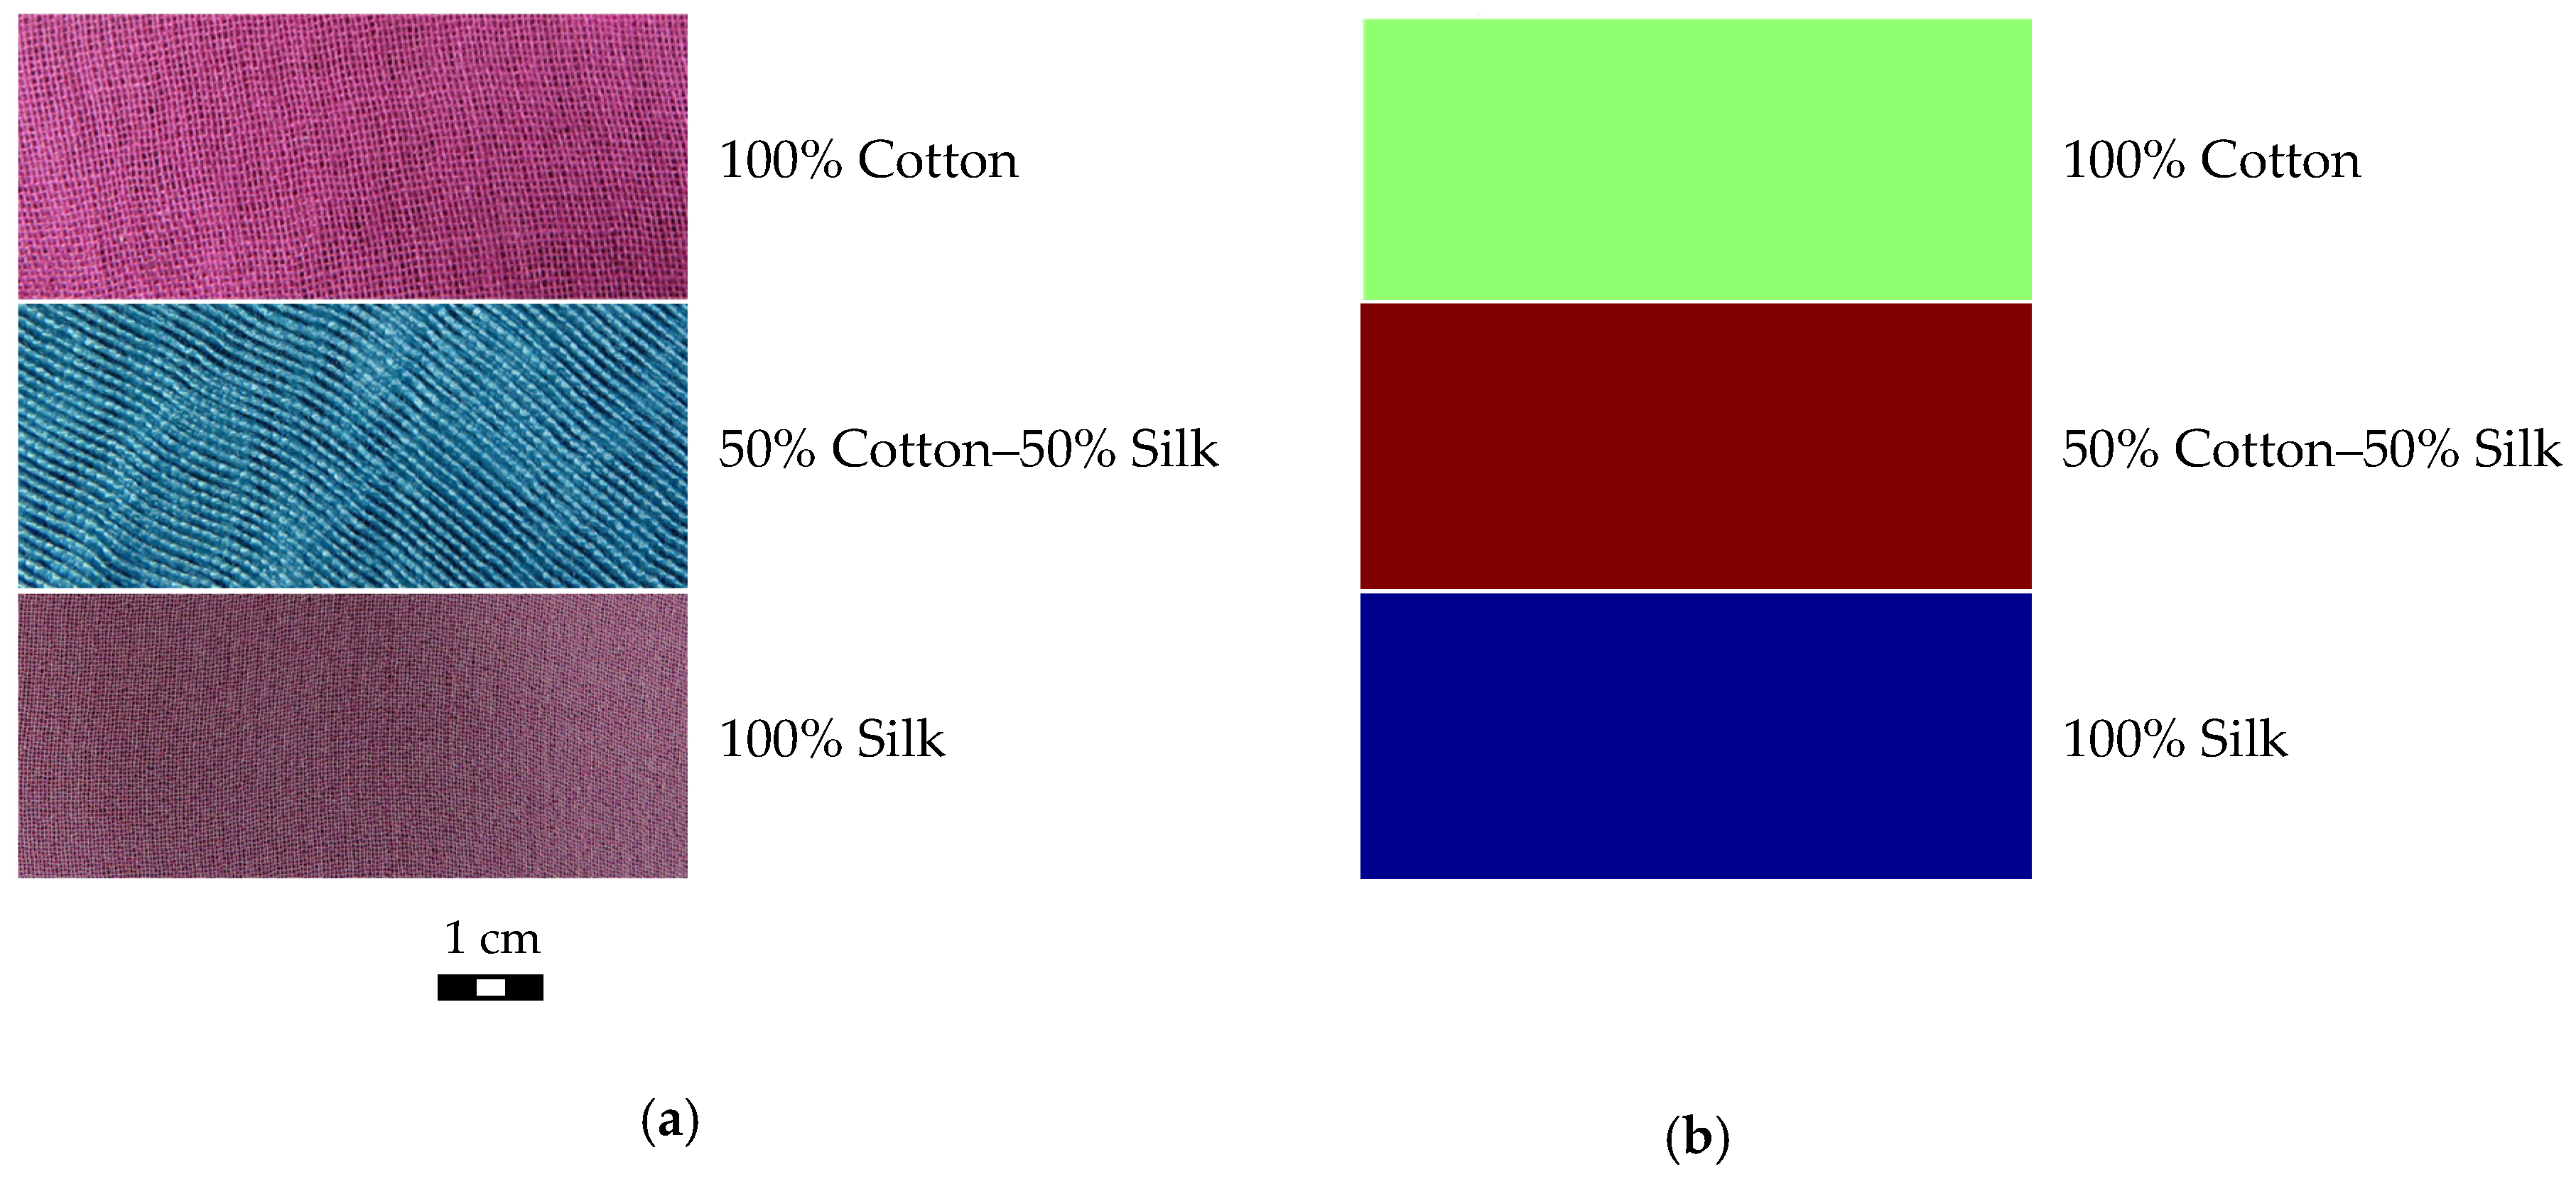
Figure 6.
Digital image (a) and predicted image (b) of the three different analyzed textile types (i.e., “100% Cotton”, “50% Cotton 50%-Silk”, and “100% Silk”) corresponding to the 2nd Experimental setup.
Figure 6.
Digital image (a) and predicted image (b) of the three different analyzed textile types (i.e., “100% Cotton”, “50% Cotton 50%-Silk”, and “100% Silk”) corresponding to the 2nd Experimental setup.
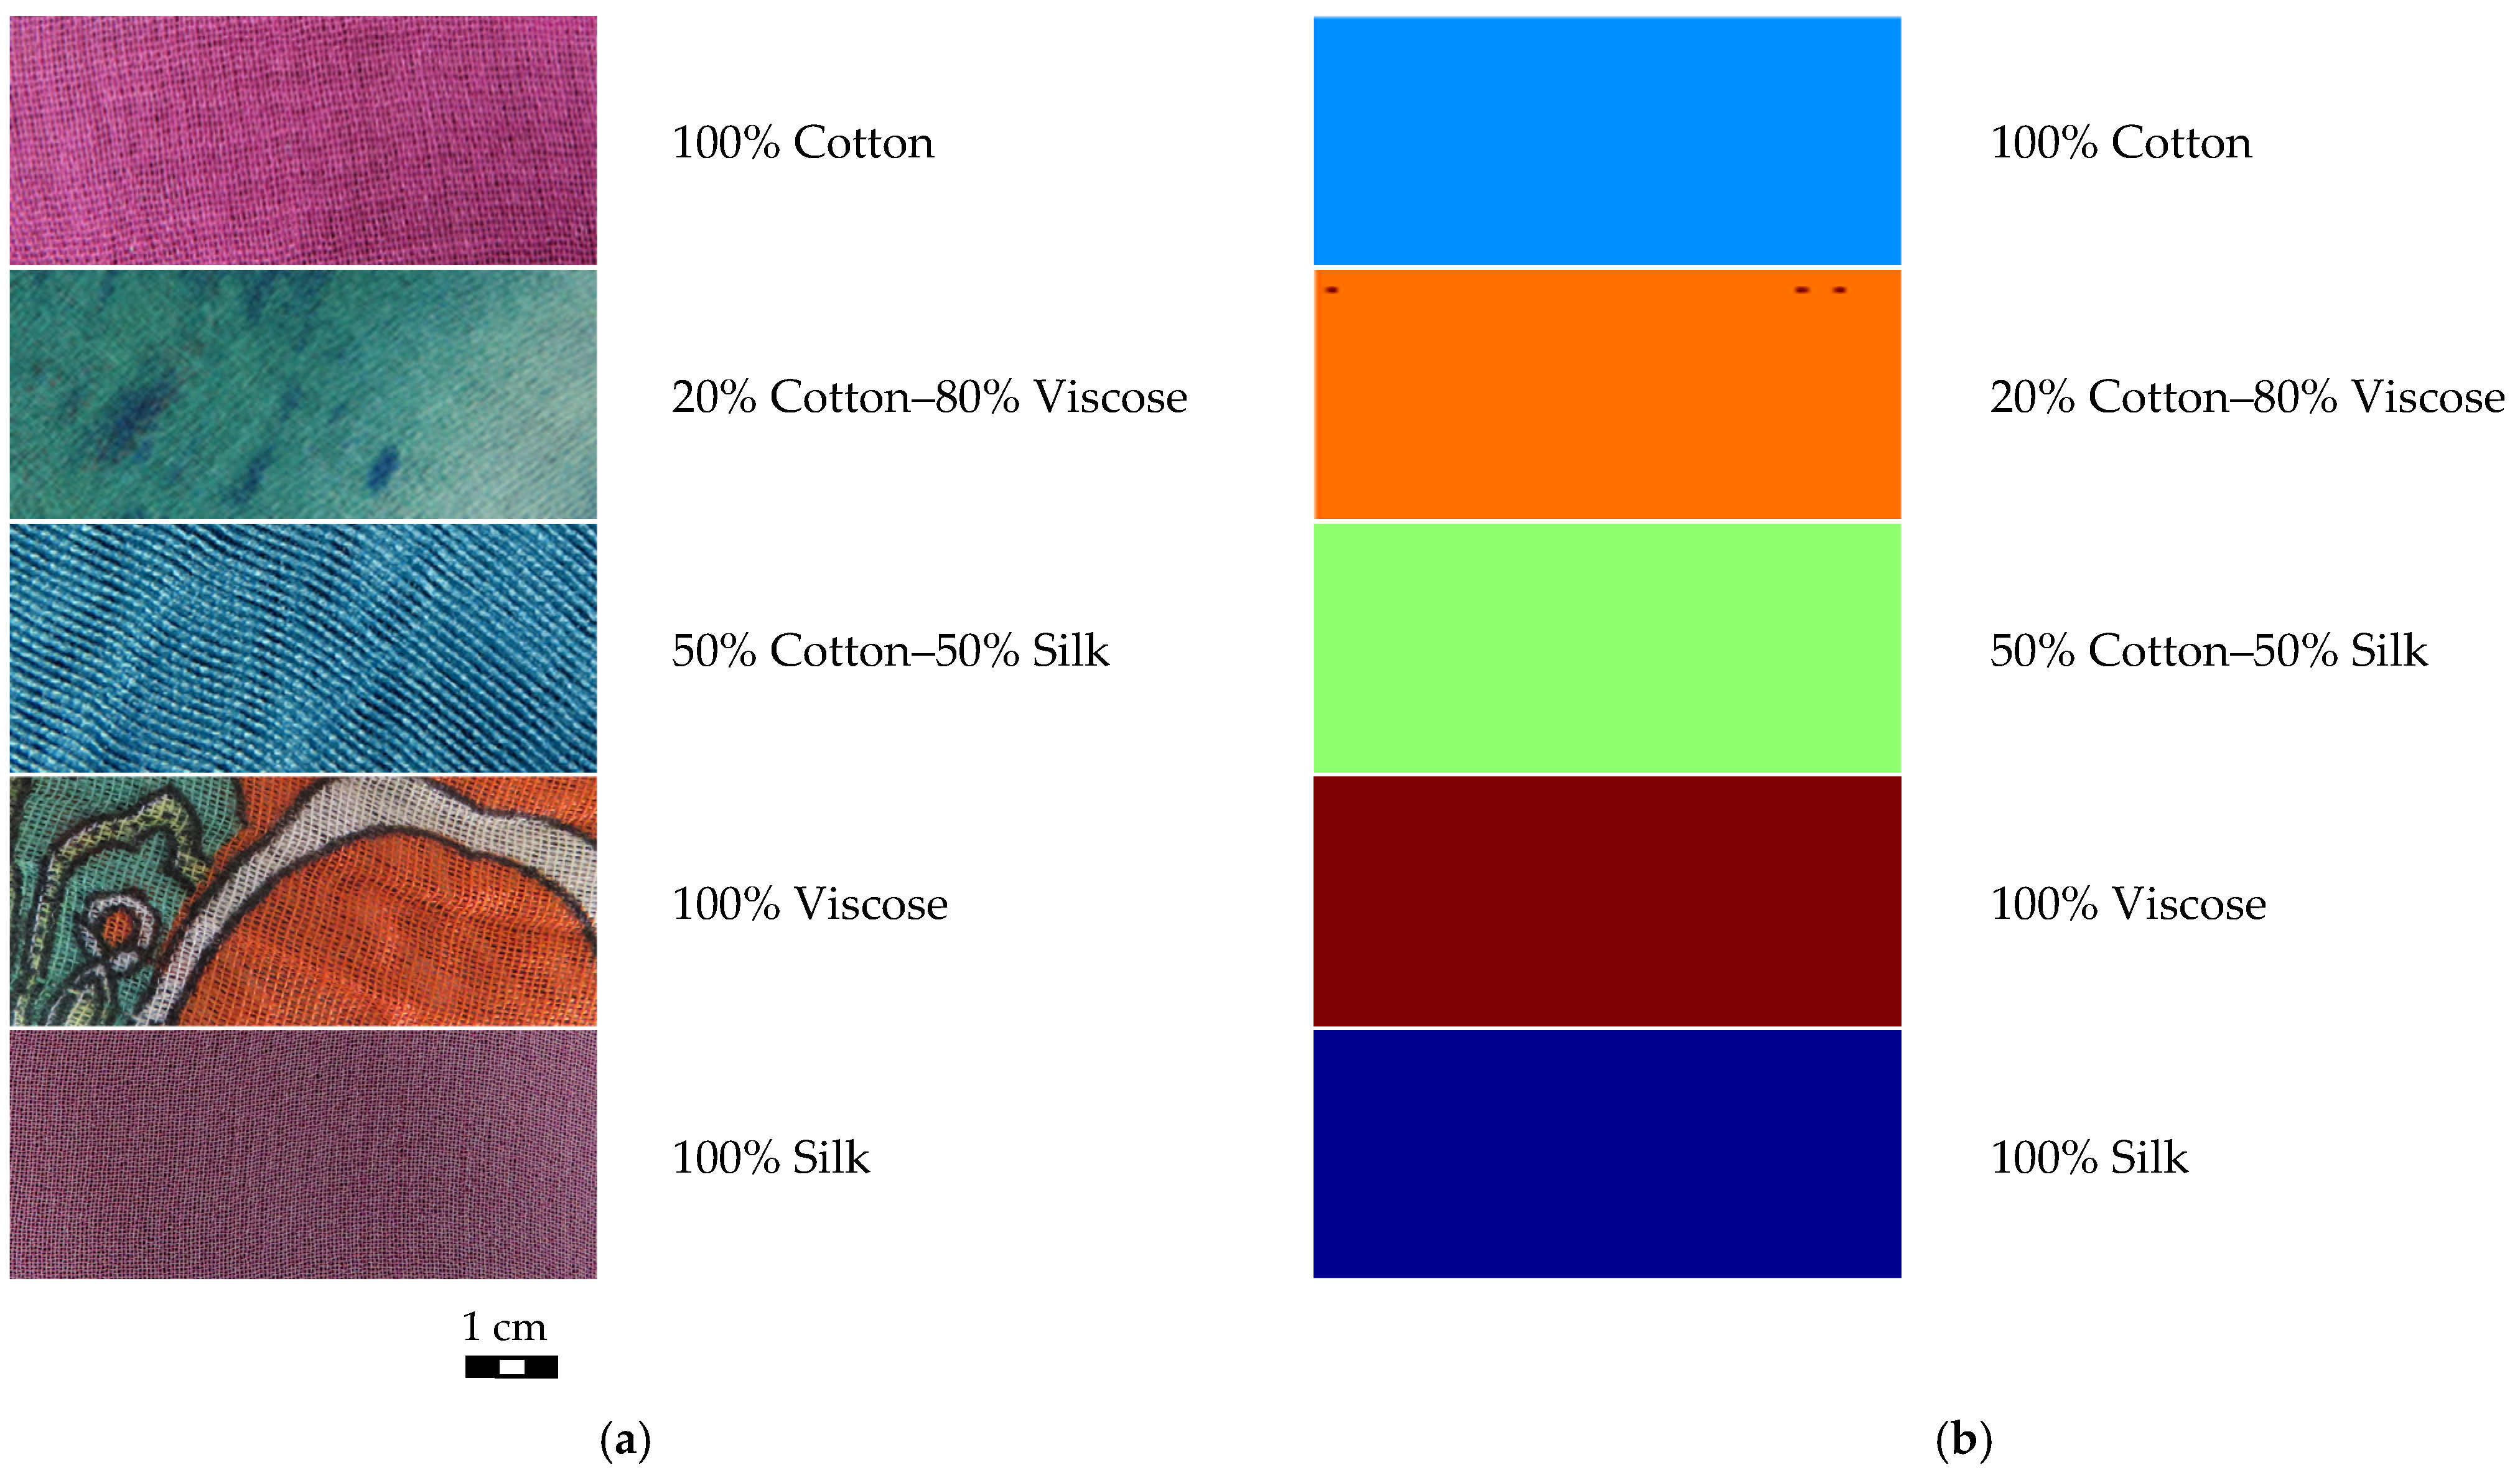
Figure 7.
Digital image (a) and predicted image (b) of the five different analyzed textile types (i.e., “100% Cotton”, “100% Viscose”, “50% Cotton–50% Silk”, “20% Cotton–80% Viscose”, and “100% Silk”) corresponding to the 3rd Experimental setup.
Figure 7.
Digital image (a) and predicted image (b) of the five different analyzed textile types (i.e., “100% Cotton”, “100% Viscose”, “50% Cotton–50% Silk”, “20% Cotton–80% Viscose”, and “100% Silk”) corresponding to the 3rd Experimental setup.
Figure 8.
Raw (a) and preprocessed spectra (b) after applying Detrend, Smoothing, and Mean Center algorithms of “100% Cotton”, “50% Cotton–50% Silk”, “20% Cotton–80% Viscose”, “100% Viscose”, and “100% Silk” samples.
Figure 8.
Raw (a) and preprocessed spectra (b) after applying Detrend, Smoothing, and Mean Center algorithms of “100% Cotton”, “50% Cotton–50% Silk”, “20% Cotton–80% Viscose”, “100% Viscose”, and “100% Silk” samples.
Figure 9.
PCA score plot (PC1–PC2) for the 1st Experimental setup (a), the 2nd Experimental setup (b), and the 3rd Experimental setup (c) on single-spot spectra in the NIR wavelength region (1000–1700 nm).
Figure 9.
PCA score plot (PC1–PC2) for the 1st Experimental setup (a), the 2nd Experimental setup (b), and the 3rd Experimental setup (c) on single-spot spectra in the NIR wavelength region (1000–1700 nm).
Table 1.
Performance indicators (prediction results) for PLS-DA classification model, based on HSI acquisition, referred to “100% Cotton”, “20% Cotton–80% Viscose”, and “100% Viscose” samples, corresponding to the 1st Experimental setup.
Table 1.
Performance indicators (prediction results) for PLS-DA classification model, based on HSI acquisition, referred to “100% Cotton”, “20% Cotton–80% Viscose”, and “100% Viscose” samples, corresponding to the 1st Experimental setup.
| Class | Sensitivity | Specificity | Err | P |
|---|
| Cotton 100% | 1.000 | 1.000 | 0.000 | 1.000 |
| Cotton 20%–Viscose 80% | 0.997 | 0.999 | 0.001 | 0.999 |
| Viscose 100% | 0.999 | 0.999 | 0.001 | 0.998 |
Table 2.
Performance indicators (prediction results) for PLS-DA classification model, based on HSI acquisition, referred to “100% Cotton”, “50% Cotton–50% Silk”, and “100% Silk” samples, corresponding to the 2nd Experimental setup.
Table 2.
Performance indicators (prediction results) for PLS-DA classification model, based on HSI acquisition, referred to “100% Cotton”, “50% Cotton–50% Silk”, and “100% Silk” samples, corresponding to the 2nd Experimental setup.
| Class | Sensitivity | Specificity | Err | P |
|---|
| 100% Cotton | 1.000 | 1.000 | 0.000 | 1.000 |
| 50% Cotton–50% Silk | 1.000 | 1.000 | 0.000 | 1.000 |
| 100% Silk | 1.000 | 1.000 | 0.000 | 1.000 |
Table 3.
Performance indicators (prediction results) for PLS-DA classification model, based on HSI acquisition, referred to “100% Cotton”, “100% Viscose”, “100% Silk”, “20% Cotton–80% Viscose”, and “50% Cotton–50% Silk” samples, corresponding to the 3rd Experimental setup.
Table 3.
Performance indicators (prediction results) for PLS-DA classification model, based on HSI acquisition, referred to “100% Cotton”, “100% Viscose”, “100% Silk”, “20% Cotton–80% Viscose”, and “50% Cotton–50% Silk” samples, corresponding to the 3rd Experimental setup.
| Class | Sensitivity | Specificity | Err | P |
|---|
| 100% Silk | 1.000 | 1.000 | 0.000 | 1.000 |
| 20% Cotton–80% Viscose | 0.990 | 0.992 | 0.008 | 0.992 |
| 50% Cotton–Silk 50% | 1.000 | 1.000 | 0.000 | 1.000 |
| 100% Viscose | 0.975 | 0.997 | 0.008 | 0.997 |
| 100% Cotton | 1.000 | 1.000 | 0.000 | 1.000 |
Table 4.
Performance indicators (prediction results) for PLS-DA classification model to perform the classification based on single-spot collected spectra of “100% Cotton”, “20% Cotton–80% Viscose”, and “100% Viscose” sample types corresponding to the 1st Experimental setup.
Table 4.
Performance indicators (prediction results) for PLS-DA classification model to perform the classification based on single-spot collected spectra of “100% Cotton”, “20% Cotton–80% Viscose”, and “100% Viscose” sample types corresponding to the 1st Experimental setup.
| Class | Sensitivity | Specificity | Err | P |
|---|
| 100% Cotton | 1.00 | 1.00 | 0.00 | 1.00 |
| 20% Cotton–80% Viscose | 1.00 | 1.00 | 0.00 | 1.00 |
| 100% Viscose | 1.00 | 1.00 | 0.00 | 1.00 |
Table 5.
Performance indicators (prediction results) for PLS-DA classification model to perform the classification based on single-spot collected spectra of “100% Cotton”, “50% Cotton–50% Silk”, and “100% Silk” sample types corresponding to the 2nd Experimental setup.
Table 5.
Performance indicators (prediction results) for PLS-DA classification model to perform the classification based on single-spot collected spectra of “100% Cotton”, “50% Cotton–50% Silk”, and “100% Silk” sample types corresponding to the 2nd Experimental setup.
| Class | Sensitivity | Specificity | Err | P |
|---|
| 100% Cotton | 1.00 | 1.00 | 0.00 | 1.00 |
| 50% Cotton–50% Silk | 1.00 | 1.00 | 0.00 | 1.00 |
| 100% Silk | 1.00 | 1.00 | 0.00 | 1.00 |
Table 6.
Performance indicators (prediction results) for PLS-DA classification model to perform the classification based on single-spot collected spectra “100% Cotton”, “100% Viscose”, “100% Silk”, “20% Cotton–80% Viscose”, and “50% Silk–50% Cotton” sample types corresponding to the 3rd Experimental setup.
| Class | Sensitivity | Specificity | Err | P |
|---|
| 100% Silk | 1.00 | 1.00 | 0.00 | 1.00 |
| 20% Cotton–80% Viscose | 1.00 | 1.00 | 0.00 | 1.00 |
| 50% Cotton–50% Silk | 1.00 | 1.00 | 0.00 | 1.00 |
| 100% Viscose | 1.00 | 1.00 | 0.00 | 1.00 |
| 100% Cotton | 1.00 | 1.00 | 0.00 | 1.00 |


