
Analysis of Changes in Innovative Management of Global Insurers in the Pre- and Post-COVID-19 Eras

1
Graduate School of Management of Technology, Sungkyunkwan University, Seoburo 2066, Suwon 16419, Korea
2
Department of Systems Management Engineering, Graduate School of Management of Technology, Sungkyunkwan University, Seoburo 2066, Suwon 16419, Korea
*
Author to whom correspondence should be addressed.
Sustainability 2022, 14(16), 9976; https://doi.org/10.3390/su14169976
Submission received: 14 July 2022
/
Revised: 6 August 2022
/
Accepted: 7 August 2022
/
Published: 12 August 2022
(This article belongs to the Special Issue Sustainable Business: Innovation, Projects and Networks)
Abstract
:This study aims to determine the changes in the innovative management of global insurers in the pre- and post-COVID-19 eras. The keywords of the CEO messages included in the sustainability reports and annual reports of 91 global insurers were used to perform network analysis based on text mining. Specifically, (1) words related to innovation as emphasized in the CEO message of global insurers were extracted, (2) keywords related to innovation in the past three years, of 2018–2020, were compared, and (3) the characteristics of innovative management were analyzed based on the connotations in these words and their structural interpretation. The results showed that the keywords emphasized by the CEOs varied each year; “market” in 2018, “risk” and “value” in 2019, and “people” in 2020. Furthermore, mapping the open innovation success factors based on the keywords extracted according to eigenvector centrality showed that the key factors exhibiting the highest centrality represented the process in 2018, the provision of resources in 2019, and governance in 2020, indicating changes in innovative management. The significance of this study lies in suggesting a directionality of change in post-COVID-19 innovative management for stakeholders, clients, and employees of global insurers.
1. Introduction
In the New Normal era, encompassing the Fourth Industrial Revolution and the COVID-19 pandemic, the insurance industry, like any other, seeks to transform its management strategies and business directions [1]. The New Normal signifies a phenomenon that has been perceived as abnormal in the past, gradually increasing in popularity and undergoing generalization towards replacement with a new standard [2]. This causes general social reformations and transitions. In economics, it facilitates the conversion to a digital economy whereby non-face-to-face business models and online services would be placed at the core [3].
Various studies have been conducted regarding innovations in the insurance industry, such as the study on the business innovation of digital insurance in the crisis era conducted by analyzing the product, process, organization, and business models [4], and the study on the propagation of marketing innovation in the service industry by reviewing prior cases in the insurance industry (1700–1914) [5]. Additionally, notable findings were reported by a study analyzing the digital trends in the post-COVID-19 insurance industry [6] and a study on InsurTech and digital insurance platforms based on a case of successful digitalization at Ping An Insurance in China [7]. These studies offered insights regarding the necessary management strategies and leadership in the digital era to Asian insurers in active preparation to adopt InsurTech and digital insurance platforms.
It is essential to establish the vision of the insurance company’s CEO and reinforce their integrated capability to ensure sustainability [8,9] to adapt to changing business environments and respond to new market conditions. A CEO message containing the CEO’s thoughts affects the organizational culture and has a great impact on the social science field [10]. Therefore, the CEO provides a message regarding the status of the company and future strategic initiatives to the company members through a sustainability report (SR). The SR thereby provides a roadmap for sustainable management while being the driving force for strategic communication by the company [10,11,12,13].
Studies on CEO messages have been conducted in diverse fields, from finance and accountancy to construction, environment, and car engineering [14,15,16,17,18,19,20,21,22,23]. Methods based on text mining are being actively developed and applied. The text mining method was used in Bang [24] to analyze CEO letters at a company in Germany, and in Uhm [25] to analyze the trends of environmental, social, and governance (ESG) management strategies. Kim and Kim [26] surveyed the CEOs of 42 insurance companies in South Korea to determine their converged opinions regarding environmental changes. The results showed that the CEOs constructed long-term strategies to respond to the rapid ongoing changes in socio-economic conditions after the COVID-19 pandemic, with increased interest in fulfilling the insurance industry’s social responsibility. The CEOs claimed that insurers should maintain a suitable balance between long-term growth and response to current issues.
Thus, this study identifies the changes in the innovative management of global insurers by analyzing the CEO’s messages, an aspect that has been neglected in previous studies. Notably, the effects of CEO messages on the innovative management of insurance companies were analyzed concerning the COVID-19 pandemic in 2019. Therefore, the CEO messages of global insurers in the period of 2018–2020 were comparatively analyzed to identify changes in the keywords. The results were used to derive a directionality of innovative management for how global insurers should respond to and prepare for the New Normal post-COVID-19 era. The findings in this study are expected to be the benchmarked data regarding the CEO’s vision and innovative innovation for insurers.
The flow of this study was as follows: First, the CEO messages of global insurers were collected, the keywords were extracted based on the criteria of eigenvector centrality, and the significance of each keyword was determined. Second, the CEO messages of global insurers in the past three years (2018–2020) were collected to comparatively analyze the keywords of CEO messages being emphasized for actual management conditions. Considering that the COVID-19 outbreak occurred in 2019, CEO messages were collected in the pre- and post-COVID-19 eras. Third, the extracted keywords were mapped with the nine reported success factors of open innovation [27]. The network was visualized to analyze the significance and structure of the changes in innovative management.
This paper is organized as follows. Section 2 analyzes the characteristics of the fields investigated in previous studies, and the unique significance of this study is presented. Section 3 describes the data collection, treatment, and analysis from text mining to network analysis and factor mapping. In Section 4, the list of keywords classified according to weight in the centrality analysis and the results of comparing the keywords in the past three years are presented through visualization based on data analysis. Section 5 describes keywords, trends compared across previous studies, and the network structure. Section 6 discusses the limitations of this study and future directions.
2. Literature Review
2.1. Trend of Research on CEO Messages
CEO messages have a critical impact on the overall socioeconomics of companies as well as on company employees. Therefore, the study of CEO messages has been conducted in the area of company finance. These studies have predicted future finance through the qualitative analysis of descriptive data [14,15] and identified the characteristics of insolvent and going-concern companies by describing security [16,17]. Studies have also suggested ways to prevent financial statement fraud through CEO messages [18,19] and analyze the CEO message with the quantitative data of company performance using the text mining method for Korean and Japanese chemical businesses [20].
Studies on CEO messages have been conducted in finance and other industrial fields. For example, in tourism, post-COVID-19 CEO messages were analyzed for hospitality businesses (hotels, tours, travel, etc.) [28]. Im et al. [28] analyzed the CEO messages of 57 hospitality companies during the COVID-19 pandemic to detect management strategies. In the environmental field, the ESG-related social responsibility of the CEO in the message and sustainability outcomes have been investigated [20]. Yook [20] applied text mining to analyze the association between the scale of environmental accounting and the CEO message found in the SR or the Corporate Social Responsibility (CSR) report across Korean and Japanese companies. The study showed that the companies with large expenditures related to the environment displayed an interest in CSR activities, that is, problems related to society and the environment. However, companies with small expenditures assessed sustainability-related activities concerning economic factors, such as growth, development, values, and efforts. Other notable studies include the one analyzing CEO communication in order to investigate sustainable organizational strategies [29] and the association between the CEO’s message on social responsibility and sustainability outcomes [22].
Text mining has been applied in several studies on CEO messages. In Bang [24], the text mining method was used to analyze the theme of the CEO’s message to the shareholders of a German company in each industry. In Uhm [25], the text mining method was used to analyze the changes in the trends of ESG management strategies based on CEO messages. Choi and Cho [21] collected CEO messages from advanced construction companies and used text mining to extract keywords emphasized by the CEO. This study reported on safety management characteristics through a visualization based on network analysis. In addition, Choi and Cho [23] extracted environment-related words emphasized in the CEO messages of advanced automobile companies and compared the tendency of keywords related to the environment, as emphasized by companies with higher and lower performance. Thus, the study showed the differences in the characteristics of environmental management across companies based on the connotations and structural interpretation of the analyzed keywords.
Furthermore, Park [30] performed an automatic text analysis of the New Year’s message of the government of North Korea, one of the most important and authoritative documents published by the government, to analyze the changes in North Korea’s domestic and foreign policies. Yun et al. [31] extracted and analyzed keywords in unstructured data, such as the CEO speech and greeting, to measure a company’s CSR directionality and scale. Yook [22] analyzed the linguistic and syntactic characteristics of CEO messages and reported that readability decreased and positive expressions were used more frequently with a stronger emphasis on future outcomes when the company showed lower sustainability outcomes.
Numerous studies on CEO messages have been conducted across diverse industrial fields, while only a few have analyzed the CEO messages in the insurance industry using the text mining method. In addition, few previous studies have analyzed only the CEO messages of the year the study was conducted. However, this study analyzed and defined the changes in innovative management in the insurance industry based on the CEO messages of the past three years.
2.2. Trend of Research on Innovative Management
Studies on innovative management have extended to diverse fields, from the definition of open innovation and its methods and innovativeness to company performance concerning open innovation. Open innovation methods involve actively utilizing ideas and technologies from external sources and transferring internal technical resources to enhance the company’s performance [32,33]. Open innovation presents a new paradigm in using these methods to maximize values and innovativeness, including new internal and external technologies and intellectual properties. Hence, open innovation activities have become a critical strategy and means of differentiation for companies to ensure continuous competitive superiority [34].
The continuous emphasis on innovative activities to reinforce the competitiveness of a company [35] has been shown to positively impact innovation and network capacities [36]. Kim and Kim [37] verified the effects of the success factors of innovation and innovation capacity on performance in manufacturing companies. This study applied CEO attitude, support, cooperation, and culture as the success factors of innovation, and R&D, production, and learning capacities as variables of innovation capacity. The results of the study showed that despite the similarity of success factors of innovation at different companies, varying outcomes were obtained depending on the innovation capacity of the company. Jang et al. [38] highlighted the importance of reinforced awareness of innovation so that various innovative activities in manufacturing companies could lead to meaningful company management performance. The study also claimed that there should be continuous and actual adherence to various educational training, and suggested policies to elicit staff participation within the organization to reinforce the awareness of innovation.
Furthermore, the characteristics of managers were reported to have an impact on the cause–effect relationship between innovative and management outcomes. According to Chang and Jang [39], diverse abilities and systematic management activities are essential for a manager to achieve an innovative outcome. However, the manager’s characteristics are critical in the company’s opportunities for growth and development. Hong et al. [40] surveyed innovative small to medium and venture companies to empirically analyze the effects of CEO management style, innovative directivity, and innovative activities on management outcomes. Thus, the results verified the association between CEO management style and management outcomes based on the cognitive process of the innovative directivity of the CEO and innovative activities by the staff.
There are many studies on the relationship between corporate management strategy, organizational culture, and management innovation. Lee [41] studied the relationship between corporate management strategy, organizational culture, and innovation. According to the results, strategy had a significant effect on innovation, whereas organizational culture did not. He suggested that innovation had a significant effect on management performance. Faruk Kalay and Gary Lynn [42] studied the impact of a strategic innovation management method on corporate innovation performance. As a result of the analysis, it was found that innovation strategy, organizational structure, and innovation culture significantly increased corporate innovative performance. Köse et al. [43] studied a case study of an extended interactive innovation management model based on a Turkish insurance company. Based on the results, the company concluded that a series of educational activities such as customer management, communication, and marketing should be carried out to improve employees’ capabilities. It was suggested that the innovation management model proposed to the company be continuously applied in the company’s digital innovation office in consideration of future policies and strategic goals. Numerous studies on innovative management have been conducted, on topics ranging from open innovation to innovativeness. In addition, the effects of innovation capacity on company performance were also investigated. Thus, these studies contribute to defining the current flow of innovative management. However, there is a general lack of studies analyzing the association between innovative management and CEO messages that could represent decision-making by the CEO of an insurance company through text mining.
Thus, this study applies text mining and performs a network analysis to analyze CEO messages and determine the changes in innovation management in insurance.
2.3. Uniqueness of the Present Study
Most studies on the characteristics of CEO messages have been conducted in finance, accounting, and the environmental field. These studies focused mainly on keywords rather than the correlations among them and identifying the sentence properties and patterns. In the insurance industry, studies applying text mining include long-term care insurance for senior citizens through keyword network analysis [44]; however, only a few studies have investigated CEO messages from the perspective of innovative management. Most studies on innovative management have been conducted using surveys or statistical analysis in the manufacturing industry, with few studies performing network analysis using keywords extracted using text mining from CEO messages.
Compared to previous studies, this study has the following characteristics and significance: (1) the analysis of CEO messages applied the perspective of innovation management to the insurance industry; (2) instead of using the conventional methods of performing a survey or interview, the data of CEO messages reflecting the most recent opinions were collected, and the changes and characteristics of innovative management were comparatively analyzed; (3) the data collection and analysis involved the most recent data from the SR and annual report (AR) so that the latest trend could be identified based on the CEO messages of global insurers; and (4) the findings may serve as practical data regarding the directionality of management strategies and visions according to the changes in the innovative management of global insurers.
3. Materials and Methods
3.1. Data Collection
Company selection was based on the Brandirectory list of the top 100 insurance companies of 2020 that reported the annual company rankings [45]. Among the 100 insurance companies (2020), the top 1–100 ranks were selected, and their CEO messages were obtained from their SRs and ARs. Brandirectory is an institution that investigates and reports the company’s sales and reputation in each industry, quoted in the reports of prominent consulting companies, such as Deloitte. In addition, Marsden et al. [46] identified the top 100 global financial brands using the Banking 500 league table of Brandirectory. The CEO message in each company’s SR and AR is an official message that emphasizes its performance, visions, and policies in the respective year [47]. As the latest year in this study was 2021, SRs or ARs presenting each company’s performance for 2020 was selected, and the top 100 companies were selected accordingly. However, publishing these reports is not a legal requirement, so CEO messages were only collected from companies that had published the reports. Thus, the CEO messages were obtained from the SRs and ARs that were published in 2021 and reflect each company’s performance in 2020.
We visited the website of each company and downloaded the necessary reports to collect the SRs and ARs of the top 100 companies. Therefore, CEO messages were obtained from 91 reports: SR (n = 44) and AR (n = 47). Most reports were in English and the native language of the respective country. However, the reports of three companies were written in Hindi, German, and Spanish. Four reports were without a CEO message and two were in secure PDF formats to prevent conversion to TXT formats; nine reports were excluded. The obtained reports were in PDF or HTML format, so they were converted to TXT format to extract the CEO message. Considering the COVID-19 outbreak in 2019, CEO messages for 2018–2020, including the three years in the pre- and post-COVID-19 eras, were collected and analyzed. The flow of the study is shown in Figure 1.
3.2. Data Preprocessing
The data collected in the TXT format are unstructured data composed of text. The data should be pre-processed in order to perform an analysis based on text mining [48]. For the data pre-processing in this study, the R statistical computing software (version 4.0.2) and the NLP-based package were used. Next, complete sentences were divided into words to generate a corpus. For “Innovation” and “innovation”, lowercase letters were used in both instances, as they were identical. Spaces, senseless articles, and prepositions (“a”, “an”, “of”, “the”, and “for”), numbers, and signs without any effects were removed. The names of the top 100 companies, country names and meaningless words (“AIA”, “China”, “year”, etc.) were removed. Analogous terms such as “COVID”, “COVID-19”, and “coronavirus” were extracted and turned into a single word, “COVID”. From complete sentences, those containing the word “innovation” and those containing words analogous to “innovation” were extracted to widen the range of collected words. The words “change” and “advance” were considered to be analogous to “innovation” in Lee [49]. Lee and Yi [50] mentioned that “change”, “reform”, and “revolution” shared an analogous concept with “innovation”. Thus, the sentences containing the word “innovation” or the similar words “change”, “reform”, “revolution”, and “advance” were extracted, and a single TXT file was generated. The keywords and frequency data were extracted to generate the comma-separated values (CSV) in a data frame format.
3.3. First Network Analysis
The method of analyzing sentences and their contents is referred to as language network analysis, in contrast to the conventional text analysis, where only the word frequency is analyzed [51]. The analysis, thus, allows for the extraction of concepts that reflect various intrinsic characteristics of a message expressed in texts, the identification of semantic relationships among words, and the quantification of relationships across specific concepts [51].
A network is a structure of connected nets that indicates the interactions among relational attributes [52]. The node referring to the agent indicates the words, and the link indicates the relationship between two relational words [53]. In conventional text analysis, the basic relationships and structures can be identified [54], and the form of analysis is identical to social network analysis (SNA) [53]. However, directionality is excluded in the analysis of messages because the words are interconnected [55].
Density and centrality are the most frequently used analyses to identify the influence of network structures and components [56]. In density analysis, the connection between the nodes in the network is analyzed, and a high-density network exhibits a rapid distribution of data as data exchange is activated [57]. In contrast, centrality analysis is the most widely used quantitative analysis to identify the keywords of the network [52]. Gephi version 0.9.2 was used in this study, as it is widely used across studies based on the great visualization function and the open-source centrality analysis, whereby the node importance is defined, and the key nodes are determined and ranked [58].
In centrality analysis, the types of centralities are as follows: degree, betweenness, closeness, and eigenvector [59]. For degree centrality, the centrality of a specific node at the center of the network was measured [52]. A node showing many degree lines has a high degree of centrality because it indicates the exchange of popularity, interest, attention, needs, and demands with other nodes [52]. The calculation of degree centrality uses the maximum number of connectable lines of the degree. The degree centrality analysis defines data directionality, whereas degree centrality is classified into in-degree and out-degree [59]. The interpretation of in-degree and out-degree centrality indicates authority or popularity for the former and activity for the latter [60].
For betweenness centrality, the mediation of one node with other nodes in the network was measured [61]. While a node with centralized connections exhibits degree centrality, a node taking the position of a mediator among different nodes through only a few lines of degree without popularity, authority, interest, or demands exhibits betweenness centrality [52].
For closeness centrality, the measurement is based on all degrees, from direct to indirect, identified by degree centrality [62]. The difference between closeness and betweenness centrality is that the latter shows the number of nodes mediated by a specific node in the network [52]. Hence, it is difficult to identify the influence of a given node solely based on closeness and betweenness centrality.
For eigenvector centrality, the node’s centrality is used to measure its influence [59]. Moreover, in eigenvector centrality, not simply nodes in connection but also their weight and centrality in the vicinity are considered [59]. Thus, considering these, the analyses in this study applied betweenness, closeness, and eigenvector centralities.
3.4. Mapping of the Nine Success Factors of Open Innovation
Words were extracted to include the top 30 words with the highest levels of betweenness, closeness, and eigenvector centralities, and the centrality values were listed. Based on the three centrality results, the importance of the node was measured based on the weight given to the word as follows [21]: For instance, taking B: betweenness centrality, C: closeness centrality, and E: eigenvector centrality, the weight for B ∩ C ∩ E is 3, the weight for B ∩ C or B ∩ E or C ∩ E is 2, and the weight for B or C or E is 1 [21].
After the list of words with weighted values was generated, the indices were mapped and classified to analyze the characteristics of the collected words. Among the success factors of open innovation, three that reflect the latest research trends were selected [27].
The mapping analysis in this study used the following nine success factors of open innovation suggested by Durst and Ståhle [27]: (1) relational issues, (2) involvement of people in open innovation, (3) governance, (4) facilitators, (5) resource provisions, (6) strategy, (7) open innovation process, (8) leadership, and (9) culture. Considering the terms analogous to “innovation”, sentences containing the words “innovation”, “change”, “reform”, “revolution”, and “advance” were extracted. They were then mapped by identifying the sense of these words, sentences, and contexts.
The nine success factors of open innovation suggested by Durst and Ståhle [27] are defined as follows: (1) relational issues are the overall communication skills and trust; (2) people involved in the open innovation process are the participants with devotion and motivation; (3) governance is the mechanism and structure; (4) facilitators are the promoters; (5) resource provision is the distribution of time, workforce, and resources; (6) strategy is the tactics applied; (7) open innovation process is the process unique to open innovation in contrast to closed innovation; (8) leadership is the capacity of an organization related to leadership and management, and (9) culture is the unique organizational culture of open innovation in contrast to closed innovation.
The final factor mapping was confirmed through interviews with ten experts, including workers with a career length of ten years in open innovation at a large company, accelerators fostering start-ups for at least ten years, and investors who locate and review potential start-ups. The interview period was from 12 February to 4 March 2022. Factor mapping based on interviews with ten experts was undertaken to ensure the objectivity of the data. Each word was mapped onto three success factors for open innovation. For multi-mapping factors with four or more mapped factors, the priority was set based on eigenvector centrality to select the top three factors. The mapping data with set priority after multiple mappings were converted to 2-mode alignment to exhibit word relationships.
3.5. Second Network Analysis
This study aims to identify which of the nine success factors of open innovation exhibited the greatest influence in the past three years (2018–2020) and determine the variation in the characteristics of innovation management through network analyses. In the secondary network analysis, 2-mode alignment was performed on the keywords mapped with the nine success factors of open innovation, followed by conversion to a 1-mode alignment. Hence, the 2-mode alignment with two entities in different rows and columns was converted to a 1-mode alignment to identify correlations with the success factors of open innovation. In addition, the entities in identical rows and columns were classified as a single entity, and the MMULT and TRANSPOSE functions in Microsoft Excel were applied [63].
Eigenvector centrality analysis was performed to determine the key nodes [64]. The top ten keywords from the data for three years (2018–2020) were comparatively analyzed based on eigenvector centrality. Networking and links to the key node were interpreted for the nine success factors of open innovation. The results were visualized using Gephi version 0.9.2 software [54]. Through eigenvector centrality analysis, the success factors of open innovation and the characteristics of their relationships are visualized.
Table 1 presents the results of this study. The words from the data for the three years from 2018 to 2020 were compared based on keyword analysis in Category 1. The words extracted from Category 1 were mapped to the nine success factors for open innovation in Category 2. A list of keywords with weight values was summarized.
4. Results
4.1. Word-Based Network Analysis
The top 30 words with the highest betweenness, closeness, and eigenvector centralities, as shown in Table 2, Table 3 and Table 4, were extracted [21]. In all three years (2018–2020), the words “business”, “development”, “technology”, “company”, “growth”, “development”, and “product” were all linked with the top ten words. These are the top ten words in all centrality analyses; they are the most critical. Nevertheless, this study focused on keywords that varied according to year.
Table 2 shows that the word “risk” had a low eigenvector centrality but a high betweenness centrality in 2018. The words “partner”, “client”, and “channel” appeared within the top 30. The word “market” was among the top keywords indicating market growth and expandability in 2018. The growth of the expanded market could be seen through digitalization. Based on this, the potential growth in the market or extended scope could be considered. Notably, as part of digitalization, the process related to insurance payment could be introduced and improved using the banking software and data analysis upon the insurance payment review and insurance accident investigation [3]. This implies that enhanced digital services and channels within established systems could offer new experiences to clients.
Table 3 shows that the word “risk” had high betweenness, closeness, and eigenvector centralities in 2019, along with the newly emerged word, “value”. The words “platform” and “future” appeared within the top 30. The word “risk” indicates the emphasis on market regulations and the social, cultural, and economic risks. The appearance of the word “platform” predicted the activated insurance sales through various platforms, including online and mobile channels, while new and potential clients were expected to emerge [3]. Furthermore, the conversion of the work environment towards higher efficiency during the COVID-19 pandemic implied the start of the new system application regarding the employment process, work environment, and training policies to suit the telecommuting environment.
Table 4 shows that the word “people” emerged among the top keywords in 2020, compared to 2018 and 2019. The words “growth”, “challenge”, and “team” appeared within the top 30. In 2020, the word “people” emphasized the need for professionality regarding the motivation of the team, fluent communication among team members, and their collaboration capacity underlying innovation. With the increased demand for telecommuting due to the COVID-19 pandemic, the key human resources should be efficiently developed, maintained, and utilized. The resources should be distributed based on needs. The words that emphasized the change in the future work environment were linked.
4.2. Weight Loading on the Words
According to the centrality results, the classification and analysis of the words with weight values are as follows: words ranked within the top 30 for the highest levels of betweenness, closeness, and eigenvector centralities were given a weight value of 3. Words ranked within the top 30 for the highest levels of the two centrality types were assigned a weight value of 2. Words ranked within the top 30 for the highest level of at least one of the three centrality types were assigned a weight value of 1 [21].
As shown in Table 5, a total of 19 words, including “business” and “management”, were in the Weight 3 clusters in 2018, while 10 words, including “industry” and “partner”, were in the Weight 2 clusters and 11 words including “process” and “mentality” were in the Weight 1 cluster. In 2019, a total of 17 words including “technology” and “advancement” were in the Weight 3 clusters, 10 words including “structure” and “strategy” were in the Weight 2 clusters, and 19 words including “investment” and “market” were in the Weight 1 cluster. In 2020, 22 words including “people” and “opportunity” were in the Weight 3 clusters, 7 words including “challenge” and “project” were in the Weight 2 clusters, and 10 words including “community” and “sustainability” were in the Weight 1 cluster.
4.3. Mapping of the Words with the Success Factors of Open Innovation
The weighted words and success factors of open innovation were mapped according to the weighted cluster. The results are presented in Appendix A. Table A1 shows the correlations of the words in the Weight 3 cluster for 2018 and the nine success factors of open innovation. Among the nine success factors, governance, culture, and strategy were multi-mapping. Table A2 shows the correlations of the words in the Weight 2 cluster with facilitators, leadership, and strategy in multi-mapping. Table A3 shows the correlations of the words in the Weight 1 cluster, with people displaying a lack of mapping.
The results of mapping the weighted words for 2019 and the success factors of open innovation are shown in Table A4, Table A5 and Table A6. Table A4 shows the correlations of the words in the Weight 3 cluster with all factors in mapping and relational issues, culture, and strategy in multi-mapping. Table A5 shows the correlations of the words in the Weight 2 cluster with culture and strategy in multi-mapping. Table A6 shows the correlations of the words in the Weight 1 cluster with relational issues, people, and processes in multi-mapping.
The results of mapping the weighted words for 2020 and the success factors of open innovation are shown in Table A7, Table A8 and Table A9. Table A7 shows the correlations of the words in the Weight 3 cluster with all factors in mapping and governance, process, and strategy in multi-mapping. Table A8 shows the correlations of the words in the Weight 2 cluster, with facilitators and leadership being unmapped. Table A9 shows the correlations of the words in the Weight 1 cluster, with governance and process in multi-mapping and leadership being unmapped.
4.4. Factor-Based Network Analysis and Visualization
After mapping the weighted words with the success factors of open innovation, eigenvector centrality analysis was performed to identify the correlations among the success factors, and the network was visualized [65]. The network for 2018 based on the eigenvector centrality analysis is presented in Figure 2. The key node is process, with strong links to the green nodes of governance and strategy. The network for 2019 is presented in Figure 3. The key node is provision of resources, with strong links to the purple nodes of relational issues, people, and culture. The network for 2020 is shown in Figure 4. The key node is governance, with strong links to the purple nodes of people, culture, and process. The peripheral node of all three years (2018–2020) was leadership, which displayed the weakest links.
5. Discussion
5.1. Keywords Extraction and Variation
The keywords exhibiting significant variations across the three years were extracted from the keyword analysis. As shown in Table 6, the new keywords linked within the top 10 words of the highest eigenvector centrality were “market” in 2018, “risk” and “value” in 2019, and “people” in 2020. Based on these keywords that newly emerged in the CEO message within the top 10 words of each year, the changes in the innovative management of global insurers could be examined. An example sentence containing the newly emerged keywords in the CEO message is as follows.
“There is a broad prospect for product and service innovation in line with the market trend …”.
“to the operational guideline of “prioritizing business value, strengthening sales force, achieving stable growth, upgrading technology, … as our strategic core, making new strides in shouldering corporate social responsibility, quality development, technology empowerment, reform and transformation, and risk prevention and control …”.
“We have a commitment to provide new value our customers and society expects from us …”.
“We kept investing in digital innovations and foundational technologies, in people and in our businesses…”
As the example depicts, emphasis was placed on the importance of advancing into the market in 2018, before the COVID-19 outbreak. This indicates that a foundation was established to advance towards digitalization by applying digital services reflecting market needs. In addition, insurers responded to the flow of the market by applying digital technologies such as AI-based underwriting automation, and developing platforms that allow mobile insurance subscriptions. Therefore, the insurers that had entered the digital transition period were moving from the simple provision of insurance services towards the use of digital technologies to provide risk prevention services, leading a paradigm shift [66].
With the outbreak of COVID-19 in 2019, the emphasis was on the importance and value of risk management. Durst and Ståhle [27] claimed that resource provision included keywords such as risk, potential client search, environment, and value; these keywords were extracted in this study. This indicates that insurers created novel values according to client needs and delivered new values to clients against competitors to achieve client value innovation. The insurers establish a virtuous cycle that provides the driving force towards client values and, through innovation, strive to contribute to enhancing enterprise values. The insurers also increase their dependency on new technologies and data sources to reconsider efficiency, reinforce cyber security, and improve the overall capacity of the organization. Changes such as process simplification and client-tailored service provision through automation ultimately reflect the insurers’ will to improve client experience [67].
After the COVID-19 outbreak, the focus was placed on the importance of people. The COVID-19 pandemic highlighted communication with employees and their participation, motivation, and creation of a new organizational culture. This indicates that the responsibility for decision-making based on project execution goals and issues has been emphasized [31]. In addition, the competition for employing able individuals deepened in the circumstances after the COVID-19 outbreak, posing challenges to acquiring human resources. The competition for recruiting individuals with strong IT development and data analysis capabilities was notably high, consistent with the digital transition. Deloitte [67] showed that insurers were faced with the challenge of discovering and fostering talented individuals, especially human resources, in technological fields, along with maintaining and advancing the digitalized operation system.
5.2. Characteristics of Innovative Management
In this study, based on the success factor mapping of open innovation for each keyword with analyzed centrality, inferences were drawn regarding the trends, characteristics, and changes in emphasis in open innovation management. The finding in this study is that the digitalization target of the insurers moved beyond the application of the conventional processes and business models towards the overall digital transition over three years, consistent with Kim and Kim [26]. In addition, Kim and Kim [26] reported that CEOs gradually recognized the importance of ESG, which is also consistent with this study. However, this study was distinguished from Kim and Kim’s [26] on the CEOs of Korean insurers, where the CEOs recognized the importance of social responsibility (S), emphasizing the three values of ESG.
Mapping the keywords and the success factors of open innovation showed that the emphasis was on the process in 2018. As Figure 2 shows, the process strongly links to governance and strategy. Governance indicates the mechanism and structure of the open innovation process, while strategy indicates the execution of the innovation process. This lent a degree of support to previous studies reporting that insurers strive to develop insurance packages by applying different techniques and understanding the technology life cycle [27,31]. It can thus be presumed that insurers perceived changes in market mechanisms and the start of digital services.
In 2019, the emphasis was on resource provision. As shown in Figure 3, the provision of resources is strongly linked to relational issues, people, and culture, in structural terms. The COVID-19 era appears to have highlighted the response to external risks and decision-making based on risks, social connections, economics, and partnerships, emphasizing the time and availability of resources for open innovation. In addition, this supports a previous study [27] that emphasized the balance between innovation and general tasks, communication skills, and organizational culture, including trust. Thus, insurers provide an environment to boost productivity, including flexible work options consistent with telecommuting due to the COVID-19 pandemic.
In 2020, the emphasis was on governance. As Figure 4 shows, governance exhibits strong structural links to people, culture, and process. Therefore, education and culture, such as networking and knowledge sharing, were highlighted in 2020. This indicated a phase of restructuring the workforce and organization and monitoring market fluctuations as a strategy to respond to the COVID-19 pandemic. The insurers recruited MZ-generation staff to replace the aging workforce with the long-term goals of human resource management. In addition, this coincided with a previous study [68] emphasizing more vigorous recruitment of individuals with advanced data analysis and automation technology skills to promote more rapid and effective digital innovation.
Furthermore, Governance is one of the ESG; “Environmental”, “Social”, and “Governance” structures, a factor related to the sustainable growth of enterprise [31]. This implied that insurers valued society and the environment and strived to provide positive impressions to clients. This indicates that, as in previous studies [69,70,71], the culture in which clients show preference toward products of companies that contribute to society has spread. In contrast, companies could enhance their values through positive reviews by stakeholders and investors. With the continuation of such a virtuous cycle of clients and companies, potential sales increases and sustainable growth are anticipated.
6. Conclusions
This study investigated official CEO messages through text-mining analysis of the SR or AR, rather than through a survey or interview of CEOs. Network analysis was performed on text mining and the mapping of innovation factors using the CEO messages of global insurers. Furthermore, the characteristics of innovative management were identified. The significance of this study lies in the extraction of keywords through the analysis of the CEO messages of global insurers, and in the detection of the changes in open innovation success factors in the past three years.
The implications of the results of this study are as follows. The CEO messages contain words related to the directionality of innovative management, and reflect the current circumstances faced by the company. Thus, this indicates the strong interest and will of each CEO in regards to innovation. The CEO’s message is significant in suggesting the directionality of innovative management to stakeholders, clients, and employees, as it contains diverse words directly connected to innovation. From a practical point of view, it can be used to provide data that can be used by stakeholders, customers, and executives and employees to understand various market contexts such as the digital environment and the impact of climate change after COVID-19. In addition, it can be used to provide monitoring data to lead the insurance industry for insurers that are aware of the importance of corporate social responsibility. The significance of this study is as follows. First, from a theoretical perspective, the actual and official CEO messages were examined through keyword and network analyses with visualized results, rather than through statistical quantification, to suggest a novel research method regarding the directionality of innovative management strategies. Second, from a practical perspective, insights to lead healthy financial culture were provided through financial innovation, the enhanced competitive edge in financial markets, and the continuous appeal of future growth engines. Finally, from a political perspective, insights were provided to resolve the issues of sales channel diversification and information asymmetry, consistent with the digital transition. The analysis of the CEO messages of insurers and the entire finance industry, including banks and stock markets, may allow the directionality of innovative management to be determined regarding the study of financial policies.
In this study, CEO messages (including letters and statements) in the SRs or ARs were collected for the top 100 insurance companies in 2020, as announced by Brandirectory in their annual report. Furthermore, CEO messages were collected from companies ranked within the top 100 in 2020 for three consecutive years over 2018–2020. Thus, a limitation of this study is that the company rankings in 2018 and 2019 were not reflected. There could have been companies that had entered or fallen out of the top 100 in these two years. In addition, as the study investigated the last three years, while the COVID-19 pandemic persisted, future studies may extend the period for further investigation.
More studies should be conducted on CEO messages regarding innovation. First, CEO messages regarding innovation may be analyzed for the upper and lower groups of open innovation characteristics. Through this, the differences in perspectives on innovation between the upper and lower groups will be discovered. Based on the results, the directionality of innovation from market leaders can be discussed. Second, CEO messages of companies that have continuously maintained their top ranks may be analyzed. The insurance company rankings are updated each year by Brandirectory, with the change in ranking highlighted based on the rank of the previous year. Companies that have maintained the top ranks for three or more years can be presumed to be executing sustainability management. Analyzing the CEO messages of such companies will be significant, as the companies may be leaders in sustainability management and innovation. Finally, CEO messages may be analyzed by country and continent. Such studies will allow insurers to benchmark the directionality of strategy across different countries. Notably, a significant insight may be gained for developing the market advancement strategy of global insurers.
Author Contributions
Conceptualization, H.J.K.; methodology, H.J.K.; software, H.J.K.; validation, K.T.C.; formal analysis, H.J.K.; writing—original draft preparation, H.J.K.; writing—review and editing, H.J.K. and K.T.C.; supervision, K.T.C. All authors have read and agreed to the published version of the manuscript.
Funding
This research received no external funding.
Institutional Review Board Statement
Not applicable.
Informed Consent Statement
Not applicable.
Data Availability Statement
Not applicable.
Conflicts of Interest
The authors declare no conflict of interest.
Appendix A

Table A1.
Mapping list of safety performance factors and Weight 3 words in 2018.
| Word | A | B | C | D | E | F | G | H | I |
|---|---|---|---|---|---|---|---|---|---|
| business | X | X | X | ||||||
| development | X | X | X | ||||||
| customer | X | X | X | ||||||
| market | X | X | X | ||||||
| technology | X | X | X | ||||||
| growth | X | X | X | ||||||
| product | X | X | X | ||||||
| company | X | X | X | ||||||
| management | X | X | X | ||||||
| service | X | X | |||||||
| value | X | X | |||||||
| transformation | X | X | X | ||||||
| strategy | X | X | X | ||||||
| environment | X | X | X | ||||||
| data | X | X | X | ||||||
| sale | X | X | X | ||||||
| risk | X | X | X | ||||||
| client | X | X | X | ||||||
| channel | X | X | X |
A: Provision of resources, B: Governance, C: Relational issues, D: People, E: Culture, F: Process, G; Facilitators, H: Leadership, I: Strategy.
Table A2.
Mapping list of safety performance factors and Weight 2 words in 2018.
| Word | A | B | C | D | E | F | G | H | I |
|---|---|---|---|---|---|---|---|---|---|
| industry | X | X | X | ||||||
| capability | X | X | X | ||||||
| opportunity | X | X | X | ||||||
| regulation | X | X | X | ||||||
| partner | X | X | X | ||||||
| focus | X | X | X | ||||||
| rate | X | X | X | ||||||
| structure | X | X | X | ||||||
| system | X | X | X | ||||||
| effort | X | X | X |
A: Provision of resources, B: Governance, C: Relational issues, D: People, E: Culture, F: Process, G; Facilitators, H: Leadership, I: Strategy.
Table A3.
Mapping list of safety performance factors and Weight 1 words in 2018.
| Word | A | B | C | D | E | F | G | H | I |
|---|---|---|---|---|---|---|---|---|---|
| need | X | X | X | ||||||
| spirit | X | X | X | ||||||
| world | X | X | X | ||||||
| operation | X | X | X | ||||||
| process | X | X | X | ||||||
| initiative | X | X | X | ||||||
| culture | X | X | X | ||||||
| sustainability | X | X | X | ||||||
| interest | X | X | X | ||||||
| impact | X | X | X | ||||||
| model | X | X | X |
A: Provision of resources, B: Governance, C: Relational issues, D: People, E: Culture, F: Process, G; Facilitators, H: Leadership, I: Strategy.
Table A4.
Mapping list of safety performance factors and Weight 3 words in 2019.
| Word | A | B | C | D | E | F | G | H | I |
|---|---|---|---|---|---|---|---|---|---|
| business | X | X | X | ||||||
| development | X | X | X | ||||||
| risk | X | X | X | ||||||
| customer | X | X | X | ||||||
| technology | X | X | X | ||||||
| growth | X | X | X | ||||||
| service | X | X | X | ||||||
| value | X | X | X | ||||||
| product | X | X | X | ||||||
| company | X | X | X | ||||||
| transformation | X | X | X | ||||||
| industry | X | X | X | ||||||
| capability | X | X | X | ||||||
| platform | X | X | X | ||||||
| effort | X | X | X | ||||||
| environment | X | X | X | ||||||
| society | X | X | X |
A: Provision of resources, B: Governance, C: Relational issues, D: People, E: Culture, F: Process, G; Facilitators, H: Leadership, I: Strategy.
Table A5.
Mapping list of safety performance factors and Weight 2 words in 2019.
| Word | A | B | C | D | E | F | G | H | I |
|---|---|---|---|---|---|---|---|---|---|
| model | X | X | X | ||||||
| core | X | X | X | ||||||
| structure | X | X | X | ||||||
| strategy | X | X | X | ||||||
| experience | X | X | X | ||||||
| future | X | X | X | ||||||
| world | X | X | X | ||||||
| area | X | X | X | ||||||
| data | X | X | X | ||||||
| governance | X | X | X |
A: Provision of resources, B: Governance, C: Relational issues, D: People, E: Culture, F: Process, G; Facilitators, H: Leadership, I: Strategy.
Table A6.
Mapping list of safety performance factors and Weight 1 words in 2019.
| Word | A | B | C | D | E | F | G | H | I |
|---|---|---|---|---|---|---|---|---|---|
| operation | X | X | X | ||||||
| advancement | X | X | X | ||||||
| empowerment | X | X | X | ||||||
| high quality | X | X | X | ||||||
| project | X | X | X | ||||||
| point | X | X | X | ||||||
| issue | X | X | X | ||||||
| solution | X | X | X | ||||||
| system | X | X | X | ||||||
| rate | X | X | X | ||||||
| pace | X | X | X | ||||||
| investment | X | X | X | ||||||
| country | X | X | X | ||||||
| board | X | X | X | ||||||
| market | X | X | X | ||||||
| time | X | X | X | ||||||
| leader | X | X | X | ||||||
| policy | X | X | X | ||||||
| impact | X | X | X |
A: Provision of resources, B: Governance, C: Relational issues, D: People, E: Culture, F: Process, G; Facilitators, H: Leadership, I: Strategy.
Table A7.
Mapping list of safety performance factors and Weight 3 words in 2020.
| Word | A | B | C | D | E | F | G | H | I |
|---|---|---|---|---|---|---|---|---|---|
| business | X | X | X | ||||||
| management | X | X | X | ||||||
| customer | X | X | X | ||||||
| service | X | X | X | ||||||
| development | X | X | X | ||||||
| company | X | X | X | ||||||
| technology | X | X | X | ||||||
| people | X | X | X | ||||||
| risk | X | X | X | ||||||
| value | X | X | X | ||||||
| opportunity | X | X | |||||||
| system | X | X | X | ||||||
| product | X | X | X | ||||||
| strategy | X | X | X | ||||||
| industry | X | X | X | ||||||
| growth | X | X | X | ||||||
| transformation | X | X | |||||||
| society | X | X | X | ||||||
| capability | X | X | X | ||||||
| issue | X | X | X | ||||||
| market | X | X | X | ||||||
| effort | X | X | X |
A: Provision of resources, B: Governance, C: Relational issues, D: People, E: Culture, F: process, G; Facilitators, H: Leadership, I: Strategy.
Table A8.
Mapping list of safety performance factors and Weight 2 words in 2020.
| Word | A | B | C | D | E | F | G | H | I |
|---|---|---|---|---|---|---|---|---|---|
| operation | X | X | X | ||||||
| enhance | X | X | X | ||||||
| high quality | X | X | X | ||||||
| challenge | X | X | X | ||||||
| model | X | X | X | ||||||
| project | X | X | X | ||||||
| time | X | X | X | X |
A: Provision of resources, B: Governance, C: Relational issues, D: People, E: Culture, F: process, G; Facilitators, H: Leadership, I: Strategy.
Table A9.
Mapping list of safety performance factors and Weight 1 words in 2020.
| Word | A | B | C | D | E | F | G | H | I |
|---|---|---|---|---|---|---|---|---|---|
| team | X | X | X | ||||||
| community | X | X | X | ||||||
| sustainability | X | X | X | ||||||
| employee | X | X | X | ||||||
| support | X | X | X | ||||||
| impact | X | X | X | ||||||
| culture | X | X | X | ||||||
| area | X | X | X | ||||||
| health | X | X | X | ||||||
| investment | X | X | X |
A: Provision of resources, B: Governance, C: Relational issues, D: People, E: Culture, F: Process, G; Facilitators, H: Leadership, I: Strategy.
References
- Kim, G.D.; Kim, Y.J. Status and Challenges of Digital Transformation in Insurance Industry. Korea Insur. Res. Inst. 2021, 514, 1–8. [Google Scholar]
- Choi, S.W. A Study of the Development Aspect of Storytelling in the New Normal Era. Korean Soc. Cult. Converg. 2021, 43, 557–570. [Google Scholar] [CrossRef]
- Kim, K.S.; Seong, Y.J.; Han, Y.S. Post-COVID-19, Industrial Strategy in the New Normal Era. Gyeonggi Res. Inst. 2020, 411, 1–25. [Google Scholar]
- Nicoletti, B. Digital Insurance: Business Innovation in the Post-Crisis Era; Springer: Berlin/Heidelberg, Germany, 2016. [Google Scholar]
- Pearson, R. Towards an historical model of services innovation: The case of the insurance industry, 1700–1914. Econ. Hist. Rev. 1997, 50, 235–256. [Google Scholar] [CrossRef]
- Kirov, S. Pandemic Digitalization of the Insurance Business. Izv. J. Union Sci.-Varna Econ. Sci. Ser. 2021, 10, 72–79. [Google Scholar]
- Lee, J.W.; Oh, S.I. Analysis of Success Cases of InsurTech and Digital Insurance Platform Based on Artificial Intelligence Technologies: Focused on Ping An Insurance Group Ltd. in China. KIISS 2020, 26, 71–90. [Google Scholar]
- Hambrick, D.C.; Fukutomi, G.D. The seasons of a CEO’s tenure. Acad. Manag. Rev. 1991, 16, 719–742. [Google Scholar] [CrossRef]
- Chah, D.O. A study of recent research on CEO leadership. Korean Assoc. Pers. Adm. 2005, 29, 205–258. [Google Scholar]
- Amernic, J.H.; Craig, R.J. Guidelines for CEO-speak editing the language of corporate leadership. Strategy Leadersh. 2007, 35, 25–31. [Google Scholar] [CrossRef]
- Na, H.J.; Lee, K.C.; Choi, S.U.; Kim, S.T. Exploring CEO messages in sustainability management reports: Applying sentiment mining and sustainability balanced scorecard methods. Sustainability 2020, 12, 590. [Google Scholar] [CrossRef]
- Aerts, W.; Cormier, D.; Magnan, M. Corporate environmental disclosure, financial markets and the media: An international perspective. Ecol. Econ. 2008, 64, 643–659. [Google Scholar] [CrossRef]
- Thomas, J. Discourse in the marketplace: The making of meaning in annual reports. J. Bus. Commun. 1973, 34, 47–66. [Google Scholar] [CrossRef]
- Kloptchenko, A.; Eklund, T.; Karlsson, J.; Back, B.; Vanharanta, H.; Visa, A. Combining data and text mining techniques for analysing financial reports. Intell. Syst. Account. Financ. Manag. Int. J. 2004, 12, 29–41. [Google Scholar] [CrossRef]
- Charteris-Black, J.; Ennis, T. A comparative study of metaphor in Spanish and English financial reporting. Engl. Specif. Purp. 2001, 20, 249–266. [Google Scholar] [CrossRef]
- Shirata, C.Y.; Takeuchi, H.; Ogino, S.; Watanabe, H. Extracting key phrases as predictors of corporate bankruptcy: Empirical analysis of annual reports by text mining. J. Emerg. Technol. Account. 2011, 8, 31–44. [Google Scholar] [CrossRef]
- Choi, J.W.; Han, H.S.; Lee, M.Y.; Ahn, J.M. The Prediction of Corporate Bankruptcy Using Text-mining Methodology. Product. Rev. 2015, 29, 201–228. [Google Scholar] [CrossRef]
- Humphery-Jenner, M.L.; Powell, R.G. Firm size, takeover profitability, and the effectiveness of the market for corporate control: Does the absence of anti-takeover provisions make a difference? J. Corp. Financ. 2011, 17, 418–437. [Google Scholar] [CrossRef]
- Gupta, R.; Gill, N.S. Financial statement fraud detection using text mining. Editor. Pref. 2012, 3, 189–191. [Google Scholar]
- Yook, K.H. The Relationship between Environmental Accounting and CEO Message Using Text Mining Technique—Comparative Study of Korea and Japan. J. Korean Assoc. Mod. Jpn. 2017, 56, 387–400. [Google Scholar]
- Choi, Y.G.; Cho, K.T. Analysis of safety management characteristics using network analysis of CEO messages in the construction industry. Sustainability 2020, 12, 5771. [Google Scholar] [CrossRef]
- Yook, K.H. CEOs Talk about Social Responsibilities and Sustainable Performance: Applications of Text Mining Approach. Korea Acc. 2018, 27, 253–279. [Google Scholar] [CrossRef]
- Choi, Y.K.; Cho, K.T. Analysis of Environmental Management Characteristics Using Network Analysis of CEO Communication in the Automotive Industry. Sustainability 2021, 13, 11987. [Google Scholar] [CrossRef]
- Bang, K.W. A Text Mining for CEO’s Letters—A Study of Specialized Text Types through the Case of German Companies. Inst. Humanit. Chosun Univ. 2021, 62, 371–401. [Google Scholar]
- Uhm, S.W.; Lee, S.S. Analysis of ESG Management Strategy Trends through Text Mining of CEO Messages. KEPAS 2021, 1, 208–209. [Google Scholar]
- Kim, S.J.; Kim, Y.M. 2021 KIRI CEO Survey. Korea Insur. Res. Inst. 2021, 2021, 17. [Google Scholar]
- Durst, S.; Ståhle, P. Success factors of open innovation-a literature review. Int. J. Bus. Res. Manag. 2013, 4, 111–131. [Google Scholar]
- Im, J.; Kim, H.; Miao, L. CEO letters: Hospitality corporate narratives during the COVID-19 pandemic. Int. J. Hosp. Manag. 2021, 92, 102701. [Google Scholar] [CrossRef]
- Siano, A.; Tuccillo, C.; Conte, F.A. CEO Communication in Sustainability Organizations: Activities and Tools. Available online: https://www.researchgate.net/publication/259053875 (accessed on 2 January 2022).
- Park, C.S. Discovering Meaningful Trends in the Inaugural Addresses of North Korean Leader via Text Mining. J. Inf. Technol. Appl. Manag. 2019, 26, 43–59. [Google Scholar]
- Yun, J.H.; Lee, J.H. A Study on Generalization of Corporate CSR Keywords Using Text Mining. KMIS Int. Conf. 2021, 21, 31–48. [Google Scholar]
- Chesbrough, H.W. Open Innovation: The New Imperative for Creating and Profiting from Technology; Harvard Business School Press: Boston, MA, USA, 2003. [Google Scholar]
- Kim, S.K.; Jang, B.Y.; Lee, Y.J.; Song, J.G.; An, D.H.; Lee, K.H.; Choi, J.S. Open Innovation: Theory, Practices, and Policy Implications. STEPI 2008, 12, 1–330. [Google Scholar]
- Yang, C.H. An Empirical Study on the Success Factor and Performance of Management Innovation. Korean Ind. Econ. Assoc. 1999, 12, 63–84. [Google Scholar]
- Calantone, R.J.; Cavusgil, S.T.; Zhao, Y. Learning orientation, firm innovation capability, and firm performance. Ind. Mark. Manag. 2002, 31, 515–524. [Google Scholar] [CrossRef]
- Kyung, J.S. A Study on Impact of Innovative and Network Competency of Small-Medium Enterprises on Performance. Korean Ind. Econ. Assoc. 2021, 34, 363–383. [Google Scholar]
- Kim, H.; Kim, N.J. The Effect of Innovation Success Factors and Innovation Capabilities on Performance in Manufacturing Firm. J. Korean Prod. Oper. Manag. Soc. 2009, 20, 99–125. [Google Scholar]
- Jang, K.S.; Kim, Y.B.; Koo, I.S. A Study on the Relationship between Innovation Activity and Business Results -Focused on the Small and Medium Manufacturing Enterprises. J. Korean Soc. Qual. Manag. 2010, 38, 512–520. [Google Scholar]
- Chang, S.I.; Jang, K.S. A Study on the Influence of CEO’s Management Characteristics of SMEs on Innovation Performance and Management Performance. K Bus. Manag. J. 2020, 4, 43–67. [Google Scholar]
- Hong, J.H.; Cho, Y.S.; Park, H.H.; Choi, J.H. The Impact of CEO Business Propensity, Innovation Orientation and Employee Innovation Activity on Business Performances: Focused on the Small, Medium and Venture Enterprises. J. Commod. Sci. Technol. 2012, 30, 19–32. [Google Scholar]
- Lee, C.D. The Causal Relationship among Strategy, Organization Culture, Innovation. Korean J. Bus. Adm. 2011, 24, 3441–3460. [Google Scholar]
- Kalay, F.; Gary, L.Y.N.N. The impact of strategic innovation management practices on firm innovation performance. Res. J. Bus. Manag. 2015, 2, 412–429. [Google Scholar] [CrossRef]
- Köse, İ.; Güner, Ş.; İşgüzerer, B.; Sisli, M.E. A case study of the extended interactive innovation management model in insurance company. In Proceedings of the 13th European Conference on Innovation and Entrepreneurship (ECIE), Aveiro, Portugal, 20–21 September 2018; Academic Conferences and Publishing International Limited: Kidmore End, UK, 2018; pp. 375–383. [Google Scholar]
- Seo, J.G.; Nam, C.M.; Kim, T.H.; Park, S.H. Keyword Network Analysis on Long Term Care Insurance Using Text Mining. J. Health Inform. Stat. 2021, 46, 257–266. [Google Scholar] [CrossRef]
- Brandirectory. Insurance 100 2020 Top 1–100. Available online: https://brandirectory.com/rankings/insurance/2020 (accessed on 10 May 2021).
- Marsden, J.; Briony, T. Brand values: Exploring the associations of symmetry within financial brand marks. Des. Manag. J. 2013, 8, 62–71. [Google Scholar] [CrossRef]
- Oliver, S. Message from the CEO: A three-minute rule? Corp. Commun. Int. J. 2000, 5, 158–167. [Google Scholar] [CrossRef]
- Jung, G.H. A Study of Foresight Method Based on Text Mining and Complexity Network Analysis; Korea Institute of S&T Evaluation and Planning: Seoul, Korea, 2010. [Google Scholar]
- Lee, J.J. The Scope and trends of Innovation Studies. Korean Manag. Rev. 1998, 27, 1115–1139. [Google Scholar]
- Lee, H.S.; Yi, C.G. New Discussion of the Conceptual Definition of Technology Innovation. KOTIS 2021, 24, 777–798. [Google Scholar]
- Lee, S.S. A content analysis of journal articles using the language network analysis methods. J. Korean Soc. Inf. Manag. 2014, 31, 49–68. [Google Scholar]
- Diesner, J.; Carley, K.M.; Tambayong, L. Extracting socio-cultural networks of the Sudan from open-source, large-scale text data. Comput. Math. Organ. Theory 2012, 18, 328–339. [Google Scholar] [CrossRef]
- Lee, I.W.; Lee, Y.M. Semantic Network Analysis on Core Values and Policy Orientation: By Focusing on Moon Administration Policy Road-map. Korean Public Adm. Q. 2019, 31, 643–670. [Google Scholar] [CrossRef]
- Hussain, S.; Muhammad, L.J.; Yakubu, A. Mining social media and DBpedia data using Gephi and R. J. Appl. Comput. Sci. Math. 2018, 12, 14–20. [Google Scholar] [CrossRef]
- Agarwal, U.A.; Datta, S.; Blake-Beard, S.; Bhargava, S. Linking LMX, innovative work behaviour and turnover intentions: The mediating role of work engagement. Career Dev. Int. 2012, 17, 208–230. [Google Scholar] [CrossRef]
- Bhat, S.S.; Milne, S. Network effects on cooperation in destination website development. Tour. Manag. 2008, 29, 1131–1140. [Google Scholar] [CrossRef]
- Mrvar, A.; Batagelj, V. Analysis and visualization of large networks with program package Pajek. Complex Adapt. Syst. Model. 2016, 4, 6. [Google Scholar] [CrossRef]
- Heo, J.E.; Yang, C.H. Applying Network Analysis in Convergent Research Relationships: The Case of High-Tech Convergence Technology Development Program. J. Korea Technol. Innov. Soc. 2013, 16, 883–912. [Google Scholar]
- Hong, J.H.; Yun, H.J. Presidential Candidate’s Speech based on Network Analysis: Mainly on the Visibility of the Words and the Connectivity between the Words. J. Korea Contents Assoc. 2014, 14, 24–44. [Google Scholar] [CrossRef]
- Shih, H.Y. Network characteristics of drive tourism destinations: An application of network analysis in tourism. Tour. Manag. 2006, 27, 1029–1039. [Google Scholar] [CrossRef]
- Kim, Y.H.; Kim, Y. Social Network Analysis, 4th ed.; ParkYoungsa: Seoul, Korea, 2016; pp. 308–322. [Google Scholar]
- Opsahl, T.; Agneessens, F.; Skvoretz, J. Node centrality in weighted networks: Generalizing degree and shortest paths. Soc. Netw. 2010, 32, 245–251. [Google Scholar] [CrossRef]
- Knoke, D.; Yang, S. Social Network Analysis, 3rd ed.; SAGE Publications: New York, NY, USA, 2019; pp. 100–156. [Google Scholar]
- Liu, B.; Li, Z.; Chen, X.; Huang, Y.; Liu, X. Recognition and Vulnerability Analysis of Key Nodes in Power Grid Based on Complex Network Centrality. IEEE Trans. Circuits Syst. II Express Briefs 2017, 65, 346–350. [Google Scholar] [CrossRef]
- Cherven, K. Mastering Gephi Network Visualization, 1st ed.; Packt Publishing: Birmingham, UK, 2015; pp. 181–215. [Google Scholar]
- Aju Business Daliy. Available online: https://www.ajunews.com/view/20211012114940983 (accessed on 12 October 2021).
- Deloitte. Available online: https://www2.deloitte.com/global/en/insights/industry/financial-services/financial-services-industry-outlooks/insurance-industry-outlook-2021.html (accessed on 3 December 2020).
- Rezaee, Z. Business sustainability research: A theoretical and integrated perspective. J. Account. Lit. 2016, 36, 48–64. [Google Scholar] [CrossRef]
- Tarmuji, I.; Maelah, R.; Tarmuji, N.H. The impact of environmental, social and governance practices (ESG) on economic performance: Evidence from ESG score. Int. J. Trade Econ. Financ. 2016, 7, 67. [Google Scholar] [CrossRef]
- Yu, E.P.Y.; Guo, C.Q.; Luu, B.V. Environmental, social and governance transparency and firm value. Bus. Strategy Environ. 2018, 27, 987–1004. [Google Scholar] [CrossRef]
- Lo, K.Y.; Kwan, C.L. The effect of environmental, social, governance and sustainability initiatives on stock value–Examining market response to initiatives undertaken by listed companies. Corp. Soc. Responsib. Environ. Manag. 2017, 24, 606–619. [Google Scholar] [CrossRef]
Figure 1.
Research procedure and methods.
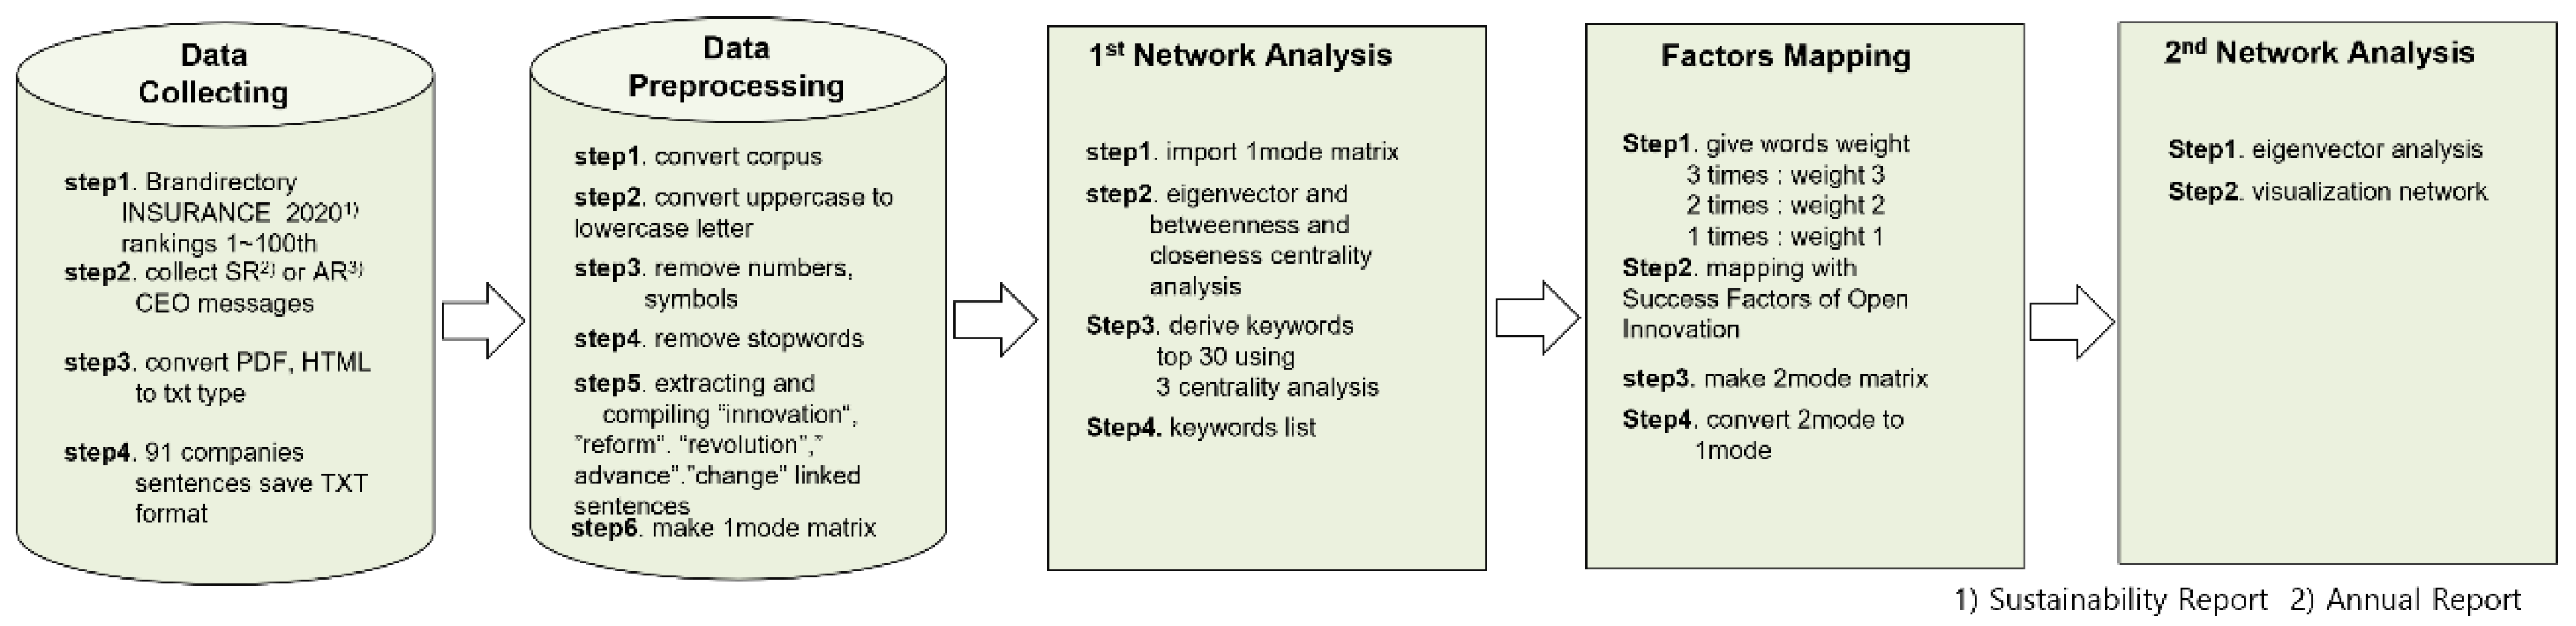
Figure 2.
Network visualization of open innovation characteristics in 2018.
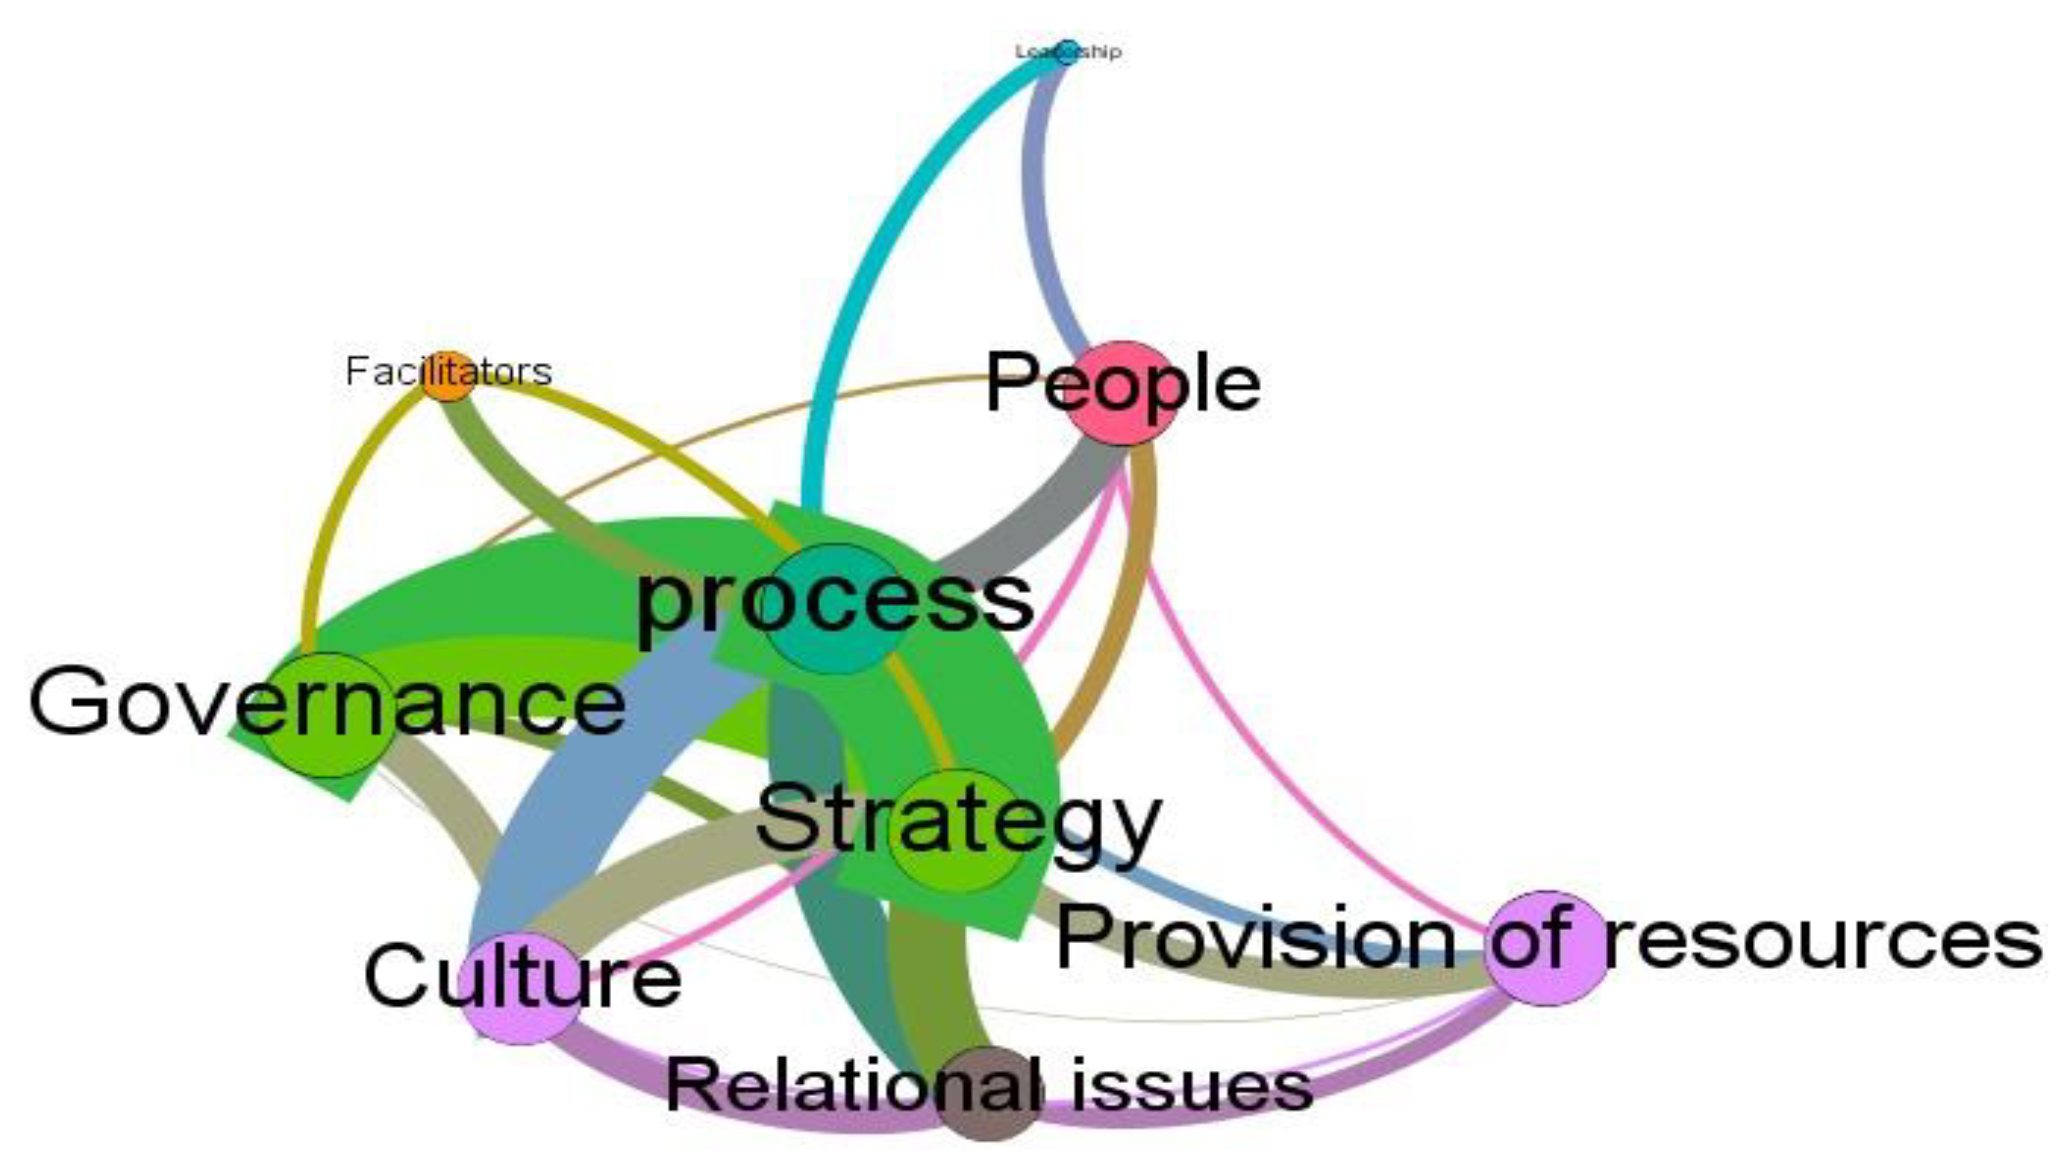
Figure 3.
Network visualization of open innovation characteristics in 2019.

Figure 4.
Network visualization of open innovation characteristics in 2020.

Table 1.
Research topics of the study.
| Category | Subcategory | Topic | Content Analysis |
|---|---|---|---|
| 1 | 1-a | Keyword Analysis | Comparison of the top 91 insurance companies in 2018 |
| 1-b | Keyword Analysis | Comparison of the top 91 insurance companies in 2019 | |
| 1-c | Keyword Analysis | Comparison of the top 91 insurance companies in 2020 | |
| 2 | 2-a | Nine Factors of Open Innovation | Comparison of the top 91 insurance companies in 2018 |
| 2-b | Nine Factors of Open Innovation | Comparison of the top 91 insurance companies in 2019 | |
| 2-c | Nine Factors of Open Innovation | Comparison of the top 91 insurance companies in 2020 |
Table 2.
List of centrality analysis results for deducing words in 2018.
| Ranking | Word | Betweenness Centrality | Word | Closeness Centrality | Word | Eigenvector Centrality |
|---|---|---|---|---|---|---|
| 1 | business | 4804.488063 | business | 0.588068 | business | 1 |
| 2 | customer | 3045.830799 | development | 0.560976 | development | 0.91335 |
| 3 | development | 3006.858327 | customer | 0.553476 | customer | 0.901219 |
| 4 | technology | 1993.420767 | technology | 0.541885 | market | 0.872153 |
| 5 | market | 1963.880573 | market | 0.539062 | technology | 0.856544 |
| 6 | company | 1843.926569 | company | 0.528061 | growth | 0.751172 |
| 7 | management | 1140.855644 | growth | 0.518797 | product | 0.703894 |
| 8 | product | 908.97019 | product | 0.512376 | company | 0.674082 |
| 9 | growth | 845.876406 | management | 0.509852 | management | 0.633944 |
| 10 | risk | 756.291668 | service | 0.498795 | service | 0.633375 |
| 11 | value | 746.141142 | value | 0.497596 | value | 0.608037 |
| 12 | strategy | 609.53948 | industry | 0.492857 | industry | 0.602606 |
| 13 | service | 577.47129 | transformation | 0.488208 | transformation | 0.597111 |
| 14 | term | 452.405025 | environment | 0.480278 | capability | 0.510997 |
| 15 | data | 431.08478 | strategy | 0.475862 | strategy | 0.496044 |
| 16 | sale | 428.188955 | opportunity | 0.469388 | environment | 0.486918 |
| 17 | spirit | 404.437356 | capability | 0.461024 | opportunity | 0.486013 |
| 18 | transformation | 333.93174 | focus | 0.45898 | regulation | 0.387869 |
| 19 | world | 297.28158 | rate | 0.457965 | data | 0.3806 |
| 20 | operation | 255.973072 | structure | 0.456954 | sale | 0.37222 |
| 21 | environment | 254.700688 | sale | 0.452954 | partner | 0.367701 |
| 22 | process | 248.690713 | risk | 0.45098 | focus | 0.365345 |
| 23 | regulation | 239.846801 | system | 0.45 | rate | 0.354932 |
| 24 | client | 237.350276 | data | 0.445161 | risk | 0.344397 |
| 25 | channel | 229.903887 | interest | 0.444206 | structure | 0.340511 |
| 26 | effort | 228.080061 | impact | 0.442308 | client | 0.337535 |
| 27 | initiative | 224.905099 | regulation | 0.441365 | system | 0.321511 |
| 28 | culture | 224.872637 | channel | 0.437632 | channel | 0.318865 |
| 29 | partner | 212.654668 | model | 0.433962 | need | 0.308033 |
| 30 | sustainability | 209 | client | 0.43215 | effort | 0.280447 |
Table 3.
List of centrality analysis results for deducing words in 2019.
| Ranking | Word | Betweenness Centrality | Word | Closeness Centrality | Word | Eigenvector Centrality |
|---|---|---|---|---|---|---|
| 1 | business | 8371.367625 | business | 0.639752 | business | 1 |
| 2 | customer | 2659.814331 | customer | 0.544974 | development | 0.626061 |
| 3 | technology | 2099.376483 | risk | 0.540682 | risk | 0.625209 |
| 4 | company | 1926.713614 | service | 0.517588 | customer | 0.622442 |
| 5 | risk | 1681.044729 | company | 0.515 | technology | 0.609292 |
| 6 | product | 1396.166852 | development | 0.513716 | growth | 0.535411 |
| 7 | development | 1365.241474 | growth | 0.513716 | service | 0.513819 |
| 8 | growth | 1104.056215 | product | 0.512438 | value | 0.496417 |
| 9 | industry | 968.452601 | industry | 0.509901 | product | 0.478197 |
| 10 | service | 792.181964 | technology | 0.507389 | company | 0.473282 |
| 11 | value | 632.786426 | transformation | 0.506143 | transformation | 0.462239 |
| 12 | experience | 585.136041 | value | 0.503667 | industry | 0.461913 |
| 13 | capability | 540.519468 | capability | 0.491647 | model | 0.434704 |
| 14 | governance | 352.950319 | model | 0.47907 | capability | 0.418697 |
| 15 | environment | 316.448428 | environment | 0.469248 | core | 0.376881 |
| 16 | issue | 288.663233 | society | 0.46712 | platform | 0.345275 |
| 17 | solution | 283.951597 | experience | 0.466063 | structure | 0.315581 |
| 18 | transformation | 275.971188 | structure | 0.462921 | strategy | 0.300243 |
| 19 | effort | 261.444299 | effort | 0.453744 | effort | 0.272083 |
| 20 | society | 256.24405 | platform | 0.450766 | environment | 0.266141 |
| 21 | system | 226.090031 | area | 0.444924 | experience | 0.251166 |
| 22 | rate | 209.200767 | core | 0.443966 | operation | 0.244525 |
| 23 | pace | 205.277778 | time | 0.443966 | data | 0.240208 |
| 24 | investment | 195.02384 | governance | 0.44206 | society | 0.23769 |
| 25 | country | 175.610864 | strategy | 0.44206 | advancement | 0.236087 |
| 26 | board | 171.421597 | leader | 0.439232 | empowerment | 0.220581 |
| 27 | world | 160.416323 | world | 0.436441 | high quality | 0.216134 |
| 28 | data | 146.900778 | policy | 0.436441 | project | 0.210711 |
| 29 | platform | 129.365021 | future | 0.433684 | future | 0.197233 |
| 30 | market | 127.642152 | impact | 0.433684 | point | 0.195956 |
Table 4.
List of centrality analysis results for deducing words in 2020.
| Ranking | Word | Betweenness Centrality | Word | Closeness Centrality | Word | Eigenvector Centrality |
|---|---|---|---|---|---|---|
| 1 | customer | 6971.114138 | customer | 0.52488 | business | 1 |
| 2 | business | 6605.773401 | management | 0.519873 | management | 0.998436 |
| 3 | management | 5801.812297 | business | 0.514151 | customer | 0.904793 |
| 4 | company | 4467.55627 | company | 0.514151 | service | 0.895345 |
| 5 | technology | 4315.287062 | people | 0.49696 | development | 0.895133 |
| 6 | community | 4134.016543 | service | 0.493213 | company | 0.808335 |
| 7 | service | 4031.550403 | technology | 0.489521 | technology | 0.792498 |
| 8 | people | 3862.612437 | development | 0.483728 | people | 0.770994 |
| 9 | issue | 3297.511231 | risk | 0.471861 | risk | 0.744962 |
| 10 | development | 2308.395574 | system | 0.471182 | value | 0.739666 |
| 11 | opportunity | 1950.489972 | value | 0.468481 | opportunity | 0.694328 |
| 12 | market | 1790.931952 | opportunity | 0.466476 | capability | 0.660783 |
| 13 | system | 1765.997475 | product | 0.46383 | system | 0.632842 |
| 14 | sustainability | 1742.206902 | industry | 0.462518 | product | 0.615687 |
| 15 | employee | 1696.12015 | growth | 0.461864 | strategy | 0.594059 |
| 16 | product | 1630.748383 | strategy | 0.459916 | operation | 0.590444 |
| 17 | growth | 1525.617263 | issue | 0.45927 | industry | 0.55721 |
| 18 | risk | 1485.531893 | capability | 0.456067 | growth | 0.5426 |
| 19 | support | 1404.88417 | operation | 0.454167 | enhance | 0.475768 |
| 20 | impact | 1312.170166 | transformation | 0.452282 | transformation | 0.453461 |
| 21 | industry | 1283.459258 | time | 0.449794 | society | 0.450704 |
| 22 | society | 1268.450378 | society | 0.439516 | high quality | 0.448089 |
| 23 | strategy | 1226.178128 | model | 0.435419 | challenge | 0.436487 |
| 24 | value | 1203.475365 | enhance | 0.433687 | model | 0.429346 |
| 25 | culture | 884.391275 | challenge | 0.433113 | project | 0.40401 |
| 26 | area | 854.328831 | market | 0.43254 | time | 0.403747 |
| 27 | capability | 823.765979 | project | 0.429698 | issue | 0.389959 |
| 28 | effort | 816.924729 | effort | 0.428571 | team | 0.364789 |
| 29 | health | 776.608341 | high quality | 0.424125 | market | 0.360719 |
| 30 | transformation | 704.124137 | investment | 0.420308 | effort | 0.359729 |
Table 5.
Weighted words classified according to the results of centrality analysis in 2018~2020.
| 2018 | 2019 | 2020 | |
|---|---|---|---|
| Cluster | Word | Word | Word |
| Weight 3 | business, development, customer, market, technology, growth, product, company, management, service, value, transformation, strategy, environment, data, sale, risk, client, channel | business, development, risk, customer, technology, growth, service, value, product, company, transformation, industry capability, platform, effort, environment, society | business, management, customer, service, development, company, technology, people, risk, value, opportunity, system, product, strategy, industry, growth, issue, transformation, society, market, effort, capability |
| Weight 2 | capability, opportunity, regulation, partner, focus, rate, structure, system, effort, industry | model, core, structure, strategy, experience, future, governance, world, data, area | operation, enhance, challenge, high quality, model, project, time |
| Weight 1 | need, spirit, world, operation, process, initiative, culture, sustainability, interest, impact, model | operation, advancement, empowerment, high quality project, point, issue, solution, system, rate, pace, investment, country, board, market, time, leader, policy, impact | team, community, sustainability, employee support, impact, culture, area, health, investment |
Table 6.
Keywords list in 2018~2020.
| 2018 | 2019 | 2020 | |||
|---|---|---|---|---|---|
| Ranking | Word | Ranking | Word | Ranking | Word |
| 1 | business | 1 | business | 1 | business |
| 2 | development | 2 | development | 2 | management |
| 3 | customer | 3 | risk | 3 | customer |
| 4 | market | 4 | customer | 4 | service |
| 5 | technology | 5 | technology | 5 | development |
| 6 | growth | 6 | growth | 6 | company |
| 7 | product | 7 | service | 7 | technology |
| 8 | company | 8 | value | 8 | people |
| 9 | management | 9 | product | 9 | risk |
| 10 | service | 10 | company | 10 | value |
Publisher’s Note: MDPI stays neutral with regard to jurisdictional claims in published maps and institutional affiliations. |
© 2022 by the authors. Licensee MDPI, Basel, Switzerland. This article is an open access article distributed under the terms and conditions of the Creative Commons Attribution (CC BY) license (https://creativecommons.org/licenses/by/4.0/).
Share and Cite
MDPI and ACS Style
Kim, H.J.; Cho, K.T. Analysis of Changes in Innovative Management of Global Insurers in the Pre- and Post-COVID-19 Eras. Sustainability 2022, 14, 9976. https://doi.org/10.3390/su14169976
AMA Style
Kim HJ, Cho KT. Analysis of Changes in Innovative Management of Global Insurers in the Pre- and Post-COVID-19 Eras. Sustainability. 2022; 14(16):9976. https://doi.org/10.3390/su14169976
Chicago/Turabian StyleKim, Hyun Jung, and Keun Tae Cho. 2022. "Analysis of Changes in Innovative Management of Global Insurers in the Pre- and Post-COVID-19 Eras" Sustainability 14, no. 16: 9976. https://doi.org/10.3390/su14169976
Note that from the first issue of 2016, this journal uses article numbers instead of page numbers. See further details here.