Article

Changes in the Water Surface Area of Reservoirs of the Crimean Peninsula and Artificial Increases in Precipitation as One of the Possible Solutions to Water Shortages

by
Svitlana Boychenko
1,*,
Tetyana Kuchma
2,* and
Ievgen V. Khlobystov
3
1
S. I. Subbotin Institute of Geophysics of the NAS of Ukraine, Department of Environmental Studies, National University of Kyiv–Mohyla Academy, 04655 Kyiv, Ukraine
2
Institute of Agroecology and Environmental Management, Department of Environmental Studies, National University of Kyiv–Mohyla Academy, 04655 Kyiv, Ukraine
3
Department of Environmental Studies, National University of Kyiv–Mohyla Academy, 04655 Kyiv, Ukraine
*
Authors to whom correspondence should be addressed.
Sustainability 2022, 14(16), 9995; https://doi.org/10.3390/su14169995
Submission received: 20 April 2022 / Revised: 31 July 2022 / Accepted: 2 August 2022 / Published: 12 August 2022

Abstract

:
The climatic conditions of Crimea are semiarid; therefore, alternative sources of fresh water are needed. A significant increase in water use and consumption (due to the intensification of construction, industry, tourism, and militarization), along with the cessation of fresh water supplies from mainland Ukraine, has reduced the water levels in some reservoirs to critical levels, and climate change has exacerbated this situation. There has been a significant decrease in precipitation by 10–15% on the Crimean Peninsula, accompanied by an increase in surface temperature by 0.8 ± 0.1 °C per 10 years during the period 1991–2020. The analysis of satellite-driven drought severity index reveals that the vast area of Crimean steppe is exposed to moderate–high drought risk. According to Landsat satellite imagery, there is a decreasing tendency for the water mirror area of all reservoirs, with a decrease of 34% on average in 2021 compared to 2015. The retrospective analysis of satellite images for 2015–2021 showed that the water surface area of the Simferopol reservoir had decreased on average by ~20% compared to 2015. To solve the problems associated with the shortage of fresh water, a series of works on the active influences on atmospheric processes was conducted, aimed at providing additional artificial precipitation. Two situations were considered, with mixed results: In the first case, on 30 October 2016, wet soil and standing water areas were detected by radar satellite imagery in agricultural fields within a radius of 40 km of the village of Petrovka, Krasnogvardiiskyi district, potentially related to the induction of precipitation by active influences on atmosphere. Meanwhile, in the second case, the realization of atmospheric precipitation occurred over Simferopol on 29–30 September 2020, leading to flooding in the city, but an increase in the water surface area of the Simferopol reservoir after active influences was not recorded.

1. Introduction

The climatic conditions of Crimea are semi-arid; therefore, in order to comfortably support human life, along with productive industry, agriculture, and tourism, alternative sources of fresh water are needed (e.g., transit of water through canals from other regions, use of underground water resources, desalination, etc.). Sustainable development of the region implies a resource-efficient approach and rational water management [1,2].
The water levels in several Crimean reservoirs have dropped sharply, leading to a shortage of fresh water, especially in recent years [3]. Changes in the water content of reservoirs have been caused by climate change, aridification of climatic conditions, seasonal variations in runoff, intensive usage of water resources because of tourism intensification and militarization, and the termination of water supplies from mainland Ukraine.
The aridification of climatic conditions and temperature records has been repeatedly registered in the southern regions of Ukraine during recent decades [4]. Summer heat (i.e., temperatures above 30 °C) has increased, while drought periods take place more often and embrace larger territories [5]. The driest periods were in 2016, 2017, and 2020 [6]. Similar tendencies in the aridification of climatic conditions are observed in other European regions such as the western coast of the Black Sea, covering the Bulgarian, Romanian, and Ukrainian coasts [7,8,9]. A significant warming in the summer, which is almost twice as fast as the annual trend of temperature in Georgia during recent decades, was reported in [10].
Arid and semi-arid areas are particularly exposed to the impact of climate change on water resources. Climate change is also associated with changes in the components of the hydrological cycle and systems (e.g., changing precipitation patterns, intensity, and extremes; reduced snow cover; increasing evaporation; changes in soil moisture and runoff) [2]. There is a significant natural interannual and seasonal variability in the components of the hydrological cycle, with a substantial uncertainty in tendencies due to the regional differences. Using Landsat satellite imagery, the monthly water storage for 6743 reservoirs worldwide for the period 1984–2015 was obtained. Simultaneously, the reservoir storage was diminished substantially for 23% of reservoirs, but for 21% there was an increase [11]. According to scenario estimates, by the 2070s, the annual runoff in Southern Europe will have decreased by up to 36% [2].
A periodic decrease in the water levels of reservoirs on the Crimean Peninsula during the period 1984–2020 was reported in [3] with the use of medium- and high-resolution satellite images (Landsat and Sentinel). Water reservoirs in this region can be categorized as either natural runoff reservoirs or loading reservoirs. The water in the loading reservoirs has begun to decrease, and are currently only 20% full (after the cessation of water supply from the Crimean canal in 2014). At the same time, reservoirs of natural runoff are characterized by a significant correlation between the water body surface area and precipitation in the watersheds. For example, in 2020, with low recorded water levels, the area of the reservoirs reached only about 40% of their nominal area.
The problem of freshwater scarcity in semi-arid and arid regions is being solved in several ways:
  • Usage of groundwater resources from wells. Groundwater is the main source of domestic potable water in semi-arid regions [2,12,13]. Thus, the proportion of groundwater in a general, balanced water supply exceeds 70% in various countries of Europe, including Ukraine. At the global level, this varies from one country to the next; groundwater exploitation covers approximately 50% of drinking water needs, 20% of the demand for irrigation water, and 40% of the needs of self-supplied industry [14]. The groundwater of the Crimean Peninsula, which comes mainly from karst aquifers, provides about 40% of the water budget and services about 50% of the Crimean population (1.0–1.5 million people). The demand for water resources increases in summer due to the influx of tourists (up to 6 million people), but the average annual demand increased dramatically after 2014. In 2018 alone, about 0.12 km3 of water was extracted from 1204 artesian wells, while the maximum sustainable withdrawal rate is 0.04 km3 [14]. For example, wells have been drilled near Simferopol that can provide up to 10,000 m3 of water per day, but the water is often brackish and requires further treatment [14,15]. However, an increase in the consumption of groundwater resources may lead to a decrease in the hydraulic pressure of the aquifer, and to their depletion in the near future.
  • Usage of submarine groundwater discharges into the sea. Fresh submarine groundwater discharge is widely valued as a water resource for drinking, hygiene, agriculture, fishing, tourism, culture, or ship navigation [16]. For instance, in Peru, this source of water is used for drinking, while it is used for bathing in Tahiti, and for irrigation in Greece [17]. A first dam, separating fresh and salty sea water, was built in karst galleries near Marseilles, following which fresh water enters the urban water supply system [18]. Similar work has been carried out in the coastal zones of the Mediterranean, as well as in other regions [19]. According to preliminary estimates, there are reserves of fresh submarine groundwater discharge under the Sea of Azov of about 0.5–1.2 billion m3, but this water can only conditionally be used for drinking [20,21]. This is low-mineralized water, which can be used only for technical purposes: irrigation, heating, and cooling systems. This water can be used as drinking water only after filter treatment and disinfection [21].
  • Large-scale collection of precipitation in the Crimean Mountains, using karst cavities as underground water reservoirs (underground water collectors) [22,23,24]. The maximum water accumulation occurs in spring (February–March), and by summer the water levels begin to decrease in the caves [25]. For example, the accumulated water of the caves at the Karasu-Bashi gorge is discharged through narrow karst tunnels. The water channels are laid at the cave exits to supply fresh water to Bilogorsk.
  • Desalination of brackish groundwater and seawater. Selection of the appropriate technology for the desalination of brackish groundwater and seawater should be performed based on water, energy consumption, and brine disposal, as well as environmental risks and cost considerations [26,27]. In particular, there are problems with the disposal of concentrated brine. When brine is discharged back into the sea, it may lead to an increase in water salinity and a reduction of the desalination plant efficiency. Dumping this concentrate can cause it to seep into the groundwater. Membrane-based desalination technologies are used in treating brackish groundwater in Crimea. For example, the desalination plant was built on the seashore in Mykolaivka village and is expected to produce 40,000 m3 of water per day (resource: [28]).
  • Reduction in water losses due to evaporation in reservoirs. In semi-arid regions, water losses increase due to evaporation from the surface of reservoirs, especially in summer. Partial coverage of reservoirs with the floating elements is applied to suppress evaporation losses [29]. For example, to solve the problem of evaporation in the United States, special black plastic balls are used, which cover the surface of reservoirs in California [30]. This has helped to reduce evaporation by 85%. In southeastern Spain, fabric materials are used to reduce reservoir evaporation by 70–80% in water-scarce conditions [31]. Additionally, an indirect effect of such protection against evaporation is a decrease in the concentration of salts in the water. This reduces soil degradation during irrigation [29,30].
As one of the solutions to the problem of the shortage of freshwater on the Crimean Peninsula, the aviation works were carried out to actively influence the atmospheric processes aiming at artificial increases in precipitation over a specific location [32,33,34,35]. In various countries around the world, the active influences on atmospheric processes are implemented for artificial cloud formation followed by forced precipitation in order to combat frost, suppress the formation of convective clouds, and prevent thunderstorms and hail-clouds, fogs, typhoons, and avalanches [32,33,34,35,36,37].
Systematic research on the thermodynamics and microphysics of clouds, coagulation processes of cloud, and sediment formation began in the 1940–50s of the 20th century in the USSR, the USA, and China. The leading scientists in this field in Ukraine are prof. Voloshchuk V.M., Leskov B.N., Pirnach A.M., Polovina I.P., Buikov M.V., Prihotko G.F. and others [32,33,38,39].
It should be noted that many experimental works, carried out over about 70 years, have shown that, on a large scale, active influences on atmospheric processes (artificial condensation of steam and the formation of clouds) are practically impossible due to their high economic and energy costs. Therefore, local work is possible only with the deposition of precipitation from the existing clouds by re-condensing small particles into large ones, stimulating their faster fall. [32,33].
Active influences help to achieve artificial increases in the amount of atmospheric precipitation directly over a specific location by 1.5–2.0 times, as well as an increase in the seasonal amount of atmospheric precipitation by 15–30% on average, and sometimes more [32,33,34]. However, to achieve this effect, weather prerequisites are necessary, namely, the formation of cloudiness with cumulus and stratocumulus clouds. It is more efficient to “seed” the clouds in the cold season in temperate latitudes. with respect to active influences on atmospheric processes, the two most widely used types of reagents are: (1) refrigerants (substances the evaporation of which causes a sharp local decrease in temperature, for example, firm carbon dioxide, liquid nitrogen); (2) ice-forming reagents (which perform the function of artificial crystallization nuclei, such as AgI) [32,33,34,35,36,37].
An analysis of the efficiency of active influences on atmospheric processes aiming at causing additional precipitation on the Northern Black Sea Coast over the period 1980–2010 showed that for all clouds from which natural precipitation falls, their amount can be increased by 19 to 106 mm. Thus, the increase in precipitation may range from 24 to 77% during the season from November to March [40,41]. An analysis of active influences on atmospheric processes over the Crimean Peninsula between 2016 and 2020 is provided below.
High-resolution Sentinel-2 optical and Sentinel-1 radar satellite imagery may provide essential information on the spatial and temporal dynamics of the water body surface area. The water surface absorbs the energy in the near and middle infrared bands and appears as an area with lower reflection values on images of those optical bands. At the same time, the radar signal, which is sensitive to surface smoothness, can easily detect water surfaces as areas with low backscatter values [42,43].
This study aims to analyze the features of climate change on the Crimean Peninsula for the periods 1900–2021 and 1991–2020 and to assess the dynamics of the area of Crimean reservoirs in the period 2015–2021 using satellite data. Additionally, an analysis of the results of active influences on atmospheric processes (from 2016 to 2020) for artificially increasing precipitation and subsequently increasing the water level of the Simferopol Reservoir is discussed.

Study Region

The Crimean Peninsula is almost surrounded by the Black Sea and the Sea of Azov (area 27 × 103 km2), and it is linked to the mainland by the narrow Perekop Isthmus. Tonka of Arabat lies between the mainland and the peninsula Syvash and is separated from the Sea of Azov by a long sandspit [44]. The northern and central part of the peninsula is a level plain of the dry steppe; there are forested ranges of the Crimean Mountains (Mount Roman-Kosh, 1545 m) in the south and the narrow southern coastal plain.
Climatic conditions on the peninsula have some variations and therefore three climatic subzones are distinguished [44,45]:
The Crimean Mountain (CM) has a temperate–continental climate, with pronounced seasonality, vertical zonation, a significant recurrence of strong winds, and most of the year excessive humidity (annual rainfall is more than 1000 mm of precipitation per year), with some variance depending on the altitude and exposure slopes, and proximity to the Black Sea. Summers are hot and dry (but with showers), and winters are wet and mild. The climate of the southern slopes of the Crimean Mountains is subtropical Mediterranean. The temperate–continental climate of foothill forest–steppe regions (CM1) and mountain forest regions (CM2) has specific variances.
The Crimean Steppe (CS) has a temperate–continental climate with pronounced seasonality. This is a driest region on the peninsula with hot, arid summers and short snowless winters with frequent thaws and very changeable weather (the region occupies 2/3 of the peninsula area). The temperate–continental steppe (SC1) and coastal steppe (SC2) climates have certain differences. In the Crimean Plain, the annual precipitation is less than 350 mm per year in the north of the Crimean Peninsula and 400–500 mm per year in the central part of the Crimean Peninsula.
The Southern Coast of Crimea (SCC) has a subtropical Mediterranean climate with the less pronounced seasonality and the influence of breeze circulation. According to climatic conditions, the South Coast is divided into two parts: the eastern part (from Alushta to Feodosia) and the western part (from Cape Aya to Alushta). The climate is semi-arid, with hot summers and mild winters. About 300–425 mm of precipitation falls during the year, less in the eastern part and more in the western part.
Climatic subzones of the Crimean Peninsula, the locations of meteostations and the reservoirs are shown in Figure 1.

2. Materials and Methods

It should be noted that Ukraine has not had access to the environmental monitoring data on the peninsula’s territory since 2014. Since the data from gauging stations are not received by the Central Geophysical Observatory of Ukraine (CGO), our research was based on the remote sensing data analysis [46,47]. As the water level data is not available, we used microwave satellite data to estimate the water body area dynamics of the reservoirs and to detect the standing water areas after heavy rain events potentially related to the active influences on the atmosphere.
Sentinel-1 satellite radar (microwave) sensor data was used for surface water area detection. Microwave sensors are sensitive to surface structure and roughness; the smoother the surface, the lower the signal scattering. The smooth water surface acts as a mirror reflector, which makes radar sensing effective for the detection of the boundaries of water bodies [48]. The first Sentinel-1 satellite was launched in 2014, and data transmission started in autumn 2014. All available satellite images for the full-year period from 2015 to 2021 were analyzed in this study. Fifteen significant reservoirs of the Crimean Peninsula that provide water supply to the population were included in the assessment.
As the scope of this research did not include the development and verification of a satellite image processing methodology, we applied the step-by-step procedures, the so-called Recommended Practices, developed by UN-SPIDER, which have proven effective in creating information products based on remote sensing to assess hazards such as floods, drought, etc. UN-SPIDER stands for the United Nations Platform for Space-based Information for Disaster Management and Emergency Response, and is a platform that facilitates the use of space-based technologies for disaster management and emergency response [49,50].
Satellite imagery was analyzed using Google Earth Engine API, a web platform for cloud remote sensing data processing [46]. The data processing algorithm for surface water body area detection was based on the Otsu [51] methodology, which uses image segmentation to obtain a water bodies mask. Using the program code [46], adjusted based on [52], all available images acquired in 2015–2021 were analyzed (up to 900–1300 images for each of the reservoirs, depending on reservoir’s location). To better identify trends in water surface area, we calculated the yearly averaged water mirror area between 2015 and 2021.
To assess the climate aridity, satellite-derived vegetation indexes were used to calculate the drought severity index, known as VHI (vegetation health index), based on UN-SPIDER drought monitoring methodology [47,49]. VHI was calculated as a combination of vegetation condition index (VCI) and temperature condition index (TCI). VCI index was calculated as the function of Normalized Difference Vegetation Index (NDVI) maximum and minimum over the long-term period, compared to the NDVI value of the current month. Similar to VCI, TCI index was calculated as the comparison of minimum and maximum Land Surface Temperature (LST) to the LST of the current month. MODIS satellite imagery over the period of 2000–2021 was used as a data source for NDVI and LST data. Drought severity classification was performed according to the recommended VHI threshold values (<10—extreme drought; 11–20—severe drought; 21–30—moderate drought; 31–40—mild drought; >40—no drought) [49].
Additionally, two active influences on atmospheric processes were identified and analyzed: 29–30 October 2016 above the village Petrovka Krasnogvardiiskyi district [53,54]; 29–30 September 2020 near Simferopol [55]. The effectiveness of the active influences over these regions was analyzed based on: literature sources, available observation data from meteorological stations in Simferopol and Dzhankoy, and radar remote sensing data from Sentinel-1 satellite imagery. Another UN-SPIDER methodology for standing water and wet soil area detection due to floods was applied [55]. The methodology is based on Sentinel-1 data processing to compare the imagery before and after the flood event (heavy rain) [46]. As ground-based data, the meteorological observations at Simferopol and Dzhankoy stations were used from the period of the application of the active influence to the atmosphere. Weather data (relative air humidity, cloudiness, and the amount of precipitation for 12 h) from 2016 and 2020 were used [56], as well as climatic norms for the period 1961–1991 [57].
A method for the determination of additional artificial precipitation depending on the intensity of natural precipitation during active influences on atmospheric processes was worked out in [41]. Thus, the additional artificial precipitation ΔR (in mm) can be determined by the following approximations:
Δ R = k · t · I a ,   k = 55 23 · I n ,   I a = 0.277 · I n 2 + 0.965 · I n + 0.097
where k is the coefficient of suitability of clouds for active influences, t is the duration of the natural precipitation (in hours), Ia is the intensity of artificial precipitation (in mm/h) (reliability of the approximation R2 = 0.96), In is the natural precipitation (in mm/h).
This semi-empirical model makes it possible to determine the potential amount of additional precipitation due to active influences on atmospheric processes [41]. However, the actual value will depend on the specific weather conditions and on the nature and amount of the applied reagent.
In this study, empirical data from the meteostations Kerch, Yevpatoria, Simferopol, Feodosia, and Yalta (namely, averaged monthly surface air temperature (°C per month) and precipitation (mm per month)) for the period 1900–2021 were used [58,59,60]. Additionally, the data from the meteostations Ai–Petri, Alushta and Dzhankoy were used only for period 1991–2021 [59,60]. Note that, since 2014, empirical data have not been received by the Central Geophysical Observatory of Ukraine (CGO) [59], and therefore for the period 2014–2021, data from [60] were used. Location data for regional meteostations and sources are presented in Table 1.
The period 1900–2021 was used to show long-term trends in surface temperature and precipitation, with rapid changes occurring during the period 1991–2020. Moreover, the values of the climatic norm of temperature (<T>) and precipitation (<P>) for the period 1991–2020 were calculated. The respective climatic norms for the period 1961–1990 were obtained from [57]. To assess trends in the seasonal course of temperature (Ttrn) and precipitation (Ptrn), the values of the coefficients of linear trends for a given meteostation in each month were calculated, and then averaged over the territory. The trends were computed using the linear least squares regression line. The nonparametric test of Mann–Kendall was used to obtain the statistical significance of trends of meteorological parameters (with a significance level of 95%). The research results are based on the data processed according to the methods of statistical analysis of meteorological information [61]. The calculations’ statistical analysis and graphical design were performed using software packages MS Excel and XLSTAT.
All Google Earth Engine scripts, used for remote sensing data processing, are available with this link [46].

3. Results

3.1. Climate Change on the Crimean Peninsula

According to the analysis of meteorological data for stations with long time series (Kerch, Simferopol, Feodosia, Yalta, Yevpatoria), the average annual temperature was 11.7 ± 0.9 °C, and the average annual amount of precipitation was 382 ± 80 mm/year on the plain parts of the Crimean Peninsula for the period 1900–2021. In unison with global and regional processes, certain changes in climate have occurred on the peninsula [4,7,8,9,10,62]. The average annual surface temperature has increased by 1.14 ± 0.35 °C every 100 years, while the annual amount of precipitation has increased by 66 ± 35 mm every 100 years. The time course of the average annual air temperature and the average annual amount of precipitation on the Crimean Peninsula for the period 1900–2021 is shown in Figure 2A,B.
However, in both the southern regions of Ukraine [4,27,63,64] and Crimea, climate change has been accelerated in recent decades. There was a more intensive increase in temperature by an average of 0.75 ± 0.12 °C every 10 years during the period 1991–2020, with the highest rate of 1.21 °C every 10 years being observed at the station Alushta. The annual amount of precipitation decreased by an average of 27 ± 15 mm every 10 years (10–15%) during this period. The respective climatic norms of average annual temperature and precipitation, as well as their trends for the periods 1961–1990 [39] and 1991–2020 for meteostations in this region, are shown in Table 2.
There are specific trends of seasonal changes of climatic conditions during the last few decades. Thus, for the period 1991–2020, there was a tendency towards warming in different months of the year ranging from 0.4 to 1.0 °C every 10 years. There was also a tendency towards a decrease in preciptiation throughout the year, especially in April, August–September, and November (up to 15%), with a slight increase in December–January and July by only 4–7%. A comparison of the average monthly temperature and precipitation, as well as their trends for the period 1991–2020 and the climatic norm for the period 1961–1990 are shown in Figure 3A,B.
Hence, there has been a significant decrease in precipitation by 10–15% on the Crimean Peninsula in recent decades, and an increase in surface temperature by 0.8 ± 0.1 °C every 10 years during the period 1991–2020.

3.2. Climate Aridity Analysis Using the Drought Severity Index of the Crimean Peninsula

To assess the manifestation of arid climatic conditions and their impact on vegetation, as well as to define the areas that are more prone to drought conditions, the satellite-driven monthly drought severity index (VHI) was analyzed over the period 2001–2021 [49]. According to analyzed data, the most severe manifestation of drought conditions during the last five years was observed in June 2020, as shown on Figure 4.
The map shows that the central part of the Crimean Peninsula, which belongs to the Crimean Steppe climatic zone, was exposure to severe drought conditions. Most of the agricultural lands of the Crimean Peninsula are located in the central part of the peninsula.
Areas suffering from extreme drought conditions were observed in the northern coastline area of the Crimean Peninsula. Some areas in the mountainous part of Crimea also exhibited signs of arid conditions, but for the most part, the condition of the vegetation in this area was satisfactory.

3.3. Changes in the Water Surface Area of Reservoirs in Crimea According to Radar Satellite Data Obtained from Sentinel-1 for the Period 2015–2021

In the last few years, the problem of water scarcity in Crimea has become extremely important, as water levels in several reservoirs approached critical levels [3]. A comparison of the water mirror areas of the reservoirs in Crimea for the period 2015–2021 according to radar satellite data obtained from Sentinel-1 [46,47] is presented in Table 3.
Additionally, the values of their deviations (in %) from their levels for 2015 are given. The most significant decrease in reservoir levels was obtained for the loading reservoirs and the Taiganske reservoir due to the transfer of water from there to the Simferopol reservoir. Meanwhile, in some years, for the natural runoff reservoirs, an increase in level can be observed (for example, Starokrymske, Isobilnenske, and Chornorichensk).
There is a tendency for the area of the water surface area to decrease in all of the reservoirs analyzed in this study compared to their water surface area in 2015. The water mirror area decreased by an average of 34% in 2021. In three reservoirs, the area of the water mirror decreased by more than 60% compared to 2015: the Frontove, Taiganske, and Mizhhirske reservoirs. The tendency for the water surface area to decrease begins to manifest clearly in mid–2019 and continues until 2021.
The change in the water mirror area of the Simferopol reservoir in 2015–2021 will be described more precisely later in this article.

3.4. Change in the Water Surface Area of the Simferopol Reservoir for the Period 2015–2021

Simferopol Reservoir was constructed in 1954 on the Salgir River with a water mirror area of about 317 ha and a water volume of 36 million m2. It is classified as a reservoir with a natural runoff, and therefore, the change in its level is due to seasonal changes in runoff, climatic conditions, and water use and consumption [3,12]. Significant water use and consumption against the background of arid climatic conditions caused a sharp decrease in the water level in the reservoir during the period 2015–2021 (a critical approach to the permissible lower water level limits).
A comparison of the average water surface area of the reservoir in 2020 with the surface area in 2010 based on Landsat satellite data [46] is shown in Figure 5A. It can be observed that the water surface area during the last 20 years was the highest in 2010 and the lowest was in 2020, when compared using the Deltares Aqua Monitor platform (https://aqua–monitor.appspot.com (accessed on 6 June 2022)). A decrease in the level of the reservoir, which was associated with the aridification of climatic conditions, has also been observed in the past, for example, during the periods 1993–1997 and 2011–2012 [3,65].
A retrospective analysis of satellite images for 2015–2021 showed that the reservoir’s water surface area was reduced by ~20% on average compared to the surface area in 2015. The situation was especially critical in 2020–2021. In particular, a significant decrease in water level was recorded in winter, and after the replenishment of water levels in April, an anomalously low area of water mirror (87 ha) was observed from June until October 2020, with the minimum area being observed during the period 2015–2021 (see Figure 5B). However, in the autumn–winter of 2020–2021, the reservoir was filled due to the transfer of water from the Taiganske reservoir to the Simferopol reservoir [66].
The seasonal changes in runoff are related to variations in precipitation compared with variations in the water surface area for the period 2015–2021 (see Figure 5B). As shown in Figure 5B, a significant decrease in precipitation was observed during the cold period of 2020–2021.

3.5. Artificially Increasing Atmospheric Precipitation: Analysis of the Crimean Experience. One of the Possible Solutions?

Active impact on atmospheric processes with the aim of artificially increasing atmospheric precipitation is one of the approaches to solving the problem of water resource scarcity in a certain region on the Crimean Peninsula. Two situations are considered, namely: 29–30 October 2016 above the village Petrovka, Krasnogvardiiskyi district [52,53]; and 29–30 September 2020 near Simferopol [54].
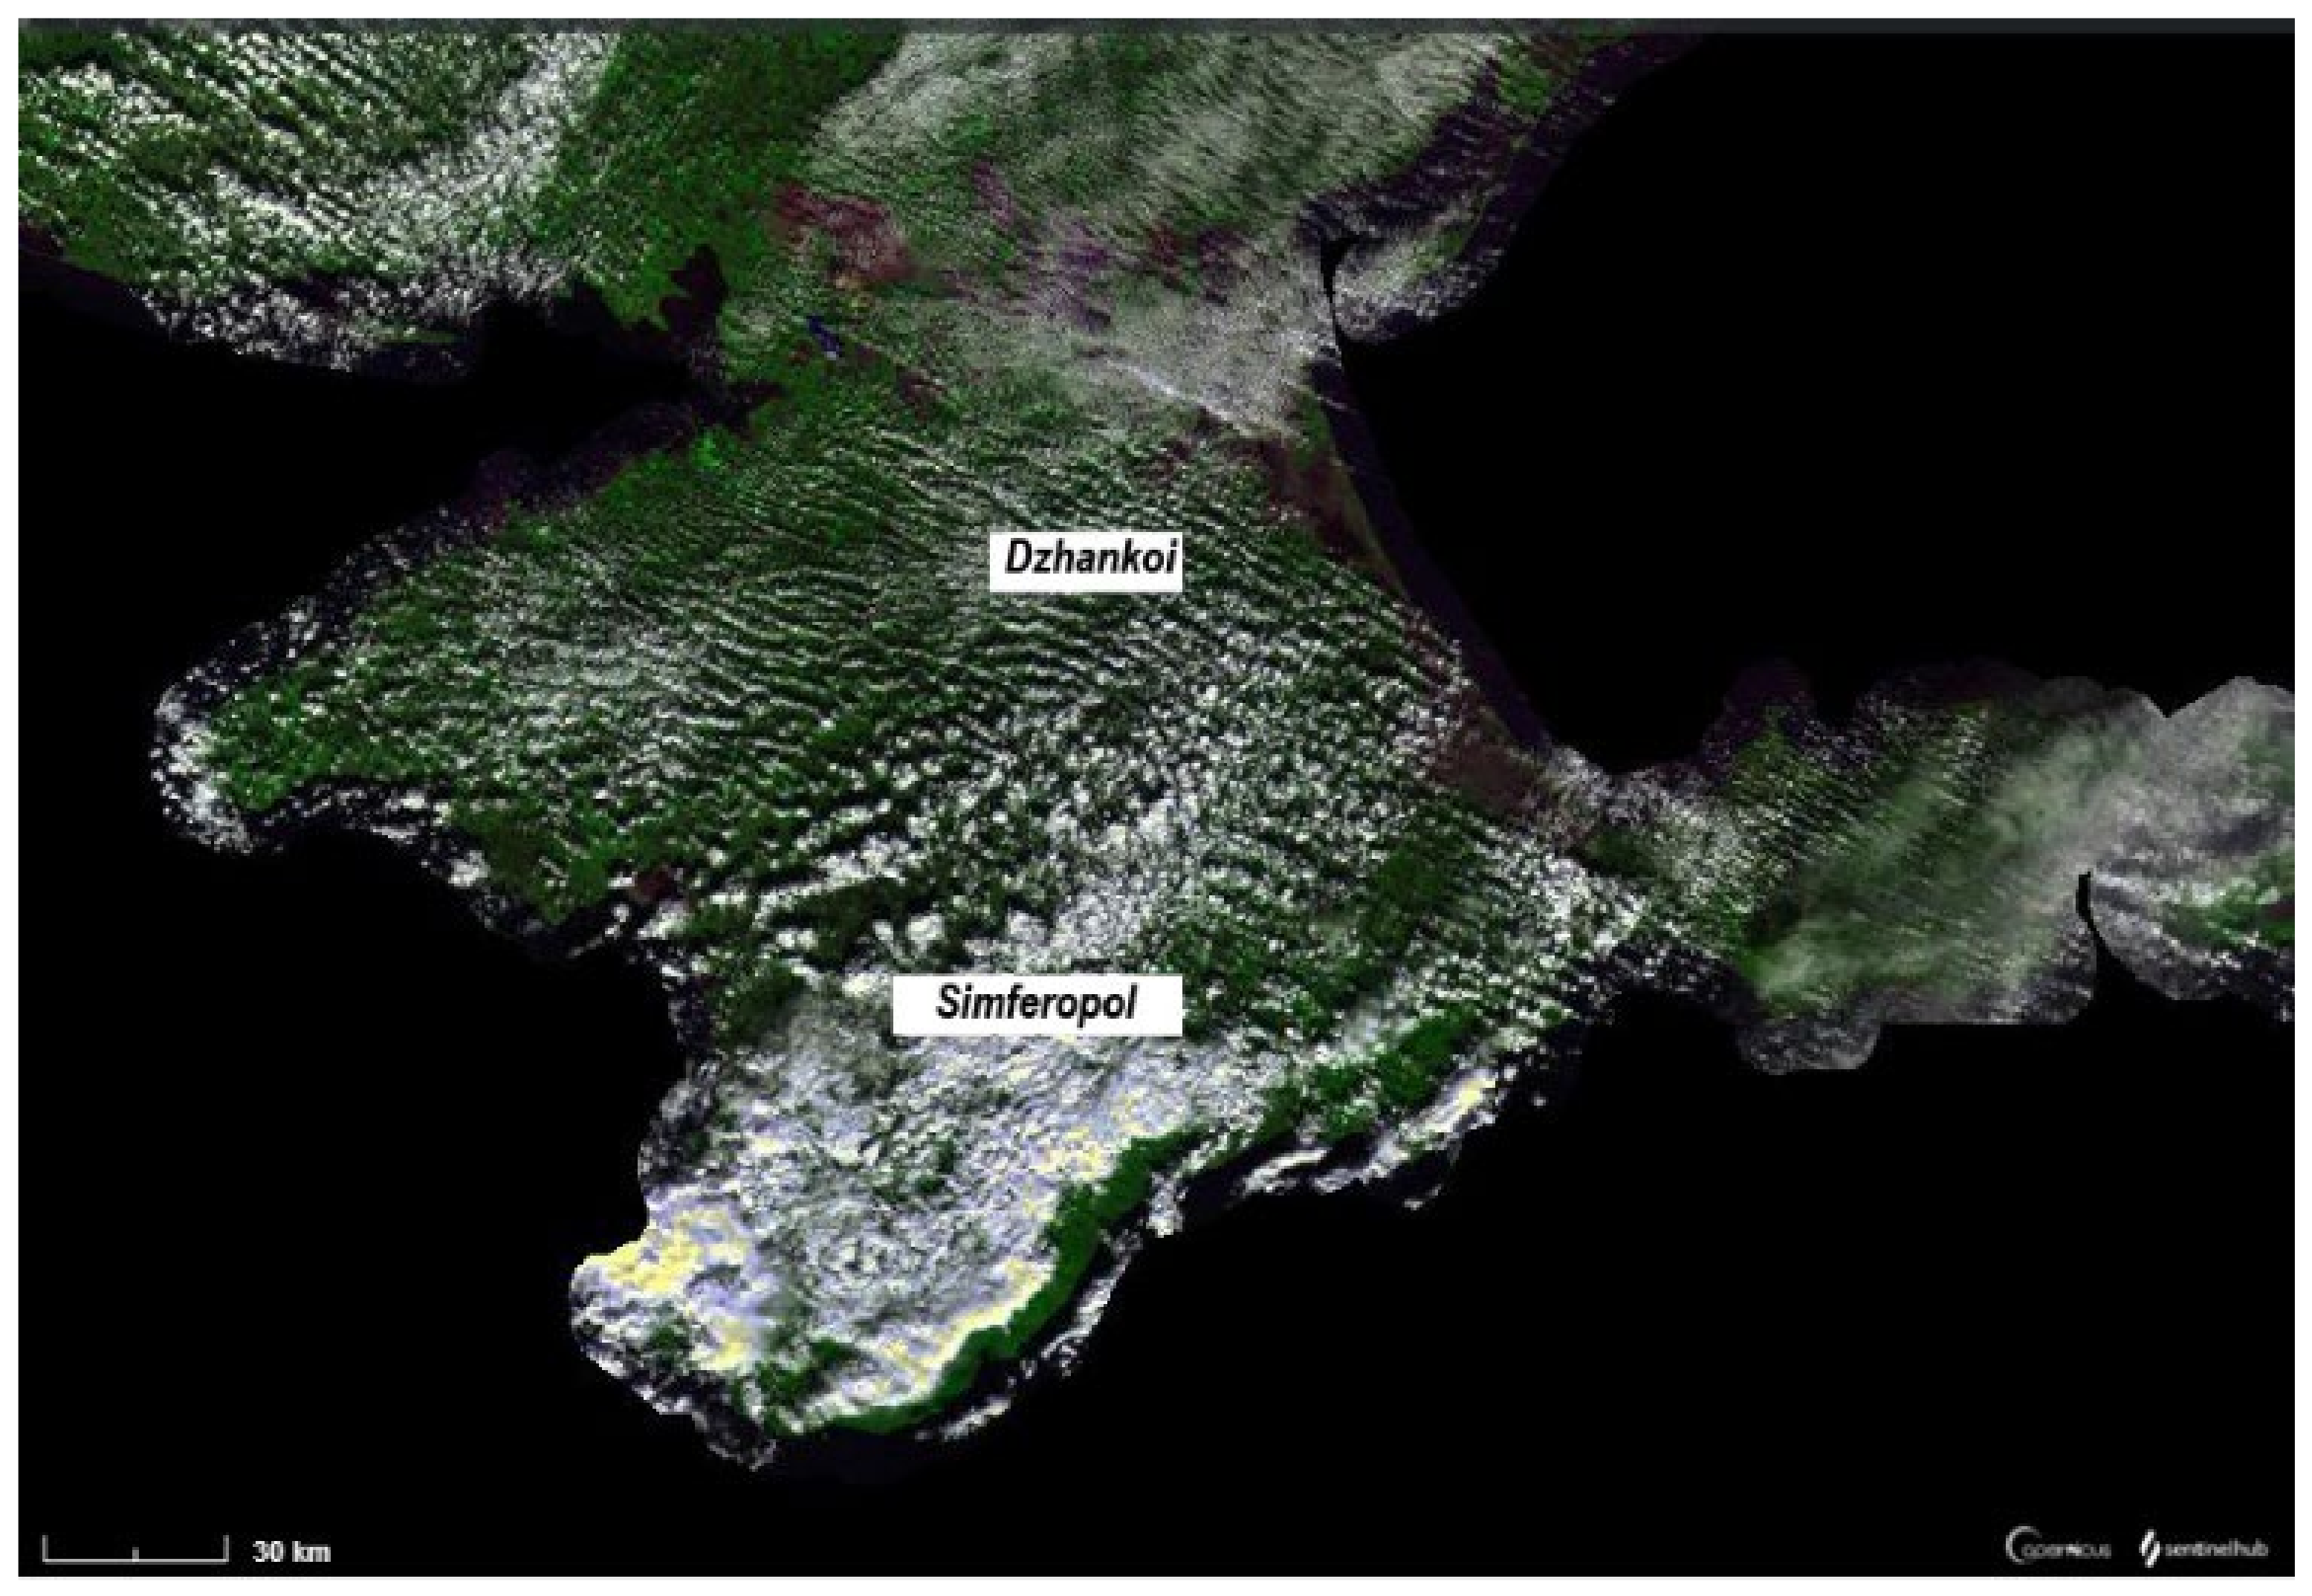
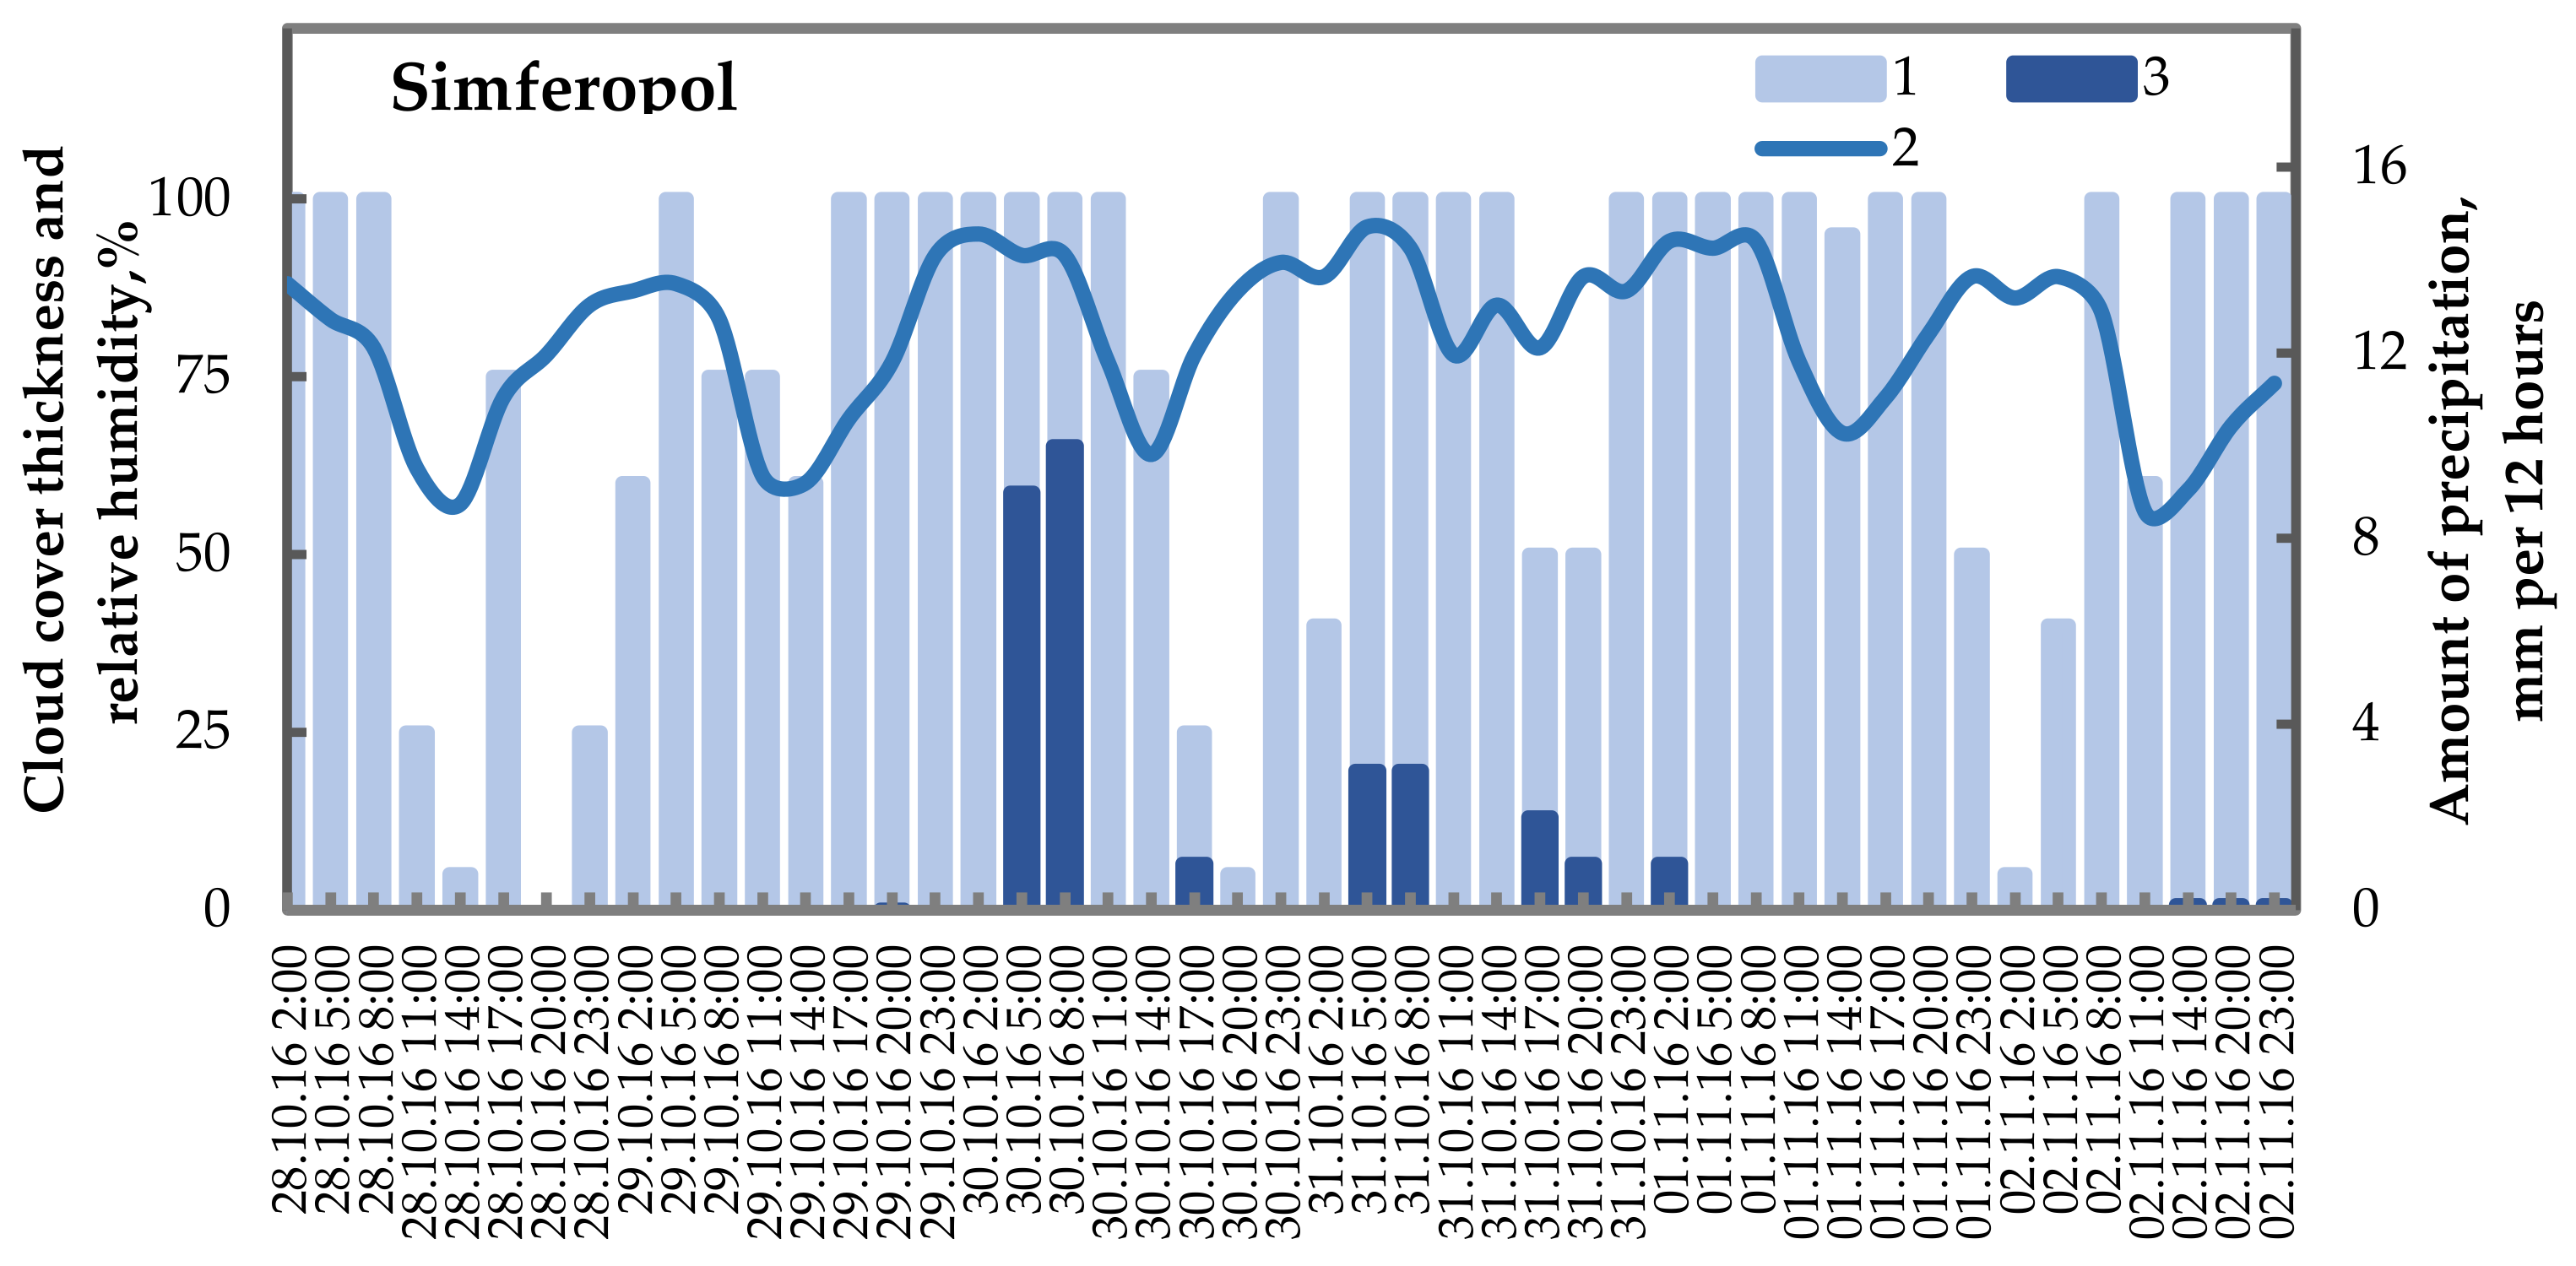
  • Active influences on atmospheric processes in October 2016
The adverse situation with the shortage of fresh water on the peninsula became complicated during the period 2015–2016. In general, that year was not dry; however, the amount of precipitation was lower than usual in the summer of 2016. Only 65–70 mm of rainfall was recorded in June–August at Simferopol meteostation (with a climatic norm of 149 ± 32 mm in 3 months), while 60–65 mm was recorded at Dzhankoy station (with a climatic norm of 122 ± 31 mm). In addition, summer temperatures were 1.5–2.0 °C above the norm [56].
The prevailing weather conditions at the end of October 2016 were used to carry out work on the active influences on atmospheric processes with the aim of artificially increasing atmospheric precipitation. The passage of the cold front determined the synoptic conditions on 29–30 October throughout the Crimean Peninsula (the cloud system of the cold front consisted of several strips of stratus and stratus-rainy clouds, with an upper boundary of 5–7 km and a width of 50 to 150 km, moving over the territory at a speed of about 50 km per hour. A satellite image of the cloudiness (Proba–V) during the passage of the cold front through the Crimean Peninsula and after exerting an active influences on the atmospheric processes on 30 October 2016 is shown in Figure 6 [47].
Thus, about 30 ± 4 mm of atmospheric precipitation fell within 1–2 days at the Simferopol meteorological station, which is located ~70 km south of the site of the active influence from 28 October to 2 November 2016, while the climatic norm in October was 32 ± 23, and in November 45 ± 26 mm/month (see Figure 7). The monthly climatic norm for atmospheric precipitation was almost realized.
The potential amount of additional precipitation as a result of the active influence on atmospheric processes was determined by approximation (1) [41]. On 30 October, at the Simferopol meteostation, natural precipitation of 8–9 mm in 12 h (0.7–0.8 mm/h) was recorded (see Figure 7). On the basis of approximation, it was determined that an additional artificial precipitation of about 0.4–0.5 mm/h (5–6 mm in 12 h) could feasibly fall (see Figure 8).
As shown in [52,53], a particular increase in cloudiness and atmospheric precipitation was achieved as a result of the active influence; the intensity of precipitation was 4–6 mm/h higher than in the cloud zone before the influence (the measurements were taken in the area where the active influence was performed).
As a result of the analysis of the Sentinel-1 radar satellite imagery for 30 October 2016, compared to the period 1–20 October 2016 prior to the beginning of the passage of the cold front over the territory of the peninsula, wet soil areas and potentially standing water areas were detected in some agricultural fields within a radius of 40 km of the village of Petrovka, Krasnogvardiiskyi district (see Figure 9) [50].
2.
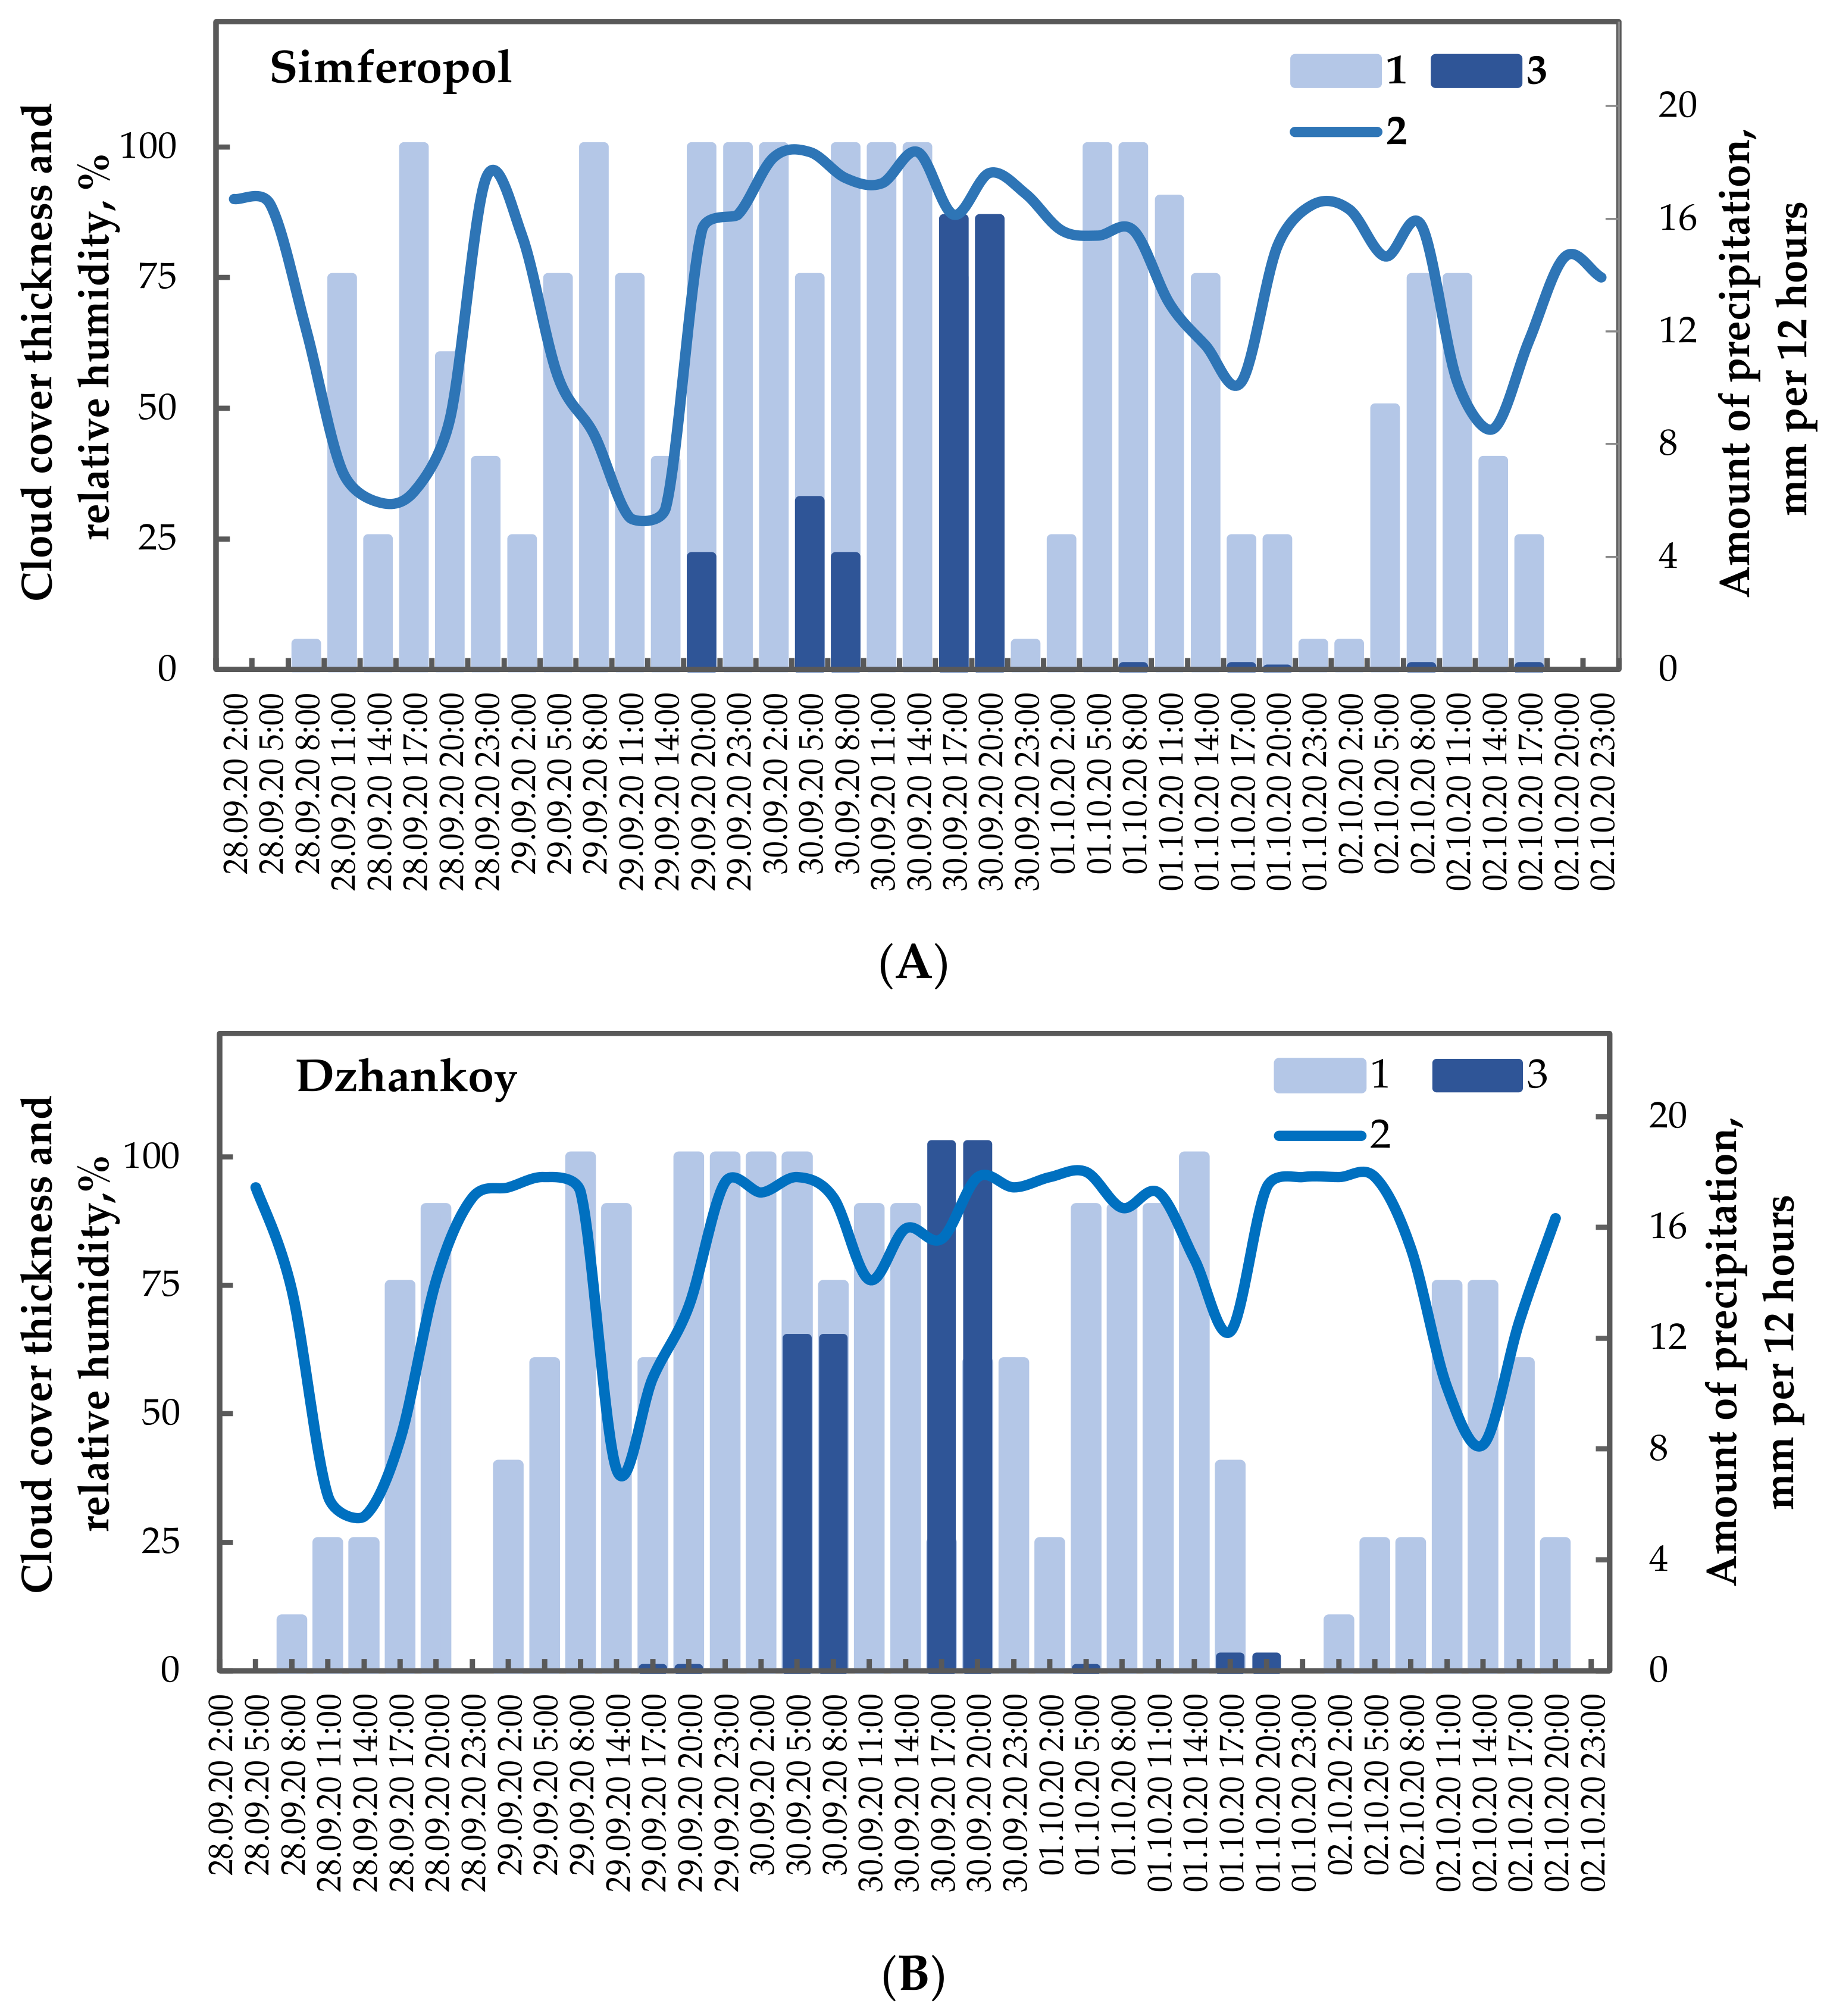
Active influences on atmospheric processes in September 2020.
Weather conditions in September–October 2020 on the peninsula were characterized as warm and predominantly dry, which further aggravated the situation, resulting in a shortage of fresh water on the peninsula. Nevertheless, from 29 September to 2 October the weather on the peninsula was influenced by the Balkan cyclone and the associated cold front [47] (Figure 10). These conditions were used on 30 September for the active influence on the atmospheric processes, aimed at achieving additional precipitation and filling of reservoirs [54].
The observation data at the Simferopol meteostation for the period from 28 September to 2 October 2020, show that during the passage of the corresponding synoptic processes, and as a result of active influences, an additional increase in cloudiness by 15–20% was recorded for 1–2 days, as well as an increase in relative humidity by up to 25–30%, and an atmospheric precipitation of 46 ± 7 mm. The monthly total atmospheric precipitation in September 2020 was about 51 mm (with a climatic norm of 37 ± 23 mm/month for September in 1961–1990). Thus, almost ~120–130% of climatic norms of the monthly precipitation fell over Simferopol in September. At the same time, continuous cloud cover and a precipitation of 63 ± 8 mm were recorded at the Dzhankoy meteostation (~100 km north of Simferopol) from 28 October to 2 November 2020 (with a climatic norm for September of 33 ± 28 mm/month).
The changes in meteorological parameters (cloud cover, precipitation, and relative humidity) due to the specific synoptic processes and the active influences on the atmospheric processes during the Balkan cyclone and the associated cold front at the Simferopol and Dzhankoy weather stations for the period from 28 September to 2 October 2020 are shown in Figure 11. The cloud cover thickness is presented as a percentage of the amount of all observed clouds or their absence.
The potential amount of additional precipitation as a result of the active influence on atmospheric processes was determined by approximation (1). On 30 September 2020 a natural precipitation of 16 and 19 mm in 12 h (1.3 and 1.6 mm/h, respectively) was recorded at the Simferopol and Dzhankoy meteostations (see Figure 11). Then, according to the approximation, an additional artificial precipitation of about 0.6 and 0.5 mm/h (7 and 6 mm in 12 h, respectively) could feasibly fall (see Figure 8).
The spatial distribution of atmospheric precipitation and cloud cover were analyzed before and after the active influence on atmospheric processes using Sentinel-1 SAR images. The satellite data were compared from 1 September to 25 September 2020, and the period after active exposure from 30 September to 5 October 2020 [47,48]. In the last decade of September and the first decade of October, the surface area of the reservoir increased from 109 ha to 126 ha due to weather conditions. However, after 30 September no additional increase in water surface area of Simferopol Reservoir was recorded (see small map frame in Figure 5 for the period 18 September–10 October 2020). A slight increase in the water body surface in the reservoirs from 25–26 September to 5–6 October was due to weather conditions.
Heavy rain fell over Simferopol on 30 September 2020, which caused a large-scale flood in the city [67]. As a result, flooding zones were recorded on Sentinel-1 radar satellite imagery within the city, while an increase in the surface water in the Simferopol reservoir was not detected. The map shows the flooding areas marked in blue color, as a consequence of the rainstorm, and the open surface water of the Simferopol reservoir marked in dark green (see Figure 12). The work on active influence of atmospheric processes in favorable weather conditions on 30 September 2020 did not affect the filling of reservoirs with water.
Thus, in the first case, on 30 October 2016, the wet soil areas were recorded at agricultural fields within a radius of 40 km near the village of Petrovka, Krasnogvardiiskyi district. Meanwhile, in the second case, the realization of atmospheric precipitation, occurring over Simferopol on 29–30 September 2020, led to flooding in the city, but no increase in the water surface area of the Simferopol reservoir following active influence was detected by means of satellite remote sensing [68].

4. Discussion

Use of Satellite Images for Analysis of the Environmental Situation at the Localized Level

The changes in water surface area may strongly depend on the case-specific context, as was demonstrated by [69]. Studies developing the global-scale tool Deltares Aqua Monitor (https://aqua–monitor.appspot.com (accessed on 6 June 2022)), which, with the use of the Google Earth Engine [46], have analyzed satellite imagery from multispectral Landsat satellite data with a resolution of up to 30 m. The application of planetary-scale big satellite data analytics over the long period of earth observation may bring light to the documented and undocumented changes in surface water bodies due to anthropogenic and climate and natural drivers at the localized scale [43,69]. The Deltares Aqua Monitor platform allows users to zoom to the selected water body and compare the yearly mean surface water body area starting from 1985 until 2021. Similar trends of decreasing water surface area in the reservoirs of Crimea were observed on the basis of Landsat data analysis using this platform [69].
We used the same approach to compare the yearly averaged surface water body area as a proxy to define the tendency in water level and reservoir storage, while using Synthetic Aperture Radar (SAR) sensor data from the Sentinel-1 satellite [47]. Sentinel-1 data have a higher spatial resolution of 10 m, higher repeat observation frequency, and are not limited by cloud coverage, compared to Landsat data. This makes Sentinel-1 data an effective tool for the monitoring of water bodies, especially at the localized level. The advantage of Landsat data is the availability of long-term time series covering a time frame of more than 40 years [47].
At the same time, the water surface area can change significantly in the course of months, particularly due to the local weather conditions such as rainfall, and it largely depends on the regime of water resource management, water intake, and runoff levels. Thus, in order to better understand the causality of water surface dynamics and to assess the effectiveness of the applied water management measures, a detailed day-to-day record of water surface areas is essential [3,43,44,69].
Detailed surface water variations for the Simferopol reservoir are shown in Figure 5B. Over the summer and autumn seasons in 2020, a prolonged period of low water was recorded. Then, starting from mid-December, there was a sharp increase in the area of water bodies, which might be explained by the transfer of water from the Taigansk reservoir. Starting from March 2021, a sharp decrease in water surface area was observed, reaching its lowest value over the last 5 years. Such a detailed temporal analysis of the dynamics of water surface area makes it possible to link the local events or factors with a manifestation of their consequences.
To estimate water storage in lakes and reservoirs, measurements of both surface water area and bathymetry can be performed. In the context of the limited access to the area for the field assessment, interesting results were achieved through the combination of satellite imagery with the digital elevation model [70,71], which could be a subject for further research.

5. Conclusions

The climatic conditions of Crimea are semi-arid; therefore, alternative sources of fresh water are needed (transit of water through canals, from other regions, use of underground water resources, desalination, etc.). Significantly increasing water use and consumption (intensification of construction, industry, tourism and militarization) and the cessation of fresh water supplies from mainland Ukraine has reduced the water level in some reservoirs to a critical level, while climate change has exacerbated this situation. There has been a significant decrease in precipitation by 10–15% on the Crimean Peninsula in the last decade, against an increase in surface temperature by 0.8 ± 0.1 °C every 10 years during the period 1991–2020.
The analysis of satellite-driven drought severity index revealed that the vast area of Crimean steppe is exposed to moderate or high drought risk.
According to Sentinel satellite imagery, there is a decreasing tendency for the area of the water mirror in all reservoirs analyzed in this study compared to the water surface area in 2015. The water mirror area decreased by 34% on average in 2021. In three reservoirs, the area of the water mirror decreased by more than 60% compared to 2015: the Frontove, Taiganske, and Mizhhirske reservoirs. The decreasing tendency for the water surface area began to manifest clearly in mid 2019 and continued until 2021. Additionally, a retrospective analysis of satellite images for 2015–2021 showed that the water surface area of the Simferopol reservoir had been decrease by an average of ~20% compared to 2015.
To solve the problems associated with the shortage of fresh water, a series of works on active influences on atmospheric processes were conducted aimed at additional artificial precipitation. Two situations were considered that had mixed results. Therefore, after the active influences, on 30 October 2016, wet soil areas were detected in agricultural fields within a radius of 40 km of the village of Petrovka, Krasnogvardiiskyi district, and while the atmospheric precipitation occurring over Simferopol on 29–30 September 2020 led to the flooding in the city, an increase in the water surface area of the Simferopol reservoir was not recorded.
The lack of fresh water negatively affects the agriculture productivity and soil quality, leading to financial losses and changes in traditional farming. In general, the complexity of the situation is associated with inefficient management decisions of the occupation authorities along with the intensification of militarization of the Crimean Peninsula.

Author Contributions

Conceptualization, S.B. and T.K.; Data curation, S.B. and T.K.; Formal analysis, S.B. and I.V.K.; Funding acquisition, S.B.; Methodology, S.B. and T.K.; Software, S.B. and T.K.; Supervision, T.K. and I.V.K.; Visualization, S.B. and T.K.; Writing—original draft, S.B., T.K. and I.V.K. Writing—review and editing, S.B. All authors have read and agreed to the published version of the manuscript.

Funding

This study was prepared within the framework of the Environmental Policy and Advocacy Initiative in Ukraine, which was implemented by the International Renaissance Foundation and enabled by the financial support from Sweden (Grant №. SG54370, from 15 November 2021 to 31 July 2022, https://www.irf.ua/en/grants/awarded_grants/).

Institutional Review Board Statement

Not applicable.

Informed Consent Statement

Not applicable.

Data Availability Statement

The results presented in this study are based on the data available in the open sources, which are described in the section Methods and Materials and are listed in the References section.

Conflicts of Interest

The authors declare no conflict of interest.

References

  1. The United Nations World Water Development Report 2022: Groundwater: Making the Invisible Visible; Executive Summary. 2022. Available online: https://unesdoc.unesco.org/ark:/48223/pf0000380726 (accessed on 6 June 2022).
  2. Bates, B.C.; Kundzewicz, Z.W.; Wu, S.; Palutikof, J.P. (Eds.) Climate Change and Water; Technical Paper of the Intergovernmental Panel on Climate Change; IPCC Secretariat: Geneva, Switzerland, 2008; p. 210. Available online: https://archive.ipcc.ch/pdf/technical–papers/climate–change–water–en.pdf (accessed on 6 June 2022).
  3. Shinkarenko, S.; Solodovnikov, D.; Bartalev, S.; Vasilchenko, A.; Vypritskii, A. Dynamics of the reservoir’s areas of the Crimean Peninsula. Mod. Probl. Remote Sens. Earth Space 2021, 18, 226–241. Available online: http://d33.infospace.ru/jr_d33/2021v18n5/226-241.pdf (accessed on 6 June 2022).
  4. Karamushka, V.; Boychenko, S.; Kuchma, T.; Zabarna, O. Trends in the Environmental Conditions, Climate Change and Human Health in the Southern Region of Ukraine. Sustainability 2022, 14, 5664. [Google Scholar] [CrossRef]
  5. Bordi, I.; Fraedrich, K.; Sutera, A. Observed drought and wetness trends in Europe: An update. Hydrol. Earth Syst. Sci. 2009, 13, 1519–1530. [Google Scholar] [CrossRef]
  6. World Weather. 2022. Available online: https://en.tutiempo.ne/climate/ukraine.html (accessed on 6 June 2022).
  7. Efimov, V.; Volodin, E.; Anisimov, A.; Barabanov, V. Regional projections of climate change for the Black Sea–Caspian Sea area in late 21st century. Phys. Oceanogr. 2015, 5, 49–66. [Google Scholar] [CrossRef]
  8. Aleshina, M.; Toropova, P.; Semenov, V. Temperature and Humidity Regime Changes on the Black Sea Coast in 1982–2014. Russ. Meteorol. Hydrol. 2018, 43, 235. [Google Scholar] [CrossRef]
  9. Croitoru, A.-E.; Chiotoroiu, B.-C.; Ivanova Todorova, V.; Torică, V. Changes in precipitation extremes on the Black Sea Western Coast. Glob. Planet. Change 2013, 102, 10–19. [Google Scholar] [CrossRef]
  10. Keggenhoff, I.; Elizbarashvili, M.; Amiri–Farahani, A.; King, L. Trends in daily temperature and precipitation extremes over Georgia, 1971–2010. Weather Clim. Extrem. 2014, 4, 75–85. [Google Scholar] [CrossRef]
  11. Hou, J.; van Dijk, A.; Beck, H.; Renzullo, L.; Wada, Y. Remotely sensed reservoir water storage dynamics (1984–2015) and the influence of climate variability and management at global scale. Hydrol. Earth Syst. Sci. 2022, 26, 3785–3803. [Google Scholar] [CrossRef]
  12. Lisovsky, A.A.; Novik, V.A.; Timchenko, Z.V.; Gubskaya, U.A. Surface Water Bodies of Crimea. Management and Use of Water Resources: Reference Book; KRP Uchpedgiz: Simferopol, Crimea, 2011; p. 242. [Google Scholar]
  13. Groundwater Resources of the World and Their Use. 2004. Available online: https://unesdoc.unesco.org/ark:/48223/pf0000134433 (accessed on 6 June 2022).
  14. Miran’kov, D.B. Problems of overcoming water resource deficit in the Republic of Crimea: Adaptation of foreign experience. Scholarly Notes Crimean Federal University. Econ. Manag. 2018, 4, 93–107. Available online: https://cyberleninka.ru/article/n/problemy-preodoleniya-defitsita-vodnyh-resursov-v-respublike-krym-adaptatsiya-zarubezhnogo-opyta/viewer (accessed on 6 June 2022).
  15. Dublyansky, Y.V.; Klimchouk, A.B.; Tokarev, S.V.; Amelichev, G.N.; Spötl, C. Groundwater of the Crimean Peninsula: A first systematic study using stable isotopes. Isot. Environ. Health Stud. 2019, 55, 419–437. [Google Scholar] [CrossRef]
  16. Moore, W.S. The effect of submarine groundwater discharge on the ocean. Annu. Rev. Mar. Sci. 2010, 2, 59–88. [Google Scholar] [CrossRef] [PubMed]
  17. Moosdorf, N.; Oehler, T. Societal use of fresh submarine groundwater discharge: An overlooked water resource. Earth Sci. Rev. 2017, 171, 338–348. [Google Scholar] [CrossRef]
  18. Borisenko, L.S. Hydrogeological Conditions of Submarine Groundwater Discharge in the Crimea. Water Resour. 2001, 28, 15–21. [Google Scholar] [CrossRef]
  19. Rodellas, V.; Garcia–Orellana, J.; Masqué, P.; Feldman, M.; Weinstein, Y. Submarine groundwater discharge as a major source of nutrients to the Mediterranean Sea. Proc. Natl. Acad. Sci. USA 2015, 112, 3926–3930. [Google Scholar] [CrossRef]
  20. Ivanov, V.A.; Prusov, A.V.; Chepyzhenko, A.I. A Submarine Groundwater Discharge in the Region of the Cape Aya (Crimea). Rep. Natl. Acad. Sci. Ukr. 2010, 2, 103–109. Available online: https://www.libr.dp.ua/text/dan_2010_2_18.pdf (accessed on 6 June 2022).
  21. Resource: Fresh Water under the Sea of Azov. 2021. Available online: https://www.eurasiareview.com/12052021-russia-to-drill-for-fresh-water-under-azov-sea-not-to-help-crimea-but-to-back-its-claims-analysis/ (accessed on 6 June 2022).
  22. Fiorillo, F.; Ristić Vakanjac, V.; Jemcov, I.; Milanović, S.; Stevanović, Z. Karst Groundwater Availability and Sustainable Development. In Karst Aquifers—Characterization and Engineering. Professional Practice in Earth Sciences; Stevanović, Z., Ed.; Springer: Cham, Switzerland, 2015; pp. 421–530. [Google Scholar] [CrossRef]
  23. Klimchouk, A.; Tokarev, S. The problems of groundwater source protection for drinking water supply under conditions of exposed karst. Ukr. Geogr. Z. 2014, 1, 43–52. [Google Scholar] [CrossRef]
  24. Shestopalov, V.M.; Boguslavsky, A.S.; Klimchuk, A.B.; Fesenko, A.V.; Godenko, G.E. Modeling Groundwater Resources of the south–west Mountainous Crimea. Geol. Miner. World Ocean 2008, 4, 106–107. Available online: http://dspace.nbuv.gov.ua/handle/123456789/5318 (accessed on 6 June 2022).
  25. Fiorillo, F. Spring hydrographs as indicators of droughts in a karst environment. J. Hydrol. 2009, 373, 290–301. [Google Scholar] [CrossRef]
  26. Yvana, A.; Lienhard, J. Desalination of Brackish Groundwater to Improve Water Quality and Water Supply. In Global Groundwater: Source, Scarcity, Sustainability, Security and Solutions; Mukherjee, A., Scanlon, B., Aureli, A., Langan, S., Guo, H., McKenzie, A., Eds.; Elsevier: Amsterdam, The Netherlands, 2021; pp. 559–575. [Google Scholar] [CrossRef]
  27. Schroedera, D.; Guob, W.; Missimera, T. Groundwater quality change impacts on a brackish–water reverse osmosis water treatment plant design: The City of Clearwater, Florida. Desalination Water Treat. 2021, 211, 31–44. [Google Scholar] [CrossRef]
  28. Resource: Water Desalination in Crimea. Available online: https://www.dw.com/ru/opresnenie–vody–v–krymu–kak–dorogo–ono–obojdetsja–rossii/a–56399577 (accessed on 6 June 2022).
  29. Assouline, S.; Narkis, K.; Or, D. Evaporation suppression from water reservoirs: Efficiency considerations of partial covers. Water Resour. Res. 2011, 47, W07506. [Google Scholar] [CrossRef]
  30. Haghighi, E.; Madani, K.; Hoekstra, A.Y. The water footprint of water conservation using shade balls in California. Nat. Sustain. 2018, 1, 358–360. [Google Scholar] [CrossRef]
  31. Martinez–Alvares, V. Experimental Assessment of Shade–Cloth Covers on Agricultural Reservoirs for Irrigation in South–Eastern Spain. Span. J. Agric. Res. 2010, 8 (Suppl. S2), S122–S133. Available online: https://pdfs.semanticscholar.org/1238/c4cf4dd428fc07de955105a6cff4b3ad46dc.pdf (accessed on 6 June 2022). [CrossRef]
  32. Sylaev, A. (Ed.) Problems of Cloud Physics and Weather Modification; Naukova Dumka: Kyiv, Ukraine, 2004; p. 350. [Google Scholar]
  33. Essays on the History of Weather Modification in the USSR and The Post–Soviet Territory; Sb. RSHMU: Ufa, Russia, 2017; p. 352. Available online: https://www.researchgate.net/publication/324520952 (accessed on 6 June 2022).
  34. Charry, H.; Lininder, R.L. The AWS Handbook of Ground–Based Cold Fog Dissipation Using Vented Liquid Propane; Report AWS–TR–75–255; AIR Weather Service, United States AIR Force: Illinois, IL, USA, 1975; Volume 1—Theory and Practice, p. 55. [Google Scholar]
  35. Fan, J.; Leung, L.R.; Li, Z.; Morrison, H.; Chen, H.; Zhou, Y.; Qian, Y.; Wang, Y. Aerosol impacts on clouds and precipitation in eastern China: Results from bin and bulk microphysics. J. Geophys. Res. Atmos. 2012, 117, D00K36. [Google Scholar] [CrossRef]
  36. Fan, J.; Leung, L.R.; Rosenfeld, D.; DeMott, P.J. Effects of cloud condensation nuclei and ice nucleating particles on precipitation processes and supercooled liquid inmixed–phase orographic clouds. Atmos. Chem. Phys. 2017, 17, 1017–1035. [Google Scholar] [CrossRef]
  37. Hobbs, P.V.; Locatelli, J.D. Ice Nuclei from a Natural Forest Fire. J. Appl. Meteor. 1969, 8, 833–834. [Google Scholar] [CrossRef]
  38. Voloshchuk, V.M. The Kinetic Theory of Coagulation; Hydrometeoizdat: Leningrad, Russia, 1984; p. 283. [Google Scholar]
  39. Leskov, B.N.; Nerobeeva, T.D. On the suitability for the effects of frontal clouds that give precipitation. Sci. Work. UkrNDGMI 1971, 103, 34–41. [Google Scholar]
  40. Nosar, S.V.; Stepura, E.A. Assessment of Potential Artificial Increasing of Precipitation by Weather Modification in the Northern Black Sea Region during Cold Part of the Year (on Example, Kherson Region). Sci. Work. UkrNDGMI 2016, 269, 27–40. Available online: http://nbuv.gov.ua/UJRN/Npundgi_2016_269_6 (accessed on 6 June 2022).
  41. Nosar, S.V.; Stepura, E.A. Possibility of Artificial Increase in Winter Precipitation in the North–Western Black Sea Region (on Example, Mykolaiv Region). Sci. Work. UkrNDGMI. 2014, 266, 26–38. Available online: http://nbuv.gov.ua/UJRN/Npundgi_2014_266_6 (accessed on 6 June 2022).
  42. Gao, H.; Birkett, C.; Lettenmaier, D. Global monitoring of large reservoir storage from satellite remote sensing. Water Resour. Res. 2012, 48, W09504. [Google Scholar] [CrossRef]
  43. Terekhov, A.; Makarenko, N.; Pak, A.; Abayev, N. Using the digital elevation model (DEM) and coastlines for satellite monitoring of small reservoir filling. Cogent Eng. 2020, 7, 1853305. [Google Scholar] [CrossRef]
  44. Marynych, O. (Ed.) Geographical Encyclopedia of Ukraine; Ukrainian Soviet Encyclopedia: Kyiv, Ukraine, 1989; Volume 1, p. 416. (In Ukrainian) [Google Scholar]
  45. Lipinskyy, V.; Dyachuk, V.; Babichenko, V. (Eds.) The Climate of Ukraine; Rayevskyy Publishing: Kyiv, Ukraine, 2003; p. 344. (In Ukrainian) [Google Scholar]
  46. Google Earth Engine. 2022. Available online: https://code.earthengine.google.com/?accept_repo=users/tanyakuchma/Water_serface_change (accessed on 6 June 2022).
  47. EO Browser. 2022. Available online: https://apps.sentinel–hub.com/eo–browser (accessed on 6 June 2022).
  48. Schumann, G.J.P.; Moller, D.K. Microwave remote sensing of flood inundation. Phys. Chem. Earth 2015, 83, 84–95. [Google Scholar] [CrossRef]
  49. Recommended Practice: Agriculture Drought Monitoring and Hazard Assessment Using Google Earth Engine. 2022. Available online: https://un-spider.org/advisory-support/recommended-practices/recommended-practice-agriculture-drought-monitoring/in-detail (accessed on 7 July 2022).
  50. UN–Spider. 2021. Available online: https://www.un–spider.org/advisory–support/recommended–practices/recommended–practice–google–earth–engine–flood–mapping (accessed on 6 June 2022).
  51. Otsu, N. A Threshold Selection Method from Gray–Level Histograms. IEEE Trans. Syst. Man Cybern. 1979, 9, 62–66. [Google Scholar] [CrossRef]
  52. Geographic Information Systems Stack Exchange. 2022. Available online: https://gis.stackexchange.com/questions/364231/gee–smoothing–curve–of–detected–water–area/364305 (accessed on 6 June 2022).
  53. Antonov, S.V.; Bychkov, A.A.; Korneev, V.P.; Sergeev, B.; Chastuchin, A.; Shchukin, G. The use of unmanned aerial vehicles for support of works on weather modification of clouds and fog. Sci. Notes RGHMU 2019, 56, 9–18. [Google Scholar] [CrossRef]
  54. Koloskov, B.P.; Chastukhin, A.V.; Bychkov, A.A.; Petrunin, A.M.; Korneev, V.P.; Vasilenko, S.V.; Ilyin, V.M. Application of Ground–Based Aerosol Liquid Generators in Works on Artificial Precipitation Increase and Anti–Hail Protection. Reports of the Russian Conference on the Physics of Clouds and Active Influences on Hydrometeorological Processes: A Collection of Scientific Papers. Part 1; AETERNA: Ufa, Russia, 2017; pp. 66–73. [Google Scholar]
  55. Resource: Lords of the Rains. 2020. Available online: https://ru.krymr.com/a/poveliteli–dozhdey–v–krymu–vzyalis–za–iskusstvennie–osadki/30780239.html (accessed on 6 June 2022).
  56. Weather for 243 Countries of the World. 2021. Available online: http://rp5.ua (accessed on 6 June 2022).
  57. The Climate Cadastre of Ukraine (Standard Norms for the Period 1961–1990); Central Geophysical Observatory: Kyiv, Ukraine, 2005; p. 48. Available online: http://cgo-sreznevskyi.kyiv.ua/index.php?dv=pos-klim-kadastr (accessed on 6 June 2022).
  58. Open Data—Server. 2022. Available online: https://opendata.dwd.de/climate_environment/ (accessed on 6 June 2022).
  59. CGO: Central Geophysical Observatory of Empirical Data. 2021. Available online: http://cgo–sreznevskyi.kyiv.ua/index.php?lang=en&fn=u_klimat&f=ukraine&p=1 (accessed on 6 June 2022).
  60. Weather and Climate. 2022. Available online: http://pogodaiklimat.ru/archive.php (accessed on 6 June 2022).
  61. Von Storch, H.; Zwiers, F.W. Statistical Analysis in Climate Research; Cambridge University Press: Cambridge, UK, 1999; p. 495. [Google Scholar]
  62. IPCC. 2021: Summary for Policymakers. In Climate Change 2021: The Physical Science Basis. Contribution of Working Group I to the Sixth Assessment Report of the Intergovernmental Panel on Climate Change; Masson-Delmotte, V., Zhai, P., Pirani, A., Connors, S.L., Péan, C., Berger, S., Caud, N., Chen, Y., Goldfarb, L., Gomis, M.I., et al., Eds.; Cambridge University Press: Cambridge, UK; New York, NY, USA, 2021; pp. 3–32. Available online: https://www.ipcc.ch/report/ar6/wg1/ (accessed on 6 June 2022).
  63. Boychenko, S.; Voloshchuk, V.; Movchan, Y.; Serdjuchenko, N.; Tkachenko, V.; Tyshchenko, O.; Savchenko, S. Features of climate change on Ukraine: Scenarios, consequences for nature and agroecosystems. Proc. Natl. Aviat. Univ. 2016, 4, 96–113. [Google Scholar] [CrossRef]
  64. Boychenko, S.; Voloshchuk, V.; Kuchma, T.; Serdyuchenko, N. Long-time changes of the thermal continentality index, the amplitudes and the phase of the seasonal temperature variation in Ukraine. Geofiz. Zhurnal 2018, 40, 81–96. [Google Scholar] [CrossRef]
  65. Popovych, V.F.; Dunaieva, I.A. Standardized Precipitation Index Usage for Reservoirs Operation Regime Analysis. Water Ecol. Probl. Solut. 2018, 3, 39–47. [Google Scholar] [CrossRef]
  66. Resource: Crimea Started Transferring Water from the Taigan to the Simferopol Reservoir. 2020. Available online: https://ru.krymr.com/a/news–v–krymu–nachali–perebrasyvat–vodu–iz–tajganskogo–vodohranilishcha/30767053.html (accessed on 6 June 2022).
  67. Resource: Streets Are Flooded, Cars Are Floating. 2020. Available online: https://krym.aif.ru/incidents/details/zatopleny_ulicy_plyvut_avto_na_stradayushchiy_ot_zasuhi_krym_obrushilsya_liven (accessed on 6 June 2022).
  68. Boychenko, S.; Kuchma, T. About the Efficiency of Active Influences on the Atmospheric Processes Aiming at the Artificial Increase of Precipitation over the Crimean Peninsula in September 2020. In Proceedings of the 3rd International Conference: “Recent Trends in the Development of Information Systems and Telecommunications Technologies”, Kyiv, Ukraine, 25–26 January 2021; pp. 13–16. Available online: https://zenodo.org/record/4540480#.YZTDSWDP02w (accessed on 6 June 2022).
  69. Donchyts, G.; Baart, F.; Winsemius, H.; Gorelick, N.; Kwadijk, J.; van de Giesen, N. Earth’s surface water change over the past 30 years. Nat. Clim. Change 2016, 6, 810–813. [Google Scholar] [CrossRef]
  70. Vanthof, V.; Kelly, R. Water storage estimation in ungauged small reservoirs with the TanDEM–X DEM and multi–source satellite observations. Remote Sens. Environ. 2019, 235, 111437. [Google Scholar] [CrossRef]
  71. Avisse, N.; Tilmant, A.; Müller, M.; Zhang, H. Monitoring small reservoirs storage from satellite remote sensing in inaccessible areas. Hydrol. Earth Syst. Sci. Discuss. 2017, 21, 6445–6459. [Google Scholar] [CrossRef]
Figure 1. Climatic subzones, location of meteorological stations and reservoirs of the Crimean Peninsula used in this study.
Sustainability 14 09995 g001
Figure 2. The annual average temperature (A) and the annual amount of precipitation (B) for the Crimean Peninsula (1—empirical data, 2—linear trend for the period 1900–2021, 3—±σ from trend, 4—linear trend for the period 1991–2020). Statistically significant trends (p < 0.05).
Sustainability 14 09995 g002
Figure 3. Seasonal variation in temperature (A) and precipitation (B) (the values of the climatic norm for the whole region for the periods 1991–2020 (1) and 1961–1990 (2) (scale on the left), the values of linear trend for the period 1991–2020 (scale on the right)). Statistically significant trends (p < 0.05).
Sustainability 14 09995 g003
Figure 4. Drought index from summed vegetation health index (VHI) in June 2020.
Sustainability 14 09995 g004
Figure 5. Decrease in the water surface area of the Simferopol Reservoir in 2021 (dark green) compared to 2010 (light green) according to Landsat satellite imagery (A) and dynamics of changes (B) for the period 2015–2021 according to Sentinel-1 radar satellite data (the period from 18 September to 9 October 2020 is shown in the small graph frame).
Sustainability 14 09995 g005
Figure 6. Satellite image of cloudiness (Proba–V) during the passage of the cold front through the Crimean Peninsula and after the active influence was exerted on the atmospheric processes on 30 October 2016.
Sustainability 14 09995 g006
Figure 7. The daily variation in cloud cover thickness (1—scale on the left), relative air humidity (2—scale on the left) and amount of precipitation (3—scale on the right) at the Simferopol meteorological station for the period from 28 October to 2 November 2016, as a result the passage of the cold front through the Crimean Peninsula and the active influence on atmospheric processes.
Sustainability 14 09995 g007
Figure 8. Dependence of intensity of the artificial precipitation (IA is 1), the coefficient of suitability of clouds for active influences (k is 2) and the additional artificial precipitation (ΔR is 3) on the intensity of natural precipitation (IN), calculated by approximation (1), separately for each of two situations (Simferopol, 30 October 2016 (4); Simferopol (5) and Dzhankoy (6), 30 September 2020).
Sustainability 14 09995 g008
Figure 9. Map of the wet soil areas (blue color) resulting from the passage of the cold front through the Crimean Peninsula and the active influences on the atmospheric processes near Petrovka village, Krasnogvardeisky district, on 30 October 2016.
Sustainability 14 09995 g009
Figure 10. Satellite images of cloudiness (Proba–V) during the passage of the Balkan cyclone and the associated cold, as well as after the active influence on the atmospheric processes on 30 September 2020.
Sustainability 14 09995 g010
Figure 11. The daily variation in cloud cover thickness (1—scale on the left), relative air humidity (2—scale on the left) and the amount of precipitation (3—scale on the right) at the Simferopol (A) and Dzhankoy (B) meteorological stations for the period from 28 September to 2 October 2020, as a result the passage of the cold front through the Crimean Peninsula and the active influence on atmospheric processes.
Sustainability 14 09995 g011
Figure 12. Map of standing water areas and water surfaces areas of Simferopol reservoir near Simferopol city as a result of the passage of the cold front through the Crimean Peninsula and the active influence on atmospheric processes on 30 September 2020.
Sustainability 14 09995 g012
Table 1. Location of the meteostations of the Crimean Peninsula and source.
StationsRegionCodeLatitude, DegreesLongitude,
Degrees
Altitude, mPeriodSource
Ai–PetriCM13399844.4334.0811801991–2021[58]
AlushtaSCC3395944.6734.4371991–2021[59,60]
DzhankoyCS23393445.7234.4081991–2021[59,60]
KerchCS13398345.3736.43491900–2021[59,60]
YevpatoriaCS13392945.1833.37101902–2021 *, 1936–2021 **[59,60]
SimferopolCM23394644.6834.131811900–2021[58,60]
FeodosiaSCC3397645.0335.38261900–2021[59,60]
YaltaSCC3399044.4834.17721900–2021[59,60]
*—for temperature; and **—for precipitations.
Table 2. Comparison of climatic norms of annual average temperature and precipitation and their trends for respective the meteostations on the Crimean Peninsula for the periods 1961–1990 and 1991–2020.
StationsTemperature, °C Precipitation, mm/Year
1961–19901991–20201961–19901991–2020
<T> ±σ, °C/Year<T> ±σ, °C/YearsTtrn, °C/10 Years *<P> ±σ, mm/Years<P> ±σ mm/YearsPtrn, mm/10 Years *
Ai–Petri5.7 ± 0.66.5 ± 1.0+0.881080 ± 260990 ± 257–44
Alushta12.1 ± 0.613.3 ± 1.2+1.21476 ± 103447 ± 99–2
Dzhankoy10.7 ± 0.911.7 ± 0.9+0.84417 ± 79405 ± 128–3
Kerch11.0 ± 0.811.9 ± 1.0+0.87434 ± 76430 ± 129–61
Yevpatoria11.5 ± 0.812.6 ± 0.9+0.82404 ± 78370 ± 83–26
Simferopol10.6 ± 0.811.4 ± 0.9+0.84505 ± 93501 ± 133–22
Feodosia11.9 ± 0.812.8 ± 0.8+0.65449 ± 99475 ± 114–47
Yalta12.9 ± 0.813.8 ± 0.9+0.83628 ± 164591 ± 144–22
* values normalized to 10.
Table 3. Comparison of the water mirror areas of the reservoirs in Crimea in 2015–2021 according to radar satellite data obtained from Sentinel-1.
Reservoir NameYearly Averaged Water Mirror Area of Reservoir (ha)
2015201620172018201920202021
The loading reservoirs
Feodosiya177.0164.5–7%159.7–10%157.9–11%150.8–15%150.6–15%113.9–36%
Frontove341.8276.2–19%235.3–31%195.0–43%168.8–51%169.2–51%127.4–63%
Yuzmak124.0111.0–11%105.0–15%105.4–15%111.3–10%117.3–5%106.4–14%
Mizhhirske116.273.7–37%49.2–58%52.5–55%35.0–70%76.1–35%21.1–82%
Samarlinsk109.699.4–9%97.9–11%95.9–13%96.4–12%96.4–12%89.0–19%
The natural runoff reservoirs
Chornorichensk452.8401.5–11%452.20%473.2+5%466.6+3%349.3–23%381.7–16%
Bilogirsk142.6106.6–25%137.5–4%108.7–24%145.0+2%86.2–40%106.5–25%
Partyzansk168.1156.1–7%169.6+1%165.4–2%159.8–5%97.0–42%110.8–34%
Zagorsk137.2129.5–6%130.0–5%127.3–7%123.8–10%84.5–38%101.2–26%
Simferopol282.4261.0–8%269.3–5%253.5–10%244.6–13%175.5–38%168.0–41%
Shchaslyve 48.140.0–17%44.5–7%43.6–11%42.6–11%37.4–22%42.0–13%
Taiganske 116.763.3–46%55.0–53%37.0–68%143.4+23%85.0–27%36.9–68%
Isobilnenske 52.555.0+5%54.8+5%53.4+2%53.1+1%43.6–17%37.3–29%
Ayanske28.224.1–15%26.8–5%25.4–10%24.3–1422.0–22%25.3–10%
Starokrymske20.817.4–17%28.1+35%24.7+19%31.9+53%24.7+18%13.2–37%
Publisher’s Note: MDPI stays neutral with regard to jurisdictional claims in published maps and institutional affiliations.

