Article

COVID-19-Adapted Multi-Functional Corniche Street Design Assessment Model: Applying Global Sensitivity Analysis (GSA) and Adaptability Analysis Methods

1
Department of Construction Management, College of Architecture and Construction Management, Kennesaw State University, Marietta, GA 30060, USA
2
Department of Architecture, College of Architecture and Construction Management, Kennesaw State University, Marietta, GA 30060, USA
3
Department of Architecture and Urban Planning, College of Engineering, Qatar University, Doha 2713, Qatar
*
Author to whom correspondence should be addressed.
Sustainability 2022, 14(17), 10940; https://doi.org/10.3390/su141710940
Submission received: 18 July 2022 / Revised: 25 August 2022 / Accepted: 29 August 2022 / Published: 1 September 2022
(This article belongs to the Special Issue Rethinking Social Sustainable Construction Practices)

Abstract

:
The world-shaking communicable coronavirus disease (i.e., COVID-19) has become a pandemic threat to a healthy built environment. This study aimed to develop the COVID-19-adapted multi-functional corniche street design (Ca-MCSD) assessment model. Accordingly, this study identified variables coordinating the local environmental, physical, social, cultural, and political mediations of multi-functional corniche street design. Secondly, it measured the weight of every single variable through confirmatory analysis, normalization, and standardization techniques, and an expert-input study then developed the MCSD model and Ca-MCSD model. This study validated the models through a case study (i.e., Al Wakrah corniche street in Dubai, Qatar) and conducted ANOVA regression analysis and global sensitivity analysis (GSA). The Ca-MCSD model evaluates the design quality of a corniche street across five criteria—inclusiveness, desirable activities, safety, comfort, and pleasurability—and forty-two sub-criteria. The regression analysis determined that the MCSD model and Ca-MCSD model are linearly and positively correlated (Y = 0.811777X + 0.383401), where the Pearson regression coefficient (r) equaled 0.903729, r2 equaled 0.816727, and the p-value was 0.025 with 95% confidence intervals. The research found that, before the COVID-19 pandemic, microclimate comfort (avWSc.3.4 = 7.880), community gathering places (Sc.2.1), availability of foods (Sc.2.4), appropriate maintenance and physical condition (Sc.3.6), and attractiveness of space (Sc.5.8) (avW = 6.000) played critical roles in designing a multi-functional corniche street. However, after the onset of the COVID-19 pandemic, the key drivers changed to microclimate comfort (favWSc.3.4 = 12.632), appropriate maintenance and physical condition (favWSc.3.6 = 9.618), physical/visual connection or openness to adjacent spaces (favWSc.4.1 = 4.809), and over-securitization (favWSc.4.1 = 4.287).

1. Introduction

The growing demand for and resurgence in designing public spaces and pedestrian-oriented streets have persuaded urban professionals to design multi-functional public spaces to meet the majority of users’ needs while supporting their psychological, social, and psychiatric health [1,2,3]. The usage purpose assigns different roles to public spaces, distinguishing between utilitarian-oriented public space (e.g., performing events and programs, etc.) and recreation-oriented public space (e.g., exercise, play, etc.). A good public space metaphorically symbolizes the public realm [4,5,6,7]. Oldenburg [8] called good public spaces ‘third places’, meaningful, democratic, responsive, and diverse places, offering possibilities for social interactions by enhancing and developing personal and social skills. Such spaces represent harmonious areas, bringing vitality and livability to the city [9,10,11,12]. The public spaces within a city serve multiple functions: basic survival, communication, and entertainment [5,10,13]. Rybczynski [14] and Banerjee [15] stated that public spaces are arenas of political, commercial, civic, and social functions. Public spaces may influence users’ attitudes, beliefs, and personal perceptions [5]. Users’ preferences in public spaces depend on responsiveness, the generated and supported activities, sense of place, sense of community, and identity [16,17,18], and freedom and support for republican values [15]. Humanizing the environment through social contacts provides opportunities to ensure the democratic values of public spaces. A corniche street is a public space that collectively serves arenas of social interaction and facilitates active and passive social integrative functions and social life [19]. A corniche street can promote discovery, coherence, active engagement, learning, exchanging social dialogues and information, and fostering social awareness [19].
Previous studies on corniche streets have devised different conceptual interpretations at various scales and values for urban designers, sociologists, health scientists, and political scientists. They considered the public space a physical space generating the interrelation between space and users [20]. For instance, UN-Habitat [21] classified public spaces into various types, while the attributions may vary according to cultures, regions, and policies. UN-Habitat’s classification of public spaces was based on geographic conditions, legal frameworks, economic development, urban texture, and urban fabric, while all types can guarantee maximum versatility and access. UN-Habitat [21] also classified public spaces based on functionalities to improve transportation efficiency, enhance urban safety, improve environmental sustainability, generate citizen involvement, create high-quality cities and urban commons, promote income and wealth creation, improve public health, and stimulate equity, social inclusion and citizen involvement. Indeed, all public spaces are revived and retrofitted by modernity and modifications [22,23,24]. Modernity greatly affects public spaces, with slum upgrading, urban extension, urban transformation and densification, and city-wide revitalization strategies being observed extensively [22,25]. Hence, modernized multi-functional corniche streets can host open-air markets, programs and performances, political events, and informal sector activities while executing urban mobility roles.
However, these days, the world-shaking communicable coronavirus disease (i.e., COVID-19) has become a pandemic threat and a challenge to public health and the built environment, forcing governments and urban professionals to enforce innovative commitments and solutions regarding public healthcare in social places (such as public places, streets, and open spaces). The impact and risks of COVID-19 on health and well-being are being investigated by hundreds of researchers worldwide [26,27,28]. Since the start of the COVID-19 pandemic, a team of 680 experts from 51 countries has gathered to provide a range of advanced advice regarding occupant risk prevention and precautionary principles in building indoor and outdoor environments. They have outlined this advice based on the best practices from countries challenged with COVID-19. This virus is quickly spreads via aerosols and droplets; by July 2020, the World Health Organization (WHO) provided health scientists with some strategies for reducing airborne transmission significantly. Accordingly, built environment experts have formulated a series of building-oriented strategic actions and solutions [29]. Architects, urban designers, interior designers, and engineers are urged to work effectively, utilizing guidance and exposure to mitigation strategies and actions. As implementing these actions can provide a trustable healthy built environment for people. Urban designers have significantly pledged to design corniche streets and public areas where can minimize health risks for users. Meanwhile, the International WELL Building Institute (IWBI), the International Union of Architects (UIA), the American Society of Heating, Refrigerating and Air-Conditioning Engineers (ASHRAE), the World Green Building Council (WorldGBC), the International Living Future Institute (ILFI), and a series of influential international associations have supported their efforts in addressing these issues. Additionally, harmonizing health and urban resilience can create healthier communities and spaces for people [30]. WELL, Building Standard (WELL-BS) is a universal design tool that helps researchers and designers to design and operate inclusive buildings, spaces, and places that are equitable, flexible, and intuitive for vulnerable populations. The WELL-BS implements eight goals in designing a space—comfort, body fit, understanding, awareness, social integration, wellness, personalization, and cultural appropriateness. However, these goals were hardest hit by the COVID-19 pandemic. Accordingly, the International WELL Building Institute (IWBI) advocated lifestyle and behavior changes during the COVID-19 pandemic focusing, for example, on indoor air quality. Universal design strategies have also been applied to COVID-19 post-pandemic to maintain inclusive design, for instance by promoting the wellness and mental health of users through social connectedness and ergonomics [31].
Researchers found that COVID-19’s spread can be affected by heterogeneities in demographic structure, seasonal effects, population mixing, the transmission process network, incubation period, saturation, and the physical qualities of the built environment. However, there is insufficient evidence regarding urban management’s best practices and lessons from prior pandemics and preventative measures applicable to COVID-19. Urban professionals have mainly focused on chronic diseases, while the attention paid to infectious diseases remained minimal. Governments, authorities, and urban professionals have provided a few de-urbanization solutions to control and mitigate COVID-19 risks. Accordingly, decentralizing services and supplies, isolating communities, and restricting social interactions have substantially impacted the functionality of public spaces. Indeed, these risk-controlling actions are short-term treatments, not long-term consolidated treatments. The current research demonstrates that COVID-19-adapted corniche streets can help us to create a healthy and protected built environment that can help to meet our needs as before while implementing the risk-controlling protocols for COVID-19 (i.e., the protocols restricting respiratory, cardiovascular, and infectious illnesses caused by COVID-19). A COVID-19-adapted multi-functional corniche street can promote socio-environmental urban management by creating a high-quality and healthy built environment. In particular, this study seeks to contextualize the COVID-19-adapted corniche street by interpreting and reformatting the controversial functions of public spaces.
Reviewing the literature indicates that several public space assessment models/tools have been developed, such as quantitative or qualitative models/tools, including checklists, audit tools, level-of-service scales, inventories, questionnaires, and survey forms. These public space assessment models/tools apply specific assessment processes, frameworks, and indicators for evaluating the functionality of public spaces. These models/tools are clustered around different perspectives. We found Androulaki et al.’s [32] classification to be very comprehensive. This classification was performed based on strategic planning and management perspectives, and has five types: (i) public/private partnership models, (ii) event-based models, (iii) self-governing special assessment district models, (iv) maintenance and technical assistance partnership models, and (v) grassroots partnership models. OpenCity is one of the established toolkits that provide guiding principles and actionable tactics to design an inclusive public space responsive to the needs of culturally diverse communities [33]. OpenCity toolkit was developed based on the philosophy of eyes on the street and design for diversity. It covers physical accessibility, users’ connections, flexibility, and safety, leading to a sense of belonging [33]. The Public Space toolkit (created by +Studio) aids residents and organizations through straightforward assessment methods, including activity observation, surveys, bicycle and pedestrian counts, and complementary ideas for further data collection and analysis [34]. The public space policy framework is a tool applicable in either new or existing cases. This framework intends to help urban professionals to understand the magnitude of localized public space policy and management-level strategies and deepen the recognition of local government’s roles and responsibilities. The framework exploits public spaces at a city level, meeting the Sustainable Development Goals (SDGs) through public participation, equity, transparency, efficiency, and accountability. The socio-ecological framework (developed by [35]) can measure a series of factors influencing public health, social interaction through different levels of causality (i.e., individual, social, socio-cultural environments, and physical environment), and health policy. UN-Habitat [21] also developed several tools associated with public space. For instance, turning spaces into places is a placemaking guidebook supported by the Municipal Spatial Planning Support Program in Kosovo, used by the mayors, urban planners, and urban developers of similar cities. To sum up, the public space assessment models or tools vary in implementation, while they have three major common outputs: (i) a comprehensive list of variables that support or hinder the functionality of the public space, (ii) measuring the weight of each variable, and (iii) assigning a score to label public spaces from superior to poor.
According to the mentioned issues, it is vital to have an assessment model to measure COVID-19 health risks within our public spaces and public areas. Hence, this research work aimed to develop the COVID-19-adapted multi-functional corniche street design (MCSD) assessment model. This study conducted two research phases to achieve this aim. Phase one developed the multi-functional corniche street design (MCSD) model, and the second phase developed the COVID-19-adapted MCSD model. Accordingly, this research work formulated a set of objectives. Objective one was to investigate and identify the MCSD model’s variables coordinating the local environmental, physical, social, cultural, and political mediations of the multi-functional corniche street design by conducting an exploratory study, a systematic literature review, and content analysis. Objective two was to measure the weight of every variable through confirmatory analysis, normalization and standardization techniques, and an expert-input study. In addition, the research conducted a global sensitivity analysis (GSA) to validate the MCSD model. Applying GSA to the MCSD model helped us measure the links between the model’s vulnerability resources and the uncertainty of its properties. The last objective was to develop the COVID-19-adapted MCSD model through a case study (i.e., Al Wakrah corniche street in Dubai, Qatar) and conduct the adaptability analysis method. The COVID-19-adapted MCSD model is a decision support tool used to assess and quantify the capability of corniche streets in mitigating and controlling COVID-19′s health risks.
The Ca-MCSD model is a decision support tool under the built environment rating system category. Some well-known built environment rating systems include the Green Neighborhood Index (GNI) [36], the Built Environment Assessment Tool (BE Tool) [31], Leadership in Energy and Environmental Design for Neighborhood Development (LEED-ND) [37], and the Comprehensive Assessment System for Built Environment Efficiency (CASBEE) [38]. The GNI is a rating system used for urban and regional planning. GNI formulates and compiles green development strategies and transportation management policies. The LEED-ND is an incorporated rating system used to evaluate and assess the neighborhood across sustainability principles and criteria. LEED-ND then indicates and certifies to what degree the neighborhood implements the sustainability principles, particularly healthy living, environment quality, vehicle travel mile reduction, and automobile independence. A BE Tool measures the quality of the built environment across five core features, including transportation infrastructure, walkability, bikeability, public health, physical activity, and food environment accessibility. All mentioned rating systems have a series of criteria and sub-criteria that are used to assess the study site. Additionally, these rating systems certify the assessed study site according to the total points earned, having different grading levels; for example, LEED has four grading labels; gold, silver, bronze, and non-certified. The Ca-MCSD model was developed based on the predominant structure of the mentioned rating systems. Urban professionals (i.e., urban designers and planners, urban developers, landscape architects), local authorities, and local municipal decision-makers would be its target end-users and practitioners. They may apply the Ca-MCSD model to both existing and under-design cases.

2. Materials and Methods

This section presents the multiple analysis methods and quantitative techniques used to develop the MCSD and Ca-MCSD models.

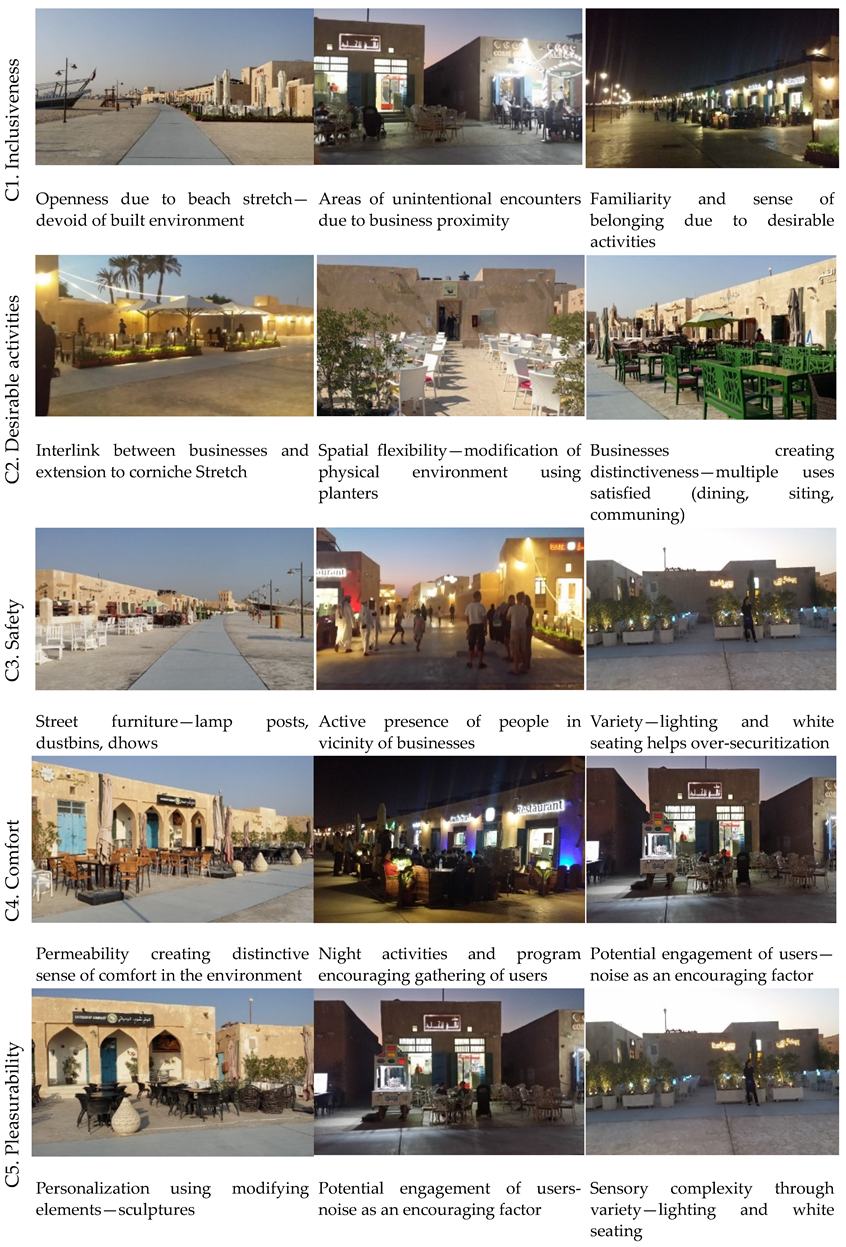
2.1. Exploratory Analysis

In phase one, we conducted an exploratory analysis to investigate and identify the comprehensive list of variables affecting multi-functional public spaces. Then, these variables were integrated to develop the MCSD and Ca-MCSD models. In addition, we conducted an in-depth theoretical review on different disciplines (i.e., sociability, quality management, decision-making, and public health) in designing COVID-19-risk-free multi-functional corniche street. We employed a systematic literature review and content analysis for the exploration study. The systematic literature review is a replicable, scientific, and transparent method [39]. This method significantly minimizes bias and errors during variable exploration. The sources used in this study were available books, conference proceedings, and journal articles. As the first step, the specific list of keywords (relevant to the topic) was applied to find the initial literature set. The following keywords were applied in various combinations to obtain the most relevant literature effectively: multi-functional corniche street, multi-functional public space, sustainable public space, public space assessment, and COVID-19 health risks. Searching for these keywords, we searched through the following journals that have publications related to our topic, including Environment and Behavior, Sustainability, Journal of Urban Design, Social Indicators Research, Journal of Urban Planning and Development, Journal of the American Planning Association, Journal of Environmental Psychology, American Journal of Preventive Medicine, Sustainable Cities and Society, Journal of Architectural and Planning Research, and Advances in Space Research. The articles were then filtered based on the research fields focusing on urban design, landscape architecture, and public health. In particular, the articles analyzed covered personal psychology (e.g., linger, meeting, relaxation, etc.), sociability, public health purposes (e.g., exercise, recreation, entertainment, etc.), urban context, and setting (e.g., pocket park within a dense urban district, loose open space in a sprawling suburban area, etc.), and cultural and environmental interventions in corniche streets. In this step, almost sixty articles were explored, and then the scope narrowed to twenty fully relevant articles for our study. Next, the twenty articles were reviewed and synthesized in detail using the content analysis method. The content analysis method helps researchers to synthesize the principles and criteria based on the frequencies cited in the studied documents [40]. Accordingly, employing the content analysis method resulted in a list of criteria and sub-criteria affecting the quality and performance of corniche streets. These criteria and sub-criteria were then integrated into the Ca-MCSD index model. The frequency values determined the initial weight of each sub-criterion in developing high-quality and COVID-19-risk-free multi-functional corniche streets. The frequency values were be transferred to the confirmatory analysis step.

2.2. Confirmatory Analysis

The exploratory analysis step resulted in the frequency values. The frequency value is the sum of citation counts. For example, the frequency of sub-criterion Sc.1.1. (Users with diverse ages) is eight. This means that eight of the listed researchers in Table 1 considered diverse ages in corniche street design. After obtaining frequency values of variables through exploratory analysis, we measured the weight of variables through confirmatory analysis. First, the confirmatory analysis measured the weights of variables by applying normalization and standardization methods. Then, the MCSD model was developed using the normalized weight of all variables.
The variables’ frequency values may dilute an equally important variable (which may receive fewer citations than other variables). This issue may lead to insufficient data in the process of data mining and data analytics [41]. Hence, we implemented the feature scaling method to normalize the independent variables of the MCSD model. Data normalization aids in indicating the weight of each variable, contributing proportionately to its corresponding cluster and then to the whole network. We used the min-max rescaling normalization method to perform a linear transformation of the original data. This method scales the model’s variables in the range of 0 to 1. The min-max rescaling method was selected for this research as it can fit the nature of data in the MCSD model, and it follows Equation (1), where x ´ is the normalized value and x is the original value.
x ´ = x min x max x min x
We conducted standardization after normalization. Standardization helps to assign equal weight to different criteria, which involves covering several sub-criteria [42]. We applied the Z-score standardization method, which can find the probabilities of the dataset. The Z-score standardization method is broadly applied in logistic regression research. The Z-score standardization indicates the value of each variable based on the distribution mean, with a standard deviation of 1, unit-variance, and zero-mean, following Equation (2), where x is the original variable vector, σ is the standard deviation, and x ¯ is the mean vector.
x ´ = x x ¯ σ
After completing the standardization process and obtaining the preliminary weight of every variable, we conducted an expert input study by inviting a group of experts involved in sustainable urban design and planning, public health, and developing decision support tools. The experts were asked to structuralize the MCSD model’s rating ranges, assessment methods, and assessment ranges. As the nature of the variables varied, the experts indicated diverse assessment methods, ratings, and assessment ranges for every variable (it is elaborated in Section 4).
Table 1. Results of exploratory analysis and content analysis, determining the criteria and sub-criteria of the model.
ReferencesPublic Space Design Dimensions; (i) Urban Public Spaces and Values, (ii) Sociability Role of Public Spaces, (iii) Streets as Primary Public Spaces
C1. InclusivenessC2. Desirable ActivitiesC3. ComfortC4. SafetyC5. Pleasurability
Sc.1.1. Users of Diverse AgesSc.1.2. Users with Different GenderSc.1.3. Users with Diverse CultureSc.1.4. Users of Diverse RacesSc.1.5. Users with Diverse Physical AbilitiesSc.1.6. Entrance ControlledSc.1.7. Diversity of Activities and BehaviorsSc.1.8. Opening HoursSc.1.9. Differential SignageSc.1.10. Over SecuritizationSc.1.11. Openness and AccessibilitySc.1.12. Users’ Participation in Activities within SpaceSc.2.1. Community Gathering Third PlacesSc.2.2. Range of Activities and BehaviorsSc.2.3. Spatial Flexibility Suiting User NeedsSc.2.4. Availability of FoodsSc.2.5. Diversity of Businesses Offered Sc.2.6. Suitability of Space Layout and DesignSc.2.7. Usefulness of BusinessesSc.3.1. Seating Areas (Public)Sc.3.2. Seating Areas (by Business)Sc.3.3. Street Furniture and ArtifactsSc.3.4. Microclimate Comfort (Shade and Shelter)Sc.3.5. Elements Discouraging Spatial UseSc.3.6. Appropriate Maintenance and Physical ConditionSc.3.7. Noise Pollution Sc.4.1. Physical/Visual Connection or Openness to Adjacent SpacesSc.4.2. Appropriate Maintenance and Physical ConditionSc.4.3. Lighting QualitySc.4.4. Over SecuritizationSc.4.5. Safety from Crimes during the DaySc.4.6. Safety from Crimes after DarkSc.4.7. Safety from Traffic VolumeSc.5.1. ImageabilitySc.5.2. Sense of EnclosureSc.5.3. Permeability of Facades to the Street Front Sc.5.4. Personalization of Street Front and Building Front Sc.5.5. Articulation and Variety of Architectural FeaturesSc.5.6. Sensory Complexity (Density of Sidewalk Elements)Sc.5.7. Sensory Complexity (Variety of Sidewalk Elements)Sc.5.8. Attractiveness of SpaceSc.5.9. Interestingness of Space
[1]
[2]
[5]
[9]
[11]
[33]
[43]
[44]
[45]
[46]
[47]
[48]
[49]
[50]
[51]
[52]
[53]
[54]
[55]
[56]
Frequency8444578334568543433654323410453445665565655

2.3. Adaptability Analysis

After developing the MCSD model, we developed the Ca-MCSD model. The COVID-19 adapted-MCSD model is an adjusted version of the MCSD model responding to COVID-19 health risk control and mitigation. For developing the COVID-19-adapted MPSI model (i.e., Ca-MPSI model), we implemented the MCSD model in an actual site (i.e., Al Wakrah corniche street in Doha, Qatar). Accordingly, Section 3 presents the development of the MCSD model, and Section 4 presents the developed COVID-19-adapted MCSD model. In this regard, we conducted adaptability analysis. Several methods and tools have been developed to conduct problem-oriented adaptation research (e.g., [57,58]). Hildebrand and Russell [59] stated that several variables should be used to achieve broad adaptation. Hildebrand and Russell [59] applied Finlay–Wilkinson regression, which alters the interpretation of specific adaptations to a different environment rather than a general adaptation. Hence, adaptability analysis is a regression analysis of the variable network.
An adaptation type should be selected that is suitable for the functional evaluation of the built environment. We found the ‘Diagnostic framework for problem-oriented adaptation research’ to be the most appropriate approach. This framework (developed by [60]) characterizes three adaptation challenges: identifying adaptation needs, measures, and appraising adaptation options. A framework is a policy-making tool that aids in selecting the method for each type of adaptation challenge through its decision trees and based on private, public sectors, or stakeholders involved in the research. Hinkel and Bisaro [30] suggested that analysis of variance (ANOVA) is mostly applied in adaptation analysis studies. ANOVA constitutes statistical models and variance and mean estimation procedures for the variables that induce different variations [61]. ANOVA applies the sample variance through the equation S 2 = 1 n 1 y i y ¯ 2 where the sum of squares (SS) is the reference for the summation, the degree of freedom (DF) is referred to as the divisor, and the equation results in the mean square (MS). To test the ANOVA hypothesis, we conducted F-tests and calculated the probability (p-value), where the p-value of the value of F is equal to or greater than the observed value.

2.4. Global Sensitivity Analysis (GSA)

We conducted global sensitivity analysis (GSA) to verify and validate the Ca-MCSD model. GSA has multiple significant capabilities: (i) to identify the dominant and leading controls of a model, which can support the decision-making models; (ii) to split output uncertainty into a set of uncertainty sources in the model (e.g., measurement errors of input data, unknown parameters, etc.), which can prioritize and manage uncertainty reduction; and (iii) to explore the comparative effects of parameters regarding the predictive accuracy, which can assist in model verification, calibration, and simplification [62,63]. With the aid of several GSA techniques, the effect of variability and uncertainty in the Ca-MCSD model’s input data’s behavior on the outputs was investigated. The current research applied ranking-GSA techniques, including cumulative distribution function (CDF), probability density function (PDF), and parallel analysis.
We estimated CDF, which is the probability of the variance and standard deviation for the probability distribution of the MCSD model’s outputs. In CDF, the value of the sub-criterion is equal to or less than x: F x = P r X x = α . For discrete output distributions, CDF uses the equation F x = i = 0 x f i , where F (cumulative distribution function) is determined from f (probability density function). The probability was calculated through P X = b = F x b lim x b F X x , where X is the variable with an x value of b. We also estimated the PDF of the MCSD model’s outputs (n = 42) to measure the probability of the continuous distributions. PDF has a discrete distribution function of the variable X (i.e., sub-criterion X) with the value x, and is expressed as f x = P r X = x . Since the MCSD model’s outputs have the lognormal distribution, PDF will be computed through this equation; f x = 1 x ω 2 π   e x p I n x θ 2 2 ω 2 ; where 0 < x < , θ is mean, and ω 2 is variance. Additionally, we computed the standard normal distribution curve using this equation :   y = 1 σ 2 π e 1 / 2 Z 2 . These ranking-GSA techniques (i.e., CDF, PDF, and parallel analysis) support robust decision-making and dominant control of the Ca-MCSD model, reducing uncertainties and cutting outputs’ variances. These techniques can also determine the consequent ordering of the most prominent variables in the Ca-MCSD model. The MCSD model is a qualitative-based decision-making model; hence, GSA evaluates and interprets the model’s space-distributed outputs to a scalar output metric.

3. Developing the MCSD Model

3.1. Exploring the MCSD Model’s Variables

The exploratory study aimed to investigate the design variables of multi-functional corniche street. By applying the systematic literature review and content analysis methods, we explore the functional variables of corniche street design. According to the systematic literature review and content analysis findings, functional variables are clustered into five criteria (C1. Inclusiveness, C2. Desirable activities, C3. Safety; C4. Comfort, and C5. Pleasurability), where each criterion constitutes a series of sub-criteria. The readers may study our previous article (i.e., Ferwati et al., 2021) to understand clustering and sub-clustering the variables. That article explained the inductive and deductive procedure and results of the systematic literature review and content analysis. The following describes the criteria and the embedded sub-criteria briefly.
C1. Inclusiveness: Urban professionals designate public spaces as arenas promoting users’ collective shared interests [43]. Public spaces witness various user groups’ differences and conflict resolution while offering the opportunity for socializing and fulfilling their needs. The other important aspects are flexibility and ambiguity, accommodating changes in users’ behaviors and activities [11,12,44]. These factors are associated with appropriate pockets within public spaces [35]; however, the extent of inclusiveness of any public space depends on the range of activities supported and the users engaged [5].
C2. Desirable activities: Urban sociologists advise that constructing place identity depends on the users’ experiences associated with activities and users’ familiarity influencing the meaningfulness of a place. Thus, the desirability and meaningfulness of a space are determined by satisfying the user’s diverse needs regarding shopping, eating, entertainment, and special needs (such as gatherings, discussions, debates, and other community activities) [5,8]. The presence of goods and business services makes the environment vital and promotes its functionality. Phenomenologists suggest that repetitive and frequent visits create a sense of place and place attachment [36]. The sense of belonging and shared-symbolic identification are the basic needs required to achieve a sense of community [45]. In addition, time–space routine visits occur due to usefulness and satisfaction provided to users; hence, public spaces with meaningful activities attain a sense of ‘collective-symbolic ownership’, ‘place–identity attachment,’ and ‘sacredness’ [46,47]. Hence, the variables of desirable activities can measure local businesses and informal gatherings in the desirable public spaces.
C3. Safety: Public spaces’ real and perceived safety depends on social and physical characteristics. Davis [48] stated that opportunities for socializing depend on the sense of safety. Securitization and surveillance are key means of controlling safety in public spaces [49,64]. Davis [48] highlighted that the presence of people provides a sense of safety. Jacobs’ (1961) concept of ‘eyes on the street’ means that the space is self-securitized. Perkins et al. [50] expressed that the power of perceptions makes places safe or unsafe.
In contrast, a lack of control, the absence of users, or a lack of attention create a perception of low safety [50]. Urban professionals also link place safety to traffic volume and the built environment’s maintenance [49,64]. Safety includes visual and physical connections with the adjacent built environment, lighting quality, the configuration of spaces, diversity of land uses, and modifications to the built environment (such as personalization of street fronts and furniture) [5,65].
C4. Comfort: The basic physiological needs are environmental comfort and protection from natural elements, which play more important roles than secondary needs such as a sense of belonging, functions, and activities in public spaces [9]. Certain physiological needs (such as comfortable micro-climatic conditions, comfortable temperature, sunlight, wind, and shade) influence the secondary needs [5,66]. Scholars highlight that numerous physical factors impact users’ feelings of comfort, mainly the perception of safety, familiarity with the setting and other users, physical qualities of the environment, conveniences, landscape elements, and so on [67,68]. Therefore, it is mandatory to address anthropometric and ergonomic aspects to design a comfortable public space for all users.
C5. Pleasurability: Imageability, high spatial quality, and sensory complexity create a pleasurable public space [51,69]. Imageability at the micro-level is measured in terms of outstanding features, articulation, variety in the architectural features of building facades, density, and variety of elements within the public space. In support of Lynch’s view, Rapoport [9] remarked that several factors coherently contribute to pleasurability, mainly the vividly identified shapes, color, and arrangement of structures. The high spatial quality of public spaces is determined by two important factors: human scale and sense of enclosure. Urban psychologists highlight that spatial quality and user interaction with physical elements lead to comfort and pleasure through convenience. Physiological and psychological pleasurability is attained through a sense of enclosure, where users distinctly experience space. Furthermore, the permeability and personalization of the space create pleasurable spaces through various environmental stimuli (such as light, sound, touches, colors, shapes, textures, etc.) [5,52,70].
Table 1 synthesizes the systematic literature review findings and tabulates them in a content analysis table. This table indicates the frequency of citations of each sub-criterion. According to Table 1, the MCSD model identifies the variables used for evaluating and assessing a multi-functional corniche street. The MCSD model constitutes five (5) criteria (C1. Inclusiveness, C2. Desirable activities, C3. Comfort, C4. Safety, and C5. Pleasurability), and forty-two (42) embedded sub-criteria. In Table 1, the sub-criterion ‘physical/visual connection or openness to adjacent spaces’ receives the largest frequency value (FSc.4.1 = 10), followed by the sub-criteria ‘users’ diverse ages’ and ‘community gathering in third places’ (FSc.1.1 and FSc.2.1. = 8). In contrast, the sub-criterion ‘elements discouraging spatial use’ earns the smallest frequency value (FSc.3.5 = 2). As mentioned earlier, the research measures the primitive weights through a confirmatory analysis (see Section 3.2).

3.2. Formulating the MCSD Model

This study applied normalization and standardization to the frequency values. The normalization and standardization generated consistency among all variables. Table 2 presents the normalization and standardization matrix produced by the respective processes. Following the normalization and standardization instructions, the maximum value (xmax. = 10) and minimum value (xmin. = 2) were extracted from Table 2. Then, the subtraction of the maximum and minimum (xmax-min. = 8), the average value (=4.7619), and standard deviation (σ = 1.5897) were calculated. Next, the integrated values for each sub-criterion were calculated by multiplying the normalized value by a standardized value. Finally, the adjusted integrated value for each sub-criterion was calculated by multiplying the integrated values by the frequency values. According to Table 2, the criteria C2, C3, and C4 equally received the highest adjusted integrated values (Xint.-adj. = 1.429). Among all sub-criteria, Sc.3.5 (elements discouraging spatial use) received the highest adjusted integrated value (Xint.-adj.Sc.3.5 = 2.614). After Sc.3.5, the sub-criteria Sc.2.4, Sc.2.6, Sc.2.7, Sc.3.4, Sc.3.7, and Sc.4.4 received the highest adjusted integrated values (Xint.-adj.Sc.3.5 = 1.603). In contrast, Sc.1.7 (diversity of activities and behaviors) received the lowest adjusted integrated value (Xint.-adj. = 0.081).
We conducted an expert input study to structuralize the construct of the MCSD model through a case study. In this regard, the group of experts indicated the rating range, assessment method, and assessment range for every single sub-criterion involved in the MCSD model. As the experts suggested, the MSPD model adjusted the integrated values of every criterion from 10 points to 30 points (see Table 3). At the same time, the points were distributed with specific weights to the embedded sub-criteria of the criterion. For example, sub-criterion Sc.1.1 (users of diverse ages) measures whether different ages of people are in the public space and measure it in the range of 0 to 3 (where 0 = limited; 1 = low; 2 = medium; and 3 = high), and the experts assigned the assessment range for this sub-criterion as 0.4 to 1.2. Thus, the possible overall score for every criterion is 10 to 30; thus, an ideal multi-functional corniche street indicates the highest quality space, with a score ranging from 50 to 150.
Furthermore, as the nature of the sub-criteria differs, the experts offered the most appropriate assessment method for each sub-criterion; for instance, the assessment method of the sub-criterion Sc.1.1 (users’ diverse ages) is observation, while the assessment method of the sub-criterion Sc.4.4 (over-securitization) is users’ subjective ratings. Accordingly, Table 3 presents the final assessment ranges of sub-criteria, which are calculated by multiplying the assessment ranges (obtained through the expert input study) by the adjusted integrated value (estimated after the normalization and Standardization process). For instance, the final assessment range for Sc.1.1 was determined as being from 0.1228 to 0.3684.
Referring to the outputs of Table 2 and Table 3, the research could develop the MSPD model’s index equation (see Equation (3)). The MSPD model is a linear index involving five criteria and forty-two sub-criteria. The criteria’s adjusted integrated value obtained from Table 2 was translated as constant criteria values in the MSPD index. Likewise, the sub-criteria’s average adjusted integrated assessment range obtained from Table 3 was translated as constant criteria values in the MSPD index.
M S P D   I n d e x = I n d e x C1.Inclusiveness + I n d e x C2.Desirable activities + I n d e x C3.Comfort + I n d e x C4.Safety + I n d e x C5. Pleasurability = C 1 ( i = 0 12 a C 1 . S c . i X C 1 . S c . i ) + C 2 ( i = 0 7 a C 2 . S c . i X C 2 . S c . i ) + C 3 ( i = 0 7 a C 3 . S C . i X C 3 . S c . i ) + C 4 ( i = 0 7 a C 4 . S c . i X C 4 . S c . i ) + C 5 ( i = 0 9 a C 5 . S c 5 . i X C 5 . S c . i )   = 0.833 ( i = 0 12 a C 1 . S c . i X C 1 . S c . i ) + 1.429   ( i = 0 7 a C 2 . S c . i X C 2 . S c . i ) + 1.429   ( i = 0 7 a C 3 . S C . i X C 3 . S c . i ) + 1.429   ( i = 0 7 a C 4 . S c . i X C 4 . S c . i ) + 1.111   ( i = 0 9 a C 5 . S c 5 . i X C 5 . S c . i )  
where:
C is the constant value of the criterion, extracted from Table 2;
a is the constant value of the sub-criterion, extracted from Table 3;
X is the weight of the sub-criterion ‘i’ assigned by the model user during a case assessment.
For instance, the extended MSPD model’s index for criterion 2 (C2. Desirable activities) is as follows;
M C S D   I n d e x C 2 .   = 1.429   ( 0.1.720 X C 2 . S c . 1 + 0.242   X C 2 . S c . 2 + 0.499   X C 2 . S c . 3 + 8.015   X C 2 . S c . 4 + 0.499   X C 2 . S c . 5 + 8.015   X C 2 . S c . 6 + 1.603   X C 2 . S c . 7 )

4. Formulating the COVID-19-Adapted MCSD Model (CA-MCSD Model)

This section elaborates on the second phase of the research (i.e., adaptability analysis). After developing the MCSD model, we sought to develop the COVID-19-adapted MCSD model (Ca-MCSD model). For developing the Ca-MCSD model, we needed to implement the MCSD model on an actual site. Although the MCSD model is a universal model applicable in any corniche street, we selected the most suitable site, Al-Wakrah corniche street in Doha, Qatar. Al Wakrah corniche street serves as the oldest urban center in Qatar. Al Wakrah corniche street has grown from a modest primitive pearling village to a remarkable city inhabited by 80,000 people (in 2010). This site possesses unique and significant characteristics suitable for the current empirical study; firstly, the wide range of activities available and the vitality are significant (particularly with Doha city’s smart growth since September 2001). Secondly, wide-profile social spaces on the site allow us to observe and evaluate safety and security as the most deliberate and prominent concerns. Thirdly, this stie is a dense pedestrian-oriented street with the greatest concentration of public traffic in Doha.
We undertook observation and expert-input study methods for developing the Ca-MCSD model. The observation method is essential for obtaining a deeper understanding of any urban public space, especially the level of social interaction within an environment. We undertook site observations to assess the Al Wakrah corniche street across all of the MCSD model’s five criteria and forty-two sub-criteria (see Figure 1). In particular, the site observations were conducted based on the following main aspects: (a) the presence or absence of street furniture; (b) areas of public concentration involved in various activities (standing, lingering, and social); (c) the variety of businesses attracting the public; and (d) the proximity to natural features or major attractions. Observations were carried out at different times on weekdays (Sunday 4:00–4:30 p.m. and Tuesday 9:00–9:30 p.m.) and weekends (Friday 4:00–4:30 p.m. and Saturday 9:00–9:30 p.m.).
In addition, we conducted an expert-input study by inviting the same group of experts who had participated in phase one. Indeed, these experts would be the real users of the model in the future. The experts assessed the Al Wakrah corniche street using MCSD model’s sub-criteria. Then, they assigned an assessment value for every corresponding sub-criterion within its range (e.g., the survey participants assigned an assessment value of 0.6 to the sub-criterion Sc.1.1). The average value of the observation and the expert-input study was calculated. We calculated the final assessment values of sub-criteria by multiplying the assessment values by the adjusted integrated values (see Table 4). The stochastic error (SE) was calculated in the process of adaptability analysis. SE indicates the predictability of the subtraction of the expected values (i.e., the outcome of objectives 1 and 2) and observed values (outcome of objective 3). According to Table 4, the SE for sub-criteria Sc.1.8, Sc.3.4, and Sc.4.3 equaled zero. Among all of the sub-criteria, Sc.1.5 received the smallest stochastic error (−0.009), followed by Sc.1.7 (0.020). In contrast, Sc.2.6 (SESc.2.6 = 9.618) and Sc.2.4 (SESc.2.4 = 6.412) earned the largest stochastic errors.
According to Table 4, we developed the Ca-MSPD model (see Equation (4)). Like the MSPD model, the Ca-MSPD model is a linear index. Therefore, the final assessment values (in Table 4) were translated as constant values of the sub-criteria in the Ca-MSPD model.
C a   - M C S D = I n d e x C1.Inclusiveness + I n d e x C2.Desirable activities + I n d e x C3.Comfort + I n d e x C4.Safety + I n d e x C5. Pleasurability = 0.833 ( i = 0 12 a C 1 . S c . i X C 1 . S c . i ) + 1.429   ( i = 0 7 a C 2 . S c . i X C 2 . S c . i ) + 1.429   ( i = 0 7 a C 3 . S C . i X C 3 . S c . i ) + 1.429   ( i = 0 7 a C 4 . S c . i X C 4 . S c . i ) + 1.111   ( i = 0 9 a C 5 . S c 5 . i X C 5 . S c . i )
where
a is the constant value of the sub-criterion, extracted from Table 4,
X is the weight of the sub-criterion ‘the model user assigns i’ during case assessment.
For instance, the extended Ca-MCSD model for criterion C2. (Desirable activities) is as follows:
C a - M C S D   I n d e x C 2 .     1.429   ( 0.344   X C 2 . S c . 1 + 0.242   X C 2 . S c . 2 + 0.499   X C 2 . S c . 3 + 1.603   X C 2 . S c . 4 + 0.499   X C 2 . S c . 5 + 1.603   X C 2 . S c . 6 + 1.603   X C 2 . S c . 7 )
Next, we conducted ANOVA regression analysis between the MCSD and Ca-MCSD models by computing the Pearson correlation coefficient (r). The regression analysis showed that the MCSD and Ca-MCSD models are linearly and positively correlated (Y = 0.811777X + 0.383401). The correlation is statistically significant, as the Pearson regression coefficient (r) is 0.903729, and the coefficient of determination (r2) is 0.816727. Additionally, the p-value of the correlation is acceptable (0.025) (i.e., p < 0.05 ) . Table 5 indicates that for the 95% confidence intervals, their correlation has an upper level of 0.934663 and a lower level of 0.688892; hence, the MCSD model and the Ca-MCSD model are strongly correlated.

5. Results

We conducted a series of GSA processes detecting the dominant controls of the Ca-MCSD model’s behaviors and output distribution while reducing its uncertainties. The selected methods are: cumulative distribution functions (CDF), probability density function (PDF), and parallel coordination. Each method can estimate a specific aspect of output distribution and probability of variances while collectively validating each other. The XLMiner Data Visualization toolbox and Microsoft Excel software helped us to conduct these sensitivity analyses robustly. The following presents the results of the GSA techniques.

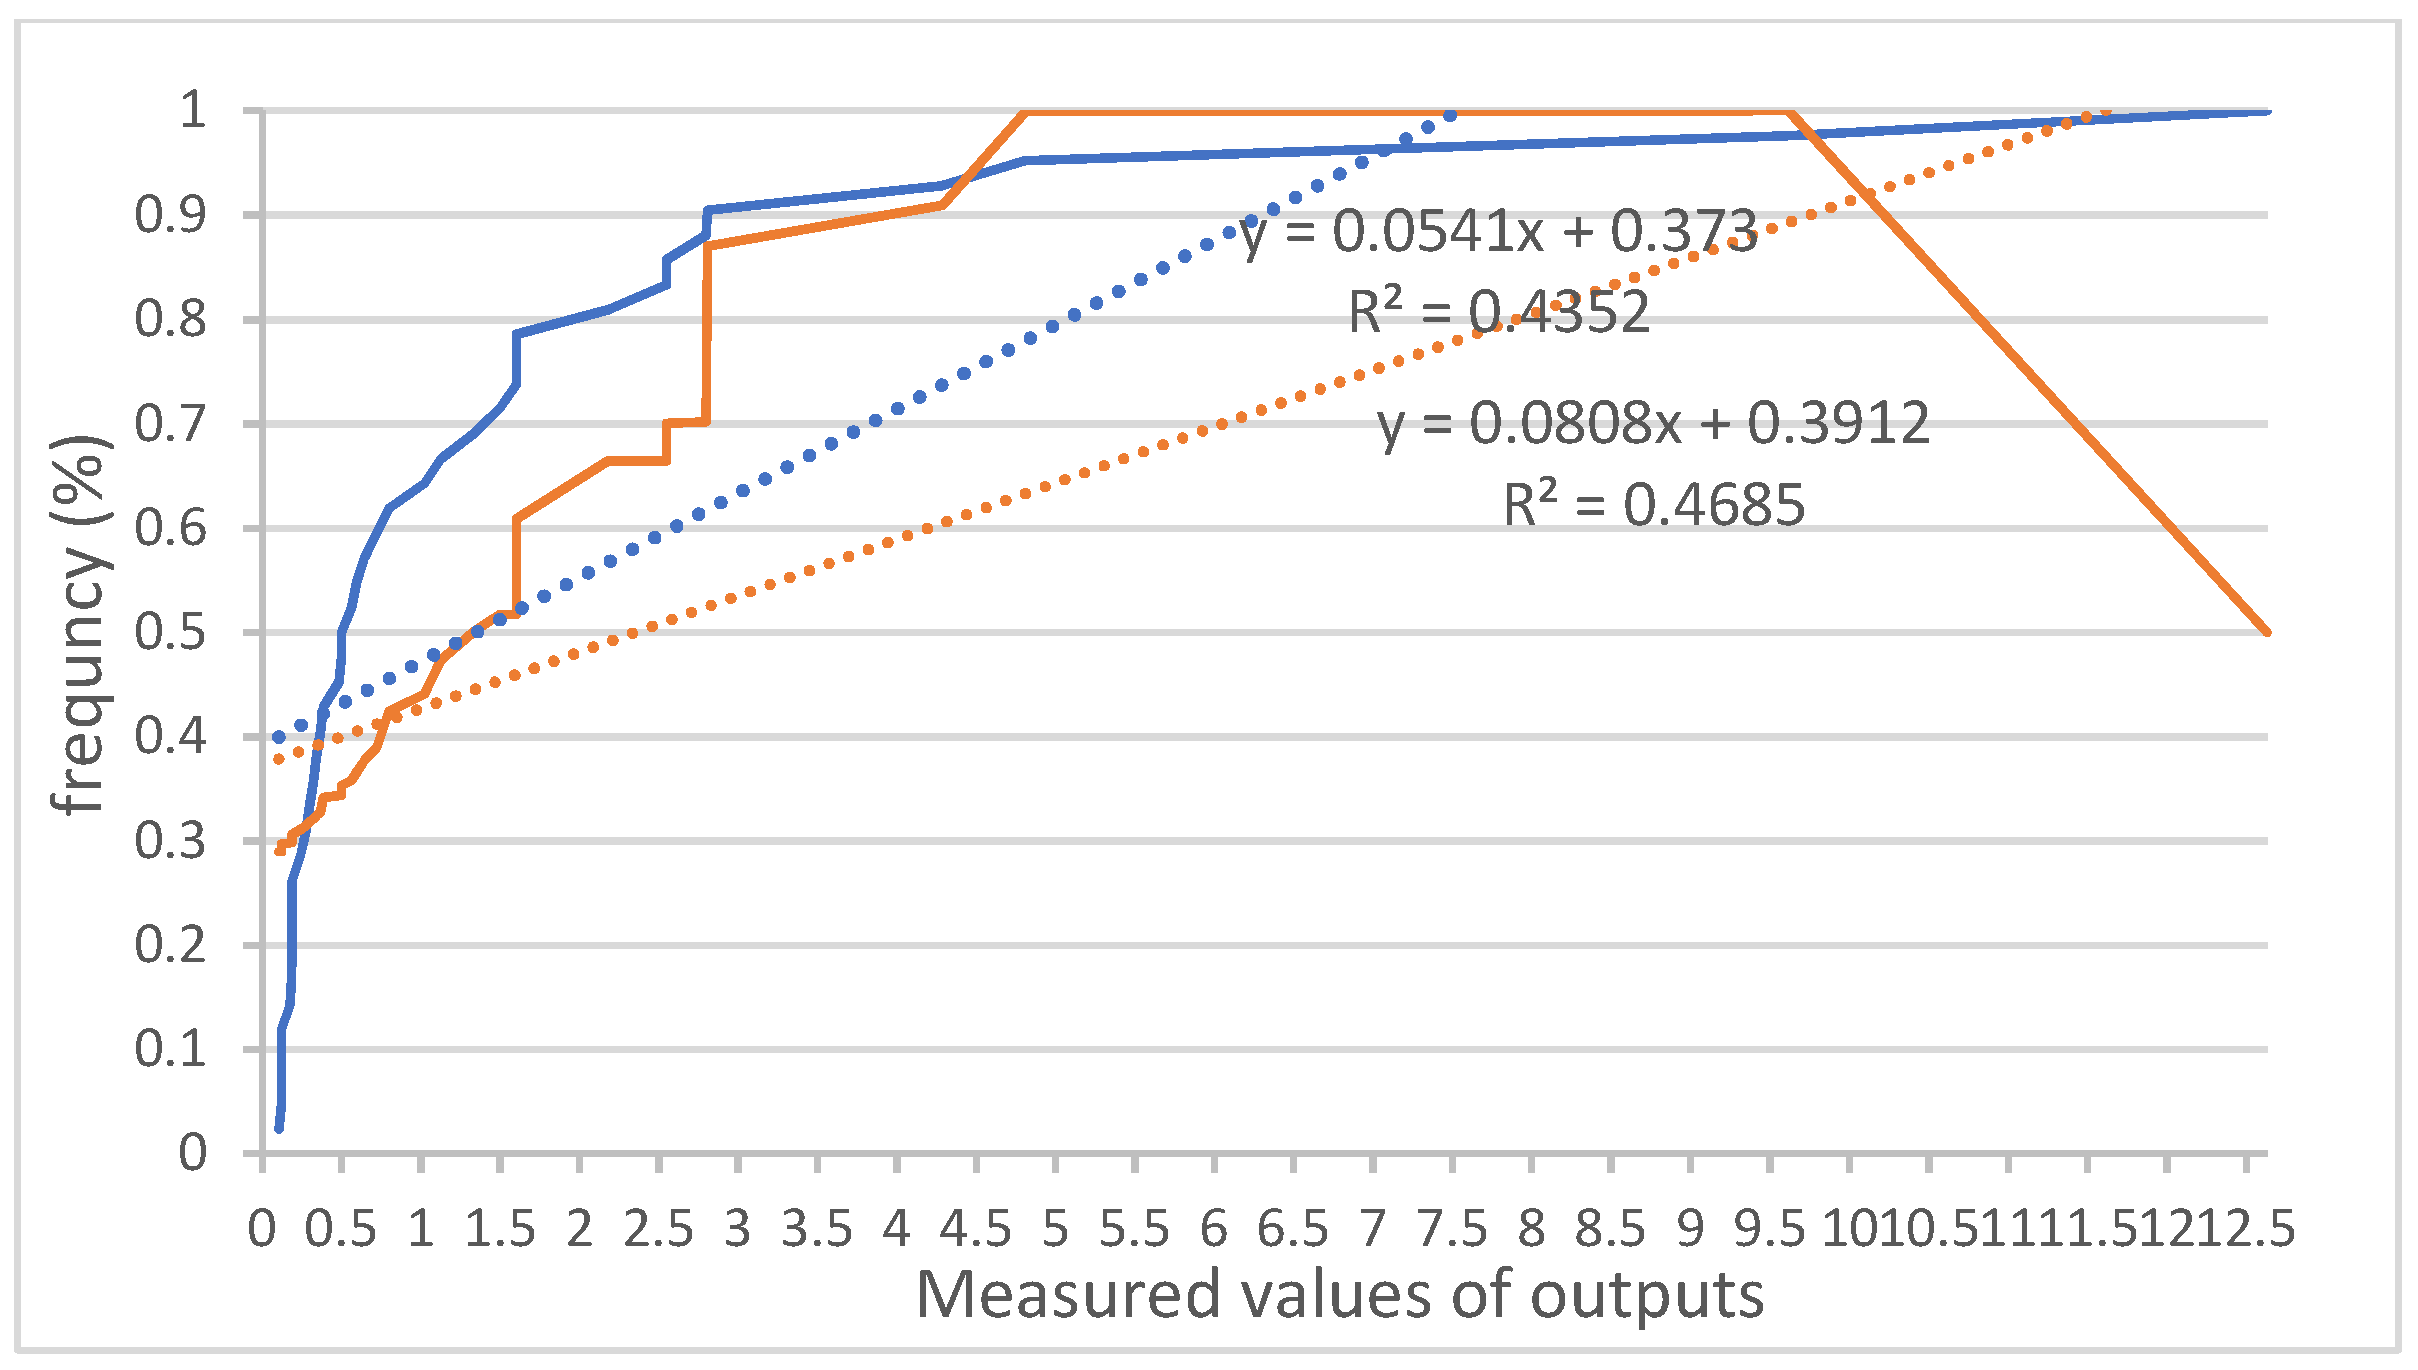
5.1. Cumulative Distribution Functions (CDF)

GSA used the Monte Carlo simulation of input-output post-processing and cumulative distribution functions (CDF) of the Ca-MCSD model. The CDF sensitivity analysis detects the specific regions in specific output values [71]. The Kolmogorov–Smirnov statistic can measure the variability ranges of the output behaviors. This study conducted CDF to compute the standard deviation of the probability distribution and variance probabilities of the Ca-MCSD model by applying this equation F x = P r X x = α , where F is the CFD function, and the sub-criterion value is equal to or less than x, and also applied the equation F x = i = 0 x f i , where F is determined based on f (i.e., probability density function), the Ca-MCSD model’s CDF has been compared with the normal distribution curve to explore the derivatives and deviations of its outputs. According to Figure 2, the Ca-MCSD model has an exponential cumulative distribution; however, the geometric distribution has an inconstant average rate, especially after a mean (μ= 1.494). The CDF curve has 2.475 standard deviations (σ), which indicates that 70% of the output data lie and are distributed around the mean (μ = 1.494) between −1.045 and +1.045, which equals 0.449 < w < 2.539, and 95% of outputs sit −1.419 and +1.419 around the mean, which equals 0.075 < w < 2.913. CFD and the normal curve intersect at point 4.287, where z (i.e., deviation of data in standard deviation) equals 1.1281. Comparing the goodness-of-fit lines of CDF and the normal distribution curve determines 149% correlation (yCDF = 0.0808x + 0.3912, yn = 0.0541x + 0.373, respectively), since the regression variances of the curves are close to each other (RCDF² = 0.4352, Rn² = 0.4685, respectively). This indicates that the empirical distribution considerably differs from the theoretical distribution.
In addition, the Kolmogorov–Smirnov test was computed to compare the probability distribution of outputs in CDF and normal null distribution, using the equation D x = s u p x F n x F x , where supx is Supremum (i.e., maximum absolute subtraction of empirical and ideal distribution values) when Dn converges to 0 in the limit of n . The KS test was applied to the forty-two conditional samplings (n) and then standardized the outputs based on the Supremum value. The KS test indicated that Supremum is 4.499 with 29.158 probability.

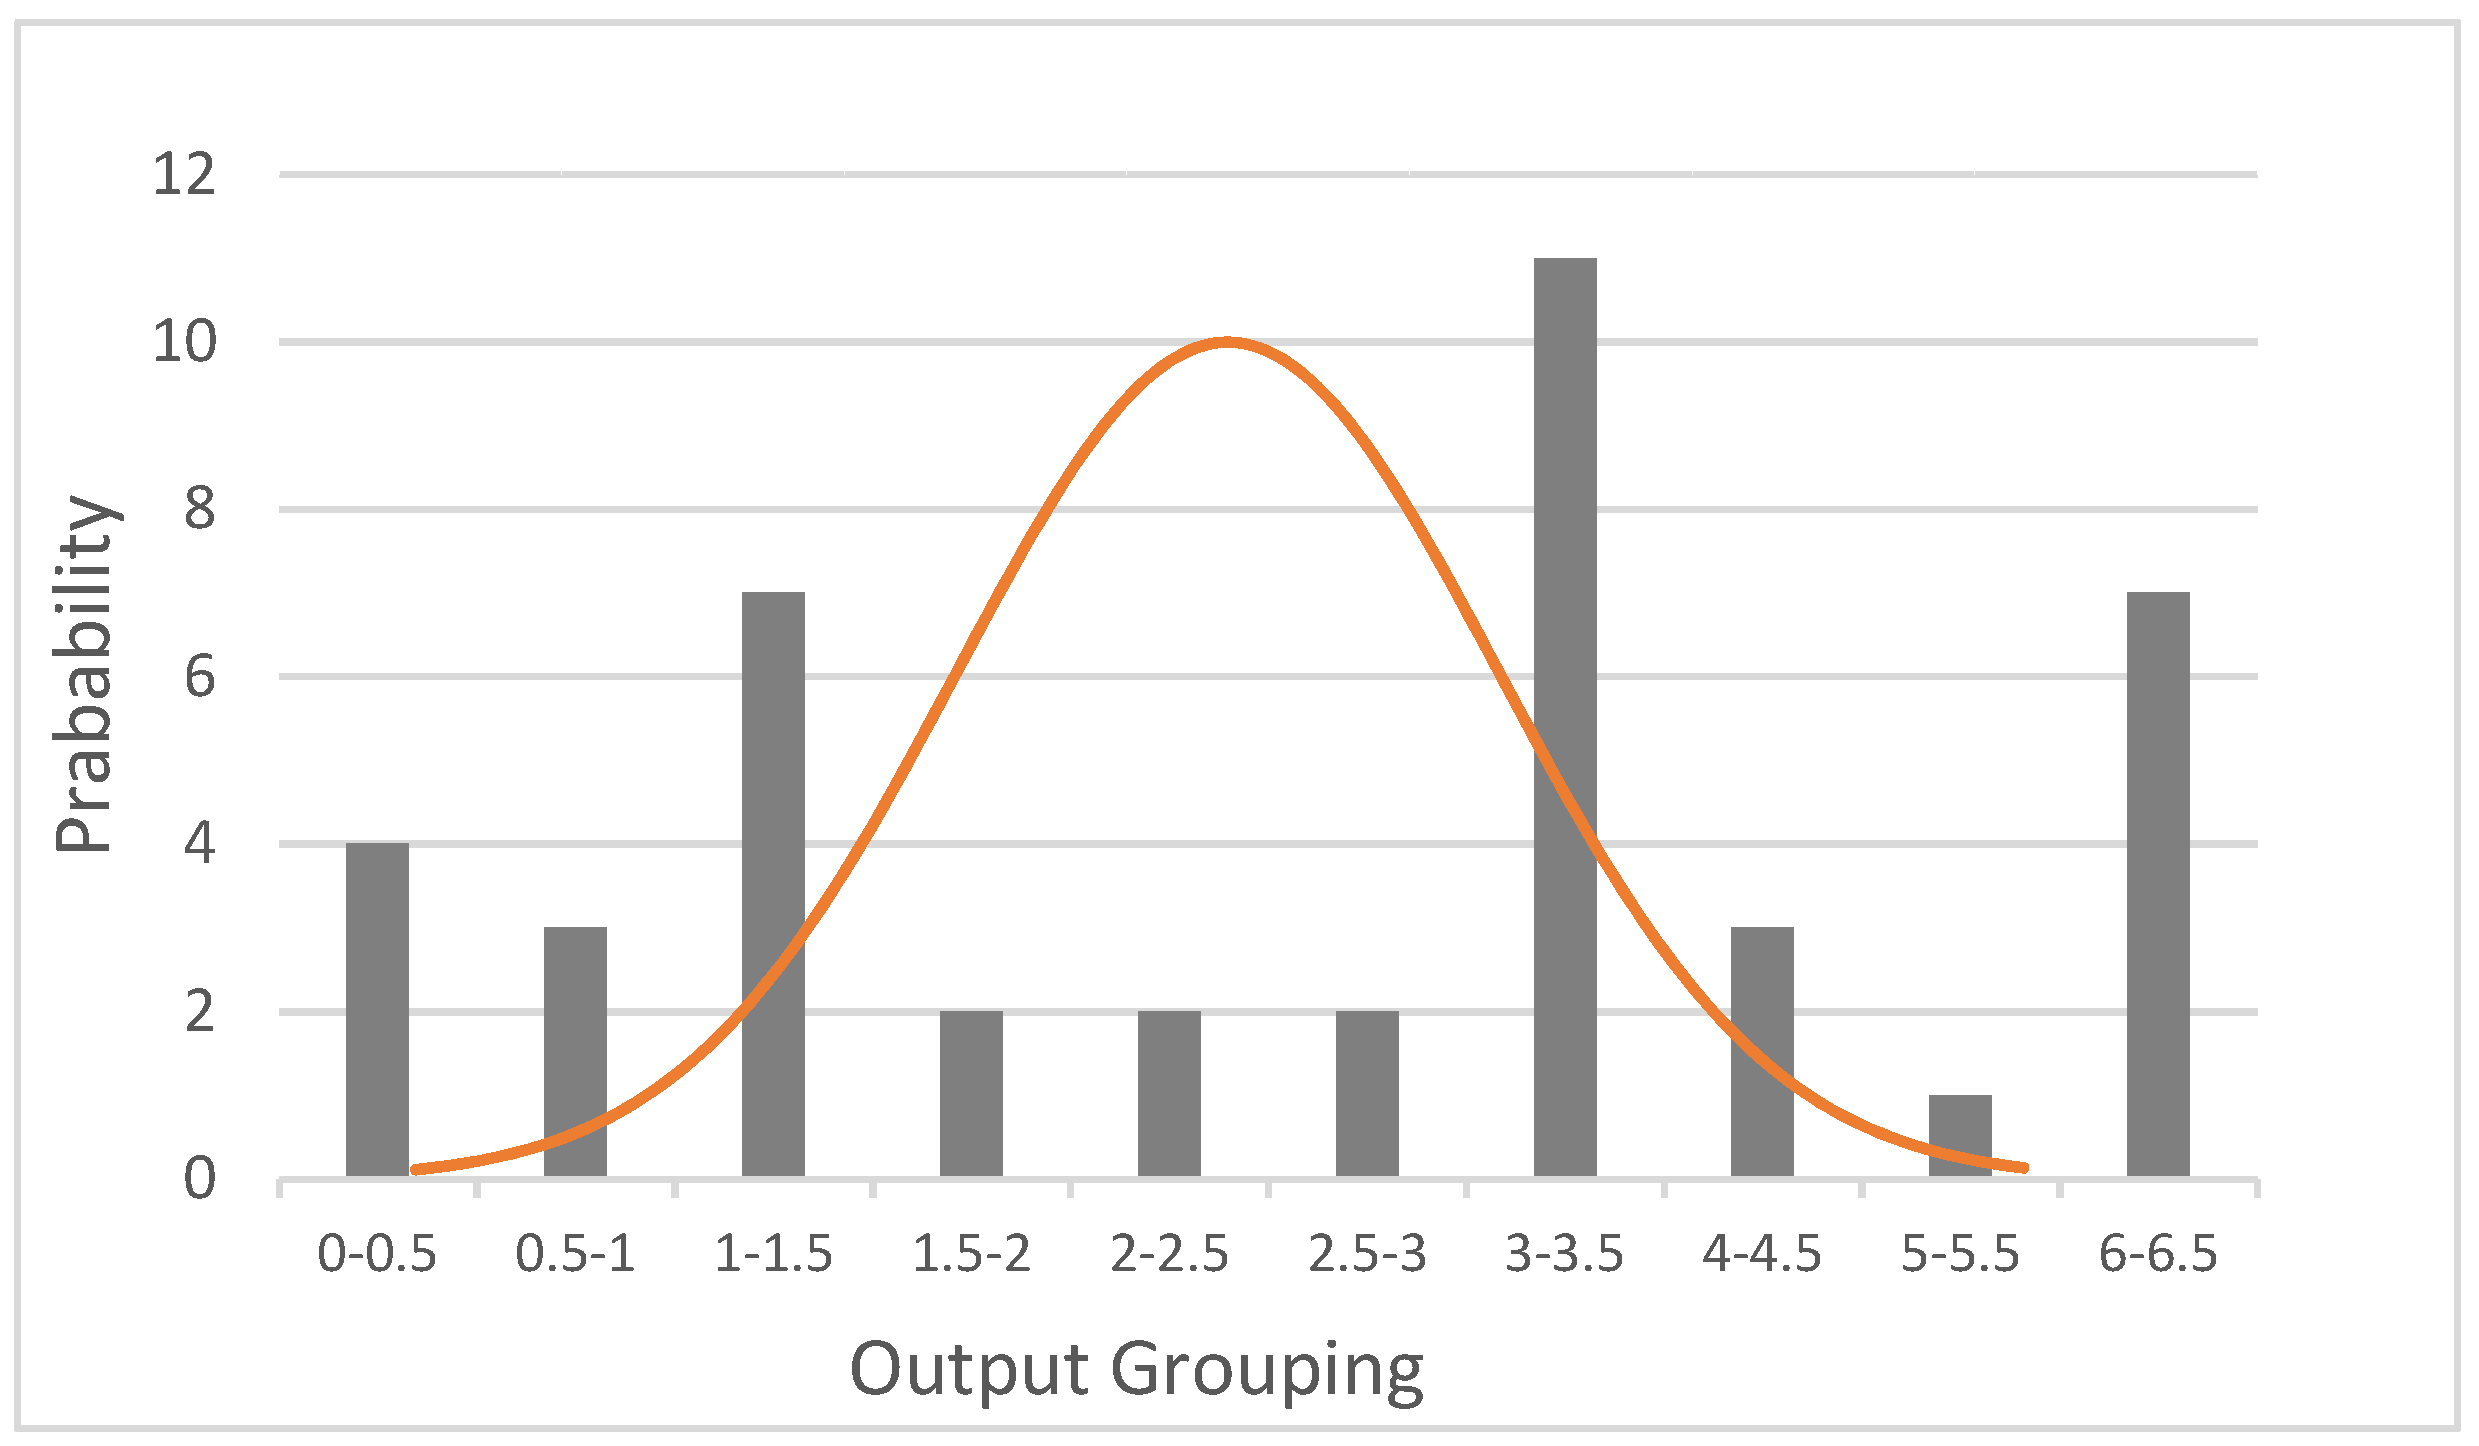
5.2. Probability Density Function (PDF)

We computed the probability density function (PDF), a density-based method that measures the variances of outputs [72]. This study computed the unconditional PDF where the variation and divergence of all factors impact the induced PDF. PDF is a unique method applied to the Ca-MCSD model since it has a lognormal distribution. The PDF measured the probability of the continuous distribution of the Ca-MCSD model’s outputs using the equation f x = P r X = x , where X is the variate (i.e., sub-criterion) with value x, and also applied the equation f x = 1 x ω 2 π   e x p I n x θ 2 2 ω 2 , where 0 < x < , ω 2 is the variance and θ is the mean. PDF interpreted the MCSD model’s outputs in a histogram and clustered them into ten bins with a range of 0.5. According to Figure 3, PDF has a standard normal distribution curve, which is calculated through y = 1 σ 2 π e 1 / 2 Z 2 . The normal distribution curve has a mean of 1.494 (μ), a standard deviation of 2.475 (σ), a variance of the distribution of 1.909 (σ2), a mode of 0.123 x ^ and a median of 0.5315 x ˜ . Figure 3 shows that the Ca-MCSD model has a lognormal distribution with confidence intervals of 0.771 (95% confidence level), kurtosis of 11.797, and skewness of 3.273. As can be seen, the middle of the distribution curve is less congested, and data are mostly distributed outside of the intervals and far from the mean.

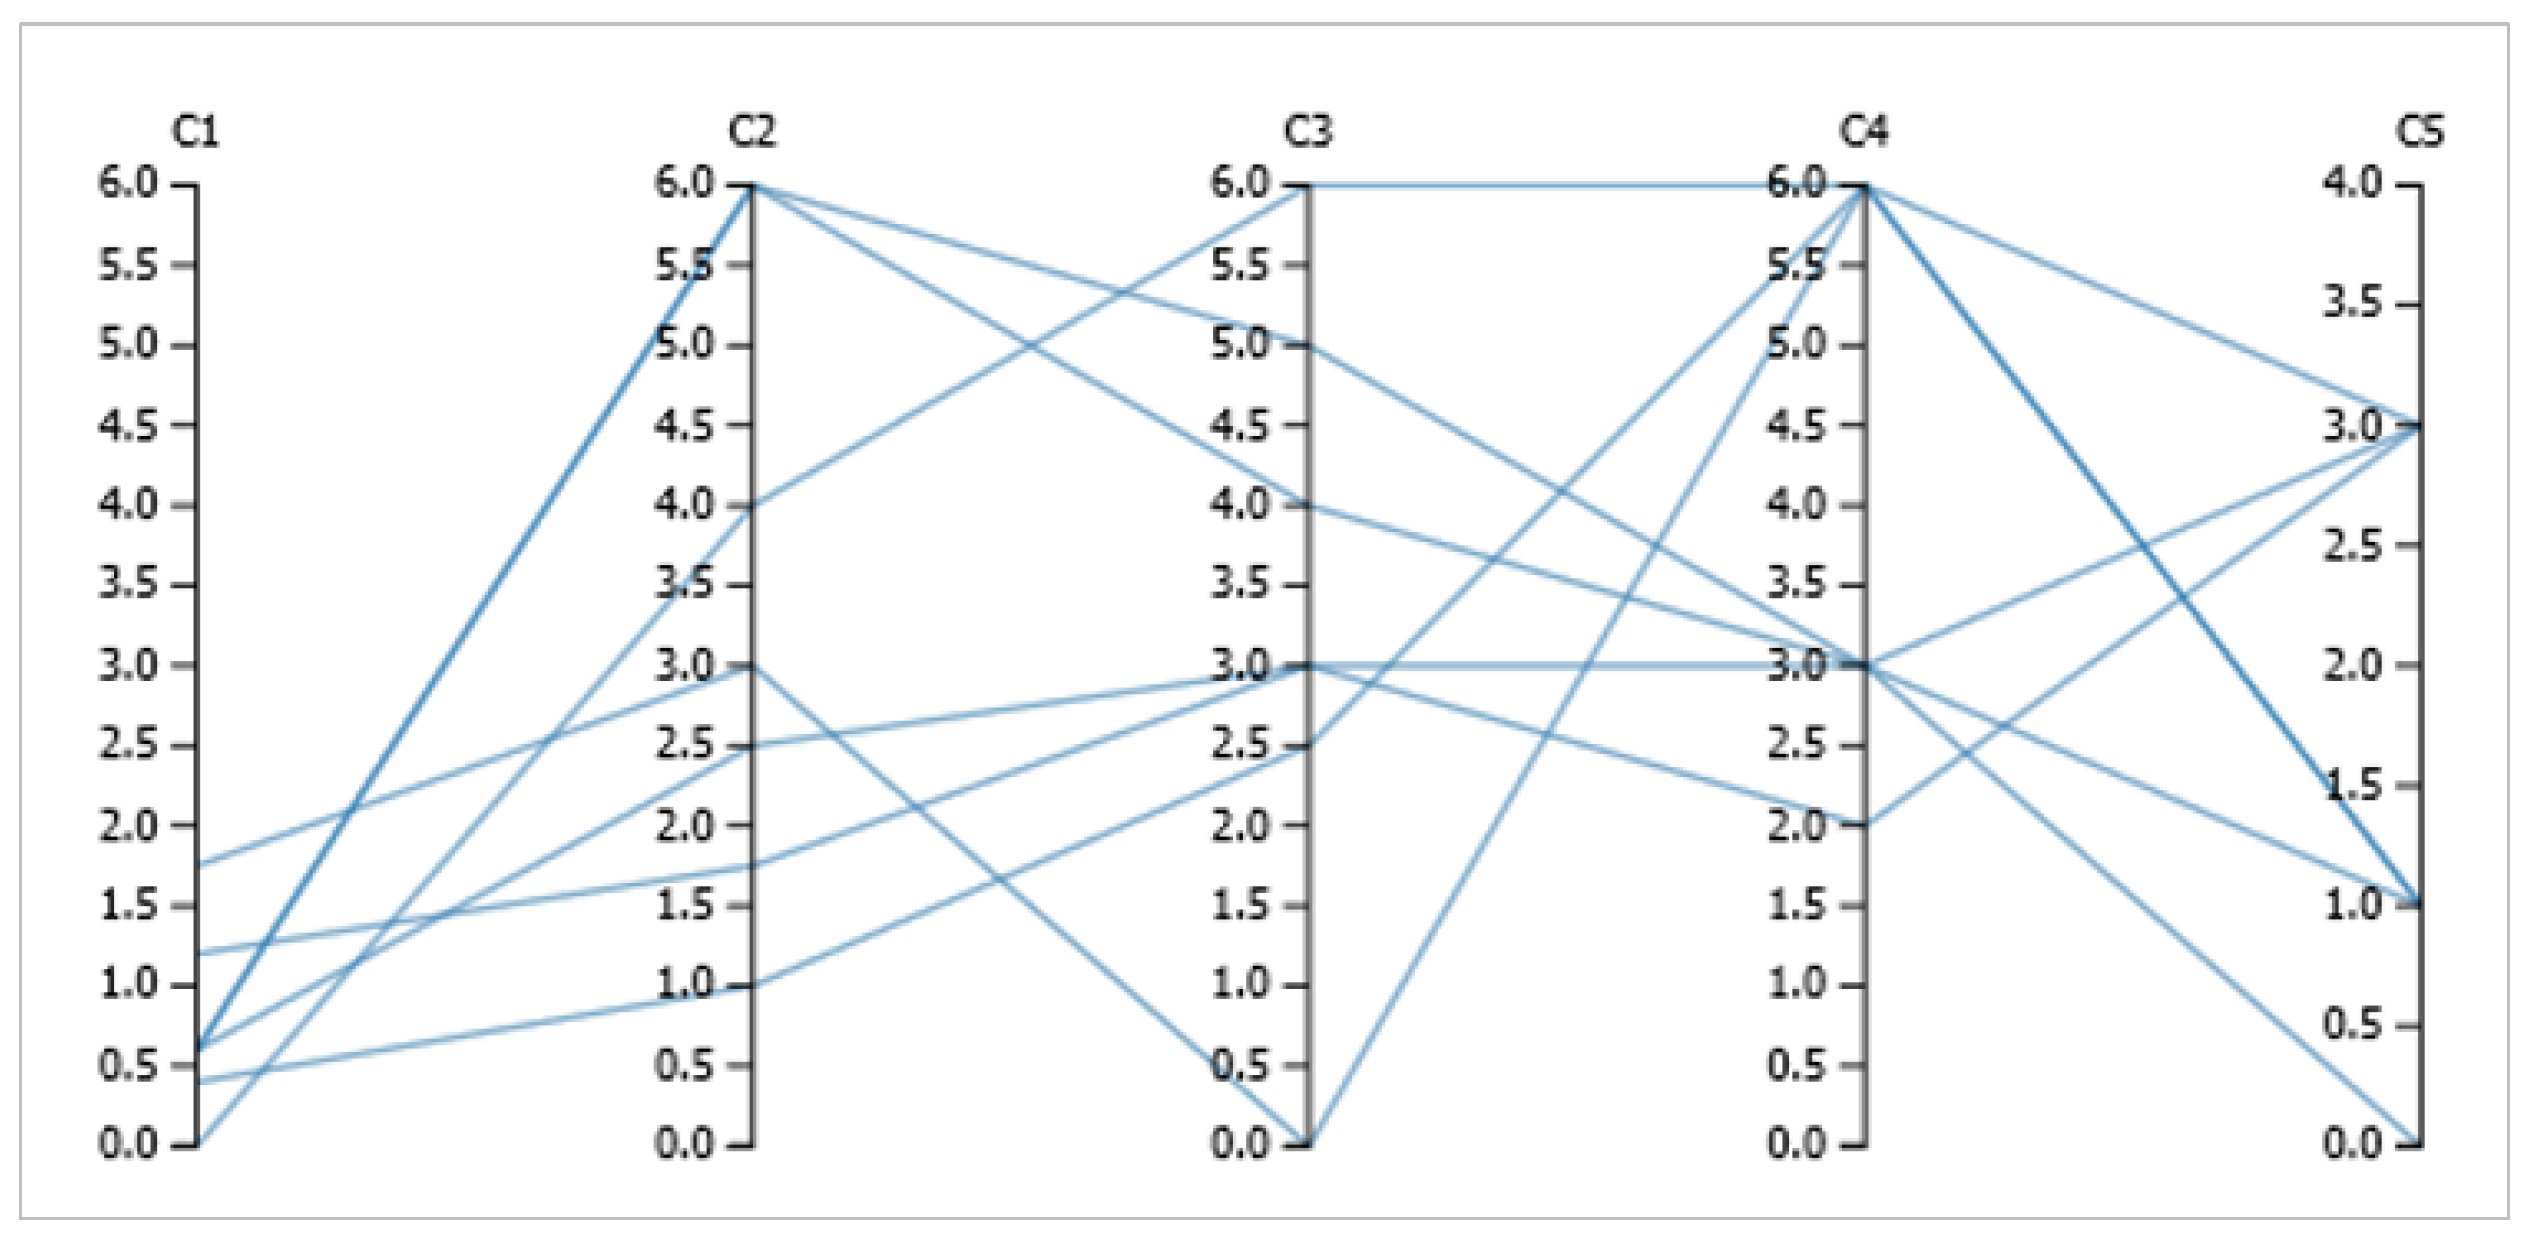
5.3. Parallel Coordination

The parallel coordination was computed to validate the results of the PDF. Parallel coordination is a sensitivity analysis method for multi-dimensional datasets, interpreting outputs to various data points in an n-dimensional space [73]. It arranges the data in n-parallel profiles (i.e., axis), following the data’s instructive order [74]. The interpolation of consecutive pairs of criteria creates polylines in the whole space, where the vertex’s position on the ith profile corresponds to the jth coordinate of the point. This method can estimate the quantization level for data points through dynamic normalization. The parallel coordination method reorders the entries in each axis from the minimum to the maximum. According to Figure 4, each profile represents one criterion of the Ca-MCSD model. The parallel coordination plot was blushed based on C1, so the one-third subset data (range: 0.0–1.75) are highlighted in the C1 axis. Based on the highlighted subset, the blushed polylines are distributed in the other axis with various behaviors; for example, the blushed selection of C1 discretely covers the whole C3 axis and almost the entire upper half of the C4 axis. Furthermore, Figure 4 shows that the C1 axis has the largest data spread density, covering nine data points in the small range of 0.0 < W < 1.75. Next, the C4 axis has a large dense data spread covering seven data points in the range of 2.0 < W < 6.0. Finally, according to Figure 4, the C3 axis has the widest data arrangement (range: 0.0 < W < 6.0), because its data points were widespread; in contrast, the C1 axis has the most condensed data arrangement (range: 0.0 < W < 1.75).

6. Discussion

A unique design for a corniche street cannot meet all dimensions and aspects. Scholars have expressed that the design is subjective to local urban settings, built environment characteristics, usage purposes, user needs, local conditions, etc. As the urban context is different in the U.S., Canada, Europe, Australia, or Asia, scholars have developed diverse public space assessment tools. Therefore, urban professionals must adopt public space assessment tools with a holistic approach to urban policies, urban planning standards, and urban context. In this regard, this study develops the Ca-MCSD model. This newly built environment rating system aids urban professionals in evaluating and quantifying the capacity of corniche streets in mitigating and controlling the COVID-19 virus. The current research expressed that structuring the variables and weight measurement are the key concerns of the corniche street assessment because built environment variables tease different importance at the macro, meso, and micro levels (with the macro level being the urban scale and the micro-level being the street scale). Additionally, diverse user groups (e.g., adults, children, disabled people, etc.) have different needs; hence, the corniche street assessment variables should be adjusted and adapted across different users.
The Ca-MCSD model is a decision support tool that assigns assessment labels (i.e., Gold, Silver, Bronze, and Not-certified) to the evaluated case. The gold label indicates the highest index score the corniche street can earn, while the bronze label is the lowest index score. The not-certified label is assigned for an index score less than the threshold for bronze. For calculating the gold label, we assumed that all variables (i.e., criteria and sub-criteria) had been assigned the maximum possible weight of that variable. (which equaled 1222). Additionally, for calculating the bronze label, we assumed that all variables (i.e., criteria and sub-criteria) had been assigned the minimum possible weight (which equaled 227). So, the model users can input their study site’s data into the Ca-MCSD index to calculate the score and then indicate the label for that study site based on the score earned.
Sustainability 14 10940 i001Sustainability 14 10940 i002744.01 < s ≤ 995:Gold Label: Well-designed COVID-19-adapted corniche street that treats the users effectively.
494.01 < s ≤ 744:Silver Label: Well-designed COVID-19-adapted corniche street treats users effectively, but minor improvements are needed.
248.01 < s ≤ 494:Bronze Label: An acceptable COVID-19-adapted corniche street treats users effectively, but major improvements are needed.
s < 248: Not-Certified: The COVID-19-adapted corniche street does not treat the users effectively.
This study conducted an exploratory study on assessment variables evaluating a multi-functional corniche street (see Figure 5). This research found that modern societies have shifted from controversial corniche streets to modern corniche streets (such as context-sensitive streets) that were replaced or retrofitted to meet current needs (for instance, Wi-Fi spots for users). Accordingly, the MCSD model offers a profusion of public commons through sustainable use and equitable access to space. MCSD model promotes the city’s interest in public spaces with various urban commons (restaurants, shops, transport, green areas, etc.) while providing safety, security, comfort, inclusiveness, desirable activities, and pleasurability. Furthermore, the MCSD model aids in increasing streets’ accessibility and connectivity while reducing street accidents, street congestion, and travel time by providing different transportation modes, especially non-motorized modes (i.e., walking and cycling). In addition, the MCSD model highlights the necessity of home zones or the shared-space concept of redesigning streets for the shared use of all travel modes; therefore, it can help to reconcile the needs of conflicting modes of travel. Therefore, the MSPD model helps to enhance the street’s physical integrity and surrounding neighborhood and district, reinforce civic pride and local identity and connect safe and secure routes for a wide range of users (adults, children, etc.).
We applied a series of techniques (i.e., content analysis, normalization, and standardization) to measure every sub-criterion’s weight in the Ca-MSPD model. In social sciences, the idea of standardization was defined as the best technical application of consensual wisdom and the process of unification and making an appropriate decision [75]. Accordingly, we found that in the normal situation before the COVID-19 pandemic, desirable activities, comfort, and safety are the most important in designing multi-functional corniche streets. Accordingly, the quality, quantity, and size of public spaces were key drivers of shared prosperity. Social life in public spaces was affected by the physical infrastructure influencing the functionality of public spaces enabling the city’s endowment and quality. The public spaces could not integrate the multi-functionality and connectivity of streets to create social inclusion, social equality, and life productivity. Hence, the social life of publicly accessible spaces was influenced by socio-cultural values and interactions between the public space and users. Thus, the public spaces representing a multi-dimensional and complex phenomenon provide opportunities for social interaction between the space, activities, and users. However, during the lockdown due to the pandemic, the public spaces acted as controlled environments, where users and their needs were filtered, segregated, and separated, disrupting public life.
The research found that, during the lockdown caused by the COVID-19 pandemic, desirable activities, comfort, and safety (aivW = 1.429) were significantly considered for controlling and mitigating the health risks of COVID-19. Hence, the designers needed to rethink the design of corniche streets by emphasizing inclusiveness during the pandemic. Accordingly, the Centers for Disease Control and Prevention (CDC) and Worldwide Health Organization (WHO) instructed special health protocols to limit social interactions and enforce social distancing in public spaces. Indeed, in a normal situation (i.e., before the COVID-19 pandemic), street designers needed to focus on the elements discouraging spatial use, mainly the availability of foods, the suitability of space layout and design, and businesses’ usefulness, microclimate comfort, noise pollution, and securitization. In particular, our research found that, before the pandemic, microclimate comfort (avWSc.3.4 = 7.880), community gathering places (Sc.2.1), the availability of foods (Sc.2.4), appropriate maintenance and physical condition (Sc.3.6), and attractiveness of space (Sc.5.8) (avW = 6.000) played critical roles in designing a multi-functional corniche street. However, the research found that, after the COVID-19 pandemic, the key drivers changed to microclimate comfort (favWSc.3.4 = 12.632), appropriate maintenance and physical condition (favWSc.3.6 = 9.618), physical/visual connection, openness to adjacent spaces (favWSc.4.1 = 4.809), and over-securitization (favWSc.4.1 = 4.287). It is understood that the sub-criteria microclimate comfort (Sc.3.4) and appropriate maintenance and physical condition (Sc.3.6) played major roles before and after the COVID-19 pandemic. In fact, since the start the COVID-19 pandemic, the Global Heat Health Information Network and the WMO Joint Office for Climate and Health have expressed that COVID-19 intensifies the health risks of heat stress and hot weather (especially extreme heat) (Morabito et al., 2020). Additionally, a group of experts in different disciplines (medicine, climatology, clothing science, meteorology, physiology, and public health) with a focus on the occupational sector in the European H2020 project (HEAT-SHIELD, https://www.heat-shield.eu/ (accessed on 15 July 2022)) developed a customized occupational heat-related warning system to control thermal stress (by using anti-COVID-19 facemasks and gloves). To this end, the authorities have imposed new Heat-Health Action Plans (HHAPs), adapting to the local COVID-19 situation and local heatwave risks. Additionally, governments have imposed COVID-19-related health policies and social restrictions (such as increasing isolation), upgrading air conditioning and ventilation systems, using fans in collective and social spaces to prevent COVID-19 transmission and spread, and simultaneously controlling discomfort levels [76,77,78].
A well-adapted corniche street to COVID-19 persuades urban designers to implement functionalities compatible with CDC protocols, WHO protocols, or restrictions imposed by the local governments. Banerjee [15] stated that public space privatization enhances sociability through user interaction. However, we found that privatization was not significant during the COVID-19 pandemic, due to the enforcement of social distancing (a minimum of 2 meters). Hence, the functionalities and characteristics of public spaces should be significantly adjusted and adapted. How can we keep multi-functional public spaces vital, active, and responsive, as seen before the pandemic? This study conducted an adaptability analysis to modify the MCSD model into the Ca-MCSD model. The adaptability analysis determined that the Ca-MCSD model can encourage people to live vibrant, vital, and busy lives; it can inevitably reduce insecurity, fears, crimes, and violence while controlling COVID-19’s health risks. The Ca-MCSD model can promote physical changes, better management, and people’s interest in and attraction to public spaces. In the long term, these improvements will aid in revitalizing the growth of the property and tourism industry, urban regeneration, and the local economy. The Ca-MCSD model is a linear regression model; adaptability analysis can validate it based on the unpredictability and randomness of the regression model. The ANOVA regression statistics determined that the experimental error (residuals) is consistent with stochastic error, proving that the Ca-MSPD model is correct on average for all fitted values. Therefore, the Ca-MCSD model is valid.

7. Conclusions

The contextualization of public spaces necessitates the evaluation of their quality. Responsiveness, democracy, and sociability create functionality in public spaces. Accordingly, this study concludes that a relationship exists between the corniche street’s user behavior and the physical environment, while both places and people provide social activity opportunities. The characteristics and functionality of corniche streets significantly affect social life by creating informal places for social interactions. Opportunities for social interaction promote and facilitate social life. In turn, social life plays a crucial role in enhancing the quality of corniche streets. Thus, a desirable corniche street is easily accessible and open and supports and generates diverse and meaningful activities that ensure convenience, physical environmental comfort, and pleasurability. However, by observing the COVID-19 pandemic, users’ conventional and typical needs have been retrofitted, replaced, and adjusted into a new format. Hence, urban professionals are persuaded to move away from the prime function of sustaining and facilitating social life.
This research addressed these oversights by formulating and developing the conceptually grounded MCSD model. The MCSD model aids urban professionals in empirically quantifying the performance of corniche streets in meeting users’ needs and preferences by enhancing public spaces’ physical, structural, and phycological functions. The MCSD model was developed based on Oldenburg’s third places concept, which fosters social interactions and contact, and facilitates social proximity and access to all types of users. The model constitutes a set of variables clustered into five criteria and forty-two sub-criteria. These variables managed to measure: (i) usage intensity, which extended to the number of users engaged in the space and sustained individual activities (e.g., exercise, reading books, walking, etc.); (ii) social usage intensity, which extends to the number of users grouped into two to more groups within the space and sustains social activities (i.e., playing, talking, walking, etc.); (iii) duration of stay, which extends to the time users spent in the space for activities; (iv) temporal diversity of usage, which extends to the total time–space being used during a day; (v) variety of usage, which extends to different types of activities in the space; and (vi) diversity of users, which extends to different groups of users in the space (e.g., clustered based on gender, age, disabled/non-disabled). Hence, urban professionals may use the MCSD model to offer actions and policies for a sustainable, responsive, and inclusive multi-functionality of corniche streets. To continue, this study developed the Ca-MCSD model, the altered version of the MCSD model compatible with the COVID-19 pandemic.
We conducted GSA to estimate the sensitivity and uncertainty of the outputs (i.e., sub-criteria weights) of the Ca-MCSD model. GSA provides a bottom-up and vulnerability-based approach to decision-making problems; hence, it was able to forecast the robust decision-making of the Ca-MCSD model. In addition, we computed the cumulative distribution functions, probability density functions, and parallel coordination. These techniques concluded that the Ca-MCSD model is a moment-independent and space-based model. Indeed, urban professionals may apply the Ca-MCSD model to assess and quantify the corniche street’s performance and responsivity in controlling and mitigating the health risks of COVID-19. Both urban professionals and practitioners are the end-users of the Ca-MCSD model. Urban policy-makers, urban designers and planners, public health consultants, authorities, and academics may use it to evaluate existing or future public spaces.
This study has a series of limitations and opportunities. The first limitation refers to the development process of almost all built environment rating systems. The literature review results were one of the challenges for the expert panels. Although the study has indicated forty-two sub-criteria, this list can be expanded in the future. Considering other variables may affect the quality assessment and achieving a more trustable design for a COVID-19-risk-free multi-functional corniche street. In this regard, for example, the sub-criteria associated with the user’s social behavior, the user’s psychological behaviors, the user’s physical activity, and the user’s satisfaction can be studied. Including the newly added sub-criteria in the Ca-MCSD index model will involve a new exploratory analysis, confirmatory analysis, and formulation studies. However, this can be conducted upon receiving funds from our institute or other organizations. The second limitation refers to a few sub-criteria that could not be involved in the final list of forty-two sub-criteria (such as the sense of belonging, sense of attachment, stress, and fear). We found that these variables can reliably be measured qualitatively, while other phycological and behavior analysis methodologies were needed to measure them quantitively. Hence, a team of behavior and psychology experts needs to be invited to the current team in the future. The next limitation refers to the number of case studies that have been studied in this study. This study has investigated one case study due to the limited budget and lockdown restrictions during the COVID-19 pandemic. However, implementing the Ca-MCSD model in several courses (while considering inherent differences in climatic conditions, cultural background, urban setting, urban design policies, public health policies, etc.) would minimize the errors and bias of this tool and, in turn, will increase its validity and legitimacy. Lastly, this study conducted subjective-based research asking about respondents’ perceptions and preferences, while objective-based research has room to be conducted in the future. Accordingly, an objective-based research methodology (e.g., using the geographic information system (GIS)) should be designed.
In the future, other decision-making methods (such as AHP (Analytic hierarchy process), ANP (Analytic network process), etc.) can be applied for variable weight estimation to reduce the uncertainty and errors of the analysis. Additionally, the Ca-MCSD model can be coupled with spatial analysis methods (such as GIS—Geographic Information System) to enhance the functional performance of corniche streets through cost-effective plans. Furthermore, a stand-alone or web-based software package based on the Ca-MCSD model can be formulated and programmed in the future to provide professionals and individual residents with access to use it.

Author Contributions

All authors contributed to research conceptualization, and research design. Material preparation, data collection and analysis, data visualization were performed by A.K., S.F. and A.S. The first draft of the manuscript was written by A.S. and all authors commented on final versions of the manuscript. All authors have been involved in the writing, review and editing. All authors have read and agreed to the published version of the manuscript.

Funding

This research received no external funding.

Institutional Review Board Statement

Not applicable.

Informed Consent Statement

Not applicable.

Data Availability Statement

Not applicable.

Conflicts of Interest

The authors declare no conflict of Interests.

References

  1. Gehl, J.; Gemzoe, L. New City Spaces; Danish Architectural Press: Copenhagen, Denmark, 2001. [Google Scholar]
  2. Stevenson, D. The City; Polity: Cambridge, UK, 2013. [Google Scholar]
  3. Valibeigi, M.; Ghorbani, F.; Jahanmehmani, R. Perceived Environmental Response Mechanism in Tehran Public Spaces. Soc. Indic. Res. 2019, 143, 839–858. [Google Scholar] [CrossRef]
  4. Budruk, M.; Phillips, R. (Eds.) Quality-of-Life Community Indicators for Parks, Recreation and Tourism Management; Springer Science+Business Media: Berlin/Heidelberg, Germany, 2010; Volume 43. [Google Scholar]
  5. Mehta, V. Evaluating Public Space. J. Urban Des. 2014, 19, 53–88. [Google Scholar] [CrossRef]
  6. Lamit, H.B.; Shafaghat, A.; Abd Majid, M.Z.; Keyvanfar, A.; Hamdan, M.; Ahmad, B.; Malik, T.A.; Zin, R.B.; Yadollahi, M. Application of the Path Walkability Index (Pawdex) model: A case study of retail walking pattern recognition in Taman University Skudai, Johor, Malaysia. Adv. Sci. Lett. 2013, 19, 3021–3024. [Google Scholar] [CrossRef]
  7. Keyvanfar, A.; Ferwati, M.S.; Shafaghat, A.; Lamit, H. A path walkability assessment index model for evaluating and facilitating retail walking using decision-tree-making (DTM) method. Sustainability 2018, 10, 1035. [Google Scholar] [CrossRef]
  8. Oldenburg, R. The Great Good Place: Cafes, Coffee Shops, Community Centers, Beauty Parlors, General Stores, Bars, Hangouts and How They Get You through the Day; Paragon House: New York, NY, USA, 1989. [Google Scholar]
  9. Rapoport, A. Culture and Built Form: A Reconsideration; Ashgate Publishing Company: Farnham, UK, 2000. [Google Scholar]
  10. Lopes, M.N.; Camanho, A.S. Public green space use and consequences on urban vitality: An assessment of European cities. Soc. Indic. Res. 2013, 113, 751–767. [Google Scholar] [CrossRef]
  11. Furlan, R. Liveability and Social Capital in West Bay, the New Business Precinct of Doha. Arts Soc. Sci. J. 2015, 6, 116. [Google Scholar] [CrossRef]
  12. Furlan, R.; Faggion, L. The Development of Vital Precincts in Doha: Urban Regeneration and Socio-Cultural Factors. Am. J. Environ. Eng. 2015, 5, 120–129. [Google Scholar]
  13. Keyvanfar, A.; Shafaghat, A.; Rosli, N.A.L. A Decision Support Toolkit for the Design of Children-Oriented Urban Outdoor Learning Environments. J. Urban Plan. Dev. 2022, 148, 04022034. [Google Scholar] [CrossRef]
  14. Rybczynski, W. The New Downtowns; Atlantic Monthly: Washington, DC, USA, 1993; Volume 271, pp. 98–106. [Google Scholar]
  15. Banerjee, T. The Future of Public Space: Beyond Invented Streets and Reinvented Places. J. Am. Plan. Assoc. 2001, 67, 9–24. [Google Scholar] [CrossRef]
  16. Talen, E. Measuring the public realm: A preliminary assessment of the link between public space and sense of community. J. Archit. Plan. Res. 2000, 17, 344–360. [Google Scholar]
  17. Ghasemi, M.M.; Lamit, H.; Shafaghat, A. The association between riverscape and place attachment in historical cities in Malaysia. J. Teknol. 2014, 70, 147–154. [Google Scholar] [CrossRef]
  18. Keyvanfar, A.; Shafaghat, A.; Lamit, H. A decision support tool for a walkable integrated neighbourhood design using a multicriteria decision-making method. Zesz. Naukowe. Transp./Politech. Śląska 2018, 100, 45–68. [Google Scholar] [CrossRef]
  19. Davino, C.; Gherghi, M.; Sorana, S.; Vistocco, D. Measuring Social Vulnerability in an Urban Space Through Multivariate Methods and Models. Soc. Indic. Res. 2021, 157, 1179–1201. [Google Scholar] [CrossRef] [PubMed]
  20. Ferwati, M.S.; Al Saeed, M.; Shafaghat, A.; Keyvanfar, A. Qatar sustainability assessment system (QSAS)-neighborhood development (ND) assessment model: Coupling green urban planning and green building design. J. Build. Eng. 2019, 22, 171–180. [Google Scholar] [CrossRef]
  21. UN-Habitat. Turning Spaces into Places. 2013. Available online: www.unhabi-tat-kosovo.org/repository/docs/UN-habitat_Turning_spac-es_into_places-c_478833.pdf (accessed on 20 August 2022).
  22. Berke, E.M.; Koepsell, T.D.; Moudon, A.V.; Hoskins, R.E.; Larson, E.B. Association of the built environment with physical activity and obesity in older persons. Am. J. Public Health 2007, 97, 486–492. [Google Scholar] [CrossRef] [PubMed]
  23. Muslim, N.H.B.; Shafaghat, A.; Keyvanfar, A.; Ismail, M. Green Driver: Driving behaviors revisited on safety. Arch. Transp. 2018, 47, 49–78. [Google Scholar] [CrossRef]
  24. Shafaghat, A.; Keyvanfer, A.; Muslim, N.H.B. Drivers’ adaptive travel behaviors towards green transportation development: A critical review. Arch. Transp. 2016, 38, 49–70. [Google Scholar] [CrossRef]
  25. Shafaghat, A.; Jing, K.S.; Keyvanfar, A.; Jamshidnezhad, A.; Lamit, H.; Khorami, M. An urban river park restoration assessment model using analytical network process (ANP). J. Environ. Treat. Tech. 2019, 7, 92–102. [Google Scholar]
  26. Yang, S.; Chowdhury, T.U.; Ahmad Mohammadi, A.; Park, P.A. Development of a Method for Evaluating Social Distancing Situations on Urban Streets during a Pandemic. Sustainability 2020, 14, 8741. [Google Scholar] [CrossRef]
  27. Crossley, A.J.; Russo, A. Has the Pandemic Altered Public Perception of How Local Green Spaces Affect Quality of Life in the United Kingdom? Sustainability 2020, 14, 7946. [Google Scholar] [CrossRef]
  28. Clemente-Suárez, V.J.; Rodriguez-Besteiro, S.; Cabello-Eras, J.J.; Bustamante-Sanchez, A.; Navarro-Jiménez, E.; Donoso-Gonzalez, M.; Beltrán-Velasco, A.I.; Tornero-Aguilera, J.F. Sustainable Development Goals in the COVID-19 Pandemic: A Narrative Review. Sustainability 2022, 14, 7726. [Google Scholar] [CrossRef]
  29. WELL, 2020a. Hundreds of Built Environment Experts Join Forces in Statement to WHO Urging Enhanced Guidance on Role of Buildings in Addressing COVID-19. Available online: https://resources.wellcertified.com/press-releases/hundreds-of-built-environment-experts-join-forces-in-statement-to-who-urging-enhanced-guidance-on-role-of-buildings-in-addressing-covid-19/ (accessed on 22 August 2022).
  30. WELL. The Built Environment Has a Huge Role to Play in Improving Health and Wellbeing. 2020. Available online: https://resources.wellcertified.com/articles/the-built-environment-has-a-huge-role-to-play-in-improving-health-and-wellbeing/ (accessed on 22 August 2022).
  31. WELL. Universal Design: A Tool for Creating Equitable Spaces after COVID-19. 2022. Available online: https://resources.wellcertified.com/articles/universal-design-a-tool-for-creating-equitable-spaces-after-covid-19/ (accessed on 22 August 2022).
  32. Androulaki, M.; Frangedaki, E.; Antoniadis, P. Optimization of public spaces through network potentials of communities. Procedia Manuf. 2020, 44, 294–301. [Google Scholar] [CrossRef]
  33. Granell, C.; Bhattacharya, D.; Casteleyn, S.; Degbelo, A.; Gould, M.; Kray, C.; Painho, M.; Trilles, S. Geo-C: Enabling Open Cities and The Open City Toolkit. Int. Arch. Photogramm. Remote Sens. Spat. Inf. Sci. 2018, 42, 61–68. [Google Scholar] [CrossRef] [Green Version]
  34. Varna, G. Measuring Public Space: The Star Model; Routledge: London, UK, 2016. [Google Scholar]
  35. Francis, J.; Giles-Corti, B.; Wood, L.; Knuiman, M. Creating sense of community: The role of public space. J. Environ. Psychol. 2012, 32, 401–409. [Google Scholar] [CrossRef]
  36. Gupta, K.; Kumar, P.; Pathan, S.K.; Sharma, K.P. Urban Neighborhood Green Index—A measure of green spaces in urban areas. Landsc. Urban Plan. 2012, 105, 325–335. [Google Scholar] [CrossRef]
  37. Talen, E.; Allen, E.; Bosse, A.; Ahmann, J.; Koschinsky, J.; Wentz, E.; Anselin, L. LEED-ND as an urban metric. Landsc. Urban Plan. 2013, 119, 20–34. [Google Scholar] [CrossRef]
  38. Japan Sustainable Building Consortium. Comprehensive Assessment System for Built Environment Efficiency. Japan Sustainable Building Consortium—[Viewed on 20 January 2011]. 2006. Available online: http://www.ibec.or.jp/CASBEE/english/theassessment-method-employed-by-casbee (accessed on 24 August 2022).
  39. Liu, H.C.; Chen, X.Q.; Duan, C.Y.; Wang, Y.M. Failure mode and effect analysis using multi-criteria decision making methods: A systematic literature review. Comput. Ind. Eng. 2019, 135, 881–897. [Google Scholar] [CrossRef]
  40. Krippendorff, K. Content Analysis: An introduction to Its Methodology; Sage Publications: Thousand Oaks, CA, USA, 2018. [Google Scholar]
  41. Ioffe, S.; Szegedy, C. Batch normalization: Accelerating deep network training by reducing internal covariate shift. arXiv 2015, arXiv:1502.03167. [Google Scholar]
  42. Chan, L.M.; Zeng, M.L. Metadata interoperability and standardization—A study of methodology part I. D-Lib Mag. 2006, 12, 1082–9873. [Google Scholar] [CrossRef]
  43. Mitchell, D. Right to the City: Social Justice and the Fight for Public Space; Guilford Press: New York, NY, USA, 2003. [Google Scholar]
  44. Loukaitou-Sideris, A.; Ehrenfeucht, R. Sidewalks: Conflict and Negotiation over Public Space; MIT Press: Cambridge, MA, USA, 2009. [Google Scholar]
  45. McMillan, D.W.; Chavis, D.M. Sense of Community: A Definition and Theory. J. Community Psychol. 1986, 14, 6–23. [Google Scholar] [CrossRef]
  46. Johnston, C. What Is Social Value? Teaching Heritage. WWW Page. 2005. Available online: http://www.teachingheritage.nsw.edu.au/1views/w1v_johnston.html (accessed on 20 August 2022).
  47. Hester, R. Sacred Structures and Everyday Life: A Return to Manteo, North Carolina. In Dwelling Seeing and Designing: Toward a Phenomenological Ecology; Seamon, D., Ed.; State University of New York Press: Albany, NY, USA, 1993; pp. 217–298. [Google Scholar]
  48. Davis, M. City of Quartz: Excavating the Future in Los Angeles; Verso: London, UK, 1990. [Google Scholar]
  49. Craig, C.L.; Brownson, R.C.; Cragg, S.E.; Dunn, A.L. Exploring the Effect of the Environment on Physical Activity: A Study Examining Walking to Work. Am. J. Prev. Med. 2002, 23, 36–43. [Google Scholar] [CrossRef]
  50. Perkins, D.D.; Meeks, J.W.; Taylor, R.B. The Physical Environment of Street Blocks and Resident Perceptions of Crime and Disorder: Implications for Theory and Measurement. J. Environ. Psychol. 1992, 12, 21–34. [Google Scholar] [CrossRef]
  51. Lynch, K. The Image of the City, 1st ed.; The MIT Press: Cambridge, MA, USA, 1960; p. 187. [Google Scholar]
  52. Heath, T.; Smith, S.; Lim, B. The Complexity of Tall Building Facades. J. Archit. Plan. Res. 2000, 17, 206–220. [Google Scholar]
  53. Stevens, Q.; Franck, K.A. Memorials as Spaces of Engagement: Design, Use and Meaning; Routledge: London, UK, 2015. [Google Scholar]
  54. Seamon, D. Place, place identity, and phenomenology: A triadic interpretation based on jg bennett’s systematics. In The Role of Place Identity in the Perception, Understanding, and Design of Built Environments; Bentham Science Publishers: Sharjah, United Arab Emirates, 2012; pp. 3–21. [Google Scholar]
  55. Lofland, L.H. The Public Realm: Exploring the City’s Quintessential Social Territory; Routledge: London, UK, 2017. [Google Scholar]
  56. Tsai, Y.P.; Hung, S.H.; Huang, T.R.; Sullivan, W.C.; Tang, S.A.; Chang, C.Y. What part of the brain is involved in graphic design thinking in landscape architecture? PLoS ONE 2021, 16, e0258413. [Google Scholar] [CrossRef]
  57. Ranger, N.; Reeder, T.; Lowe, J. Addressing ‘deep’ uncertainty over long-term climate in major infrastructure projects: Four innovations of the Thames Estuary 2100 Project. EURO J. Decis. Processes 2013, 1, 233–262. [Google Scholar] [CrossRef] [Green Version]
  58. Wise, R.M.; Fazey, I.; Smith, M.S.; Park, S.E.; Eakin, H.C.; Van Garderen, E.A.; Campbell, B. Reconceptualising adaptation to climate change as part of pathways of change and response. Glob. Environ. Change 2014, 28, 325–336. [Google Scholar] [CrossRef]
  59. Hildebrand, P.E.; Russell, J.T. Adaptability Analysis: A Method for the Design, Analysis and Interpretation of on-Farm Research-Extension; Iowa State University Press: Ames, IA, USA, 1996. [Google Scholar]
  60. Hinkel, J.; Bisaro, A. Methodological choices in solution-oriented adaptation research: A diagnostic framework. Reg. Environ. Change 2016, 16, 7–20. [Google Scholar] [CrossRef]
  61. Lyon, A.; Tracy, W.; Colley, M.; Culbert, P.; Mazourek, M.; Myers, J.; Silva, E.M. Adaptability analysis in a participatory variety trial of organic vegetable crops. Renew. Agric. Food Syst. 2019, 35, 296–312. [Google Scholar] [CrossRef]
  62. Saltelli, A.; D’Hombres, B. Sensitivity analysis didn’t help. A practitioner’s critique of the Stern review. Glob. Environ. Change 2010, 20, 298–302. [Google Scholar] [CrossRef]
  63. Noacco, V.; Sarrazin, F.; Pianosi, F.; Wagener, T. Matlab/R workflows to assess critical choices in Global Sensitivity Analysis using the SAFE toolbox. MethodsX 2019, 6, 2258–2280. [Google Scholar] [CrossRef]
  64. Navarrete-Hernandez, P.; Vetro, A.; Concha, P. Building safer public spaces: Exploring gender difference in the perception of safety in public space through urban design interventions. Landsc. Urban Plan. 2021, 214, 104180. [Google Scholar] [CrossRef]
  65. Lee, S. The safety of public space: Urban design guidelines for neighborhood park planning. J. Urban. Int. Res. Placemaking Urban Sustain. 2022, 15, 222–240. [Google Scholar] [CrossRef]
  66. Stratigea, A.; Kikidou, M.; Patelida, M.; Somarakis, G. Engaging citizens in planning open public space regeneration: Pedio Agora framework. J. Urban Plan. Dev. 2018, 144, 05017016. [Google Scholar] [CrossRef]
  67. Yang, L.; Zhang, L.; Stettler, M.E.; Sukitpaneenit, M.; Xiao, D.; van Dam, K.H. Supporting an integrated transportation infrastructure and public space design: A coupled simulation method for evaluating traffic pollution and microclimate. Sustain. Cities Soc. 2020, 52, 101796. [Google Scholar] [CrossRef]
  68. Peng, Y.; Peng, Z.; Feng, T.; Zhong, C.; Wang, W. Assessing comfort in urban public spaces: A structural equation model involving environmental attitude and perception. Int. J. Environ. Res. Public Health 2021, 18, 1287. [Google Scholar] [CrossRef]
  69. Siu, K.W.M. Pleasurable products: Public space furniture with userfitness. J. Eng. Des. 2005, 16, 545–555. [Google Scholar] [CrossRef]
  70. Ferwati, M.S.; Keyvanfar, A.; Shafaghat, A.; Ferwati, O. A Quality Assessment Directory for Evaluating Multi-functional Public Spaces. Rigas Teh. Univ. Zinat. Raksti 2021, 17, 136–151. [Google Scholar] [CrossRef]
  71. Bertassello, L.E.; Rao, P.S.C.; Jawitz, J.W.; Aubeneau, A.F.; Botter, G. Wetlandscape hydrologic dynamics driven by shallow groundwater and landscape topography. Hydrol. Processes 2020, 34, 1460–1474. [Google Scholar] [CrossRef]
  72. Ahmed, T.; Singh, D. Probability density functions based classification of MODIS NDVI time series data and monitoring of vegetation growth cycle. Adv. Space Res. 2020, 66, 873–886. [Google Scholar] [CrossRef]
  73. Lan, T.; Lin, K.; Xu, C.Y.; Chen, X. A framework for visualizing the convergence performance of global optimization algorithms for hydrological models. In Proceedings of the EGU General Assembly Conference Abstracts, Online, 4–8 May 2020; p. 1792. [Google Scholar]
  74. Hochschild, V.; Braun, A.; Sommer, C.; Warth, G.; Omran, A. Visualizing landscapes by geospatial techniques. In Modern Approaches to the Visualization of Landscapes; Springer: Wiesbaden, Germany, 2020; pp. 47–78. [Google Scholar]
  75. Lamit, H.; Shafaghat, A.; Abd Majid, M.Z.; Keyvanfar, A.; Ahmad, M.H.B.; Malik, T.A. Grounded group decision making (GGDM) model. Adv. Sci. Lett. 2013, 19, 3077–3080. [Google Scholar] [CrossRef]
  76. Morabito, M.; Messeri, A.; Crisci, A.; Pratali, L.; Bonafede, M.; Marinaccio, A. Heat warning and public and workers’ health at the time of COVID-19 pandemic. Sci. Total Environ. 2020, 738, 140347. [Google Scholar] [CrossRef]
  77. Low, S.; Smart, A. Thoughts about public space during COVID-19 pandemic. City Soc. 2020, 32, 1–5. [Google Scholar] [CrossRef]
  78. Honey-Rosés, J.; Anguelovski, I.; Chireh, V.K.; Daher, C.; Konijnendijk van den Bosch, C.; Litt, J.S.; Mawani, V.; McCall, M.K.; Orellana, A.; Oscilowicz, E.; et al. The impact of COVID-19 on public space: An early review of the emerging questions–design, perceptions and inequities. Cities Health 2021, 5 (Suppl. S1), S263–S279. [Google Scholar] [CrossRef]
Figure 1. Photos of Al Wakrah corniche street corresponding to the model’s criteria (Source: Authors).
Sustainability 14 10940 g001
Figure 2. Cumulative distribution function (CDF) analysis of the Ca-MCSD model.
Sustainability 14 10940 g002
Figure 3. Probability density function (PDF) analysis of the Ca-MCSD model.
Sustainability 14 10940 g003
Figure 4. Parallel coordination of the Ca-MCSD model.
Sustainability 14 10940 g004
Figure 5. Summary of the exploratory study on assessing and evaluating the multi-functional corniche streets.
Sustainability 14 10940 g005
Table 2. Normalization and standardization processes for the MSPD model’s criteria and sub-criteria.
CriteriaSub-CriteriaFrequency *Normalization (N) of NetworkAbsolute Standardization (S) of NetworkIntegrated N*SSub-Criteria Adjusted Integrated ValueCriteria Adjusted Integrated Value
x-Min = AA/(Max-Min)
C1.Sc.1.1860.751.527651.1460.3070.833
Sc.1.2420.250.479260.1200.291
Sc.1.3420.250.479260.1200.291
Sc.1.4420.250.479260.1200.291
Sc.1.5530.3750.149770.0560.141
Sc.1.6640.50.778800.3890.092
Sc.1.7750.6251.407830.8800.081
Sc.1.8310.1251.108290.1390.935
Sc.1.9310.1251.108290.1390.935
Sc.1.10420.250.479260.1200.291
Sc.1.11530.3750.149770.0560.141
Sc.1.12640.50.778800.3890.092
C2.Sc.2.1860.752.036861.5280.3441.429
Sc.2.2530.3750.149770.0560.242
Sc.2.3420.250.479260.1200.499
Sc.2.4310.1251.108290.1391.603
Sc.2.5420.250.479260.1200.499
Sc.2.6310.1251.108290.1391.603
Sc.2.7310.1251.108290.1391.603
C3.Sc.3.1640.50.778800.3890.1581.429
Sc.3.2530.3750.149770.0560.242
Sc.3.3420.250.479260.1200.499
Sc.3.4310.1251.108290.1391.603
Sc.3.5210.1251.737320.2172.614
Sc.3.6310.1251.108290.1391.603
Sc.3.7420.250.479260.1200.499
C4.Sc.4.110813.294923.2951.4291.429
Sc.4.2420.250.479260.1200.499
Sc.4.3530.3750.149770.0560.242
Sc.4.4310.1251.108290.1391.603
Sc.4.5420.250.479260.1200.499
Sc.4.6420.250.479260.1200.499
Sc.4.7530.3750.149770.0560.242
C5.Sc.5.1640.50.778800.3890.1231.111
Sc.5.2640.50.778800.3890.123
Sc.5.3530.3750.149770.0560.188
Sc.5.4530.3750.149770.0560.188
Sc.5.5640.50.778800.3890.123
Sc.5.6530.3750.149770.0560.188
Sc.5.7640.50.778800.3890.123
Sc.5.8530.3750.149770.0560.188
Sc.5.9530.3750.149770.0560.188
Note: * The values of frequency were obtained from the content analysis in Table 1.
Table 3. Structuralizing the MSPD model and determining the final assessment range of sub-criteria.
Criteria Adjusted Integrated ValueSub-Criteria Adjusted Integrated ValueSub-Criteria Rating RangeSub-Criteria Assessment MethodSub-Criteria Assessment RangeSub-Criteria Final Adjusted Integrated Assessment RangeSub-Criteria Average Adjusted Integrated Assessment Range
C1.: 0.833Sc.1.10.3070 = Limited; 1 = Low; 2 = Medium; 3 = HighObservation (Counting)0.4–1.20.1228–0.36840.1228
Sc.1.20.2910 = Limited; 1 = Low; 2 = Medium; 3 = HighObservation (Counting)0.4–1.20.1228–0.34920.1132
Sc.1.30.2910 = Limited; 1 = Low; 2 = Medium; 3 = HighObservation (Counting)0.4–1.20.1228–0.34920.1132
Sc.1.40.2910 = Limited; 1 = Low; 2 = Medium; 3 = HighObservation (Counting)0.4–1.20.1228–0.34920.1132
Sc.1.50.1410 = Limited; 1 = Low; 2 = Medium; 3 = HighObservation (Counting)0.4–1.20.1228–0.16920.0232
Sc.1.60.0920 = Limited; 1 = Low; 2 = Medium; 3 = HighObservation (Counting)1.0–3.00.092–0.2760.0920
Sc.1.70.0810 = Limited; 1 = Low; 2 = Medium; 3 = HighObservation (Counting activities, behaviors, and postures)1.0–3.00.081–0.2430.0810
Sc.1.80.9350 =< 10 hrs; 1 = At least 10 hrs; 2 = Most 10 hrs; 3 = No restrictionObservation 1.0–3.00.935–2.8050.9350
Sc.1.90.9353 = None; 2 = Somewhat; 1 = Moderately; 0 = Very muchObservation (determined by signs, location, size, etc.)1.0–3.00.935–2.8050.9350
Sc.1.100.2913 = Not at all; 2 = Somewhat; 1 = Moderately; 0 = Very muchUsers’ subjective rating 1.0–3.00.291–0.8730.2910
Sc.1.110.1410 = Not at all; 1 = Some part/time; 2 = Mostly; 3 = CompletelyUsers’ subjective rating2.0–6.00.282–0.8460.2820
Sc.1.120.0920 = cannot; 1 = only in some/ at some time; 2 = in many; 3 = in almost allUsers’ subjective rating1.0–3.00.092–0.2760.0920
Criteria-Total Index Score10.0–30.0--
C2.:1.429Sc.2.10.3440 = None; 1 = One; 2= Two; 3 = FewObservation
(determined by businesses, community gathering places)
2.0–6.00.688–4.1281.7200
Sc.2.20.2420 = Limited; 1 = Low; 2 = Medium; 3 = HighObservation (Count of activities, behaviors, and postures)1.0–3.00.242–0.7260.2420
Sc.2.30.4990 = None; 1 = Somewhat; 2 = Moderately; 3 = Very flexibleObservation (determined by modifications made by users)1.0–3.00.499–1.4970.4990
Sc.2.41.6030 = None; 1 = One; 2 = Two; 3 = SeveralObservation (Counting)2.0–6.03.206–19.2368.0150
Sc.2.50.4990 = None; 1 = Very little; 2 = Moderate; 3 = HighObservation (Counting)1.0–3.00.499–1.4970.4990
Sc.2.61.6030 = Not suitable; 1 = Somewhat; 2 = Moderately; 3 = Very suitableUsers’ subjective rating2.0 -6.03.206–19.2368.0150
Sc.2.71.6030 = Not at all; 1 = Somewhat; 2 = Moderately; 3 = Very muchUsers’ subjective rating1.0–3.01.603–4.8091.6030
Criteria-Total Index Score10.0–30.0--
C3.: 1.429Sc.3.10.1580 = None; 1 = Few; 2 = in some parts; 3 = in many partsObservation (Counting)2.0–6.00.316–1.8960.7900
Sc.3.20.2420 = None; 1 = Few; 2 = in some parts; 3 = in many partsObservation (Counting)1.0–3.00.242–0.7260.2420
Sc.3.30.4990 = None; 1 = Few; 2 = in some parts; 3 = in many partsObservation (Counting)1.0–3.00.499–1.4970.4990
Sc.3.41.6030 = Not comfortable; 1 = Somewhat comfortable in some parts; 2 = Comfortable in some parts; 3 = Comfortable in most partsObservation (Counting)2.0–6.03.206–19.2368.0150
Sc.3.52.6143 = None; 2 = One or Two; 1 = Few; 0 = SeveralObservation (Counting)1.0–3.02.614–7.8422.6140
Sc.3.61.6030 = Not at all; 1 = Somewhat; 2 = Mostly; 3 = Very muchUsers’ subjective rating2.0–6.03.206–19.2368.0150
Sc.3.70.4990 = None; 1 = Very little; 2 = Moderate; 3 = HighUsers’ subjective rating1.0–3.00.499–1.4970.4990
Criteria-Total Index Score10.0–30.0--
C4.: 1.429Sc.4.11.4290 = None; 1 = One; 2 = Two; 3 = FewObservation 1.0–3.01.429–4.2871.4290
Sc.4.20.4990 = Limited; 1 = Low; 2 = Medium; 3 = HighObservation 1.0–3.00.499–1.4970.4990
Sc.4.30.2420 = None; 1 = Somewhat; 2 = Moderately; 3 = Very flexibleObservation 1.0–3.00.242–0.7260.2420
Sc.4.41.6033 = Very much; 2 = Some safety; 1 = Not at all; 0 = UnsafeUsers’ subjective rating1.0–3.01.603–4.8091.6030
Sc.4.50.4990 = Not safe; 1 = Somewhat unsafe; 2 = Mostly safe; 3 = Very safeUsers’ subjective rating2.0–6.00.998–5.9882.4950
Sc.4.60.4990 = Not safe; 1 = Somewhat unsafe; 2 = Mostly safe; 3 = Very safeUsers’ subjective rating2.0–6.00.998–5.9882.4950
Sc.4.70.2420 = Not safe; 1 = Somewhat unsafe; 2 = Mostly safe; 3 = Very safeUsers’ subjective rating2.0–6.00.484–2.9041.2100
Criteria-Total Index Score10.0–30.0--
C5. 1.111Sc.5.10.1230 = None; 1 = Very few; 2 = Moderate; 3 = SeveralObservation 1.0–3.00.123–0.3690.1230
Sc.5.20.1230 = Very poor; 1 = Moderate; 2 = Good; 3 = Very goodObservation 1.0–3.00.123–0.3690.1230
Sc.5.30.1880 = Not at all; 1 = Somewhat permeable; 2 = Moderately permeable; 3 = Very permeableObservation 1.0–3.00.188–0.5640.1880
Sc.5.40.1880 = Not at all; 1 = Somewhat personalized; 2 = Moderately personalized; 3 = Very personalizedObservation 1.0–3.00.188–0.5640.1880
Sc.5.50.1230 = Poor articulation; 1 = Somewhat articulated; 2 = Moderate articulation; 3 = Very well articulatedObservation 1.0–3.00.123–0.3690.1230
Sc.5.60.1880 = None; 1 = Few; 2 = Moderate; 3 = HighObservation (Counting)1.0–3.00.188–0.5640.1880
Sc.5.70.1230 = None; 1 = Very little; 2 = Moderate; 3 = HighObservation (Counting)1.0–3.00.123–0.3690.1230
Sc.5.80.1880 = Not at all; 1 = Somewhat; 2 = Moderate; 3 = Very muchUsers’ subjective rating2.0–6.00.376–2.2560.9400
Sc.5.90.1880 = Not at all; 1 = Somewhat; 2 = Moderate; 3 = Very muchUsers’ subjective rating1.0–3.00.188–0.5640.1880
Criteria-Total Index Score10.0–30.0--
Total Index rating (Out of 150)50.0–150.0--
Table 4. Results of implementing the MSPD model in the study site (Al Wakrah corniche street) to determine the final assessment values of sub-criteria for developing the Ca-MSPD model.
Criteria Adjusted Integrated Value *Sub-Criteria Adjusted Integrated Value **Sub-Criteria Assessment Value RangeSub-Criteria Final Assessment Value RangeSub-Criteria Assessment Value ***Sub-Criteria
Final Assessment Value through the Case Study
Stochastic Error (SE)
C1.: 0.833Sc.1.10.3070.4–1.20.1228–0.36841.2000.3680.042
Sc.1.20.2910.4–1.20.1228–0.34921.0210.297−0.122
Sc.1.30.2910.4–1.20.1228–0.34921.1120.3240.051
Sc.1.40.2910.4–1.20.1228–0.34920.6000.1750.051
Sc.1.50.1410.4–1.20.1228–0.16920.7540.106−0.009
Sc.1.60.0921.0–3.00.092–0.2762.0000.1840.092
Sc.1.70.0811.0–3.00.081–0.2432.3300.1890.020
Sc.1.80.9351.0–3.00.935–2.8053.0002.8050.000
Sc.1.90.9351.0–3.00.935–2.8052.3302.179−0.935
Sc.1.100.2911.0–3.00.291–0.8731.3300.3870.291
Sc.1.110.1412.0–6.00.282–0.8465.1060.720−0.282
Sc.1.120.0921.0–3.00.092–0.2763.0000.2760.092
C2.:1.429Sc.2.10.3442.0–6.00.688–4.1286.0000.3441.376
Sc.2.20.2421.0–3.00.242–0.7262.6700.2420.061
Sc.2.30.4991.0–3.00.499–1.4972.6700.499−0.249
Sc.2.41.6032.0–6.03.206–19.2366.0001.6036.412
Sc.2.50.4991.0–3.00.499–1.4971.3300.4990.499
Sc.2.61.6032.0–6.03.206–19.2365.1061.6039.618
Sc.2.71.6031.0–3.01.603–4.8092.0001.603−1.603
C3.: 1.429Sc.3.10.1582.0–6.00.316–1.8963.7730.5960.316
Sc.3.20.2421.0–3.00.242–0.7262.6700.646−0.242
Sc.3.30.4991.0–3.00.499–1.4971.6000.798−0.499
Sc.3.41.6032.0–6.03.206–19.2367.88012.6320.000
Sc.3.52.6141.0–3.02.614–7.8421.0702.797−1.307
Sc.3.61.6032.0–6.03.206–19.2366.0009.618−3.200
Sc.3.70.4991.0–3.00.499–1.4972.6701.3320.499
C4.: 1.429Sc.4.11.4291.0–3.01.429–4.2873.0004.287−1.429
Sc.4.20.4991.0–3.00.499–1.4973.0001.497−0.499
Sc.4.30.2421.0–3.00.242–0.7262.0000.4840.000
Sc.4.41.6031.0–3.01.603–4.8093.0004.809−1.603
Sc.4.50.4992.0–6.00.998–5.9885.1062.548−0.998
Sc.4.60.4992.0–6.00.998–5.9885.1062.548−0.998
Sc.4.70.2422.0–6.00.484–2.9044.2261.023−0.484
C5. 1.111Sc.5.10.1231.0–3.00.123–0.3691.0000.1230.123
Sc.5.20.1231.0–3.00.123–0.3691.0000.1230.123
Sc.5.30.1881.0–3.00.188–0.5641.0000.188−0.188
Sc.5.40.1881.0–3.00.188–0.5641.0000.188−0.188
Sc.5.50.1231.0–3.00.123–0.3691.0000.123−0.123
Sc.5.60.1881.0–3.00.188–0.5641.0000.1880.188
Sc.5.70.1231.0–3.00.123–0.3691.0000.1231.757
Sc.5.80.1882.0–6.00.376–2.2566.0001.1280.376
Sc.5.90.1881.0–3.00.188–0.5643.0000.564−0.188
Note: * Criteria adjusted integrated values are extracted from Table 2. ** Sub-criteria adjusted integrated values are extracted from Table 3. *** The assessment values are obtained through averaging the values obtained from the expert-input study and observation of the study site (i.e., (Al Wakrah Public Space).
Table 5. Results of ANOVA regression analysis when developing the Ca-MSPD model.
Multiple R0.648895
R Square0.421065
Adjusted R Square0.406591
Standard Error1.906881
ANOVA Df *SS **MS ***FSignificance F
Regression1105.7855105.785529.092343.35 × 10−6
Residual40145.44783.636196
Total41251.2333
CoefficientsStandard Errort Statp-valueLower 95%Upper 95%
Intercept−0.007330.405089−0.018090.985658−0.826040.811388
X Variable 12.634220.4883855.3937323.35 × 10−61.6471563.621284
Note: * df: degree of freedom; ** SS: sum of squares; *** MS: mean squared errors.
Publisher’s Note: MDPI stays neutral with regard to jurisdictional claims in published maps and institutional affiliations.

