
Eco-Economic Performance Estimation Method for Pretensioned Spun High-Strength Concrete Pile Installation


1
Intelligent Construction Automation Center, Kyungpook National University, Daegu 41566, Korea
2
Department of Architecture, Seowon University, Cheongju 28674, Korea
*
Author to whom correspondence should be addressed.
Sustainability 2022, 14(19), 11990; https://doi.org/10.3390/su141911990
Submission received: 19 July 2022
/
Revised: 4 September 2022
/
Accepted: 19 September 2022
/
Published: 22 September 2022
(This article belongs to the Topic Advances in Construction and Project Management)
Abstract
:Pile installation has an environmental impact through its various processes ranging from raw material extraction to construction. In addition, the environmental performance, productivity, and cost of pile installation depend on the construction plan. Therefore, the chain of activities must be considered when analyzing the sustainability of pile installation. A rational construction plan must carefully examine the factors that affect the productivity and sustainability of pile installations. This study presents a method for evaluating eco-economic performance by analyzing the resource utilization and processes of PHC pile installation. First, a process modeling technique, wherein details are broken down to the work task level, based on energy consumption and resource cost, is proposed. Second, a simulation method that calculates the eco-economic performance of the PHC pile process and resources (e.g., equipment) is presented. Third, a quantitative comparison of durations, costs, and emissions resulting from simulation, estimation based on the CSPR (Construction Standard Production Rate) and IUC (Itemized Unit Cost), site contract, and actual construction is presented. The results reveal that the method effectively reflects the prediction of duration, cost, and carbon emissions generated in the real world during the construction planning stage.
1. Introduction
1.1. Research Background
A pile foundation is a columnar structural element located in the lower part of a structure, such as a building or bridge, that transfers load from the structure to the ground [1]. It supports the structure and prevents subsidence or inclination by transmitting the load to the ground. The pile consists of cement, sand, aggregate, and chemicals, and the construction process consumes various materials. These production and construction processes generate waste and pollutants, which contaminate natural resources, such as land and water, and affect the functioning of the construction site and surrounding natural systems. This series of activities must be carefully considered to analyze the sustainability of pile installation, and it is necessary to establish a reasonable construction plan after closely examining the factors that affect the productivity of pile installation [2,3]. Reducing carbon emissions in pile construction is mainly related to minimizing fuel and material consumption and reducing waste generation during installation, which can be achieved by implementing sustainable construction practices and improving the quality of construction processes [4]. Fossil fuels used for heavy equipment in pile construction generate 2.62 kg of CO2 emissions from 1 L of diesel and 0.537 kg of CO2 per 1 kWh of electricity used [5]. The most carbon-emitting resource during pile construction is the construction equipment, and various studies on the carbon emission of construction equipment are being conducted because of this importance [5,6,7]. However, there is an absence of quantitatively predicting the amount of carbon emitted by the resources used for pile construction at a detailed level. Environmental performance, productivity, and cost depend on the construction plan. Therefore, a system that helps quantitatively evaluate these factors simultaneously and supports decision-making is essential.
This study presents a simulation modeling and analysis method for simultaneously estimating stochastic carbon emissions generated by the resources (i.e., equipment) and the amount of time and cost required for the completion of pile installation. The method evaluates productivity and environmental performance during the planning stage of the pile installation. Additionally, it helps establish a reasonable pretensioned spun high-strength concrete (PHC) pile construction plan considering the environmental and economic feasibility.
1.2. Research Aim and Scope
This study presents a method for stochastically estimating the duration, cost, and carbon emissions of the PHC pile installation process. The proposed method deals with tasks that have repetitive attributes, such as adjusting axis, drilling, removing auger and grouting, pile erection and placement, and moving to the next pile location, using discrete event simulation (DES). DES can be used to build and analyze a cyclical network model of the construction process. Additionally, analyzing the construction process in detail and improving the accuracy of estimating the duration, cost, and emissions is possible using DES [8,9,10,11,12,13]. DES is recognized as a useful tool that can effectively deal with the detailed analysis of energy consumption and carbon emissions of resources during the construction process. Therefore, in this study, after establishing a simulation model of PHC pile installation using DES, an eco-economic analysis method of the process is presented.
The detailed research procedure undertaken to achieve this research goal is detailed as follows. First, previous studies on pile construction and DES were investigated. Subsequently, processes and procedures were established to evaluate the productivity and environmental performance of the PHC pile installation process. Second, by conducting on-site surveys and expert interviews, information on the resources required for PHC pile installation (e.g., the hourly cost of resources, fuel consumption of equipment, etc.) was obtained. In addition, the task time data required for the pile installation and simulation modeling data (e.g., the relationship among tasks and the process of each resource) were collected through video recordings. Third, the PHC pile installation process was identified for simulation modeling based on the process information obtained from field surveys, expert interviews, and video recordings. Subsequently, the precedence relationship between the work tasks and the system input and output values were defined. Finally, an application for estimating the duration, cost, and carbon emissions to complete the PHC pile installation process was developed and used to create a simulation based on the collected and analyzed information. Furthermore, the validity of the model was verified by analyzing and comparing the results with an actual field case.
2. Literature Review
Sustainable construction is reflected in applying sustainable development practices in the industry, and efficient implementation of the construction process is the most critical aspect of sustainable pile construction [14,15]. According to [16], construction and design encourage achieving three goals: Economic sustainability to stimulate economic growth, environmental sustainability to minimize environmental impact, and social sustainability approach, a sustainable construction practice for social well-being. Therefore, it contributes tremendous utility to economic, environmental, and social development and ultimately creates a sustainable construction environment [17]. Optimization of the construction process and reduced uncertainty are expected to improve sustainability and component performance [18]. However, this uncertainty poses challenges for underground infrastructure, such as foundations [19,20]. Additionally, [21] found that sustainable practices of pile construction played a crucial role in gaining a competitive advantage through cost effectiveness, performance efficiency, and sustainability. [22] showed that excavated piles account for higher greenhouse gas emissions than drilled piles, and the installation process of bored piles needed optimization. [23] pointed out that high-strength prestressed concrete piles can reduce greenhouse gas emissions and economic costs by almost half compared to steel H-piles. The authors in [24] compared actual field data with alternatives (Scenarios 1 and 2) for 341 precast concrete pile construction sites. They presented a method that searches for optimal alternatives by analyzing the variability and uncertainty related to the overall pile construction (i.e., design, manufacturing, and construction) based on data obtained from interviews with precast pile manufacturing and installation experts. A foundation constructed for an eight-story reinforced concrete structure residential building in San Francisco was analyzed based on the principles of lean construction, which pursues an efficient construction production system that minimizes waste. Ref. [3] presented a method that estimates the productivity and cost of bored pile construction using a deterministic technique. Data for the analysis were collected using questionnaires, interviews, and telephone calls with construction experts. The productivity, cycle time, and cost of the five models were analyzed while taking into consideration the pile size, depth, pouring method, soil type, and construction method. Ref. [25] developed a productivity index based on factors affecting the productivity and cost of continuous flight auger (CFA) pile installation. The productivity index quantifies the subjective factors that affect the productivity of the CFA pile installation. The study analyzed the productivity, cycle time, and cost of CFA pile construction for various models using a deterministic approach. The productivity index was calculated using the analytic hierarchy process (AHP) and fuzzy theory [26]. In addition, various approaches, such as discrete event simulation [27,28,29], regression analysis [30,31], and neural networks [32], were applied to analyze productivity and cost according to variables, such as pile size, pile length, soil type, and auger length. In addition, [33] presented a method called the rank reversal technique and compared the simulation results of pile installation obtained from various approaches, that is, deterministic, simulation, regression, and artificial neural networks. Refs. [2,34,35] presented a quantitative analysis method for evaluating the sustainability of drilled shafts and precast concrete (PC) pile installations. The authors analyzed the environmental impact and economic feasibility of the two methods using life cycle assessment (LCA) and cost-benefit analysis (CBA). In addition, multi-criteria analysis (MCA), which evaluates the environmental impact and economic feasibility, was used to select the optimal result for supporting decision-making. Ref. [21] demonstrated that cost-effectiveness, productivity improvement, and minimization of environmental impact (attaining sustainability) are possible through a comparison of the previously implemented and alternative methods of pile foundation construction. In the case study, the author postulated that a reduction 15% in cost and 18.61% in CO2 emissions is possible if alternative comparisons are conducted before starting pile construction.
Although numerous studies that recognize the importance of productivity and environmental performance evaluations at the construction stage have been conducted, these studies do not provide a method for the stochastic estimation of construction eco-economic performance at a detailed level. The method presented in this study provides a more accurate prediction and supports a rational decision-making process during the construction planning stage of PHC pile installation using simulation techniques.
3. Eco-Economic Performance Estimation System for PHC Pile Installation
3.1. System Structure and Components
This system consists of (1) a process simulation modeling and execution environment, (2) a graphic user interface of the simulation system, and (3) a datasheet. The graphic user interface and simulation environment of this system were built using MATLAB 2009b version. This system helps analyze the eco-economic performance using a simulation model that estimates the duration, cost, and energy consumption based on the attributes of equipment and labor deployed in the PHC pile installation process. The system consists of the following three stages.
- Simulation modeling and system setting (input variables: Resources and tasks, system and datasheets)
- Simulation execution (processing and calculation)
- Results analysis (finding probabilities under limitations)
3.2. System Process
The system process for the eco-economic performance analysis of the pile installation process is presented in this section. The system process is illustrated in Figure 1.
This system performs experiments based on a DES model and the system input variables. In addition, variability data on the entity flow generated by the work task or waiting time of each modeling component are collected in a vector format, and stochastic emission, duration, and cost information of the PHC pile installation process are provided.
3.2.1. Simulation Modeling and Input Variables for Modeling Component
This section presents the model development and input/output variables for the PHC pile process. The four key components needed to build a construction process model are (1) knowledge of the construction method related to the process, (2) knowledge of the process for breaking down a construction process into a basic work task level, (3) information to identify the resources required for the process, and (4) the ability to define relationships between the resources and work tasks [36]. To analyze the eco-economic performance of the PHC pile process, a simulation model must be established, and input variables for the model must be set. This system provides a simulation model and a graphical user environment in which a simulation model is built, and the input variables of the model of the PHC pile installation process are specified. The PHC pile installation process model integrates the individual processes of all resources (Figure 2).
The resources involved in performing the work tasks in this study follow the process presented below.
- Cement and water mixture is used for grouting and additional grouting and is subsequently removed from the system.
- The PHC pile is moved to the work spot by the payloader, connected to the crawler crane, and installed at the location. When a rebound check is performed, it is removed from the system.
- The mixer, payloader, and excavator each perform a single task of mixing, moving piles, and removing slime, respectively. The pump injects cement paste during grouting and performs additional grouting tasks.
- The crew performs axis adjustment, pile connection, and rebound check in a cyclical manner.
- The crawler crane cyclically performs axis adjustment, drilling, removing the auger, pile connection, pile erection, removing casing, rebound check, and moving to another axis.
Combi and Normal components are used for modeling time-consuming tasks performed by the resources deployed in the process model. Queue is a component that initializes resources with a cyclic process (e.g., equipment and crew), a non-cyclic process (e.g., material), or an idle state. For example, crawler cranes, mixers, pumps, and crew are cyclic resources, whereas PHC piles, cement, and water are non-cyclic resources, as depicted in Figure 2. Resources deployed to the process model are initialized in the Queue, and the time variables (task time function (TTF)) that cause variability in the simulation are set using the Combi and Normal components. When TTFs are set for work tasks, the system runs a simulation and calculates the time taken during the simulation by each component as well as the entire system based on queuing theory. The counter component performs entity counting and stops the simulation when it receives the stopping conditions from the system.
The drilling task time is related to several conditions, such as the hole size, strata, and excavation time for each stratum. This study presents a method for estimating the drilling task time using a drill diagram. First, based on the section guide and drill logs, the system creates a 3D contour map according to the geological distribution of the site (Figure 3). By connecting each point of the drill log (e.g., BX-10, NX-9, etc.) according to the section guide and stratum level (e.g., Ground level, Soil level, Rock level, etc.), the system identifies a 3D map of the ground and stratum level of each PHC pile. The 3D geological modeling process can be found in other studies (e.g., [37,38,39]). Second, the system calculates the excavation time for each file (Equation (1)) by overlapping the pile location on the 3D map and saving it as a vector () for the TTF of the drilling task.
where is the drilling task time for installation spot, is the length of each stratum for drilling task, and is the drilling time for each stratum for drilling task.
The system (1) imports the probability distribution function and parameters of the TTF except for the drilling task from the datasheet, (2) assigns it to each work task, (3) sets the time unit (i.e., second, minute, or hour), (4) initializes the maximum simulation iterations and sets the model’s stoppage condition (i.e., cycles or simulation time limit), and (5) sets the current simulation iteration (k) to 0 and executes the computation till iteration (k) reaches the maximum simulation iteration (j). In addition, the system (6) imports the hourly fuel consumption and cost information of the resources from the datasheet and (7) stores it in a matrix. When the modeling and system input are completed, the simulation is executed.
3.2.2. Simulation Execution and Result Analysis
The system runs simulations using the developed model and input variables. In addition, the variability data arising from the entity flow generated by waiting or working time for each element are saved as a vector in each simulation. Using the generated data, the (1) process completion duration, (2) process completion cost, and (3) carbon emissions of equipment are calculated and saved. The system imports the matrix of the stored datasheet before the simulation is executed and uses it to calculate the carbon emissions from each component during the simulation. The hourly fuel consumption and cost of the deployed equipment used in this study and the average drilling time for each stratum were collected from expert interviews, and the other work task times were analyzed using video recordings and a time-lapse study.
The system calculates the total carbon dioxide emissions of the process by summing carbon dioxide emissions from each piece of equipment. The fuel consumption () of the individual piece of equipment is calculated by applying Equation (2) using the average service time of the work task (), where the equipment i is involved, and the average fuel consumption per hour () of the equipment i.
The system calculates the carbon dioxide emissions () using the total fuel consumption () of each individual piece of equipment and the emission calculation formula of the Intergovernmental Panel on Climate Change (IPCC) [40] (Equation (3)).
where 0.000845 is the ton of oil equivalent (TOE) of diesel, 0.837 is the carbon emission factor of diesel, 44/12 is the ratio of carbon dioxide molecular weight to carbon atomic weight, and the constant 1000 is used to convert tons to kg.
The total carbon dioxide emission () of the PHC pile installation process is calculated using the total carbon dioxide emission amount of the individual piece of equipment () and the number of pieces of equipment (), using Equation (4).
Subsequently, the total cost of the PHC pile installation process () is computed using the equipment’s hourly costs (), number of deployed equipment (), and elapsed simulation time (, total duration of pile installation process), using Equation (5).
The performance results are saved during each simulation, and the optimal probability distribution function and parameters of each performance indicator (i.e., duration, cost, and emission) are estimated and presented using the best-fit PDF algorithm by the construction operation and project scheduling (COPS) system [8]. Subsequently, a user can query the probability of completing the process within a specified duration, cost, and emission. This helps practitioners in decision-making.
4. Test Case
4.1. Simulation Modeling of the PHC Pile Installation Process
A total of 299 PHC piles (400 mm) were installed (Figure 4). The pile specifications (length, diameter, etc.) and quantity were designed based on ground investigation results.
The work tasks performed by the deployed resources and the process of each resource were identified by site investigation and video recordings. The resources deployed in the PHC pile installation model used in the case study were material (i.e., cement paste, water, and PHC pile), labor (i.e., crew), and equipment (i.e., crawler crane, excavator, payloader, pump, and mixer). Table 1 presents the attributes of the equipment used.
The attribute values of the resources used to perform the PHC installation process are listed in Table 1 and Table 2. The average hourly fuel consumption and hourly cost of the equipment were obtained through expert interviews. To measure the work task time of the PHC pile process, a video recording and time-lapse study were conducted. Time measurements for each work task were performed at least 30 times to ensure sampling reliability.
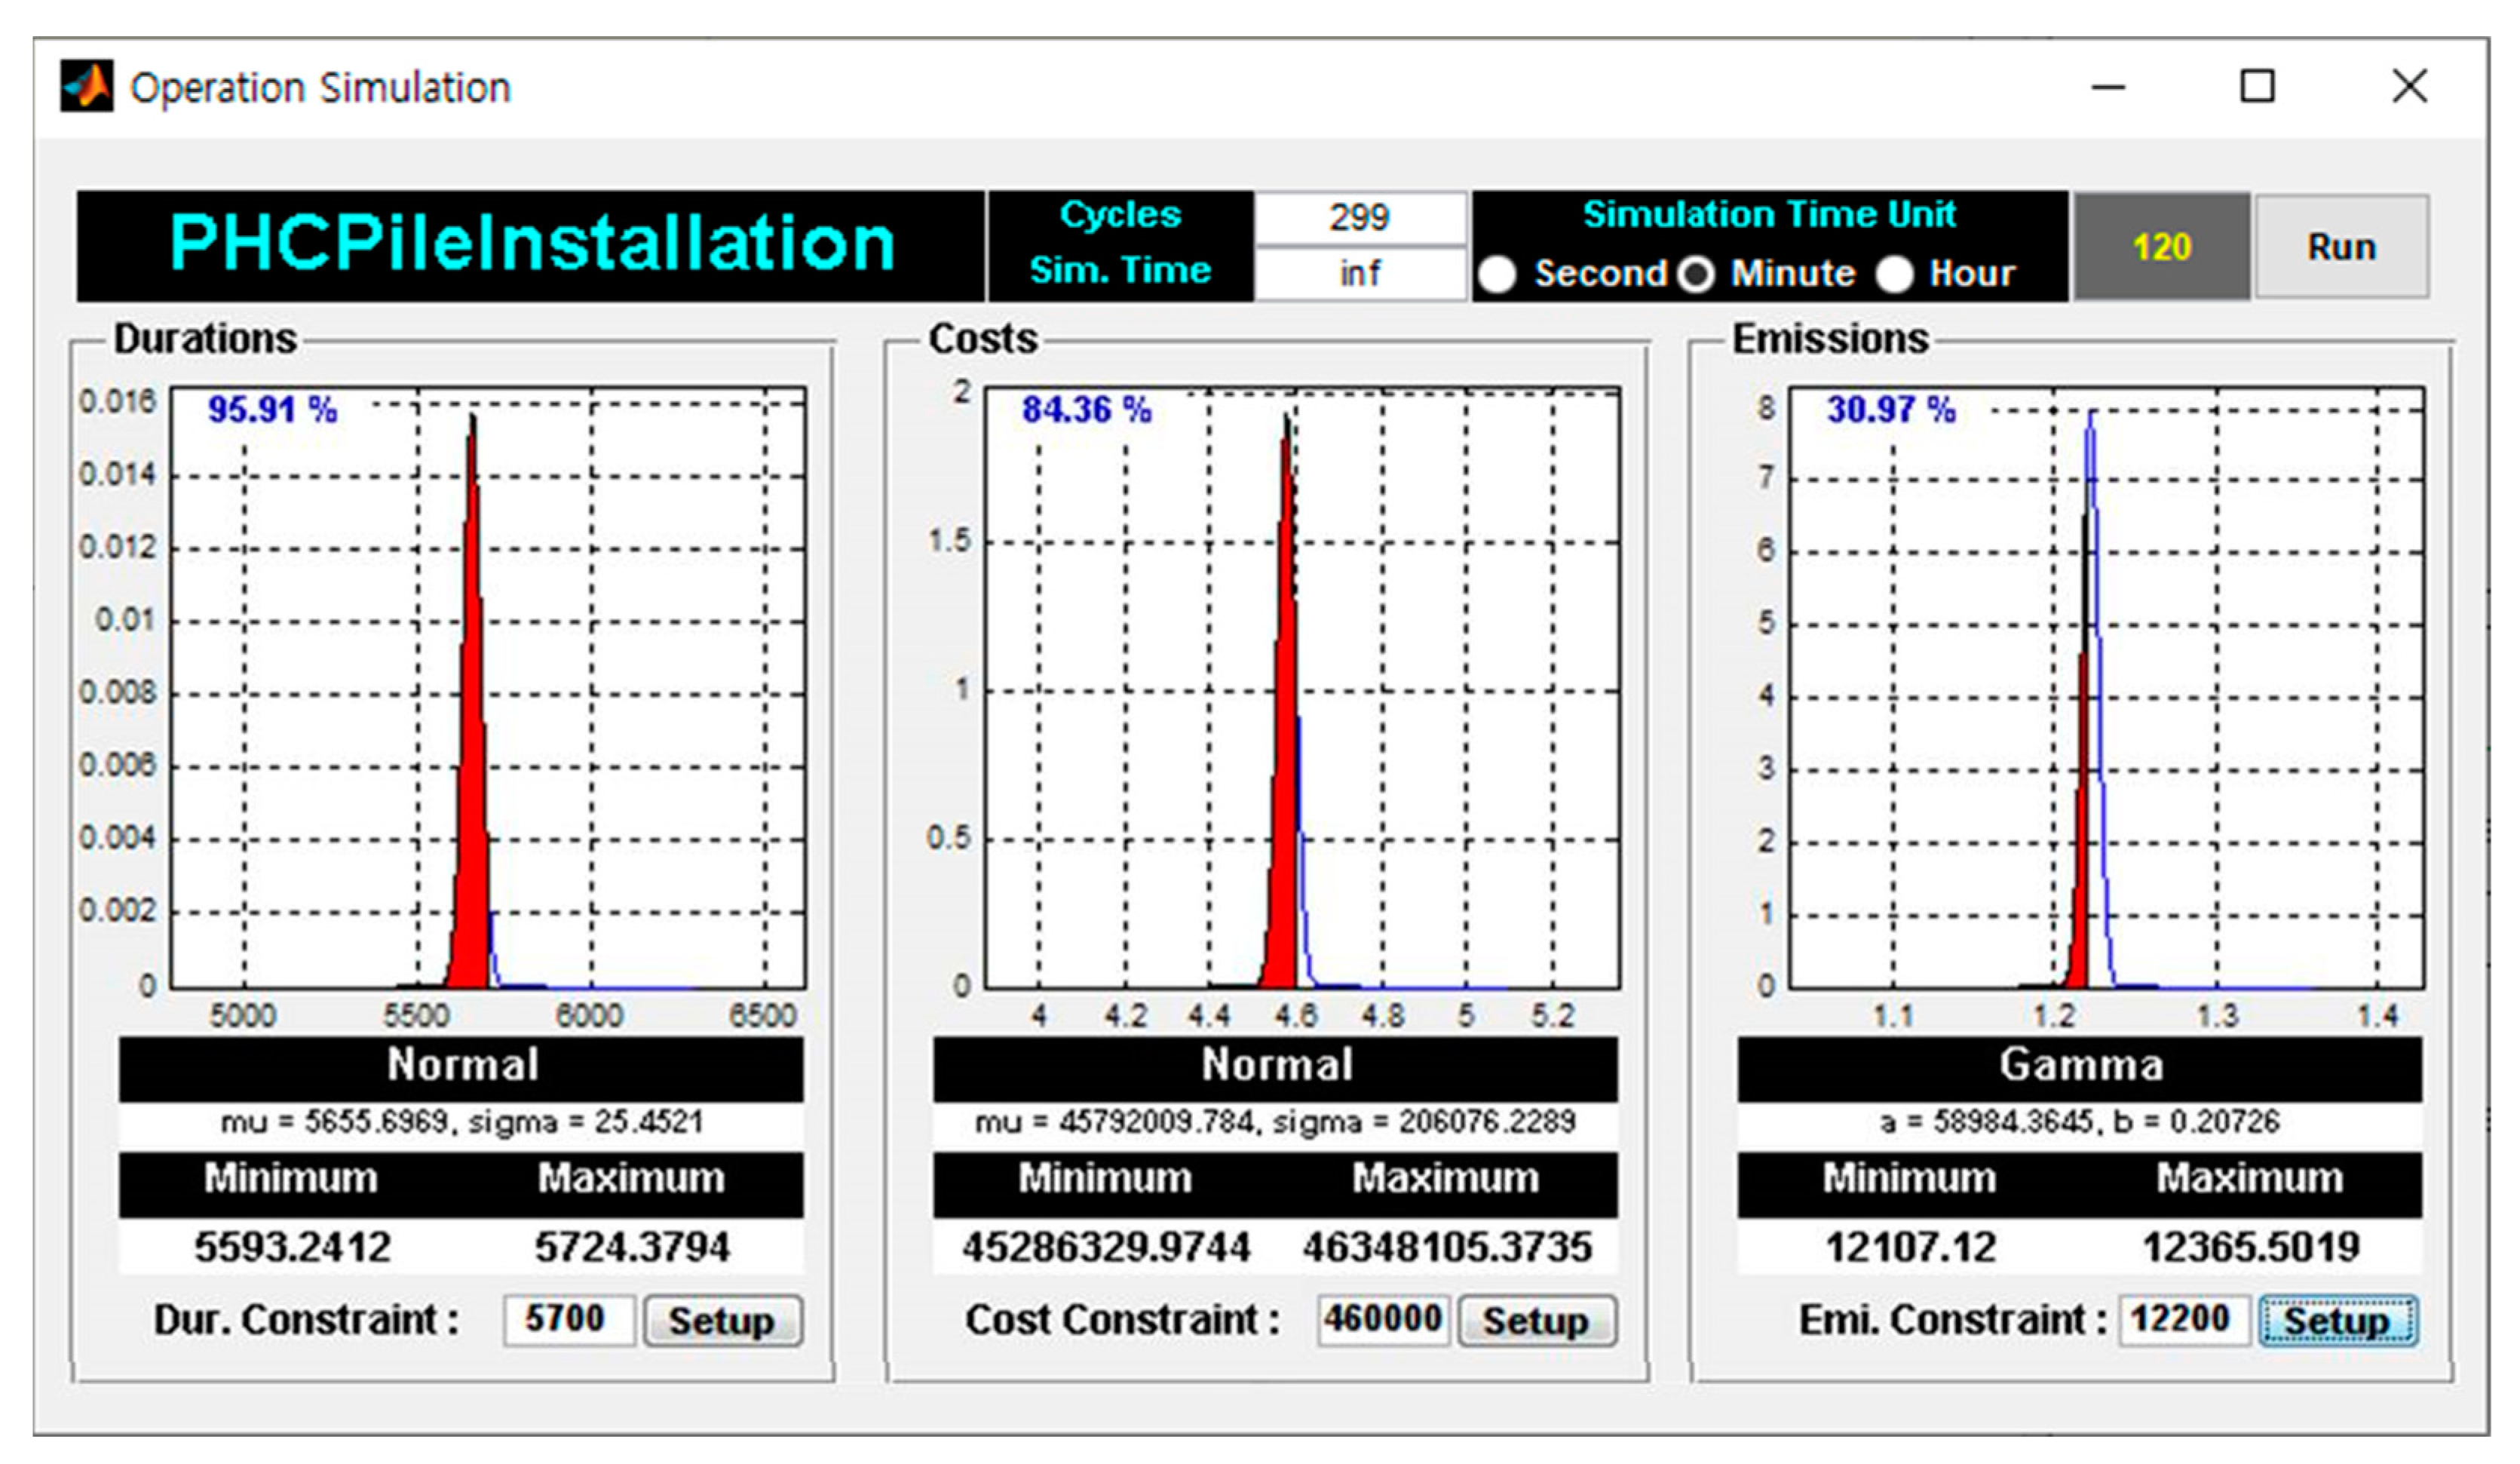
4.2. Simulation Experiment Results and Discussion
Figure 5 shows the results of the simulation based on the information presented above. The system executes iterative simulations to calculate and present the optimal probability distribution function and parameters of the process completion duration, cost, carbon dioxide emissions, and interval values (minimum and maximum) for each performance. Additionally, the probability of delivering the process within the specified value for each simulation result was calculated and presented by querying the value specified for each output. The simulation results for each output are presented in Figure 5 and Table 4. An eco-economic construction plan for the PHC pile was established using these simulation experiments. For example, if the probabilities of performance are low, a project manager can secure a margin on deadline, budget, or carbon emissions.
The simulation results of this study showed that Duration and Cost are the Normal probability distribution functions, and Emission is the Gamma probability distribution function. The system presents PDF (Probability Distribution Functions) and values of parameters (e.g., ‘mu’ and ‘sigma’ of Normal distribution and ‘a’ and ‘b’ of Gamma distribution) after the simulation experiment is finished. The system calculates the minimum and maximum of Duration, Cost, and Emission as [5593:5724], [45,286,330:46,348,105], and [12,107:12,366], respectively. In this simulation results, the constraint conditions of the construction site are set as duration [5700 min], Cost [46,000,000 KRW], and Emission [12,200 kgCO2], and the system calculates and presents 95.91%, 84.36%, and 30.97%, respectively (Table 4).
The simulation results, estimation based on the CSPR (Construction Standard Production Rate) and IUC (Itemized Unit Cost), site contract, and actual construction results are presented to compare and validate the presented method in this study (Table 5). The CSPR and IUC are used to estimate the duration and cost of construction projects in Korea. The estimation process using CSPR and IUC of Korea is similar to the process of using RS Means of the U.S. and Rawlinsons Construction Cost Guide of Australia. Based on the CSPR, the construction quantity and duration of tasks are calculated, and the costs of the works are calculated using the ICU. The detailed calculation process of estimating duration, cost, and carbon emission based on the CSPR and IUC is presented in Appendix A.
All four results of the duration appear to be different. First, the number of actual working days of the construction site was 17. However, if we substituted the six days when less than seven piles per day were erected per day, the number of average working days becomes 12. This result differs from the CSPR and contractual working days and is similar to the simulation result. Second, the cost of the on-site contract was considered the actual construction cost. As a result, the cost was significantly different from the result calculated using CSPR. On the other hand, the cost also appears to be similar to the simulation results. Lastly, the results calculated by the CSPR were higher than the simulation results. This result is because, in the case of carbon dioxide emissions calculated by simulation, the variability of the emissions is effectively reflected by capturing the work tasks in which only the equipment is operated rather than using the entire construction period. Therefore, this result shows that even though the calculated number of working days in simulation is higher, the carbon emission is lower than the CSPR result. This test case reveals that the estimation accuracy of the emissions is improved, and the method effectively reflects the prediction of duration, cost, and carbon dioxide emissions in real-world construction.
5. Conclusions
In this study, the duration, cost, and carbon dioxide emissions generated by the resources (e.g., equipment) used for PHC pile installation were estimated using a discrete event simulation. A comparison between actual construction and simulation results shows that the accuracy was 98.3% for the duration and 98.7% for the cost. On the other hand, a comparison between actual construction and CSPR shows that the accuracy was 70.8% for the duration and 59.4% for the cost. Therefore, the simulation results are more accurate in predicting the duration and cost of the PHC pile installation process. In addition, since the presented method calculates the total amount of emission by calculating only the time when the equipment is working in the simulation, it reflects reality more effectively. In addition, a stochastic analysis method was presented to estimate the eco-economic performance. This study provides the following benefits. (1) This study presented a method that simultaneously evaluates the productivity and environmental performance of pile construction, whereas, in previous studies, pile construction productivity and environmental performance evaluations were conducted individually. (2) This study presented a model for measuring the carbon dioxide emissions of the PHC pile installation at a detailed level of the construction process. This provides a basis for quantifying the productivity and environmental impact of PHC pile processes in the construction field. (3) By performing iterative simulations of the PHC pile installation, stochastic estimation of the duration, cost, and carbon dioxide emissions were enabled. This enables more accurate management of these outcomes during the planning stage of PHC pile construction.
However, this study has several limitations, described as follows. (1) The eco-economic performance of only a single method (i.e., a PHC pile) was evaluated in this study. In future studies, the modeling, simulation, analysis, and comparison of various pile methods are recommended. (2) Carbon dioxide emissions were calculated using the average fuel consumption of the equipment, assuming that all the conditions of the work tasks performed by the equipment are identical. However, all work tasks have different work intensities, and the fuel consumption of the equipment is not the same. In future studies, it is necessary to improve the accuracy of the emission estimation by classifying and calculating the fuel consumption of the resources according to the conditions of the work tasks. (3) Various factors affecting the productivity and environmental performance of pile construction, such as soil type, site weather conditions, and working conditions, need to be analyzed and applied to the simulation models.
Author Contributions
Conceptualization, C.-Y.Y. and C.-Y.P.; methodology, C.-Y.Y. and J.-Y.P.; software, J.-Y.P. and C.-Y.P.; validation, C.-Y.Y., Y.-J.P. and J.-C.L.; formal analysis, C.-Y.Y., Y.-J.P. and J.-C.L.; investigation, J.-Y.P., C.-Y.P. and J.-C.L.; resources, data curation, C.-Y.Y. and Y.-J.P.; writing—original draft preparation, C.-Y.Y.; writing—review and editing, Y.-J.P., J.-Y.P. and J.-C.L.; visualization, J.-Y.P. and C.-Y.P.; supervision, Y.-J.P. and J.-C.L.; project administration, C.-Y.Y. and Y.-J.P.; funding acquisition, Y.-J.P. All authors have read and agreed to the published version of the manuscript.
Funding
This research was supported by the Kyungpook National University Development Project Research Fund 2019.
Institutional Review Board Statement
Not applicable.
Informed Consent Statement
Not applicable.
Data Availability Statement
Not applicable.
Conflicts of Interest
The authors declare no conflict of interest.
Appendix A
The total drilling depth is 3345 m, and the total number of drilling holes is 299 in this case study. Crane (DHP-80: 50 ton), Auger (100P), Drop hammer (3 ton), Excavator (ec55c: 0.2 m3), Payloader (FR 15), Electricity generator (350 kw), Compressor (Ingersoll-Rand 825), Plant (2000 × 4800 × 3200) and Bulk silo (40 ton) were utilized.
Appendix A.1. Duration Calculation
Appendix A.2. Emission Calculation
Appendix A.3. Cost Calculation
Cost calculation is divided into six sub-categories (1) Drilling, (2) Inserting piles, (3) Hammering piles, (4) Transporting piles, (5) Grouting, and (6) Desliming. The standard unit price was referred to the IUC, and all cost unit is South Korean Won (₩).
- Drilling
- 1.1
- Machine Cost
- 1.1.1
- Crane
- 1.1.2
- Auger
- 1.1.3
- Electricity Generator
- 1.2
- Crew Cost
- Inserting Piles
- Hammering Piles
- Transporting Piles
- Grouting
- 5.1
- Pump
- 5.2
- Mixer
- 5.3
- Electricity Generator
- Desliming
- Subtotal
References
- Babu, S.S.; Kathirvel, M.; Nayak, V.N. Study and Analysis of Pile Foundation Supported on Sandwich Soil Strata under Dynamic Condition. Mater. Today Proc. 2020, 37, 861–867. [Google Scholar] [CrossRef]
- Misra, A.; Basu, D. A Sustainable Approach to Foundation Design. In Proceedings of the 13th PanAmerican Conference on Soil Mechanics and Geotechnical Engineering and 64th Canadian Geotechnical Conference, Toronto, ON, Canada, 2–6 October 2011. [Google Scholar]
- Zayed, T.M.; Halpin, D.W. Deterministic Models for Assessing Productivity and Cost of Bored Piles. Constr. Manag. Econ. 2005, 23, 531–543. [Google Scholar] [CrossRef]
- Ametepey, O.; Aigbavboa, C.; Ansah, K. Barriers to Successful Implementation of Sustainable Construction in the Ghanaian Construction Industry. Procedia Manuf. 2015, 3, 1682–1689. [Google Scholar] [CrossRef]
- Masih-Tehrani, M.; Ebrahimi-Nejad, S.; Dahmardeh, M. Combined Fuel Consumption and Emission Optimization Model for Heavy Construction Equipment. Autom. Constr. 2020, 110, 103007. [Google Scholar] [CrossRef]
- Wu, B.; Xuan, K.; Shen, X.; Zhao, Q.; Shi, Y.; Kong, L.; Hu, J.; Li, X.; Zhang, H.; Cao, X.; et al. Non-Negligible Emissions of Black Carbon from Non-Road Construction Equipment Based on Real-World Measurements in China. Sci. Total Environ. 2022, 806, 151300. [Google Scholar] [CrossRef]
- Tu, R.; Li, T.; Meng, C.; Chen, J.; Sheng, Z.; Xie, Y.; Xie, F.; Yang, F.; Chen, H.; Li, Y.; et al. Real-World Emissions of Construction Mobile Machines and Comparison to a Non-Road Emission Model. Sci. Total Environ. 2021, 771, 145365. [Google Scholar] [CrossRef]
- Lee, D.-E.; Yi, C.-Y.; Lim, T.-K.; Arditi, D. Integrated Simulation System for Construction Operation and Project Scheduling. J. Comput. Civ. Eng. 2010, 24, 557–569. [Google Scholar] [CrossRef]
- Ahn, C.; Pan, W.; Lee, S.H.; Peña-Mora, F. Enhanced Estimation of Air Emissions from Construction Operations Based on Discrete-Event Simulation. In Proceedings of the EG-ICE 2010—17th International Workshop on Intelligent Computing in Engineering, Leuven, Belgium, 30 June–3 July 2019; Volume 30. [Google Scholar]
- Ahn, C.; Xie, H.; Lee, S.H.; Abourizk, S.; Peña-Mora, F. Carbon Footprints Analysis for Tunnel Construction Processes in the Preplanning Phase Using Collaborative Simulation. In Proceedings of the Construction Research Congress 2010: Innovation for Reshaping Construction Practice—Proceedings of the 2010 Construction Research Congress, Banff, AB, Canada, 8–10 May 2010; pp. 1538–1546. [Google Scholar]
- González, V.; Echaveguren, T. Exploring the Environmental Modeling of Road Construction Operations Using Discrete-Event Simulation. Autom. Constr. 2012, 24, 100–110. [Google Scholar] [CrossRef]
- Yi, C.Y.; Gwak, H.S.; Kim, B.S.; Lee, D.E. Stochastic Multi-Variate Performance Trade-off Method for Technical Tender Evaluation. KSCE J. Civ. Eng. 2018, 22, 4240–4253. [Google Scholar] [CrossRef]
- Park, Y.J.; Yi, C.Y. Resource-Based Quality Performance Estimation Method for Construction Operations. Appl. Sci. 2021, 11, 4122. [Google Scholar] [CrossRef]
- Kumara, H.P.S.G.S.; Zainudeen, N.; Jayasanka, T.A.D.K.; Waidyasekara, K.G.A.S. Barriers in Implementing Sustainable Piling Construction Practices in Sri Lanka. In Proceedings of the 9th World Construction Symposium, Moratuwa, Sri Lanka, 9–10 July 2021; pp. 147–159. [Google Scholar] [CrossRef]
- Shan, M.; Hwang, B.G.; Zhu, L. A Global Review of Sustainable Construction Project Financing: Policies, Practices, and Research Efforts. Sustainability 2017, 9, 2347. [Google Scholar] [CrossRef]
- Abhijit, G.; Samriddhi, S. Site Investigation Techniques for Ground Improvement. Int. J. Res. Appl. Sci. Eng. Technol. 2017, 5, 35–39. [Google Scholar]
- Ojo, E.M.; Mbohwa, C.; Akinlabi, E.T. Greening the Construction Industry. In Proceedings of the Proceedings of the 2015 International Conference on Operations Excellence and Service Engineering, Orlando, Florida, USA, 10–11 September 2015; pp. 581–591. [Google Scholar]
- Salimi, S.; Mawlana, M.; Hammad, A. Performance Analysis of Simulation-Based Optimization of Construction Projects Using High Performance Computing. Autom. Constr. 2018, 87, 158–172. [Google Scholar] [CrossRef]
- Pujadas-Gispert, E.; Sanjuan-Delmás, D.; de la Fuente, A.; Moonen, S.P.G.; Josa, A. Environmental Analysis of Concrete Deep Foundations: Influence of Prefabrication, Concrete Strength, and Design Codes. J. Clean. Prod. 2020, 244, 118751. [Google Scholar] [CrossRef]
- Pujadas-Gispert, E.; Sanjuan-Delmás, D.; Josa, A. Environmental Analysis of Building Shallow Foundations: The Influence of Prefabrication, Typology, and Structural Design Codes. J. Clean. Prod. 2018, 186, 407–417. [Google Scholar] [CrossRef]
- Saravanan, V. Cost Effective and Sustainable Practices for Piling Construction in the UAE Thesis. Master’s Thesis, Heriot Watt University, Edinburgh, UK, 2011; pp. 1–97. [Google Scholar]
- Luo, W.; Sandanayake, M.; Zhang, G. Direct and Indirect Carbon Emissions in Foundation Construction—Two Case Studies of Driven Precast and Cast-in-Situ Piles. J. Clean. Prod. 2019, 211, 1517–1526. [Google Scholar] [CrossRef]
- Yeung, A.T. Innovative Installation Techniques for PHC Piles. In Proceedings of the ICE HKA Annual Conference 2015 Thinking out of the Box in Infrastructure Development Andretrofitting, Hong Kong, China, 24 April 2015; Volume 75, pp. 279–286. [Google Scholar]
- Kaplan, H.; Elburg, A.; Tommelein, I.D. Analysis of Variability in Precasting and Installation of Pile Foundations. In Proceedings of the Construction Research Congress 2005: Broadening Perspectives—Proceedings of the Congress, San Diego, CA, USA, 5–7 April 2005; pp. 23–32. [Google Scholar]
- Zayed, T.M. Productivity and Cost Assessment for Continuous Flight Auger Piles. J. Constr. Eng. Manag. 2005, 131, 677–688. [Google Scholar] [CrossRef]
- Zayed, T.M.; Halpin, D.W. Quantitative Assessment for Piles Productivity Factors. J. Constr. Eng. Manag. 2004, 130, 405–414. [Google Scholar] [CrossRef]
- Zayed, T.M.; Halpin, D.W. Simulation of Bored Pile Construction. In Proceedings of the Winter Simulation Conference Proceedings, Orlando Florida, USA, 14–18 December 2000; IEEE: Piscataway, NJ, USA, 2001; Volume 2, pp. 1495–1503. [Google Scholar]
- Zayed, T.M.; Halpin, D.W. Simulation as a Tool for Pile Productivity Assessment. J. Constr. Eng. Manag. 2004, 130, 394–404. [Google Scholar] [CrossRef]
- Zayed, T. Stochastic Productivity Assessment of Continuous Flight Auger Piles. Archit. Sci. Rev. 2009, 52, 17–27. [Google Scholar] [CrossRef]
- Zayed, T.M.; Halpin, D.W. Concrete Bored Piles Construction Productivity Assessment Using Regression Analysis. In Proceedings of the Annual Conference—Canadian Society for Civil Engineering, Montreal, QC, Canada, 5–8 June 2002; Volume 2002, pp. 415–423. [Google Scholar]
- Zayed, T.M.; Halpin, D.W. Productivity and Cost Regression Models for Pile Construction. J. Constr. Eng. Manag. 2005, 131, 779–789. [Google Scholar] [CrossRef]
- Zayed, T.M.; Halpin, D.W. Pile Construction Productivity Assessment. J. Constr. Eng. Manag. 2005, 131, 705–714. [Google Scholar] [CrossRef]
- Zayed, T.M.; Halpin, D.W. Process versus Data Oriented Techniques in Pile Construction Productivity Assessment. J. Constr. Eng. Manag. 2004, 130, 490–499. [Google Scholar] [CrossRef]
- Misra, A. A Multicriteria Based Quantitative Framework for Assessing Sustainability of Pile Foundations. Master’s Thesis, University of Connecticut, Storrs, CT, USA, 2010; p. 124. [Google Scholar]
- Misra, A.; Basu, D. A Quantitative Sustainability Indicator System for Pile Foundations. In GeoCongress 2012: State of the Art and Practice in Geotechnical Engineering; ASCE: Reston, VA, USA, 2012; pp. 4252–4261. ISBN 9780784412121. [Google Scholar]
- Halpin, D.; Riggs, L. PLanning and Analysis of Construction Operations.Pdf; John Wiley & Sons: Hoboken, NJ, USA, 1994; ISBN 047155510X. [Google Scholar]
- Hu, J.; Sun, C. 3D Geological Modeling Based on Boreholes Data and Application in Underground Engineering. In Proceedings of the 3rd International Symposium on Information Science and Engineering, ISISE. Shanghai, China, 24–26 December 2010; IEEE: Piscataway, NJ, USA, 2010; pp. 409–411. [Google Scholar]
- Zhang, X.; Zhang, J.; Tian, Y.; Li, Z.; Zhang, Y.; Xu, L.; Wang, S. Urban Geological 3d Modeling Based on Papery Borehole Log. ISPRS Int. J. Geo-Inf. 2020, 9, 389. [Google Scholar] [CrossRef]
- Zang, F. Application of 3D Geological Modeling in Geological Exploration. In Frontier Computing; Lecture Notes in Electrical Engineering; IEEE: Piscataway, NJ, USA, 2022; Volume 827, pp. 1021–1025. [Google Scholar]
- Penman, J.; Gytarsky, M.; Hiraishi, T.; Irving, W.; Krug, T. 2006 IPCC—Guidelines for National Greenhouse Gas Inventories. Directrices para los Inventar. Nac. GEI 2006, 2, 12. [Google Scholar]
Figure 1.
System flowchart.
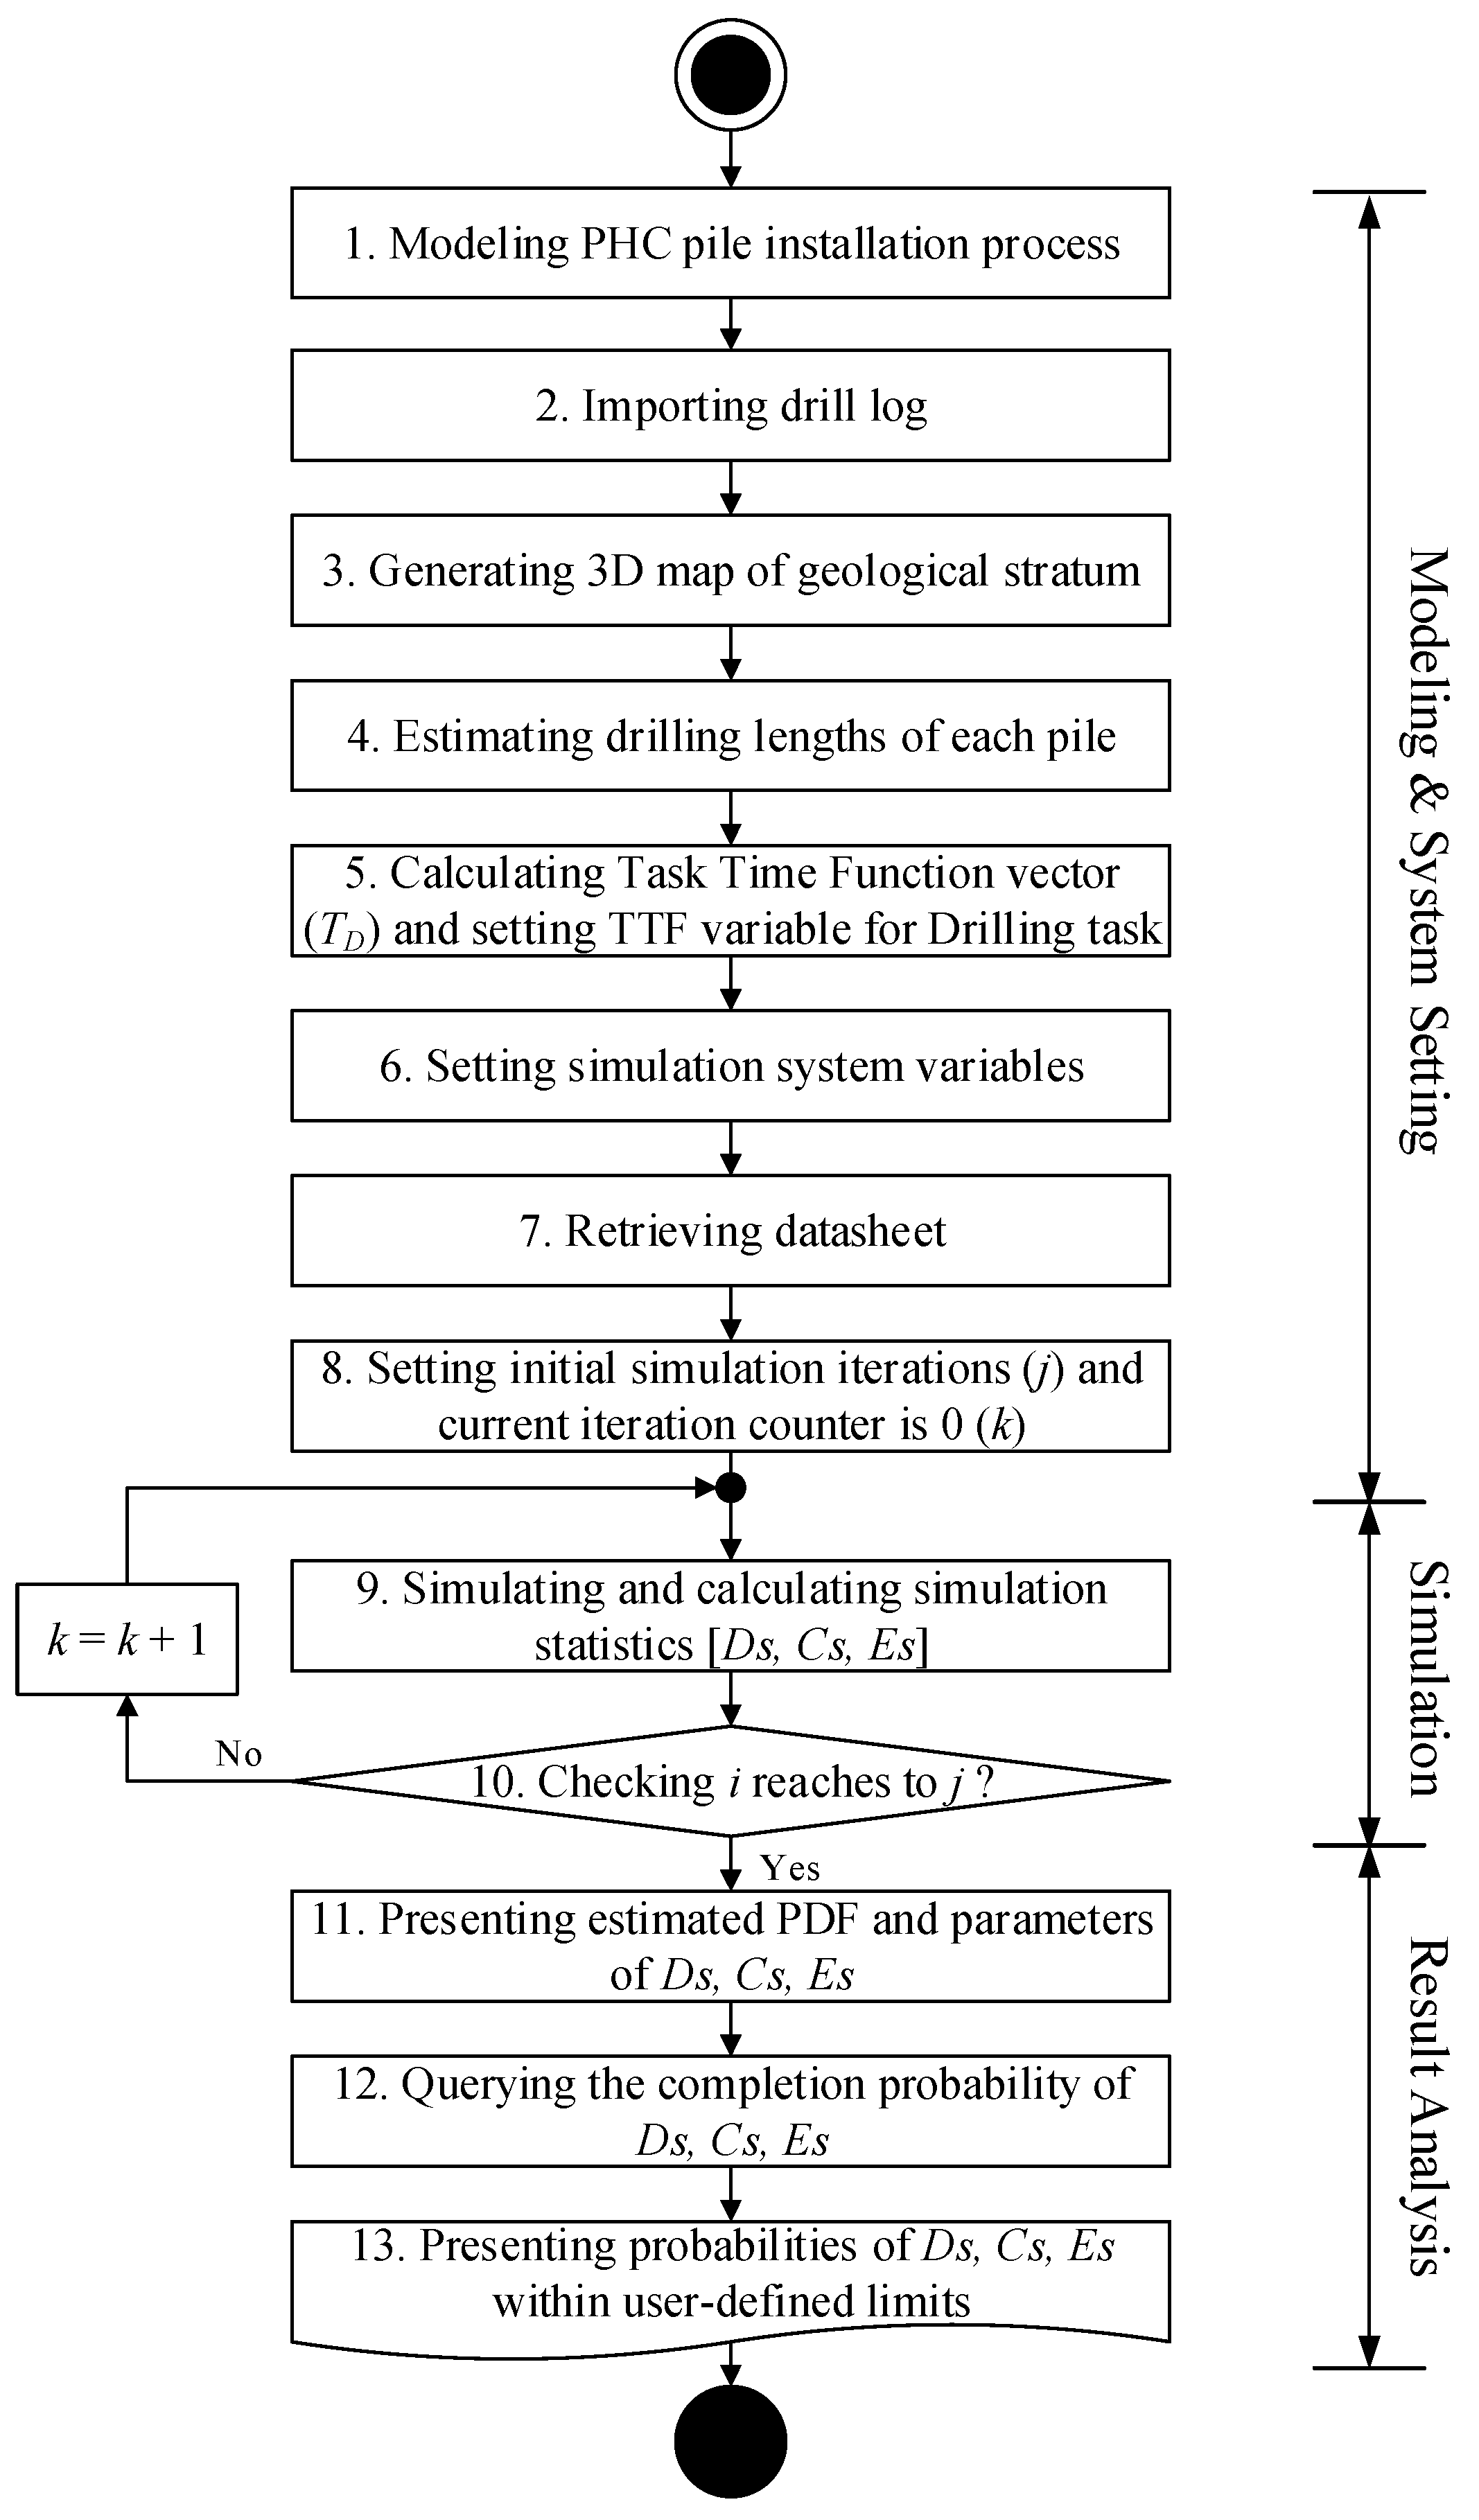
Figure 2.
PHC pile installation process simulation model.

Figure 3.
Section guide of the construction site and example of a drill log.
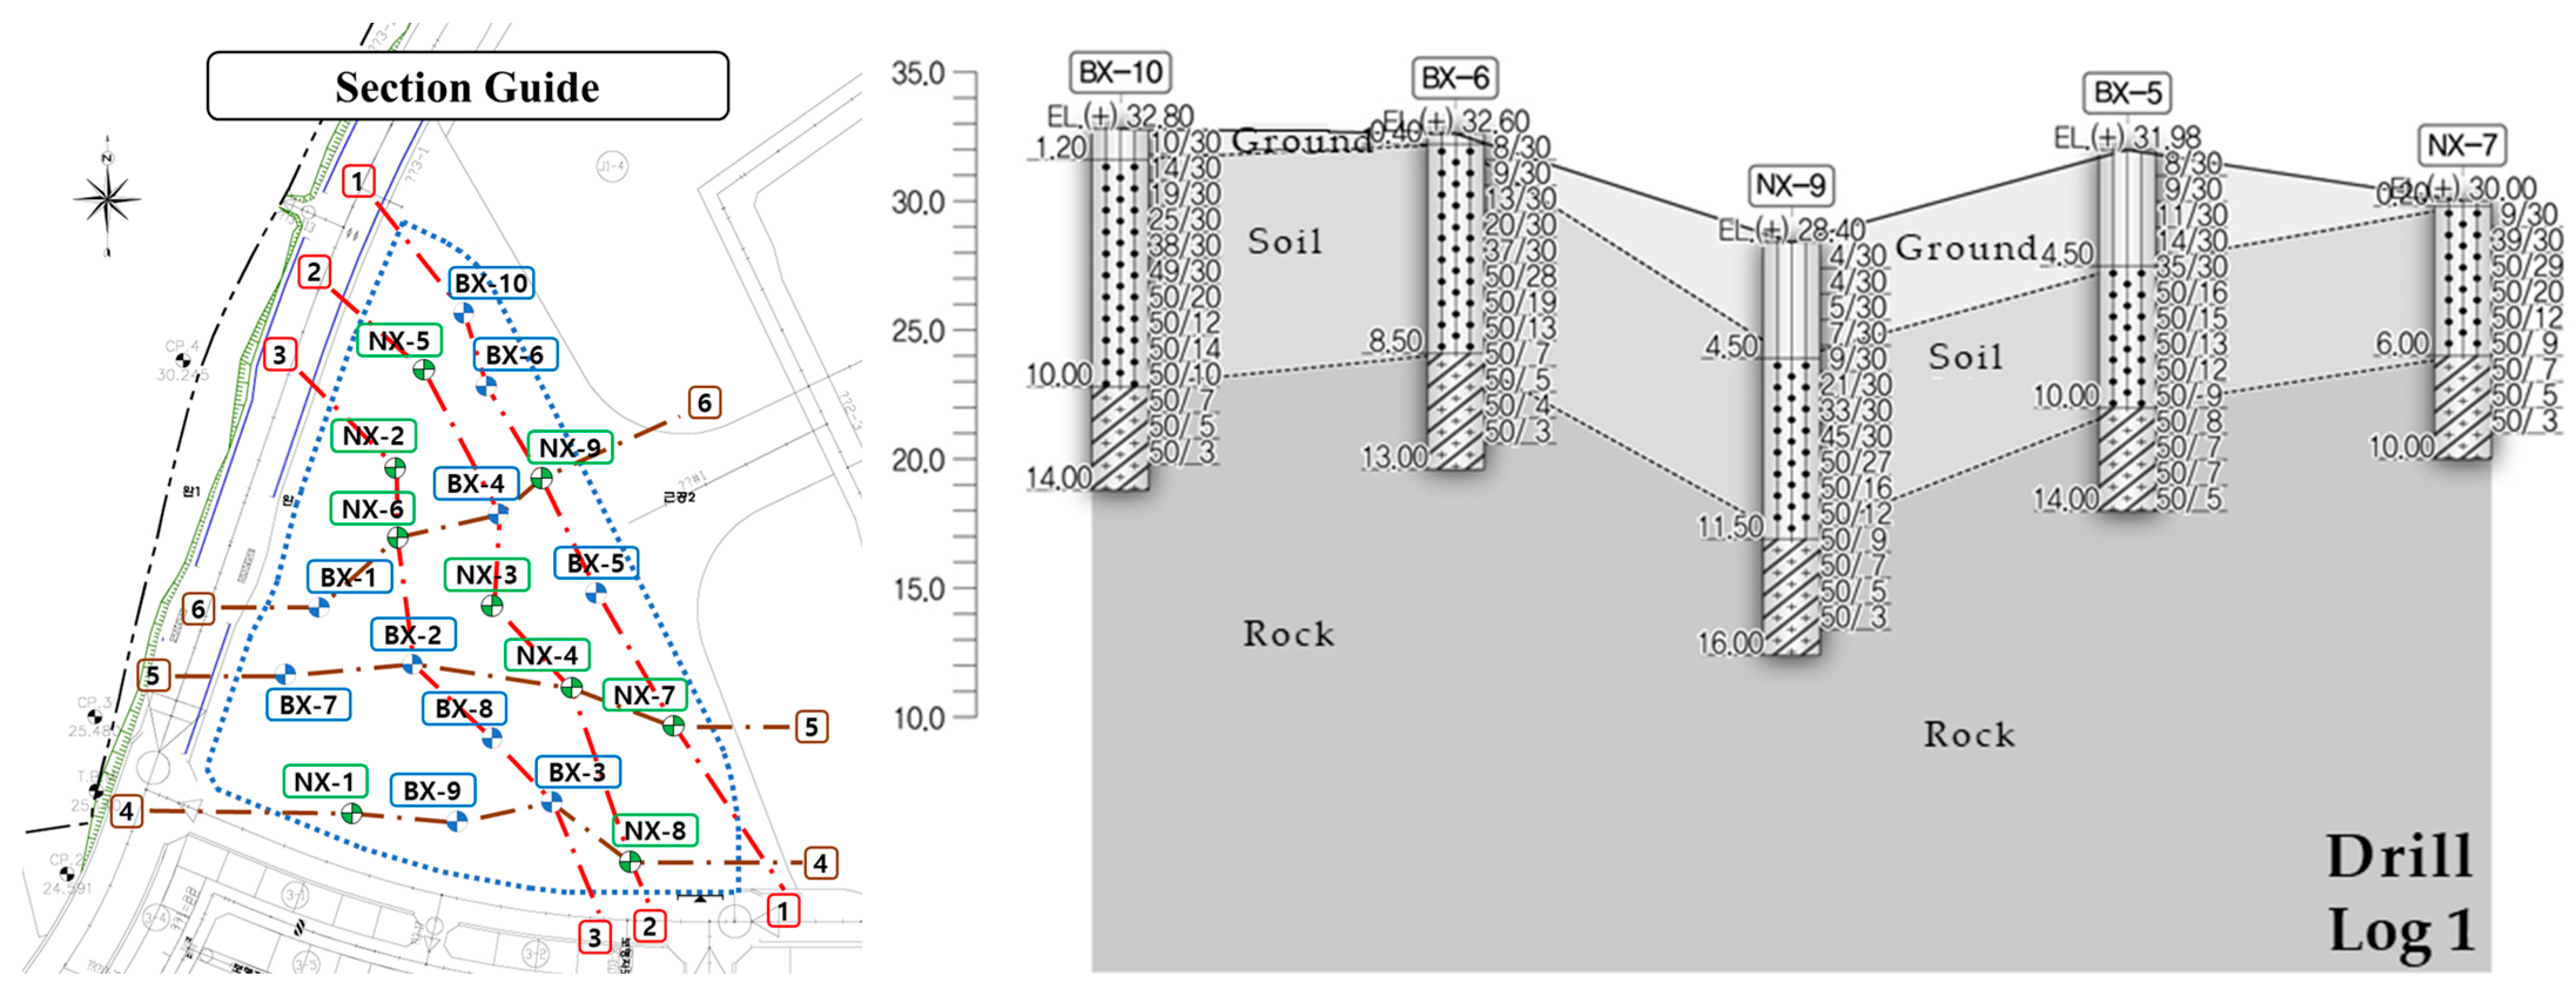
Figure 4.
PHC pile location.
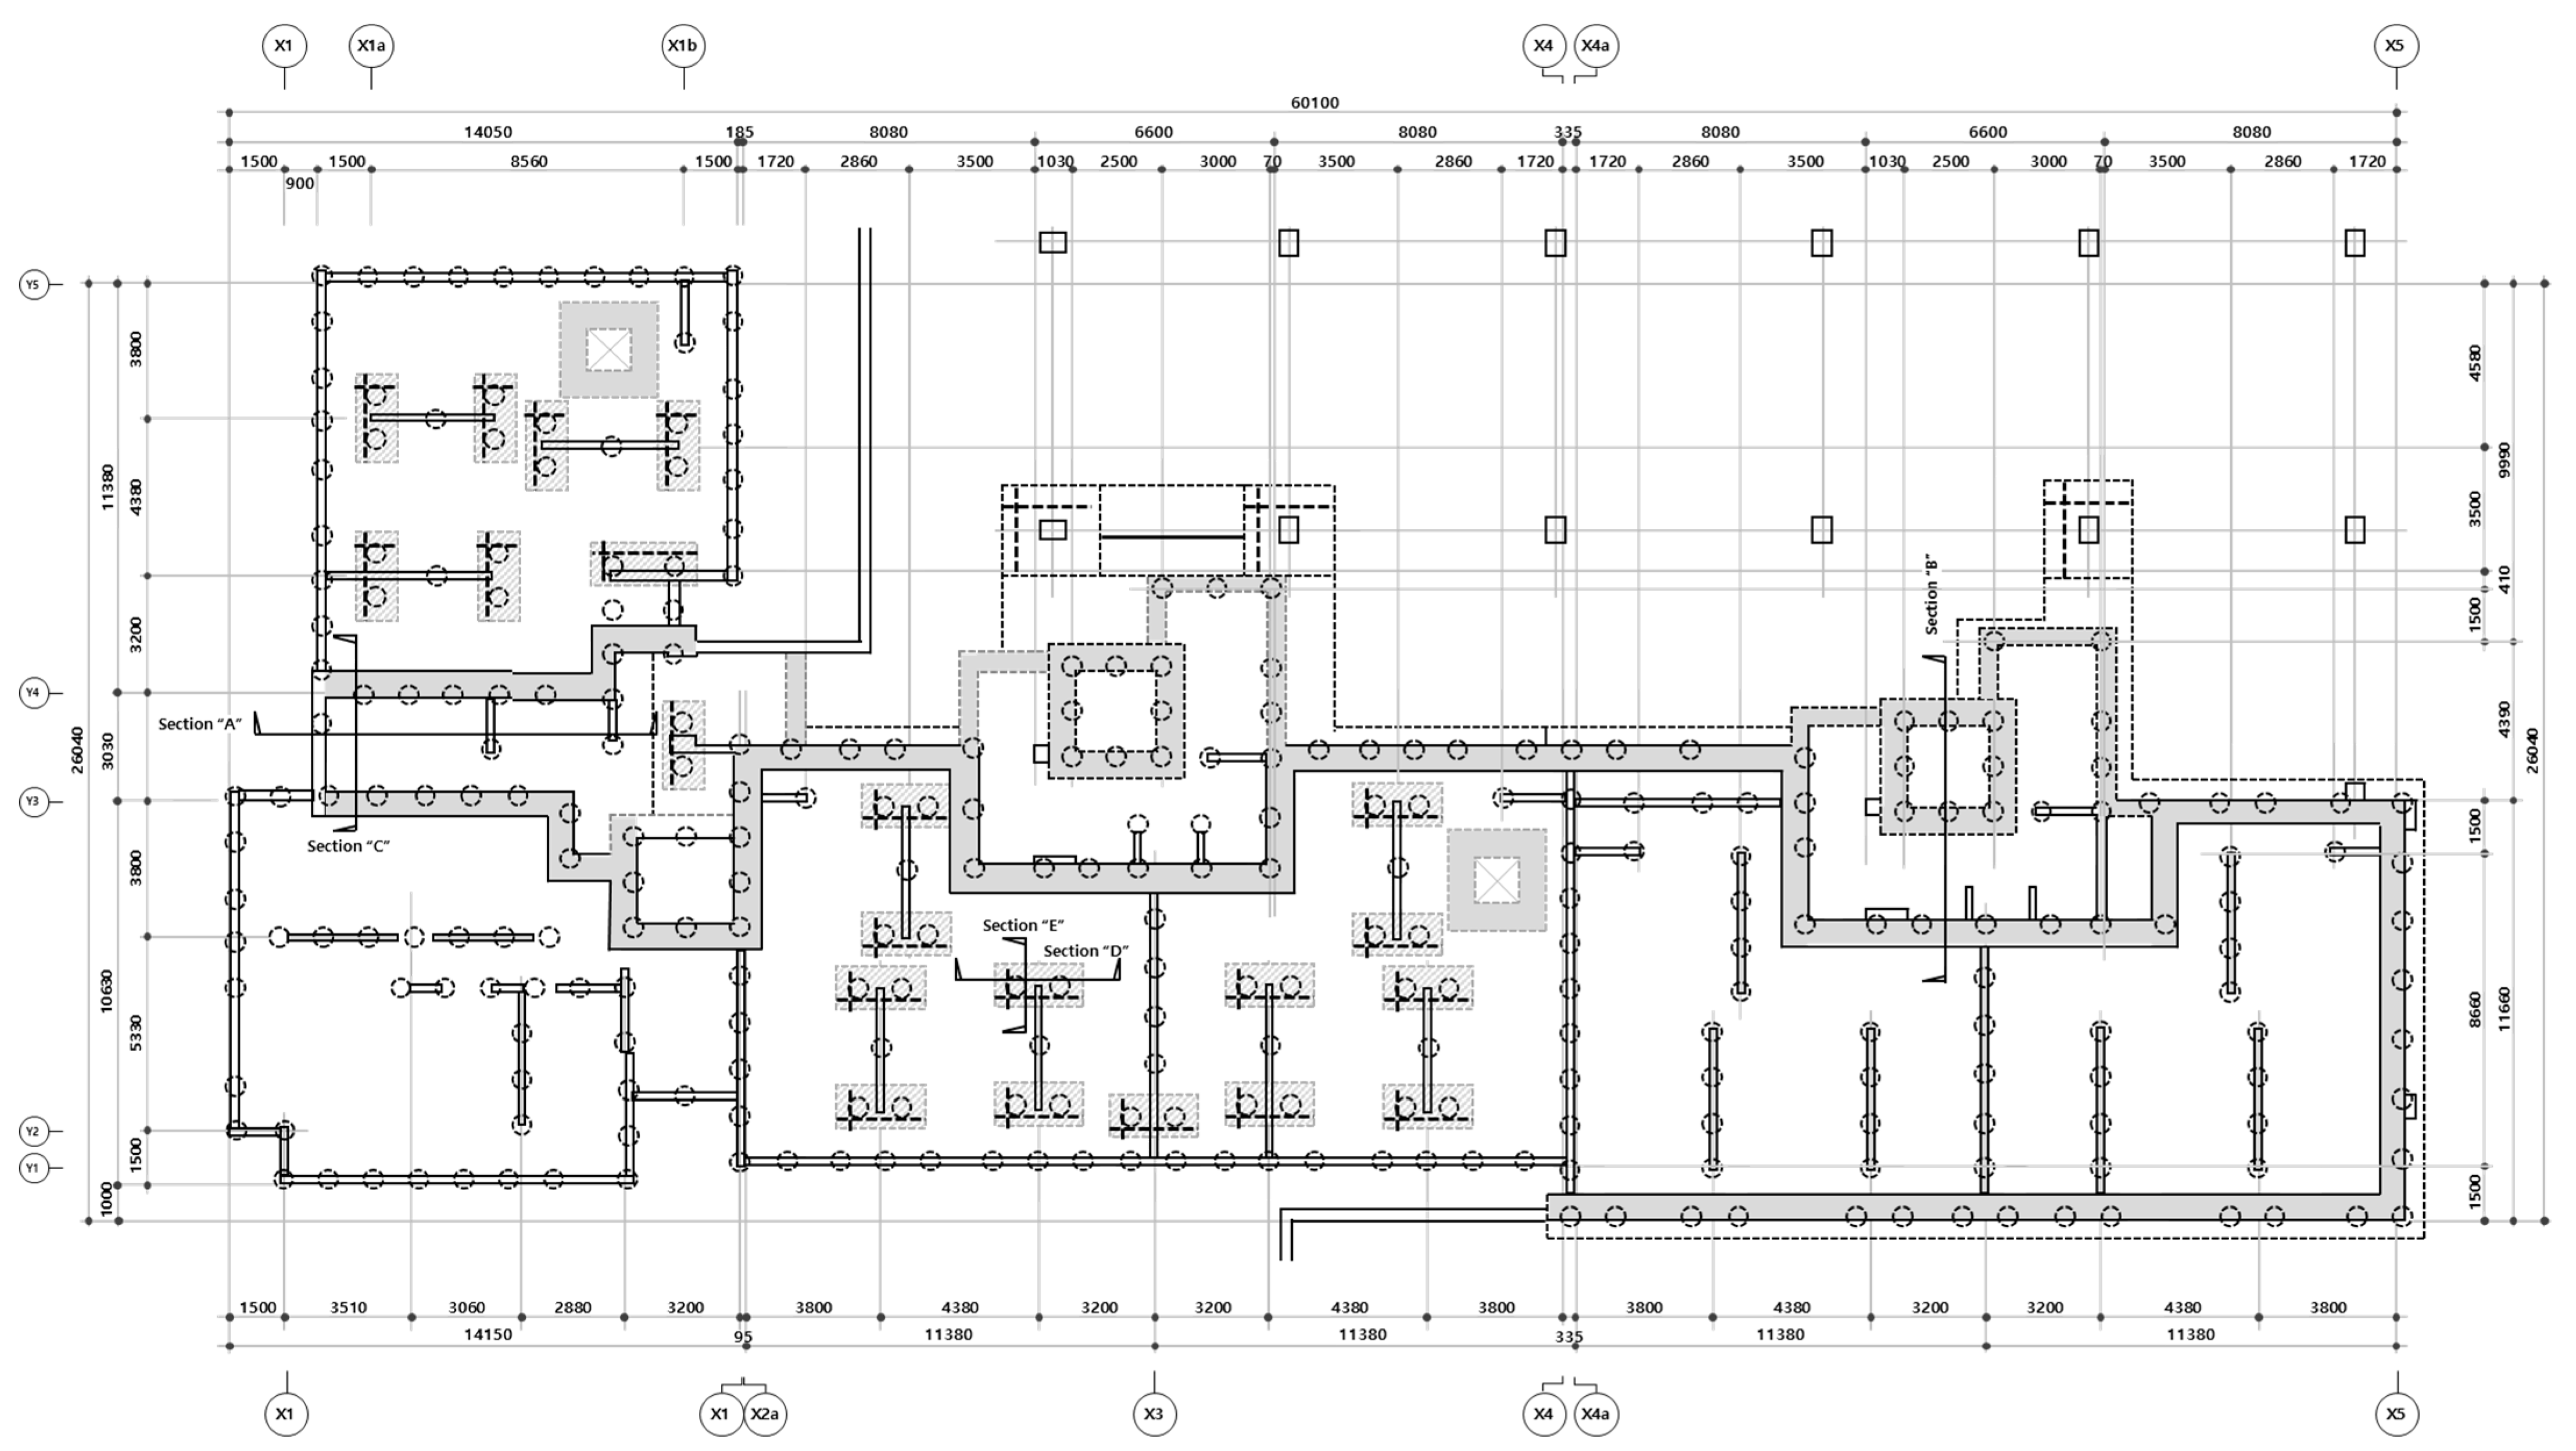
Figure 5.
Simulation results.

Table 1.
Attributes of deployed equipment.
| Type | Model | Fuel (L/h) | Cost (KRW */h) |
|---|---|---|---|
| Crawler crane | Pile driver (DHP-80), auger (100 P), drop hammer (3 ton) | 28 | 341,588 |
| Excavator | 02 (ec55c) | 8 | 43,345 |
| Payloader | FR 15 | 11 | 41,731 |
| Pump | Electricity generator (350 kw) and compressor (Ingersoll-Rand 825) | 10 | 29,133 |
| Mixer | Plant (2000 × 4800 × 3200) and bulk silo (40 ton) | 15 | 30,000 |
* South Korean Won (₩).
Table 2.
Input variables and attributes for modeling components.
| Components | Predecessor | Successor | Time Delay Function * or Entity Initialization | Involved Resource(s) | ||
|---|---|---|---|---|---|---|
| ID | Name | Type | ||||
| 1 | Crawler crane | Cyclic resource queue | 31 | 3 | 1 | Crawler crane |
| 2 | Crew | Cyclic resource queue | 29, 22 | 3, 29 | 1 | Crew |
| 3 | Axis adjustment | Combi | 1, 2 | 14, 20 | Normal (0.88, 0.18) | Crawler crane Crew |
| 4 | PHC pile | Noncyclic resource queue | - | 6 | 299 | PHC pile |
| 5 | Payloader | Cyclic resource queue | 6 | 6 | 1 | Payloader |
| 6 | Moving pile | Combi | 4, 5 | 5, 21 | Normal (1.06, 0.05) | Payloader PHC pile |
| 7 | Cement | Noncyclic resource queue | - | 10 | 299 | Cement |
| 8 | Water | Noncyclic resource queue | - | 10 | 299 | Water |
| 9 | Mixer | Cyclic resource queue | 10 | 10 | 1 | Mixer |
| 10 | Mixing | Combi | 7, 8, 9 | 9, 11, 12 | Normal (4.18, 0.48) | Mixer Cement Water |
| 11 | Grouting ready | Idle queue | 10 | 16 | - | Grout |
| 12 | Additional grouting ready | Idle queue | 10 | 27 | - | Add. Grout |
| 13 | Pump | Cyclic resource queue | 16, 27 | 16, 27 | 1 | Pump |
| 14 | Drilling | Normal | 3 | 15 | According to ground Level and types | Crawler crane |
| 15 | Ready for grouting | Idle queue | 14 | 16 | - | Crawler crane |
| 16 | Removing auger and grouting | Combi | 11, 13, 15 | 13, 24 | Normal (1.11, 0.15) | Crawler crane Pump Grout |
| 17 | Ready for desliming | Idle queue | 29 | 19 | - | Soil |
| 18 | Excavator | Cyclic resource queue | 30 | 19 | 1 | Excavator |
| 19 | Desliming | Combi | 17, 18 | 30 | Normal (11.5, 1.23) | Excavator Soil |
| 20 | Ready for pile Connection | Idle queue | 3 | 22 | - | Crew Crawler crane PHC pile |
| 21 | Pile available | Idle queue | 6 | 22 | - | PHC pile |
| 22 | Pile connection | Combi | 20, 21 | 2, 23 | Normal (0.52, 0.01) | Crew Crawler crane PHC pile |
| 23 | Pile ready | Idle queue | 22 | 25 | - | Crawler crane PHC pile |
| 24 | Crane ready | Idle queue | 16 | 25 | - | Crawler crane |
| 25 | Pile erection and Placement | Combi | 23, 24 | 26 | Normal (1.04, 0.10) | Crawler crane |
| PHC pile | ||||||
| 26 | Ready for Additional grouting | Idle queue | 25 | 27 | - | Crawler crane |
| 27 | Removing casing & Additional grouting | Combi | 12, 13, 26 | 13, 28 | Normal (1.63, 0.22) | Crawler crane Pump Add. Grout |
| 28 | Ready for Rebound check | Idle queue | 27 | 29 | - | Crawler crane |
| 29 | Rebound check | Combi | 2 | 28 | Normal (1.36, 0.12) | Crawler crane Crew |
| 30 | Counter | Counter | 19 | 18 | - | - |
| 31 | Move to another axis | Normal | 29 | 1 | Normal (3.62, 0.95) | Crawler crane |
* The Time delay function in this study used Normal distribution, and the parameter values of ‘mu’ and ‘sigma’ are specified in the parenthesis.
Table 3.
Drilling task time by ground attributes.
| Pile Number | Ground (meter) | Soil (meter) | Drilling (meter) | Drilling Task Time (minutes) |
|---|---|---|---|---|
| 1 | 0.6522 | 11.0952 | 11.7475 | 11.13 |
| 2 | 0.6559 | 10.9824 | 11.6383 | 11.03 |
| 3 | 0.6567 | 10.8516 | 11.5083 | 10.90 |
| 4 | 0.6575 | 10.7303 | 11.3877 | 10.79 |
| 5 | 0.6582 | 10.6080 | 11.2662 | 10.67 |
| … | … | … | … | … |
| 295 | 1.8542 | 8.5922 | 10.4464 | 9.62 |
| 296 | 1.9883 | 8.5647 | 10.5530 | 9.69 |
| 297 | 2.1272 | 8.5362 | 10.6634 | 9.77 |
| 298 | 2.2189 | 8.5063 | 10.7252 | 9.81 |
| 299 | 2.2613 | 8.5087 | 10.7700 | 9.84 |
Table 4.
Simulation results.
| Performance | PDF & Parameters | Minimum | Maximum | Limitation | Probability |
|---|---|---|---|---|---|
| Duration (min) | Normal (mu = 5653.37 sigma = 29.26) | 5593 | 5724 | 5700 | 95.91% |
| Cost (KRW) | Normal (mu = 45,792,009.78 sigma = 206,076.23) | 45,286,330 | 46,348,105 | 46,000,000 | 84.36% |
| Emission (kgCO2) | Gamma (a = 58,984.36 b = 0.21) | 12,107 | 12,366 | 12,200 | 30.97% |
Table 5.
Simulation result comparison.
| Category | Duration (day) | Cost (KRW) | Emissions (ton) |
|---|---|---|---|
| Simulation (average) | 11.8 * | 45,792,009 | 12.23 ** |
| CSPR and IUC | 8.5 | 27,577,938 | 13.35 *** |
| Contract | 15 | 46,412,076 | - |
| Site results | 17 (12) | 46,412,076 | - |
* Working duration is calculated using the simulation result of average duration as 5655.7 min in Figure 5. The working day is calculated based on the eight working hours per day, ** Simulation result of average emission is replaced by tonnage, *** The total emission is calculated by Equation (3) using the working hour calculated by the CSPR and IUC and the equipment’s average fuel consumption (L/h) shown in Table 1.
Publisher’s Note: MDPI stays neutral with regard to jurisdictional claims in published maps and institutional affiliations. |
© 2022 by the authors. Licensee MDPI, Basel, Switzerland. This article is an open access article distributed under the terms and conditions of the Creative Commons Attribution (CC BY) license (https://creativecommons.org/licenses/by/4.0/).
Share and Cite
MDPI and ACS Style
Yi, C.-Y.; Park, J.-Y.; Park, C.-Y.; Lee, J.-C.; Park, Y.-J. Eco-Economic Performance Estimation Method for Pretensioned Spun High-Strength Concrete Pile Installation. Sustainability 2022, 14, 11990. https://doi.org/10.3390/su141911990
AMA Style
Yi C-Y, Park J-Y, Park C-Y, Lee J-C, Park Y-J. Eco-Economic Performance Estimation Method for Pretensioned Spun High-Strength Concrete Pile Installation. Sustainability. 2022; 14(19):11990. https://doi.org/10.3390/su141911990
Chicago/Turabian StyleYi, Chang-Yong, Jin-Young Park, Chan-Young Park, Jun-Cheol Lee, and Young-Jun Park. 2022. "Eco-Economic Performance Estimation Method for Pretensioned Spun High-Strength Concrete Pile Installation" Sustainability 14, no. 19: 11990. https://doi.org/10.3390/su141911990
Note that from the first issue of 2016, this journal uses article numbers instead of page numbers. See further details here.