Article

Characterization and Assessment of Organic Pollution at a Fumaric Acid Chemical Brownfield Site in Northwestern China

1
Technology Innovation Center for Land Engineering and Human Settlements, Shaanxi Land Engineering Construction Group Co., Ltd. and Xi’an Jiaotong University, Xi’an 710049, China
2
School of Human Settlements and Civil Engineering, Xi’an Jiaotong University, 28 Xianning West Road, Xi’an 710049, China
*
Author to whom correspondence should be addressed.
Sustainability 2022, 14(19), 12476; https://doi.org/10.3390/su141912476
Submission received: 27 August 2022 / Revised: 23 September 2022 / Accepted: 24 September 2022 / Published: 30 September 2022
(This article belongs to the Special Issue Advances in Management and Remediation of Contaminated Soils)

Abstract

:
Large-scale fumaric acid chemical brownfield sites have posed a significant obstacle to environmental safety, public safety, and the redevelopment of brownfield sites. A comprehensive study was conducted to determine the main pollution indicators, soil pollution characteristics, and the multiple potential risks to the environment and the ecosystem of a fumaric acid brownfield site in northwestern China. The results showed that 1,2,3-trichloropropane(1,2,3-TCP) was the primary pollutant at the fumaric acid brownfield site. The atmospheric volatile organic compounds (VOCs) in this brownfield site did not exceed the Chinese standard limits. The soil contamination was more severe within the site, with a total of about 30 VOCs detected, including the uncommon brominated pollutants. The level of longitudinal soil contamination decreased with increasing soil depth. The distillation area was more contaminated with a maximum exceedance multiple of 11,291.8. The longitudinal contamination depths in the distillation and reactor zones were 10.0 m and 4.0 m, respectively. Soil texture and production processes are considered to be one of the influencing factors for the depth of vertical soil contamination. Our findings heighten the awareness of brownfield site soil contamination and provide a reference for contamination controls and the comprehensive management of fumaric acid brownfield sites.

1. Introduction

Brownfield sites refer to ‘previously developed land’ as unused or exploitable land, including vacant, abandoned lands and currently used lands with the potential for redevelopment [1,2,3]. The redevelopment of brownfield sites has been focused on by researchers due to rapid urbanization and the shortage of land resources [3,4,5]. During the redevelopment phase, development patterns and economic benefits have been a priority for developers. However, unfortunately, environmental risks have been overlooked [6,7]. The brownfield sites contaminated with hazardous materials have been a common and urgent problem across the world. In practical engineering applications, a series of public health events and environmental health risks can arise due to unclear pollution levels [8]. Therefore, many researchers appealed that areas in the vicinity of industrial brownfield sites were heavily contaminated and soil contamination control and risk assessment need to be focused on in the redevelopment of brownfield sites.
There are a large number of brownfield sites and potential brownfield sites in China. According to World Bank research, there were at least 5000 brownfield sites in China, with the largest proportion of chemical brownfield sites [9]. The investigation and assessment of brownfield contamination have become a major concern for the government and researchers [10]. However, in the field of brownfield research, oil brownfield sites and mining brownfield sites have been the majority, but chemical brownfield sites were the minority [11]. The research on chemical brownfield has two sides: firstly, pollutants in the chemical industry are complex and toxic, mostly Volatile Organic Compounds (VOCs) and Semi-Volatile Organic Compounds (SVOCs). Next, a proven production process is used by many chemical companies, and the pollutants produced by these companies are similar. Therefore, the organic pollution assessment results of chemical enterprises can provide a reference for subsequent related studies [12]. Based on the above, there is an urgent need to conduct industry-specific surveys and assessments of chemical brownfield pollution.
Due to their unique physicochemical properties, fumaric acid has been extensively used in many industrial and commercial applications, including chemical, biological, and food. Benzene is often used as a starting material for fumaric acid [13,14]. The steps in producing fumaric acid include oxidation, absorption, isomerization, crystallization, and drying. Many toxic pollutants are produced during the production phase, contributing to environmental pollution and health risks [15]. As early as 30 years ago, large-scale fumaric acid production was already underway in China [16]. The number of fumaric acid companies in China far exceeds that of any other country. As a result, a large number of fumaric acid brownfield sites have been redeveloped. However, the contamination characteristics of fumaric acid brownfield sites have received less attention from researchers. Due to the improvement of the environmental system and the increasing awareness of the population, the identification of pollution risks and the assessment of pollution characteristics during the redevelopment of brownfield sites has become a necessary process in engineering practice [17]. However, the importance of environmental risk assessment in fumaric acid brownfield sites has received less attention from researchers. The environmental assessment of fumaric acid brownfield sites will be more efficient by identifying the main organic pollutants [18]. Furthermore, the work described above can also serve as a reference for the subsequent redevelopment of similar fumaric acid brownfield sites and further improve the brownfield redevelopment process [17]. Hence, assessing the major pollutants and pollution characteristics of fumaric acid brownfield sites is of vital importance.
This study focused on the contamination characteristics and environmental risks of fumaric acid brownfield sites. This study focused on the contamination characteristics and environmental risks assessment of fumaric acid brownfield sites. We monitored the site for atmospheric and soil VOCs, specified primary organic pollutants on site, analyzed the characteristics of organic pollutants in the soil, and conducted an environmental and ecological risk assessment of the brownfield site. This study can provide technical support for analyzing, evaluating, and redeveloping fumaric acid brownfield sites. This study can provide technical support for analyzing, evaluating, and redeveloping fumaric acid brownfield sites.

2. Materials and Methods

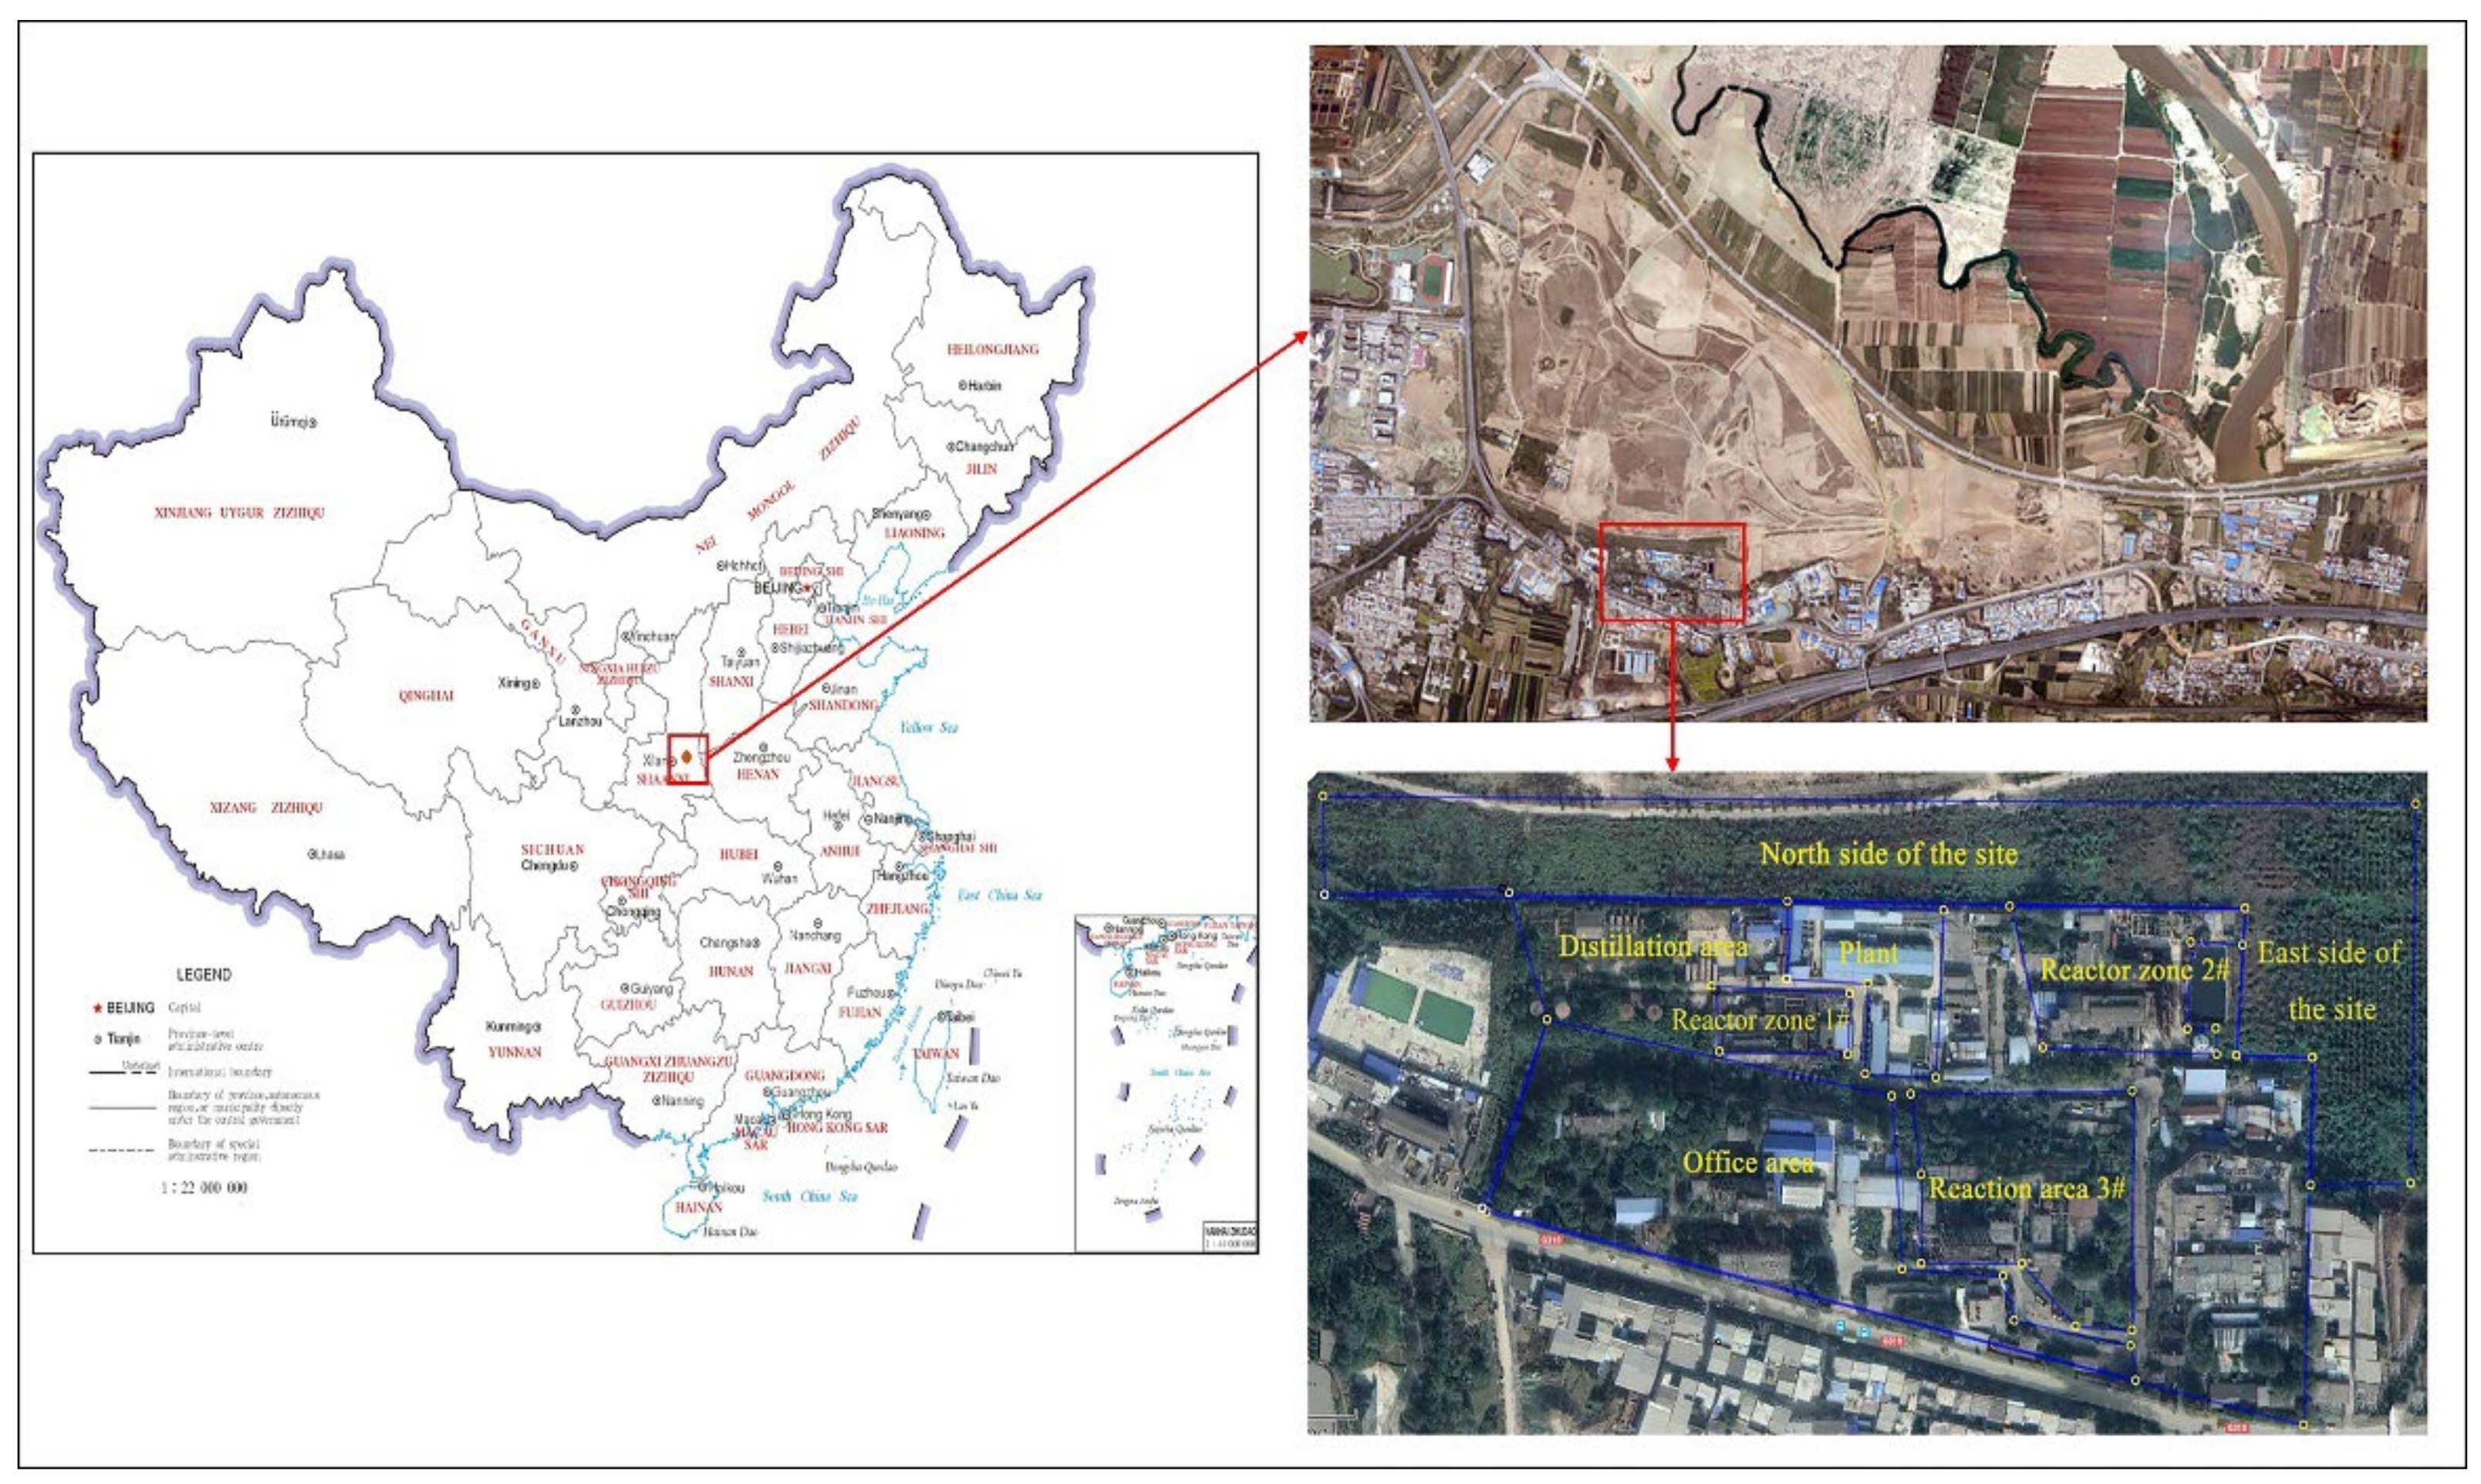
2.1. Overview of the Study Area

The study area is located in the eastern part of the Guanzhong Plain. It has a warm temperate, semi-humid, and semi-arid monsoon climate. The average annual rainfall is 600 mm, with more rainfall in the summer and autumn. The average annual temperature is 12–14 °C. The average annual sunshine is 2200–2500 h. The geotechnical characteristics of this area are medium-fine sand and gravelly medium-coarse sand interspersed with powdery clay layers, with groundwater distribution in the range of 3.0–6.0 m below the surface and the thickness of the aquifer between 2.2 and 3.0 m. The lithology of the project area is light-yellow and brownish-yellow sandy clay. The stratigraphy within the exploration depth of the site consists of a layer of plain filling (Q4ml), layer of silt (Q4al + pl), layer of fine sand (Q4al + pl), layer of silty clay (Q3al + pl), and layer of medium sand (Q3al + pl) from top to bottom. The details are shown in Table 1.
The main product of this chemical plant is food-grade fumaric acid (antisuccinic acid). The chemical plant was established in 2003 and shut down in 2018, with an annual production capacity of around 10,000 tons of fumaric acid. The steps of production are as follows: first, benzene is oxidized with excess air in a fluidized bed or fixed bed reactor to produce maleic anhydride; then, maleic anhydride is absorbed into maleic acid by the circulating acid, which is isomerized under the action of thiourea catalyst, filtered, washed, and dried to obtain fumaric acid. The fumaric acid brownfield is divided into functional areas: the distillation area, reactor area, office area, plant, and dormitory. The exact location of the study area was shown in Figure 1.

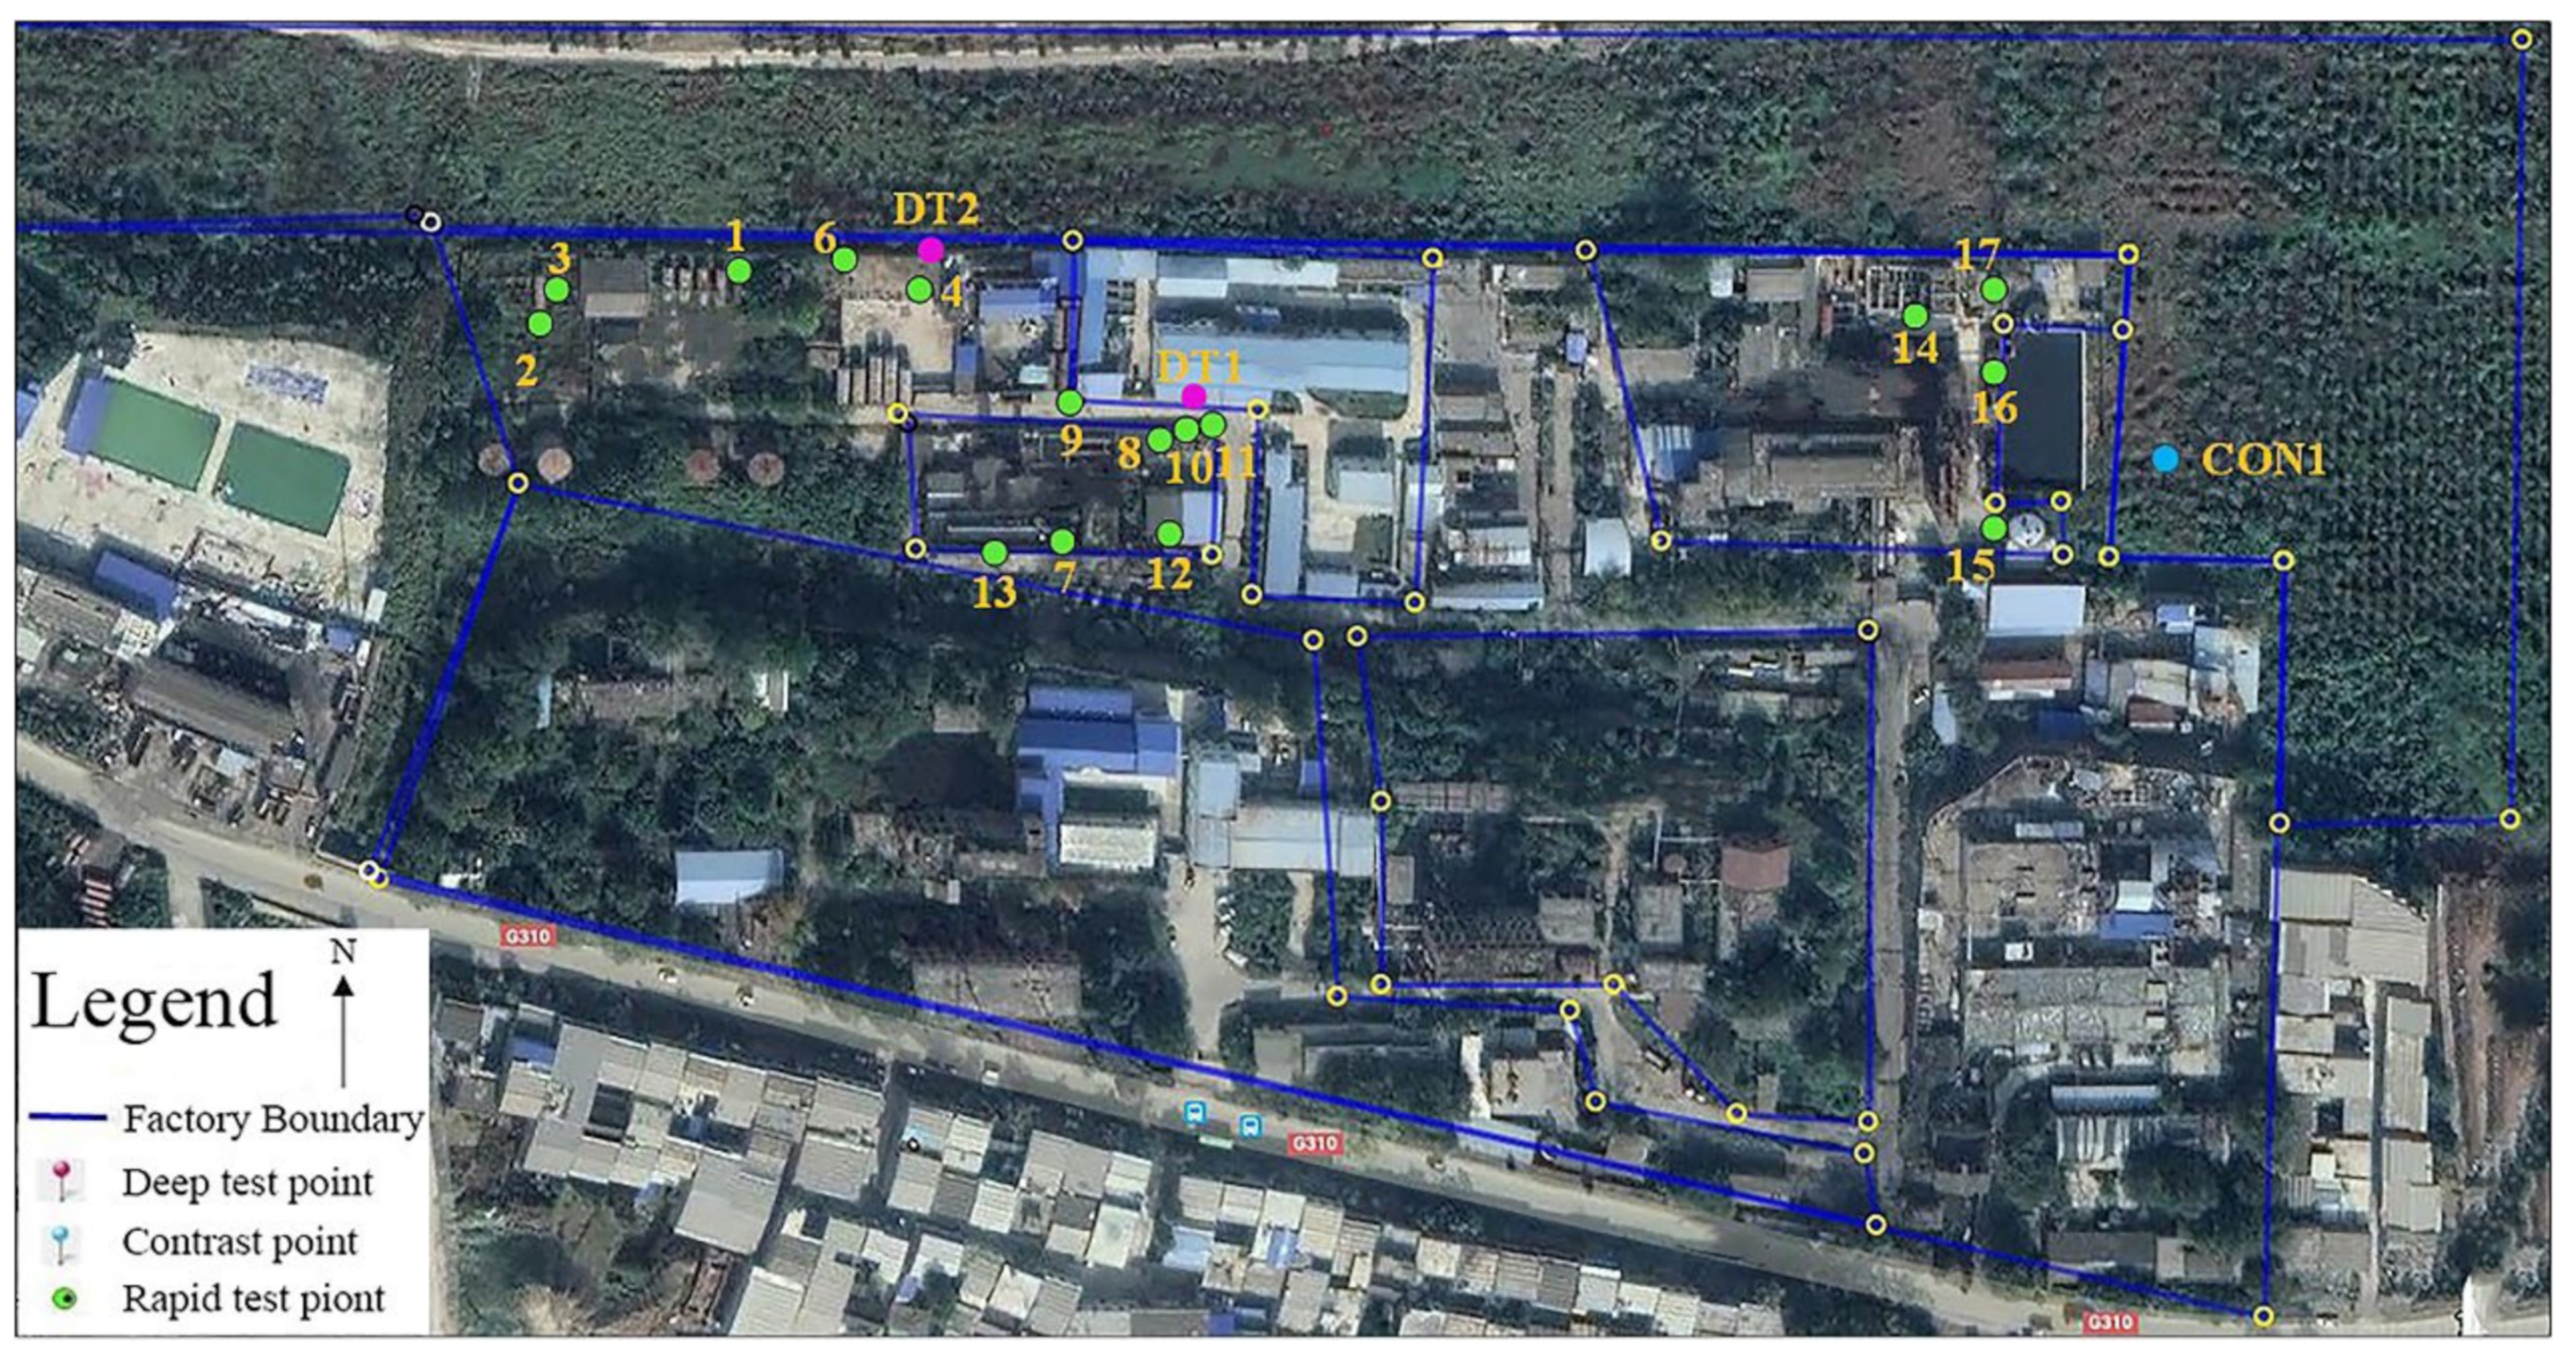
2.2. Distribution of Sampling Points and Sampling Methods

The deployment of testing points and sampling points was based on the principle of zoning the functional area, and the deployment range covers the entire fumaric acid brownfield site [19]. We set up this study’s rapid testing points, deep sampling/testing points, and control points. The locations of these sample points are shown in Figure 2.
Firstly, a portable gas chromatograph–mass spectrometer (Mars-400 Plus, Inficon, Köln, Germany) was used for initial field tests at the plant site, testing a total of almost 1000 field points. Subsequently, 19 heavily-contaminated sites were identified for further analysis. There were 17 rapid detection points, focusing on the production area (distillation area, reactor area 1, and reactor area 2), of which six points (RT1–RT6) were in the distillation area; seven points (RT7–RT13) in reactor area 1; and four points (RT14–RT17) in reactor area 2. Two deep sampling points (DT1 and DT2) were located in the reactor area 1 and distillation area, respectively. The depth in the vertical direction of the two sampling points was about 6.0–10.0 m. When the soil depth was 0~3.0 m, the sampling interval was 0.5 m; when the soil depth was 3.0~10.0 m, the sampling interval was 1.0 m. A total of nine soil samples were taken from each point. The exposed surface soil was plowed with a sampling shovel (CY/TF3, Minsheng, Hebi, China), and a Geoprobe drill rig (7822DT, Geoprobe Systems, Shanghai) was used to collect soil samples from each site in turn. The phenological properties (odor, color, type, etc.) of the collected soil samples are recorded in the field. The soil samples were filled in brown bottles, transported, and stored in an insulated box below 4 °C. One control site (CON1) located in a low-traffic area on the east side of the fumaric acid brownfield site. All points were positioned by portable GPS (TS7pro, Zhonghaida, Guangzhou, China), and these points’ specific latitude and longitude were shown in Table S1.

2.3. Testing Indicators and Analytical Methods

The primary detection indicators were soiled mechanical composition, pH, and VOCs in the atmosphere and soil. The field and laboratory testing were used to ensure real-time precision. VOCs in deep soil samples were measured in strict accordance with the “Technical Specification for Soil Environmental Monitoring (HJ/T 166)” and “Soil- and Sediment-Determination of Volatile Organic Compounds-Blowdown Trap/Gas Chromatography–Mass Spectrometry” (HJ605-2011). VOCs were detected using the Purge Trap (Stratum, Agilent, California, USA) coupled with a gas chromatograph–mass spectrometer (GC-MS) (7890B-5977A, Agilent, CA, USA). The internal standard had 71 kinds of standard solutions of VOCs with 99.9999% purity (Wanjia, Beijing, China), as specified in HJ605-2011, and the specific indexes and detection limits of VOCs in the standard are shown in Table S2. The standard samples were stored in a refrigerator at 4 °C. Ensure that the concentration of the standard solution was 100 mg/L during the test. The purge flow rate was 40 mL/min, the purge temperature was 40 °C, the GC inlet temperature was 200 °C, the carrier gas was helium, the split ratio was 30:1, the column flow rate was 1.5 mL/min, and the ramp-up program was set to 38 °C (1.8 min)–10 °C/min–120 °C–15 °C/min–240 °C (2 min).
The pH of the soil was measured according to the “Soil-Determination of pH-Potentiomery” (HJ962-2018). The specific testing procedure was as follows: the collected soil was configured as a suspension, and the temperature of the liquid was controlled to be about 25 °C, then the electrode of the pH meter (ECPHWP60042K, Eutech, Singapore) was submerged to 1/3 of the suspension, the sample was gently shaken, and the pH value was recorded after the reading was stable—and the average value was taken as the final reading after three measurements. The mechanical components of the soil were determined by the pipette method as proposed in the “Method of Agricultural Chemical Analysis of Soil” (Lu et al. 1999), which measures the content of soil particles in three particle classes—clay (<0.002 mm), silt (0.002–0.02 mm), and sand (0.02–2 mm)—to determine soil mechanical composition.
A portable VOCs detector (PV6001-VOC, Rike, Changsha, China) was used to test atmospheric VOCs during rapid testing. A portable gas chromatograph–mass spectrometer was used to detect VOCs in soil. In this experiment, the results of the rapid test and the laboratory test were compared to ensure the accuracy of the rapid test results, and the contrastive results were shown in Table S3. According to the contrastive analysis, it can be proved that the relative error was small (2–13.1%), so the rapid test data can be used as the judgment basis for the investigation of VOCs in this fumaric acid brownfield site.

2.4. Evaluation Method of the Situation of Brownfield Contamination

The single factor index method was used to evaluate the pollution level of a single pollutant with the following evaluation formula [20,21]:
Pi = Ci/Si
where Pi was the single factor pollution index of the pollutant; Ci was the measured value of pollutant i (mg/kg); and Si was the evaluation standard of pollutant I, i.e., the screening value of the first category of land in the soil environmental quality–risk control standards for soil contamination of development land (GB36600-2018). The screening values for Class I sites for VOCs are shown in Table S4. The evaluation criteria for the single factor index method are shown in Table 2.
The Nemero comprehensive pollution index method was used to evaluate soil contamination by the combined effect of multiple pollutants with the following equation [22,23]:
P = P i m a x 2 + P i a v e 2 / 2
where P is the comprehensive soil pollution index; Pimax is the maximum value of the single factor pollution index; and Piave is the average value of the single factor pollution index. The evaluation criteria of the Nemero comprehensive pollution index method are shown in Table 3.

3. Results and Discussion

3.1. Analysis of Physical and Chemical Properties

The results of surface soil pH and soil mechanical composition were determined and are shown in Table 4.
According to the experimental results, it can be seen that the clay, silt, and sand contents of the CON1 were 6.04%, 80.72%, and 13.24%, respectively, and the soil at this point belongs to silt. The soil at DT1 was silt loam soil, and the soil at DT2 was silty. The pH at CON1, DT1, and DT2 were 8.64, 8.96, and 9.48, respectively. The experimental results showed that the soil of fumaric acid brownfield sites was alkaline. The industrial production activities resulted in a significant increase in soil pH [24].

3.2. Analysis of Organic Pollution in the Atmosphere of Fumaric Acid Brownfield Sites

The concentration of organic components in the atmosphere of the fumaric acid brownfield sites was detected and identified (Figure 3). As can be seen from Figure 3, VOCs were detected in the distillation area, reactor area 1, and reactor area 2. A total of five VOCs (1,2,4-trimethylbenzene (1,2,4-TMB); dicyclopentadiene (DCPD); toluene; naphthalene (NP); and indene) were quantitatively detected in the distillation area. The average concentration was 5.07 μg/m3; among them, DCPC had the highest concentration of 18.54 μg/m3. A total of 13 VOCs (1,2,4-TMB; benzene; styrene; toluene; m,p-xylene(m,p-Xy); o-xylene(o-Xy); NP; trichloroethylene(TCE); cis-1,3-dichloropropene(cis-1,3-DCP); Tetrachloroethylene(TeCE); pentachloroethane(PCA); Ethylbenzene(EB); Ethylsulfide(ES)) were quantified in reactor area 1 with an average concentration of 10.12 μg/m3, with the highest concentration of 35.76 μg/m3 for ES. A total of six VOCs (1,2-dichlorobenzene(1,2-DCB); toluene; m,p-Xy; o-Xy; NP; Indene) were quantified in reactor area 2 with an average concentration of 0.67 μg/m3, with the highest content of indene at 2.90 μg/m3.
According to the VOCs emission requirements (Table S5) specified in the “Standard for fugitive emission of volatile organic compounds (GB37822-2019)”, the VOCs detected in the distillation area, reactor area 1, and reactor area 2 did not exceed the limit values. Among the detected organic components, 1,2,4-TMB was detected in both distillation and reactor areas (concentrations of 1.74 μg/m3 and 12.30 μg/m3, respectively); o-Xy was detected in reactor area 1 and reactor area 2 (concentrations of 7.90 μg/m3 and 0.01 μg/m3, respectively); indene was detected in the distillation area and reactor area 2 (concentrations of 4.76 μg/m3 and 2.90 μg/m3, respectively), and MB, EB, m,p-Xy, and NP were detected in all three work areas. The results indicated that benzene and its derivatives are the main VOCs in the atmosphere of this fumaric acid brownfield site.

3.3. Analysis of Organic Pollution in the Soil of Fumaric Acid Brownfields

3.3.1. Phenological Properties of Soil

The lithology, odor, color, and moisture of the soil in reactor area 1 and distillation area were focused on, and the main results are shown in Table 5.
As can be seen from Table 5, the soil color in reactor area 1 and the distillation area was mainly brown and black-brown, and the color in the distillation area gradually decreased with the increasing of depth. The pungent odor was produced in soils at different depths (including the aquifer) in both areas, and the odor of the surface soil was significantly greater than that of the deeper soil. This phenomenon was consistent with the characteristics of organic contamination in soil [25,26]. According to the analysis of soil phenological characteristics, the groundwater and soil of this fumaric acid brownfield site had been contaminated [27,28]. Therefore, to clarify the characteristics of VOCs distribution, the composition and content of VOCs in the soil need to be quantitatively detected and analyzed.

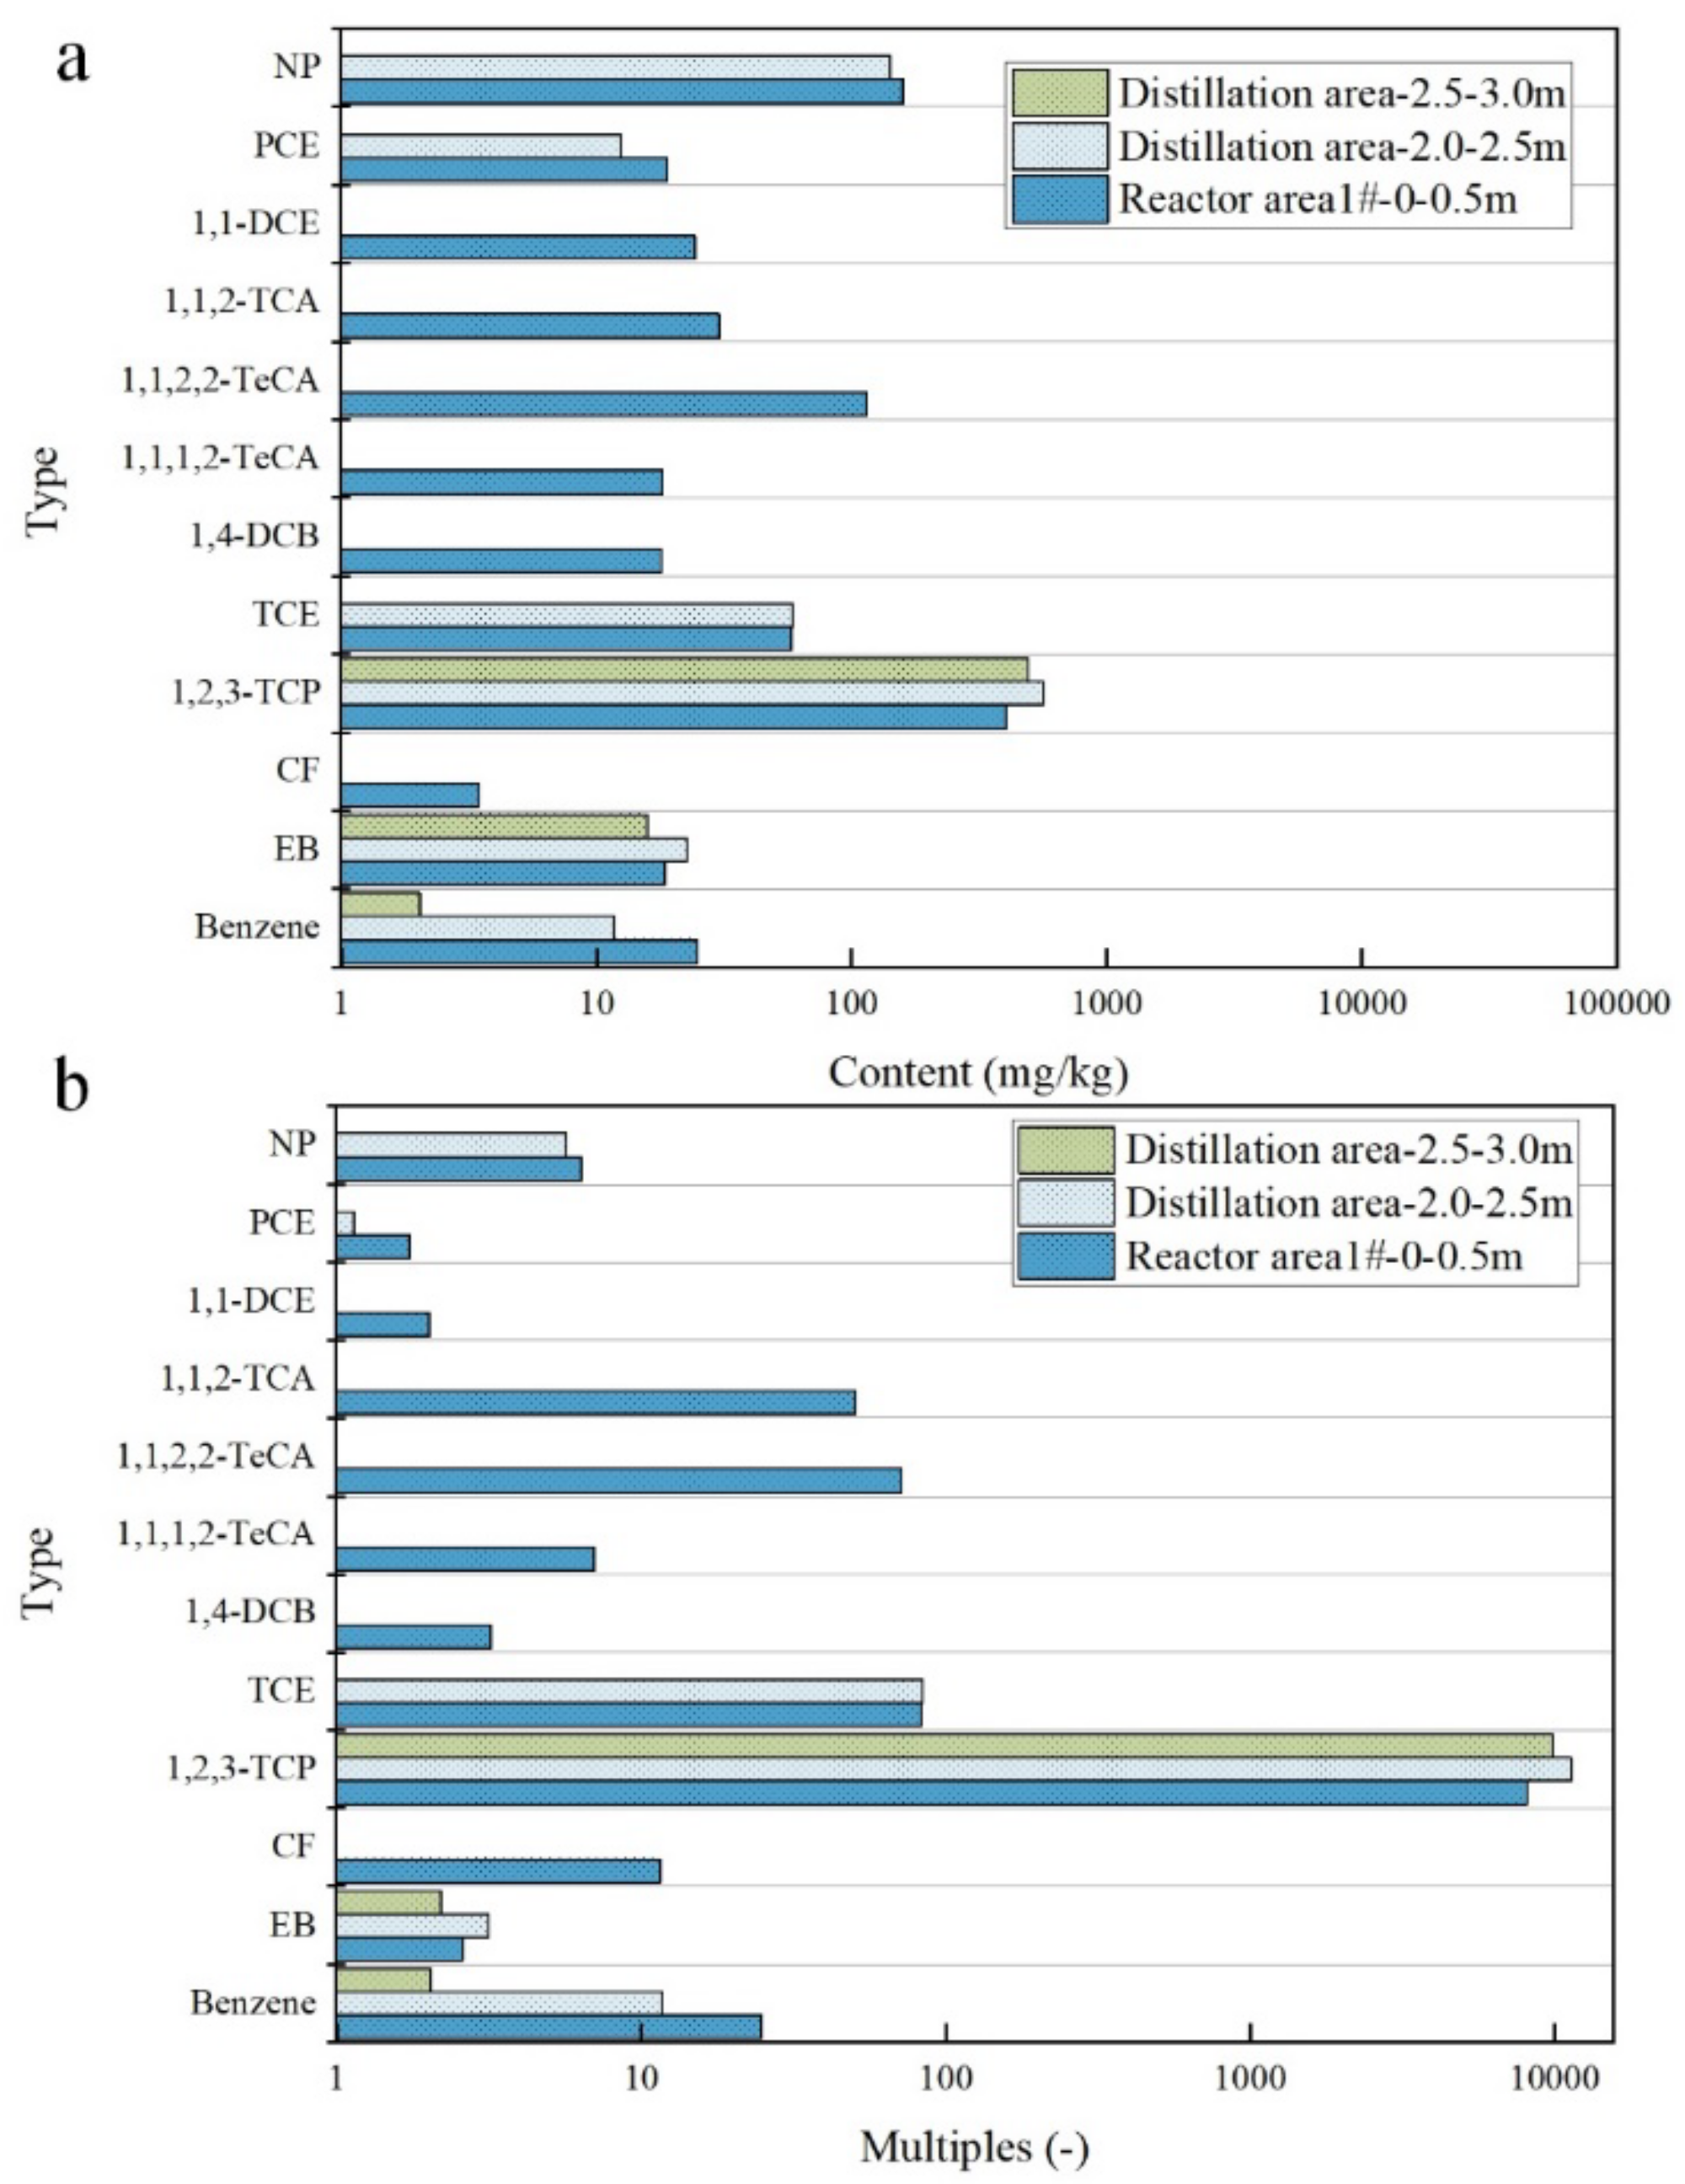
3.3.2. Distribution Characteristics of VOCs in Surface Soil

The distribution characteristics of VOCs in surface soil (reactor area 1 0–0.5 m; distillation area 2.0–3.0 m) are shown in Figure 4. A total of 12 VOCs were detected at reactor area 1 0–0.5 m (Benzene; EB; Chloroform(CF); 1,2,3-trichloropropane(1,2,3-TCP); TCE; 1,4-dichlorobenzene(1,4-DCB); 1,1,1,2-Tetrachloroethane(1,1,1,2-TeCA); 1,1,2,2-Tetrachloroethane(1,1,2,2-TeCA); 1,1,2-trichloroethane(1,1,2-TCA); 1,1-dichloroethylene(1,1-DCE); Tetrachloroethylene(TeCE); Naphthalene(NP)), and the contents of VOCs were 24.82 mg/kg, 18.581 mg/kg, 3.46 mg/kg, 405.09 mg/kg, 57.98 mg/kg, 17.94 mg/kg, 18.14 mg/kg, 114.93 mg/kg, 30.32 mg/kg, 24.21 mg/kg, 19.01 mg/kg, and 159.15 mg/kg, respectively. A total of 6 VOCs were detected in the distillation area from 2.0–2.5 m (Benzene; EB; 1,2,3-TCP; TCE; TeCE; NP), and the contents were 11.70 mg/kg, 22.63 mg/kg, 564.59 mg/kg, 58.69 mg/kg, 12.51 mg/kg, and 141.78 mg/kg, respectively. A total of 3 VOCs (benzene; EB; 1,2,3-TCP) were detected at 2.5–3.0 m, with contents of 2.03 mg/kg, 15.81 mg/kg, and 494.02 mg/kg, respectively.
Among all the VOCs, 1,2,3-TCP had the highest content and the most extensive exceedance times; the limit values (0.05 mg/kg) exceeded 8101.78-, 11,291.80-, and 9880.36-times at 0–0.5 m in reactor area 1, 2.0–2.5 m, and 2.5–3.0 m in the distillation area, respectively. Therefore, 1,2,3-TCP was the primary organic pollutant in the surface soil of reactor area 1 and distillation area.
In the distillation zone, the concentration of organic matter in the 2.0–2.5 m interval is significantly higher than that in the 2.5–3.0 m interval, with organic contamination more concentrated in the upper soil layers [29,30]. The production steps of fumaric acid directly influence the pollution characteristics of the different functional areas [31], thereby resulting in more types of VOCs being detected in reactor area 1; however, the concentration of 1,2,3-TCP in the distillation area was much higher than that in reactor area 1, resulting in lower TVOC content in reactor area 1 than in the distillation area.

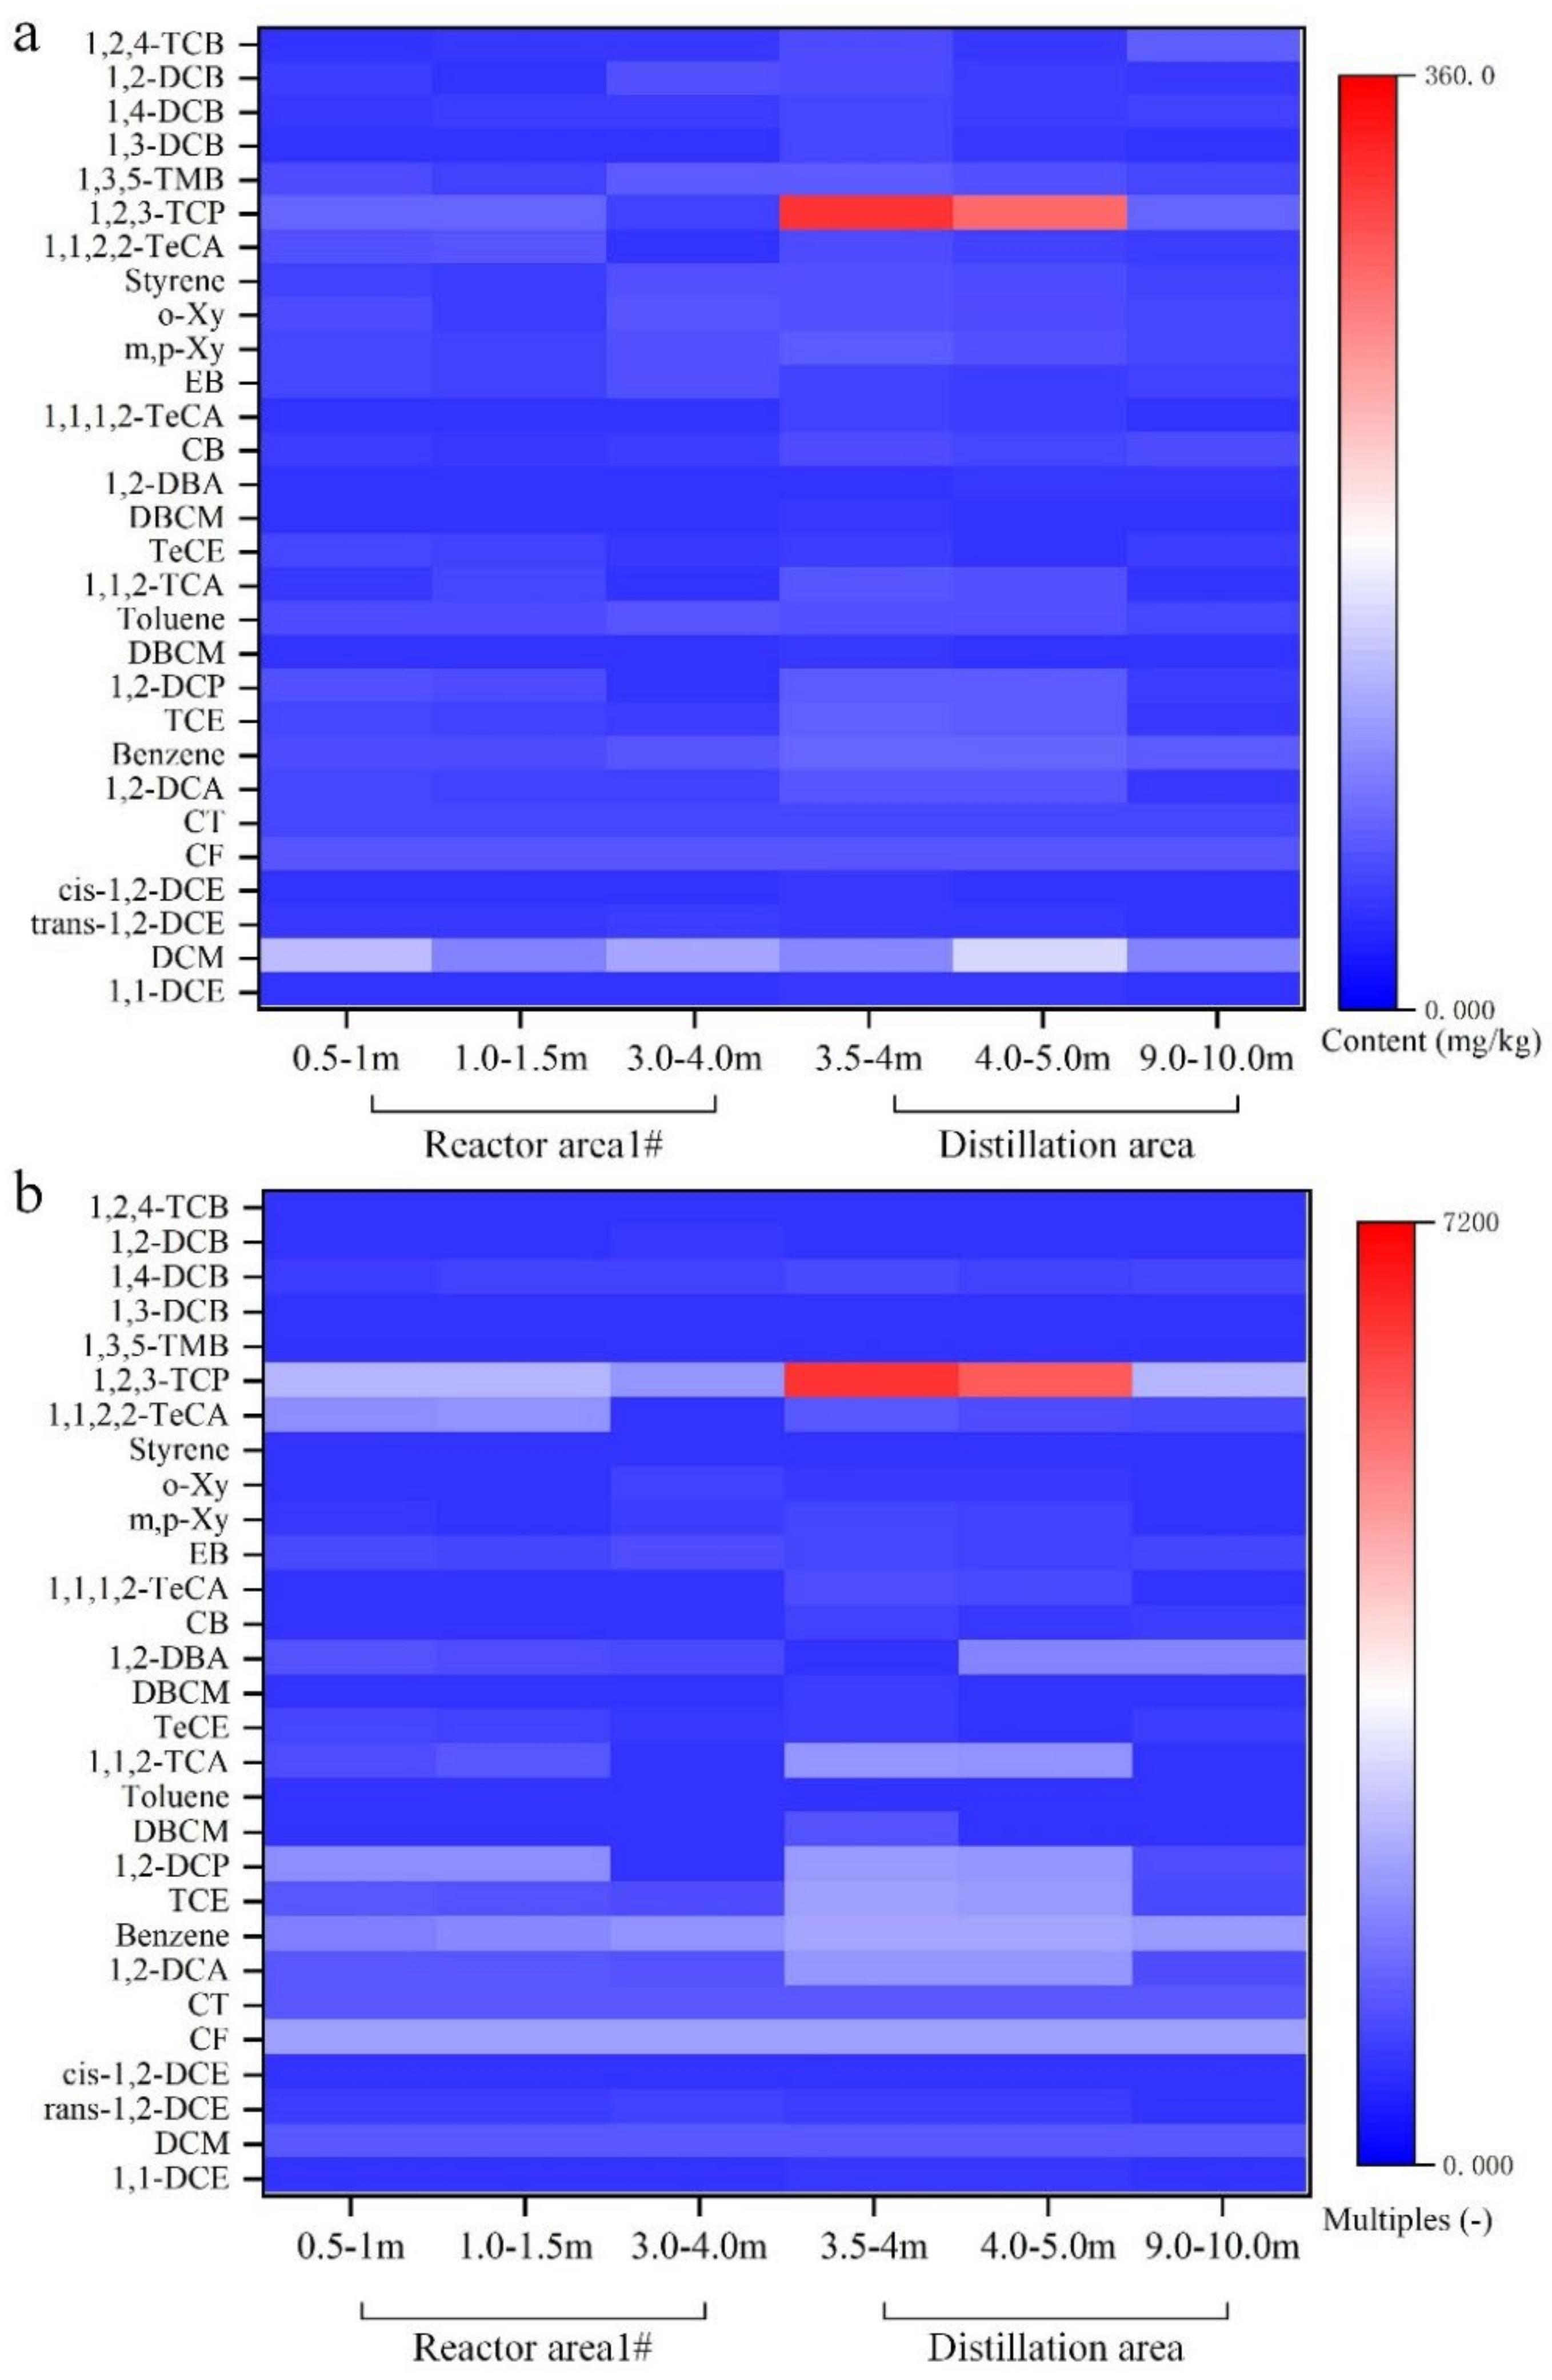
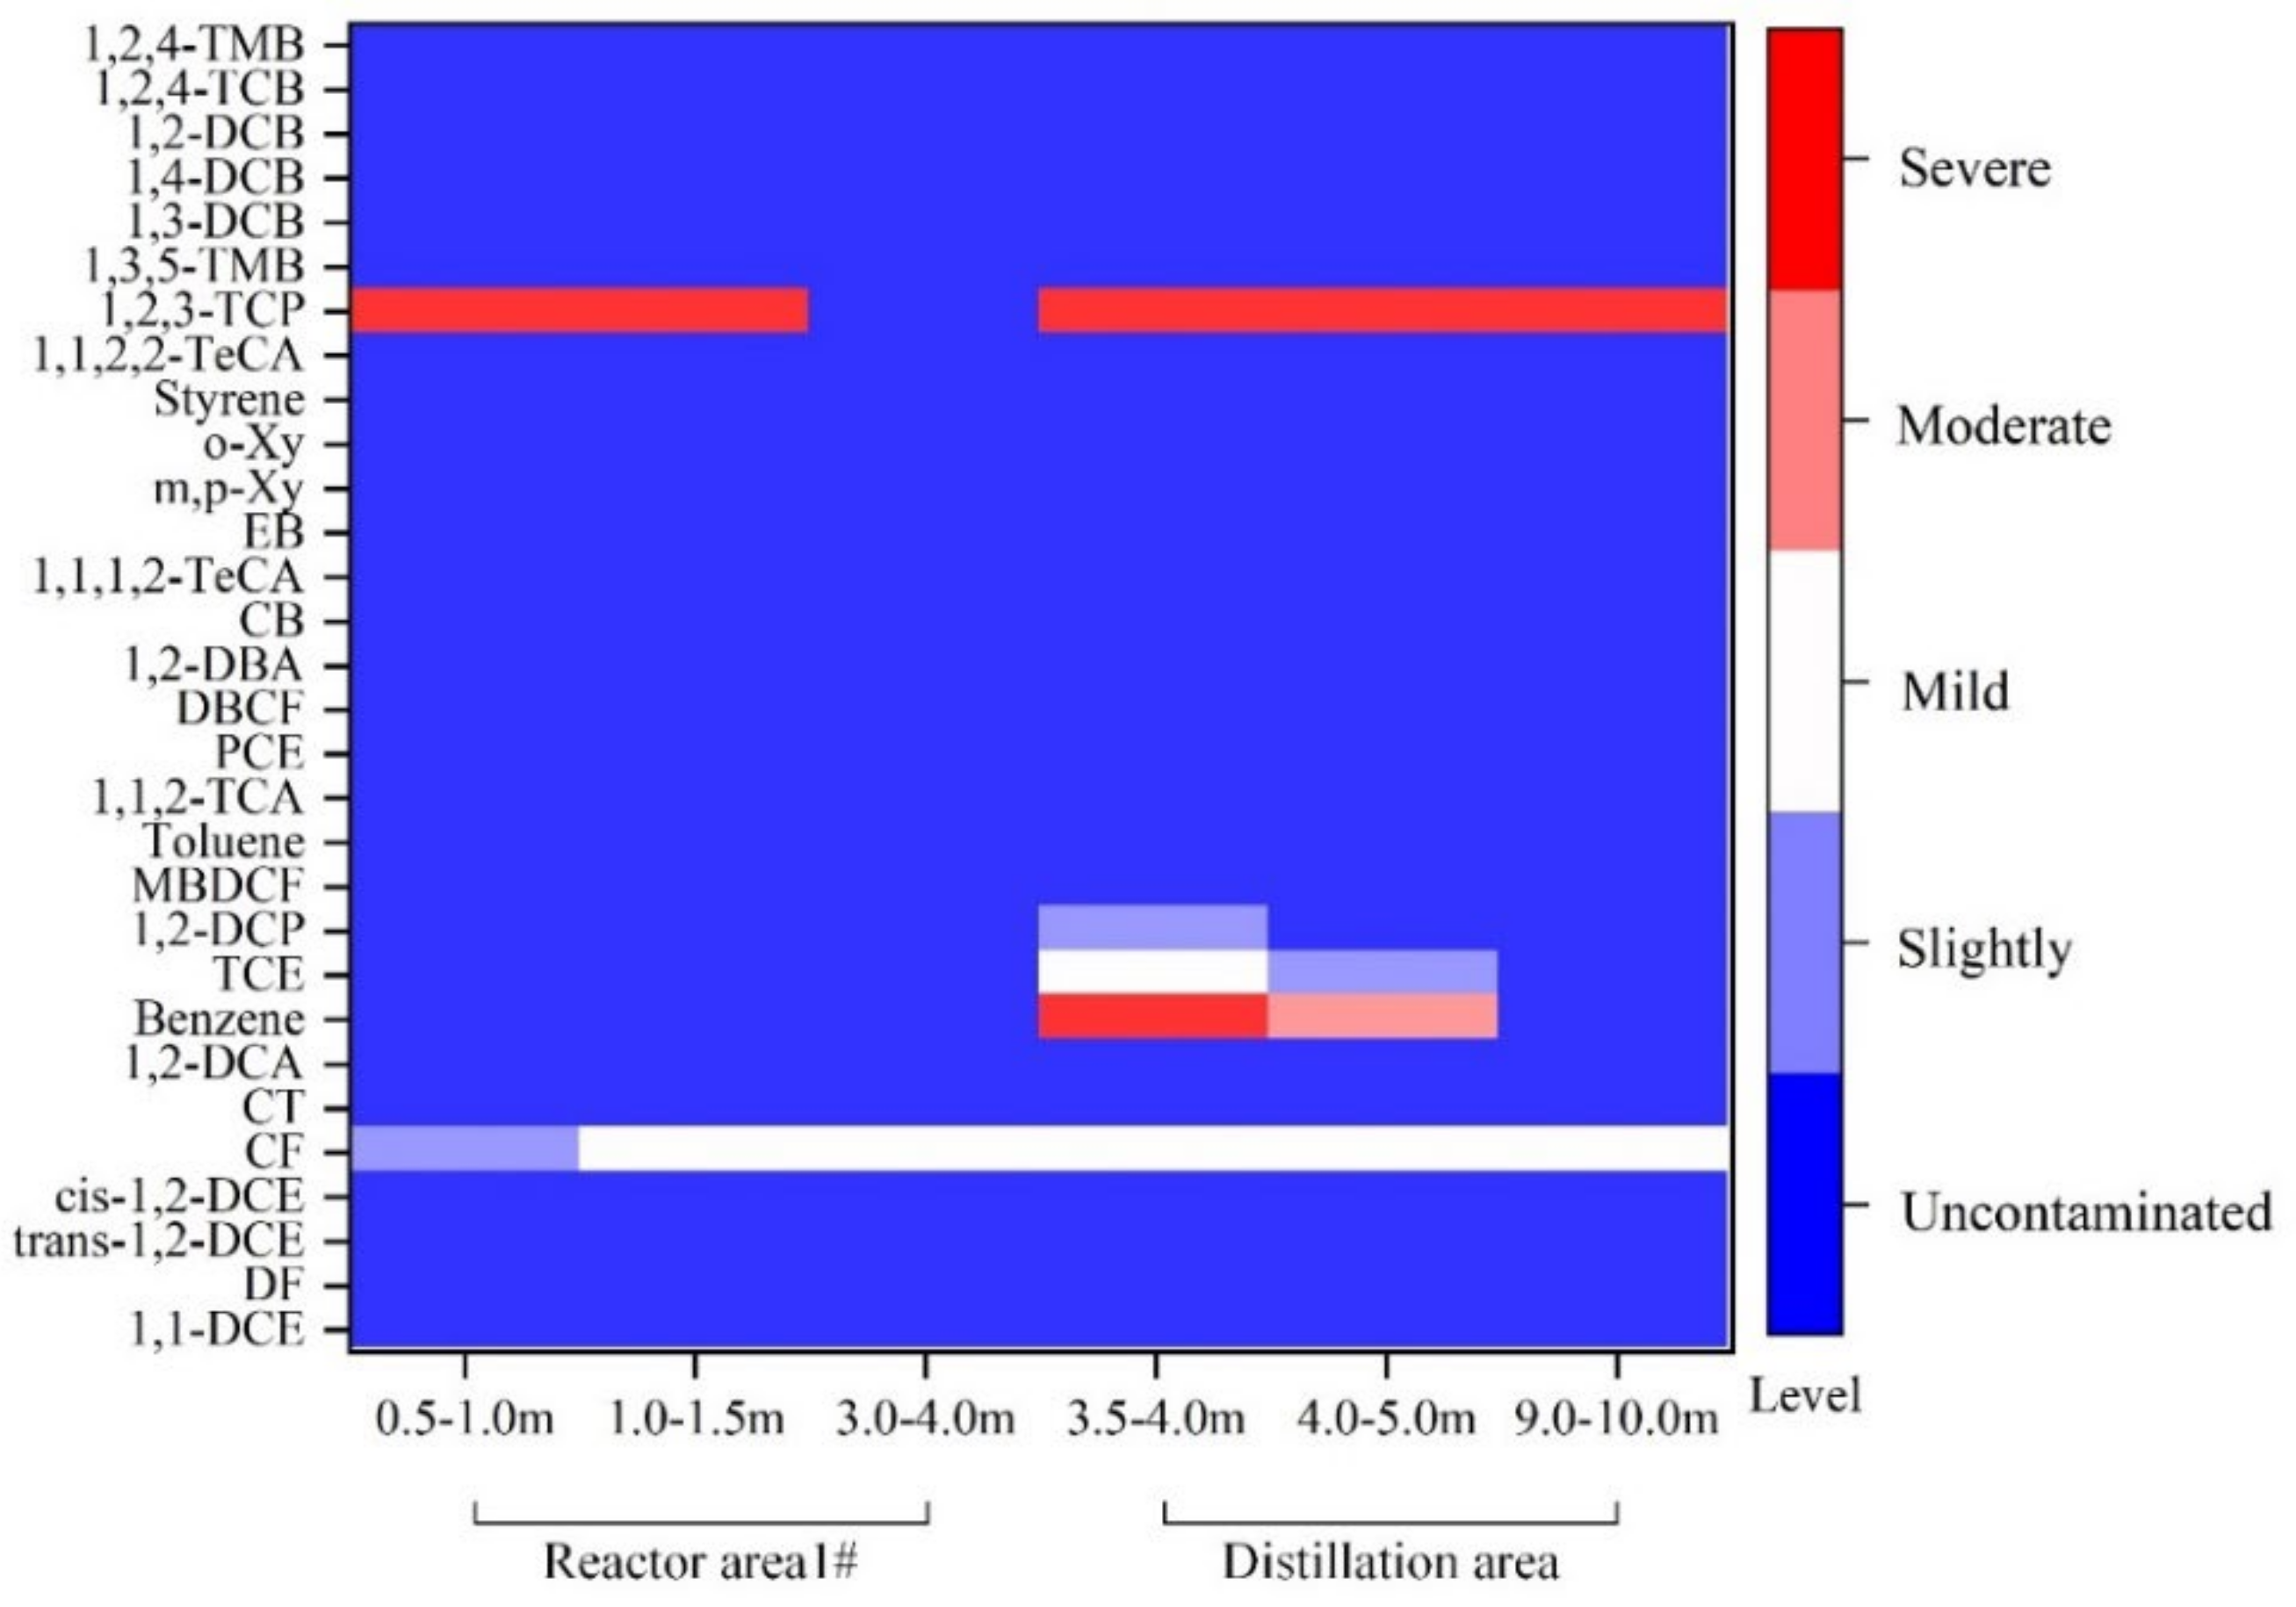
3.3.3. Distribution Characteristics of VOCs in Deep Soil

For the organic contamination characterization of deep soil, we selected soil samples from 0.5–1.0 m, 1.0–1.5 m, and 3.0–4.0 m in reactor area 1, and 3.5–4.0 m, 4.0–5.0 m and 9.0–10.0 m in the distillation area, respectively. The results were shown in Figure 5. Figure 5a showed the type and content of contaminants in the deep soil and Figure 5b showed the number of times the contaminants exceeded the screening value.
As can be seen from Figure 5, a total of 24 organic pollutants were detected at reactor area 1 (Dichloromethane(DCM); trans-1,2-dichloroethylene(DCE); CF; Carbon tetrachloride(CT); 1,2-dichloroethane(1,2-DCA); Benzene; TCE; 1,2-Dichloropropane(1,2-DCP); Toluene; 1,1,2-TCA; TeCE;1,2-dibromoethane(1,2-DBA); Chlorobenzene(CB); EB; m,p-Xy; o-Xy; Styrene; 1,1,2,2-TeCA; 1,2,3-TCP; 1,3,5-trimethylbenzene(1,3,5-TMB); 1,4-DCB; 1,2-DCB; 1,2,4-trichlorobenzene(1,2,4-TCB); 1,2,4-TMB). However, only two VOCs (1,2,3-TCP and CF) exceeded the limit values. The concentration of 1,2,3-TCP was 4.36 mg/kg and 5.47 mg/kg at 0.5–1.0 m and 1.0–1.5 m, exceeding the limits by 87.20- and 109.4-times, respectively. In the three soil depth intervals (0.5–1.0 m, 1.0–1.5 m, and 3.0–4.0 m), the chloroform levels were 0.58 mg/kg, 0.65 mg/kg, and 0.64 mg/kg, thereby exceeding the limit (0.3 mg/kg) by 1.93-, 2.17-, and 2.13-times, respectively.
All 30 VOCs were detected in the distillation area, as shown in Figure 5, with 5 pollutants exceeding the limit values (CF, Benzene, TCE, 1,2-DCP, and 1,2,3-TCP).
At 3.5–4.0 m, 4.0–5.0 m, and 9.0–10.0 m, the concentration of CF were 0.63 mg/kg, 0.62 mg/kg, and 0.65 mg/kg, thereby exceeding the limit values by 2.10-, 2.07-, and 2.17-times, respectively; The contents of benzene were 5.65 mg/kg, 4.14 mg/kg, and 1.07 mg/kg, thereby exceeding the limit values (1.0 mg/kg) by 5.65-, 4.14-, and 1.07-times, respectively; the contents of 1,2,3-TCP were 359.21 mg/kg, 217.07 mg/kg, and 3.29 mg/kg, thereby exceeding the limits by 7184.20-, 4341.40-, and 65.80-times, respectively. At 3.5–4.0 m and 4.0–5.0 m, the content of TCE were 1.83 mg/kg and 0.79 mg/kg, thereby exceeding the limit (0.7 mg/kg) by 2.61- and 1.13-times, respectively. Last, 1,2-DCRP were 1.28 mg/kg at 3.5–4.0 m, thereby exceeding the limit values (1.0 mg/kg) by 1.28-times.
In reactor area 1, the pollutants were concentrated at 0.5–1.5 m. The amount of TVOCs in the 0.5–1.0 m interval was smaller than that in the 1.0–1.5 m interval due to the escape of TVOCs to the atmosphere near the surface [32]. The silt layer in this area was located at 3.0–4.0 m below ground, and the vertical permeability coefficient is of the order of 10−7 cm/S [33]. A small vertical permeability coefficient will prevent pollutants from continuing to diffuse downward to deeper strata, which results in a significant reduction in the type and content of each pollutant in the 3.0–4.0 m interval [34,35]. The vertical contamination depth of the soil in this area was 4.0 m. The content of VOCs in soil showed a trend of increasing and then enormously decreasing. In the distillation area, the organic pollution was mainly concentrated in the range of 3.5–5.0 m, and the TVOCs content decreased rapidly in the interval of 9–10 m. The reason was that the silt layer at 5.1–6.0 m prevented the contaminants from continuing to diffuse downward, which led to a rapid decrease in the content of VOCs in the deep soil [36].
An analysis of the pollution characteristics of VOCs in the soil of reactor area 1 and the distillation area showed that: The main VOCs in reactor area 1 were 1,2,3-TCP, CF, 1,1,1,2-TeCA, 1,1,2,2-TeCA, and NP. The longitudinal soil contamination depth in this area does not exceed 4.0 m; the main VOCs in the distillation area were 1,2,3-TCP, CF, and benzene; and the longitudinal pollution depth in this area was no more than 10 m. More types and higher VOC concentrations were present in the distillation area, and the depth of vertical contamination in the distillation area was high. The reasons for this phenomenon were mainly two-fold: Firstly, the production process in reactor area 1 was different from that in the distillation area, and more VOCs were produced in the distillation area, thereby resulting in more types and contents of VOCs in the soil at the distillation area [37]. Secondly, the mechanical components of the soil in reactor area 1 and distillation area were different. The distillation area had more sand, resulting in increased soil aeration pores at the distillation area, reducing the soil’s adsorption capacity for pollutants, and promoting the transport of pollutants to the vertical direction [38]. Therefore, more severe VOCs pollution at the distillation area [39,40].

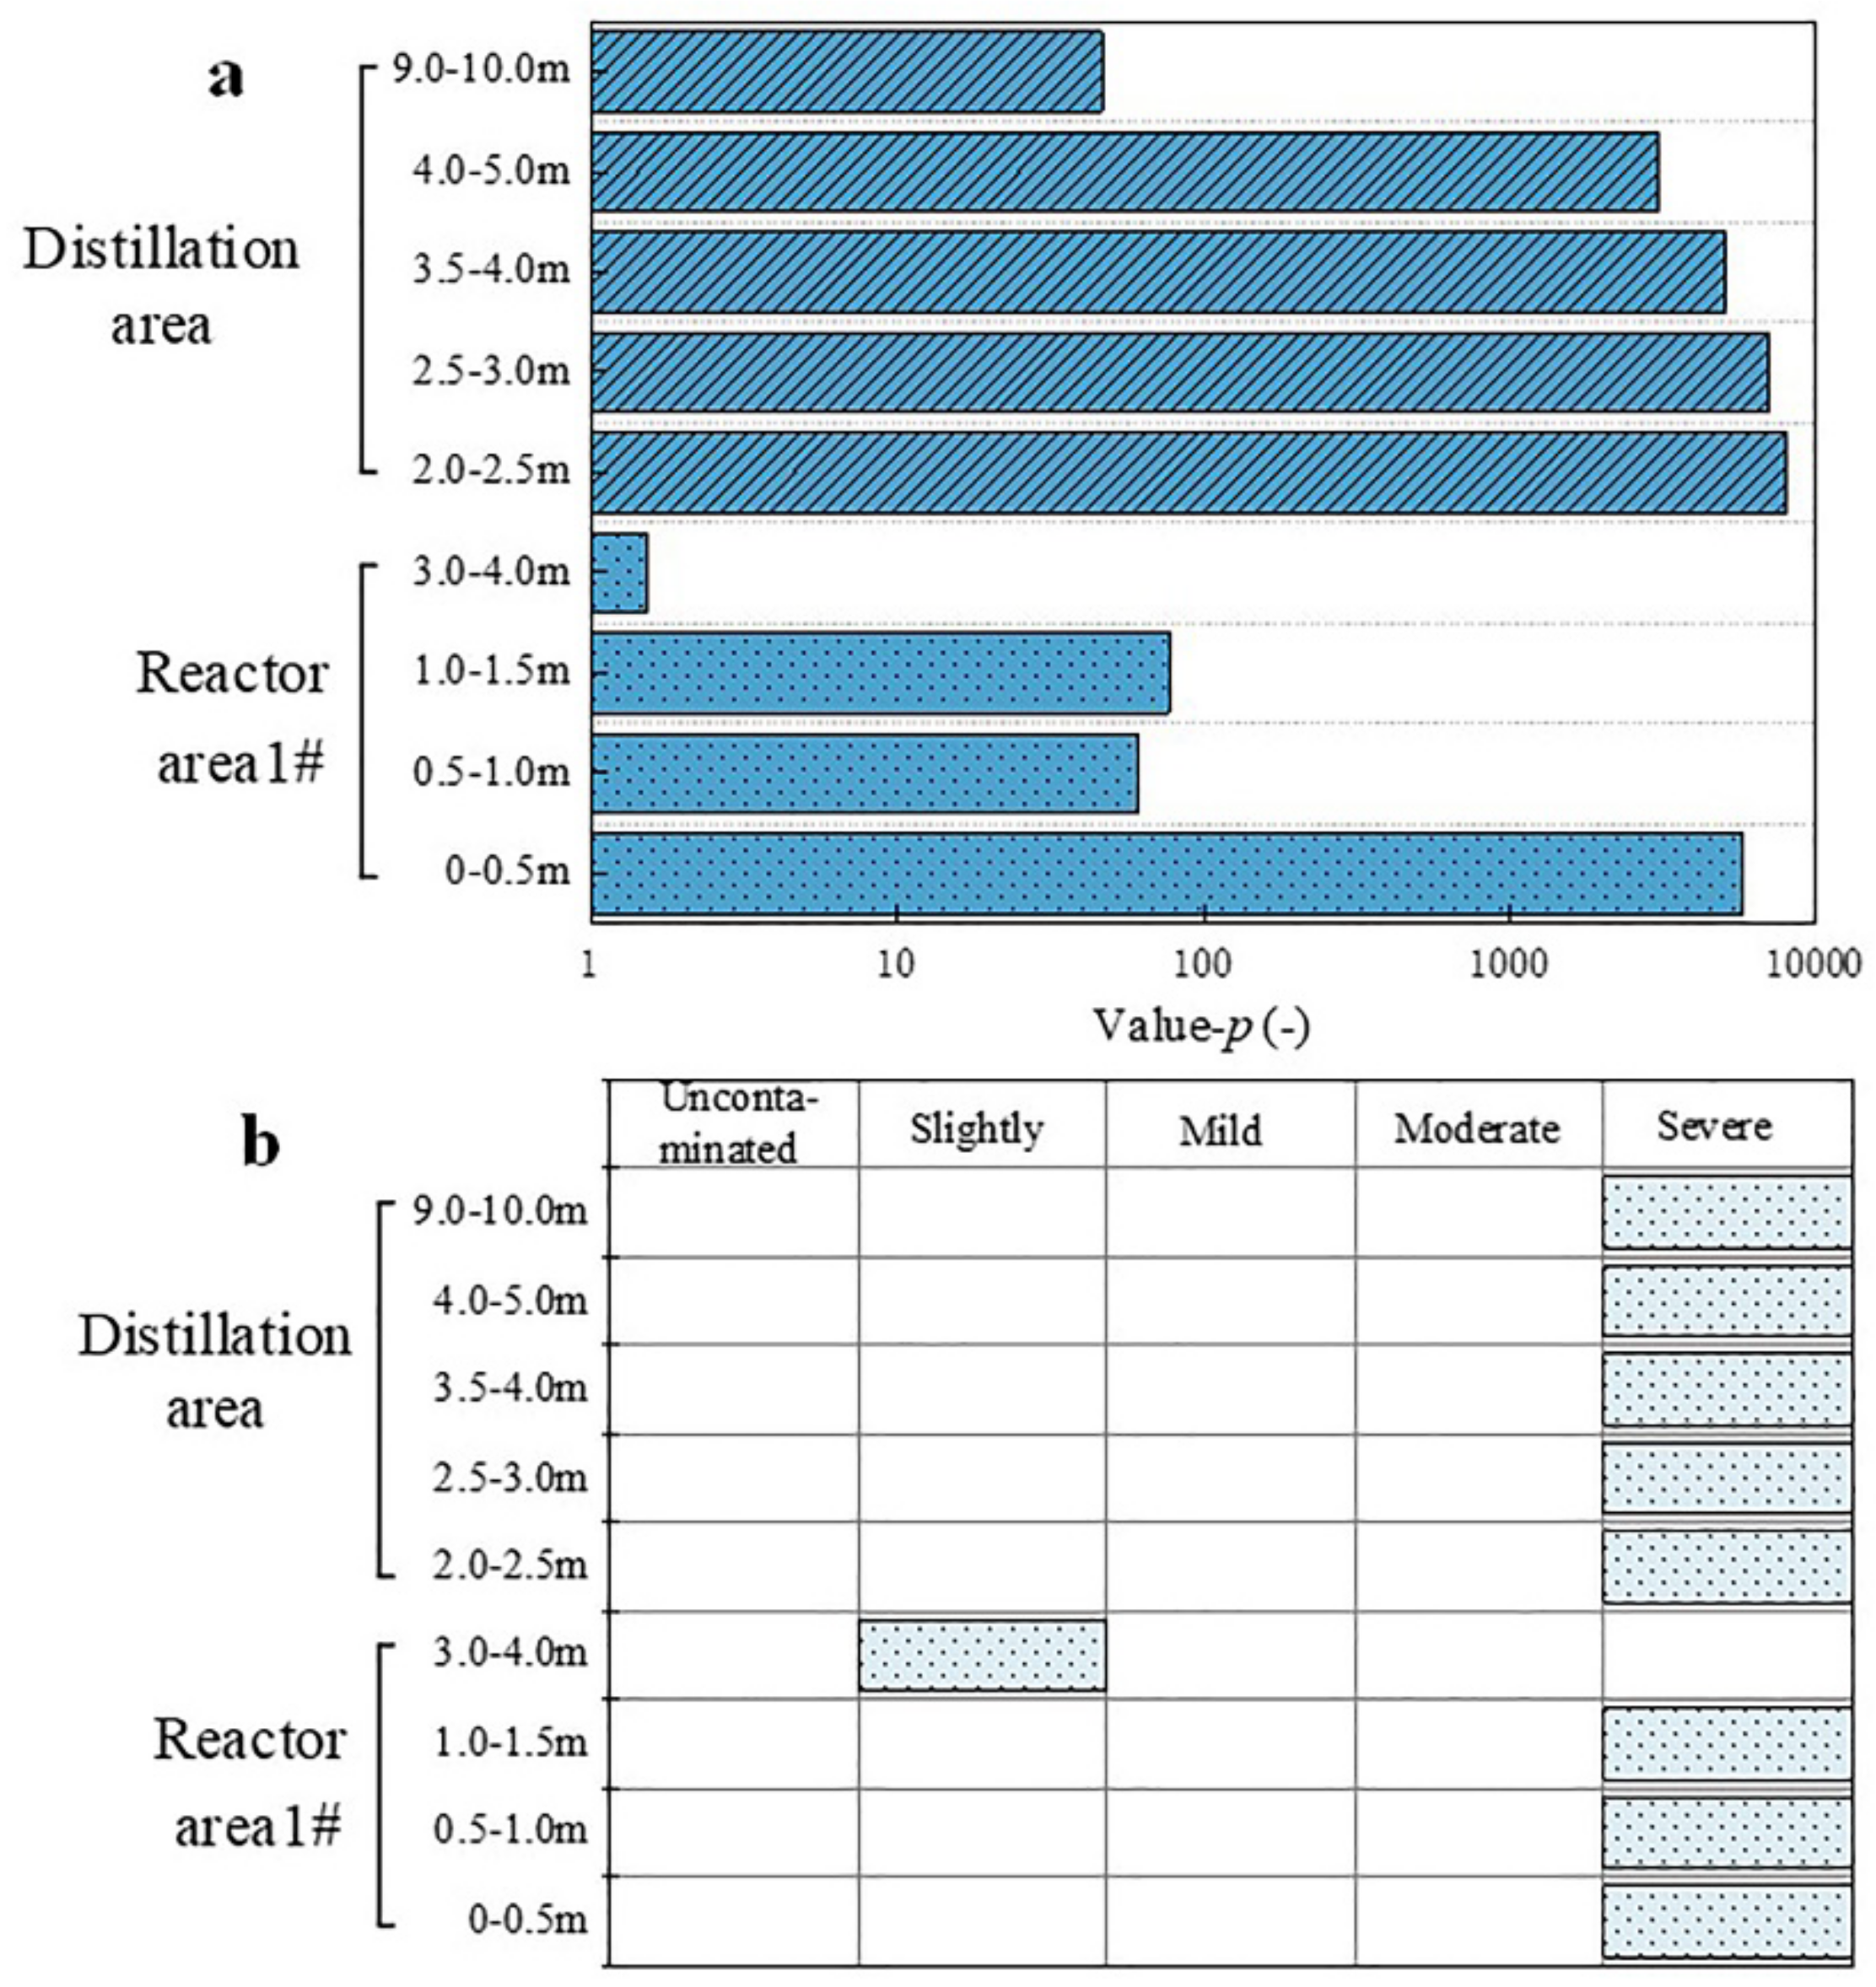
3.4. Evaluation of Organic Contamination of Fumaric Acid Brownfield Site

The single factor index evaluation results of this fumaric acid brownfield site are shown in Figure 6 and Figure 7, where Figure 6a–c showed the evaluation results of the surface soil at 0–0.5 m in reactor area 1, and 2.0–2.5 m and 2.5–3.0 m in the distillation area, respectively. Furthermore, Figure 7 showed the evaluation results of the deep soil in reactor area 1 and distillation area.
From Figure 6a–c, it can be seen that the surface soils were contaminated with different degrees of organics. In the reactor area 1 0–0.5 m, there were eight VOCs (Benzene; CF; 1,2,3-TCP; TCE; 1,1,1,2-TeCA; 1,1,2,2-TeCA; 1,1,2-TCA; NP) that were shown to be severely polluted. The Pi of 1,4-DCB was 3.20, so 4-DCB led to moderate pollution; the EB and 1,1-DCE were mild pollution; and TeCE belongs to slight pollution due to the Pi of was 1.72.
At a depth of 2.0–2.5 m in the distillation area, the Pi of benzene, 1,2,3-TCP, TCE, and NP were all over 5, which showed severe pollution; EB led to moderate pollution due to Pi being 3.14; and TeCE was at a slight pollution level. In the distillation area at the interval of 2.0–2.5 m, the Pi of 1,2,3-TCP was over 5, so it exhibited severe pollution; and the Pi of benzene and EB were 2.02 and 2.20, respectively, so these led to mild pollution.
According to Figure 7, it can be seen that the soils located in the deeper layers showed relatively slight pollution, and most of the VOCs belong to uncontaminated levels. Nevertheless, there were still five VOCs in the pollution level (CF; Benzene; TCE; 1,2,3-TCP; 1,2-DCP). The Pi of 1,2,3-TCP in reactor area 1 3.0–4.0 m was below 1, and in other areas were all over 5, so 1,2,3-TCP led to severe pollution. CF led to slight pollution at 0.5–1.0 m in reactor area 1 and showed mild pollution at the other depths. In the distillation area at 3.5–4.0 m and 4.0–5.0 m, benzene caused severe and moderate pollution, respectively; TCE had mild pollution at 3.5–4.0 m and had slight pollution level at 4.0–5.0 m. The Pi of 1,2-DCP at 3.5–4.0 m in the distillation area was 1.28, thereby leading to slight pollution.
The Nemero integrated pollution evaluation was shown in Figure 8, where Figure 8a showed the specific values of the P, and Figure 8b shows the results of the Nemero integrated evaluation.
From Figure 8a, the P at 0–0.5 m, 0.5–1.0 m, 1.0–1.5 m, and 3.0–4.0 m in reactor area 1 and 2.5–3.0 m, 3.5–4.0 m, 4.0–5.0 m, and 9.0–10.0 m in the distillation area were 5746.89, 61.69, 77.39, 1.51, 8008.54, 7007.13, 5082.20, 3071.17, and 46.55, respectively. Therefore, except for reactor area 1 3.0–4.0 m, the other depths were severely polluted.
A comprehensive analysis of the overall organic pollution characteristics of this fumaric acid brownfield site showed that the types of VOCs detected in the area are very complex, including halogenated organics, benzene, and polycyclic aromatic hydrocarbons. Halogenated organic compounds are not only the primary contaminants of this brownfield site but also the most frequently detected substances in chemical brownfields in China [41]. Most halogenated organics were chlorinated, but uncommon brominated substances were still detected (DBCM; BF; BDCM). According to Zhu et al. (2021) [41], the most common organic pollutants in chemical brownfields in China are trichloromethane (TCM) and1,2-DCA. However, due to the specificity of the production process of fumaric acid, 1,2,3-TCP is far more abundant in soil than other VOCs in this study, and it is the primary indicator of contamination in soil. Therefore, it is recommended to focus on the effects of 1,2,3-TCP in the site when conducting contamination surveys of the same type of fumaric acid brownfield sites.

4. Conclusions

The main findings of this study are as follows: (1) The atmospheric VOCs detected in the working area of this fumaric acid brownfield were mainly benzene and its derivatives, which do not exceed the standard limits. (2) The contamination level of reactor area 1 and the distillation area gradually decreased with the increase of soil depth. (3) The maximum vertical contamination depths in reactor area 1 and distillation area were 4.0 m and 10.0 m, respectively. In the distillation area, the proportion of sand particles contained in the soil was higher, resulting in a poorer soil adsorption capacity of VOCs and faster vertical transport of pollutants. (4) Most of the soils within this fumaric acid brownfield site were at a severe contamination level. Moreover, uncommon DBCM, BF, and BDCM were detected at the site. (5) 1,2,3-TCP was the primary exceeded pollutant in the fumaric acid brownfield site, and it could be the focus of subsequent studies on fumaric acid brownfield sites.

Supplementary Materials

The following supporting information can be downloaded at: https://www.mdpi.com/article/10.3390/su141912476/s1. Table S1: Latitude and longitude of sampling/detection points; Table S2: Composition and detection limit of VOCs; Table S3: Error analysis of the results (laboratory testing and rapid testing); Table S4: Limit values of VOCs (From Soil environmental quality - risk control standards for soil contamination of development land (GB36600-2018)); Table S5: Emission limits of VOCs in the factory.

Author Contributions

Data curation, Y.Y.; formal analysis, C.L., Z.C., N.Z. and W.W.; investigation, H.X.; Resources, Y.D.; supervision, Y.W.; writing—review & editing, Y.Y. All authors have read and agreed to the published version of the manuscript.

Funding

This research was funded by the Land Engineering and Human Settlements Technology Joint Innovation Center of Shaanxi Land Engineering Construction Group Co., Ltd. and Xi’an Jiaotong University (No. 201912131) and the Science Technology Project of Yulin (No. YF-2020-007).

Conflicts of Interest

The authors declare no conflict of interest.

Abbreviations

1,1,1,2-TeCA, 1,1,1,2-Tetrachloroethane; 1,1,1-TCA, 1,1,1-trichloroethane; 1,1,2,2-TeCA, 1,1,2,2-Tetrachloroethane; 1,1,2-TCA, 1,1,2-trichloroethane; 1,1-DCA, 1,1-dichloroethane; 1,1-DCE, 1,1-dichloroethylene; 1,2,3-TCP, 1,2,3-trichloropropane; 1,2,4-TMB, 1,2,4-trimethylbenzene; 1,2,4-TCB, 1,2,4-trichlorobenzene; 1,2-DCB, 1,2-dichlorobenzene; 1,2-DCP, 1,2-Dichloropropane; 1,2-DCA, 1,2-dichloroethane; 1,2-DBA, 1,2-dibromoethane; 1,3,5-TMB, 1,3,5-trimethylbenzene; 1,3-DCB, 1,3-dichlorobenzene; 1,4-DCB, 1,4-dichlorobenzene; DCPD, Dicyclopentadiene; DCM, Dichloromethane; DBCM, Dibromochloromethane; trans-1,2-DCE, trans-1,2-dichloroethylene; m,p-Xy, m,p-xylene; o-Xy, o-xylene; CB, Chlorobenzene; CF, Chloroform; NP, Naphthalene; TCE, Trichloroethylene; cis-1,2-DCE, cis-1,2-dichloroethylene; cis-1,3-DCP, cis-1,3-dichloropropene; CT, Carbontetrachloride; TeCE, Tetrachloroethylene; PCA, Pentachloroethane; BF, Bromoform; BDCM, Bromodichloromethane; EB, Ethylbenzene; ES, Ethylsulfide.

References

  1. Macgregor, C.J.; Bunting, M.J.; Deutz, P.; Bourn, N.A.D.; Roy, D.B.; Mayes, W.M. Brownfield sites promote biodiversity at a landscape scale. Sci. Total Environ. 2022, 804, 150162. [Google Scholar] [CrossRef] [PubMed]
  2. Wu, Y.; Wu, J.; Tan, H.; Song, Q.; Zhang, J.; Zhong, X.; Zhou, J.; Wu, W.; Cai, X.; Zhang, W.; et al. Distributions of chlorinated paraffins and the effects on soil microbial community structure in a production plant brownfield site. Environ. Pollut. 2020, 262, 114328. [Google Scholar] [CrossRef] [PubMed]
  3. Hellawell, E.E.; Hughes, S.J. Asbestos contamination on brownfield development sites in the UK. Environ. Res. 2021, 198, 110480. [Google Scholar] [CrossRef] [PubMed]
  4. Song, Y.; Lyu, Y.; Qian, S.; Zhang, X.; Lin, H.; Wang, S. Identifying urban candidate brownfield sites using multi-source data: The case of Changchun City, China. Land Use Policy 2022, 117, 106084. [Google Scholar] [CrossRef]
  5. Qiu, H.; Lou, Z.; Gu, X.; Sun, Y.; Wang, J.; Zhang, W.; Cao, X. Smart 6S roadmap for deciphering the migration and risk of heavy metals in soil and groundwater systems at brownfield sites nationwide in China. Sci. Bull. 2022, 67, 1295–1299. [Google Scholar] [CrossRef]
  6. Mahammedi, C.; Mahdjoubi, L.; Booth, C.A.; Butt, T.E. Framework for preliminary risk assessment of brownfield sites. Sci. Total Environ. 2022, 807, 151069. [Google Scholar] [CrossRef]
  7. Tonin, S.; Bonifaci, P. Assessment of brownfield redevelopment opportunities using a multi-tiered approach: A case in Italy. Socio-Econ. Plan. Sci. 2020, 71, 100812. [Google Scholar] [CrossRef]
  8. Lodge, E.K.; Guseh, N.S.; Martin, C.L.; Fry, R.C.; White, A.J.; Ward-Caviness, C.K.; Galea, S.; Aiello, A.E. The effect of residential proximity to brownfields, highways, and heavy traffic on serum metal levels in the Detroit Neighborhood Health Study. Environ. Adv. 2022, 9, 100278. [Google Scholar] [CrossRef]
  9. Sun, Y.; Li, H.; Lei, S.; Semple, K.T.; Coulon, F.; Hu, Q.; Gao, J.; Guo, G.; Gu, Q.; Jones, K.C. Redevelopment of urban brownfield sites in China: Motivation, history, policies and improved management. Eco-Environ. Health 2022, 1, 63–72. [Google Scholar] [CrossRef]
  10. Ahmad, N.; Zhu, Y.; Ullah, Z.; Iqbal, M.; Hussain, K.; Ahmed, R.I. Sustainable solutions to facilitate brownfield redevelopment projects in emerging countries—Pakistani scenario. Land Use Policy 2021, 109, 105727. [Google Scholar] [CrossRef]
  11. Li, H.; Ji, H. Chemical speciation, vertical profile and human health risk assessment of heavy metals in soils from coal-mine brownfield, Beijing, China. J. Geochem. Explor. 2017, 183, 22–32. [Google Scholar] [CrossRef]
  12. Hu, G.; Liu, H.; Chen, C.; He, P.; Li, J.; Hou, H. Selection of green remediation alternatives for chemical industrial sites: An integrated life cycle assessment and fuzzy synthetic evaluation approach. Sci. Total Environ. 2022, 845, 157211. [Google Scholar] [CrossRef]
  13. Sebastian, J.; Osorio-Gonzalez, C.; Rouissi, T.; Hegde, K.; Brar, S.K. Bioderived fumaric acid for sustainable production of key active pharmaceutical ingredients: Dimethyl fumarate and Monomethyl fumarate. Process Biochem. 2022, 120, 35–40. [Google Scholar] [CrossRef]
  14. Wei, P.; Ma, H.; Fu, H.; Xu, Z.; Qu, X. Efficient inhibition of cyanobacteria M. aeruginosa growth using commercial food-grade fumaric acid. Chemosphere 2022, 301, 134659. [Google Scholar] [CrossRef]
  15. Xu, Q.; Li, S.; Huang, H.; Wen, J. Key technologies for the industrial production of fumaric acid by fermentation. Biotechnol. Adv. 2012, 30, 1685–1696. [Google Scholar] [CrossRef]
  16. Guo, F.; Wu, M.; Dai, Z.; Zhang, S.; Zhang, W.; Dong, W.; Zhou, J.; Jiang, M.; Xin, F. Current advances on biological production of fumaric acid. Biochem. Eng. J. 2020, 153, 107397. [Google Scholar] [CrossRef]
  17. Yang, S.; Ge, W.-y.; Chen, H.-h.; Xu, W.-l. Investigation of soil and groundwater environment in urban area during post-industrial era: A case study of brownfield in Zhenjiang, Jiangsu Province, China. China Geol. 2019, 2, 501–511. [Google Scholar] [CrossRef]
  18. Wang, Y.; Liu, X.; Zhang, H.; Duan, L. Pollution characteristics and population health risks of polycyclic aromatic hydrocarbons (PAHs) in coking contaminated soils. Environ. Chall. 2022, 9, 100613. [Google Scholar] [CrossRef]
  19. Ma, B.; Zeng, W.; Xie, Y.; Wang, Z.; Hu, G.; Li, Q.; Cao, R.; Zhuo, Y.; Zhang, T. Boundary delineation and grading functional zoning of Sanjiangyuan National Park based on biodiversity importance evaluations. Sci. Total Environ. 2022, 825, 154068. [Google Scholar] [CrossRef]
  20. Liu, X.; Chen, S.; Yan, X.; Liang, T.; Yang, X.; El-Naggar, A.; Liu, J.; Chen, H. Evaluation of potential ecological risks in potential toxic elements contaminated agricultural soils: Correlations between soil contamination and polymetallic mining activity. J. Environ. Manag. 2021, 300, 113679. [Google Scholar] [CrossRef]
  21. Yang, Z.B.; Qin, Z.H.; Wang, G.C.; Li, C.L. Environmental Effects of Water Product from Coalbed Methane Wells: A Case Study of the Songhe Well Group, Western Guizhou, China. Nat. Resour. Res. 2021, 30, 3747–3760. [Google Scholar] [CrossRef]
  22. Lin, C.; Chen, J.; Xu, J.; Li, Y.; Liu, Y.; Lin, H. Distribution and risk assessment of heavy metals in the economic fish of the Southern Fujian Province. Environ. Toxicol. Pharmacol. 2022, 92, 103834. [Google Scholar] [CrossRef]
  23. Miao, F.; Zhang, Y.; Li, Y.; Liang, X.; Lin, Q.; Zhou, Y. Establishing a weighted methodology for human health risk assessment of cadmium based on its equilibrium speciation in groundwater. J. Clean. Prod. 2021, 322, 129053. [Google Scholar] [CrossRef]
  24. Wu, J.; Jia, R.T.; Xuan, H.; Zhang, D.S.; Zhang, G.M.; Xiao, Y.T. Priority Soil Pollution Management of Contaminated Site Based on Human Health Risk Assessment: A Case Study in Southwest China. Sustainability 2022, 14, 3663. [Google Scholar] [CrossRef]
  25. Sun, J.; Pan, L.; Tsang, D.C.W.; Zhan, Y.; Zhu, L.; Li, X. Organic contamination and remediation in the agricultural soils of China: A critical review. Sci. Total Environ. 2018, 615, 724–740. [Google Scholar] [CrossRef]
  26. Hung, H.-W.; Daniel Sheng, G.; Lin, T.-F.; Su, Y.; Chiou, C.T. The organic contamination level based on the total soil mass is not a proper index of the soil contamination intensity. Environ. Pollut. 2009, 157, 2928–2932. [Google Scholar] [CrossRef]
  27. Hsu, C.Y.; Wu, P.Y.; Chen, Y.C.; Chen, P.C.; Guo, Y.L.; Lin, Y.J.; Lin, P.P. An integrated strategy by using long-term monitoring data to identify volatile organic compounds of high concern near petrochemical industrial parks. Sci. Total Environ. 2022, 821, 153345. [Google Scholar] [CrossRef]
  28. Lei, R.R.; Sun, Y.M.; Zhu, S.; Jia, T.Q.; He, Y.C.; Deng, J.L.; Liu, W.B. Investigation on Distribution and Risk Assessment of Volatile Organic Compounds in Surface Water, Sediment, and Soil in a Chemical Industrial Park and Adjacent Area. Molecules 2021, 26, 5988. [Google Scholar] [CrossRef]
  29. Ran, H.; Deng, X.; Guo, Z.; Hu, Z.; An, Y.; Xiao, X.; Yi, L.; Xu, R. Pollution characteristics and environmental availability of toxic elements in soil from an abandoned arsenic-containing mine. Chemosphere 2022, 303, 135189. [Google Scholar] [CrossRef]
  30. Chai, L.; Wang, Y.; Wang, X.; Ma, L.; Cheng, Z.; Su, L. Pollution characteristics, spatial distributions, and source apportionment of heavy metals in cultivated soil in Lanzhou, China. Ecol. Indic. 2021, 125, 107507. [Google Scholar] [CrossRef]
  31. Engel, C.A.R.; Straathof, A.J.J.; Zijlmans, T.W.; van Gulik, W.M.; van der Wielen, L.A.M. Fumaric acid production by fermentation. Appl. Microbiol. Biotechnol. 2008, 78, 379–389. [Google Scholar] [CrossRef]
  32. Rajabi, H.; Mosleh, M.H.; Mandal, P.; Lea-Langton, A.; Sedighi, M. Emissions of volatile organic compounds from crude oil processing—Global emission inventory and environmental release. Sci. Total Environ. 2020, 727, 138654. [Google Scholar] [CrossRef] [PubMed]
  33. Tang, T.; Shen, Y.; Liu, X.; Zhang, Z.; Xu, J.; Zhang, Z. The effect of horizontal freezing on the characteristics of water migration and matric suction in unsaturated silt. Eng. Geol. 2021, 288, 106166. [Google Scholar] [CrossRef]
  34. Balseiro-Romero, M.; Monterroso, C.; Casares, J.J. Environmental Fate of Petroleum Hydrocarbons in Soil: Review of Multiphase Transport, Mass Transfer, and Natural Attenuation Processes. Pedosphere 2018, 28, 833–847. [Google Scholar] [CrossRef]
  35. Zhao, S.; Wang, J.; Feng, S.; Xiao, Z.; Chen, C. Effects of ecohydrological interfaces on migrations and transformations of pollutants: A critical review. Sci. Total Environ. 2022, 804, 150140. [Google Scholar] [CrossRef] [PubMed]
  36. Jiang, L.; Qin, A.; Li, L.; Mei, G.; Li, T. Coupled consolidation via vertical drains in unsaturated soils induced by time-varying loading based on continuous permeable boundary. Geotext. Geomembr. 2022, 50, 383–392. [Google Scholar] [CrossRef]
  37. Jia, H.; Gao, S.; Duan, Y.; Fu, Q.; Che, X.; Xu, H.; Wang, Z.; Cheng, J. Investigation of health risk assessment and odor pollution of volatile organic compounds from industrial activities in the Yangtze River Delta region, China. Ecotoxicol. Environ. Saf. 2021, 208, 111474. [Google Scholar] [CrossRef] [PubMed]
  38. Xu, G.M.; Geng, S.Y.; Cao, W.; Zuo, R.; Teng, Y.G.; Ding, A.Z.; Fan, F.Q.; Dou, J.F. Vertical distribution characteristics and interactions of polycyclic aromatic compounds and bacterial communities in contaminated soil in oil storage tank areas. Chemosphere 2022, 301, 134695. [Google Scholar] [CrossRef]
  39. Chen, L.; Han, L.; Feng, Y.; He, J.; Xing, B. Soil structures and immobilization of typical contaminants in soils in response to diverse microplastics. J. Hazard. Mater. 2022, 438, 129555. [Google Scholar] [CrossRef]
  40. Falciglia, P.P.; Giustra, M.G.; Vagliasindi, F.G.A. Low-temperature thermal desorption of diesel polluted soil: Influence of temperature and soil texture on contaminant removal kinetics. J. Hazard. Mater. 2011, 185, 392–400. [Google Scholar] [CrossRef]
  41. Zhu, H.; Ye, S.; Wu, J.; Xu, H. Characteristics of soil lithology and pollutants in typical contanmination sites in Chins. Earth Sci. Front. 2021, 28, 026–034. [Google Scholar] [CrossRef]
Figure 1. Location and floor plan of the study area.
Sustainability 14 12476 g001
Figure 2. Location of sampling/testing point in the fumaric acid brownfield site.
Sustainability 14 12476 g002
Figure 3. VOCs in the atmosphere of the fumaric acid brownfield site.
Sustainability 14 12476 g003
Figure 4. Characterization of organic contaminants in surface soil ((a) content of contaminants, (b) number of times contaminants exceed limits).
Sustainability 14 12476 g004
Figure 5. Characterization of organic contaminants in deep soils ((a) contaminant content; (b) the multiplicity of contaminants over Pi).
Sustainability 14 12476 g005
Figure 6. Single factor index evaluation results (surface soil). ((a) 0–0.5 m in reactor 1# area; (b) 2.0–2.5 in distillation area; (c) 2.5–3.0 in distillation area).
Sustainability 14 12476 g006
Figure 7. VOCs single factor index evaluation results (deep soil).
Sustainability 14 12476 g007
Figure 8. The results of Nemero integrated pollution evaluation ((a): p-value; (b): soil contamination level).
Sustainability 14 12476 g008
Table 1. Characteristics of the soils in the study area by layer.
NameThickness (m)Depth (m)Bottom Relative Elevation (m)
Layer of plain filling (Q4ml)0.40–9.200.40–9.20341.33–345.90
Layer of silt (Q4al + pl)5.50–14.107.80–16.20330.33–340.89
Layer of fine sand (Q4al + pl)1.00–4.2010.10–19.30330.29–336.07
Layer of silty clay (Q3al + pl)5.30–10.2018.80–24.00320.95–328.17
Layer of medium sand (Q3al + pl)6.60–7.5027.60–29.30317.54–320.95
Table 2. Grading criteria for soil environmental quality evaluation (Single factor index method).
LevelPiEvaluation Level
Pi ≤ 1Uncontaminated
1 < Pi ≤ 2Slight
2 < Pi ≤ 3Mild
3 < Pi ≤ 5Moderate
Pi > 5Severe
Table 3. Grading criteria for soil environmental quality evaluation (Nemero comprehensive pollution index method).
LevelPEvaluation Level
P ≤ 0.7Uncontaminated
0.7 < P ≤ 1Slight
1 < P ≤ 2Mild
2 < P ≤ 3Moderate
P > 3Severe
Table 4. pH and mechanical composition of the surface soil.
TypepHSoil Texture
CON18.64Silt
DT18.96Silt loam soil
DT29.48Silty
Table 5. Phenological characteristics of soils.
TypeColorLithologyMoistureOdor
Depth (m)Reactor Area 1Distillation AreaReactor Area 1Distillation AreaReactor Area 1Distillation AreaReactor Area 1Distillation Area
0–1.0tan/silt/drier/slightly pungent odor/
1.1–2.0tan/silt/drier/slightly pungent odor/
2.1–3.0tanblack brownsiltsandy soildrierdrierslightly pungent odorpungent odor
3.1–4.0black brownblack brownmudsandy soilwetterwetslightly pungent odorpungent odor
4.1–5.0tanlight black-brownsandy soilsandy soilwetterwetterslightly pungent odorpungent odor
5.1–6.0tanlight black-brownsandy soilsandy soil (with 2 cm silt)wet
(near muddy water)
wetno pungent odorpungent odor
6.1–7.0/light black-brown/sand and soil mixture/wetter/pungent odor
7.1–8.0/light black-brown/sand and soil mixture(more coarse sand)/wet/slightly pungent odor
8.1–9.0/light black-brown/sand and soil mixture(more silver sand)/wet/slightly pungent odor
9.1–10.0/light black-brown/silver sand/wet (like thin mud)/minimal pungent odor
Note: (a) The sampling depth at reactor area 1 was 0–6.0 m. (b) Since the distillation area was a mixed layer of soil and stone and asphalt layer at 0–2.0 m, the sampling depth of this area was 2.1–10.0 m.
Publisher’s Note: MDPI stays neutral with regard to jurisdictional claims in published maps and institutional affiliations.

