
Study on Phosphorus Removal Pathway in Constructed Wetlands with Thermally Modified Sepiolite
1
Key Laboratory of Integrated Regulation and Resource Development on Shallow Lakes, Ministry of Education, Hohai University, Nanjing 210098, China
2
College of Environment, Hohai University, Nanjing 210098, China
*
Author to whom correspondence should be addressed.
Sustainability 2022, 14(19), 12535; https://doi.org/10.3390/su141912535
Submission received: 17 August 2022
/
Revised: 24 September 2022
/
Accepted: 27 September 2022
/
Published: 1 October 2022
(This article belongs to the Special Issue Sustainable Advanced Water Treatment Technologies)
Abstract
:Constructed wetlands, as natural sewage treatment ecosystems, have been widely used in the fields of rural domestic sewage and sewage plant tailwater treatment. However, the synchronous removal of phosphorus in most constructed wetlands is not ideal. This study aimed to prepare thermally modified sepiolites with high phosphorus adsorption capacities and design a constructed wetland based on them. Thermal modification was adopted to enhance the adsorption capacity of sepiolite based on its high specific surface area and ion exchange capacity. The physicochemical properties and adsorption performance of thermally modified sepiolite were studied. The results showed that the specific surface area and adsorption capacity of thermally modified sepiolite were higher than those of natural sepiolite, reaching 19.494 mg·g−1. The concentration of effluent and the removal of constructed wetlands based on thermally modified sepiolite was 0.07 mg·g−1 and 91.05%. An analysis of the phosphorus forms in constructed wetlands proved that the main phosphorus removal pathway is the adsorption of substrate, and the form of phosphorus was mainly Ca/Mg-P and Fe/Al-P.
1. Introduction
With the development of the social economy and large-scale agricultural and industrial production, a large amount of nitrogen and phosphorus pollutants are discharged into water bodies, which seriously endangers production and domestic water safety [1]. At present, the processes commonly used for phosphorus removal are coagulation sedimentation, ion exchange, electrodialysis, and biological methods [2,3,4,5]. However, most of these methods have high operational costs and are not suitable for the large-scale advanced treatment of phosphorus wastewater. Constructed wetlands (CW) have attracted much attention since the 1970s because of their low construction and operation costs, convenient maintenance, and environmental friendliness.
However, the application of constructed wetland technology worldwide has encountered many problems when dealing with nitrogen and phosphorus. Constructed wetlands have a good removal effect on COD (Chemical oxygen demand), BOD (Biochemical oxygen demand), SS (Suspended solids), and other pollutants, but the nitrogen and phosphorus removal effect is low [6,7,8]. According to reports, the nitrogen removal of most constructed wetlands is generally less than 30%, whereas the phosphorus removal of traditional constructed wetlands based on gravel is only approximately 15% [9,10]. The main mechanisms of phosphorus removal in constructed wetlands are natural sedimentation, absorption and the assimilation of plants, excessive absorption of phosphorus by denitrifying phosphate accumulating organisms (DPAO), and the adsorption of phosphorus by substrate, among which the most important part is the adsorption of phosphorus by the substrate [11]. At present, the main method to strengthen phosphorus removal in constructed wetlands is to study new absorbents for phosphate removal, such as fly ash, shale, dolomite, and kaoline [12,13,14,15,16,17]. Studies [14] have shown that slag, oyster shell, concrete and cinder have greater theoretical saturation adsorption capacity for TP (Total phosphorus). Zhen et al. [16] compared the removal effect and mechanism of phosphorus in the anaerobic digestion solution of swine wastewater by using zeolite, broken brick and oyster shell, etc. The experimental results showed that the removal effect of phosphorus by oyster shell was the best when the concentration was about 80 mg·L−1 and the removal was 90%. These adsorbents fixed P in sewage on the substrate surface through adsorption and chemical precipitation and achieved a good phosphorus removal effect, among which sepiolite is representative.
Sepiolite (SEP) is an inorganic magnesium-rich silicate clay mineral with a standard crystal chemical formula of Mg8[Si12O30][OH]4·8H2O [18]. According to the division of mineralogy, SEP is a kind of 2:1 layer of chain-like clay consisting of two layers of silicon oxygen tetrahedron sandwiched with a layer of magnesium oxygen octahedron, and the oxygen at the top angle of the silicon oxygen tetrahedron outside intersects with each other and forms a chain structure in the opposite direction, forming a series of 0.37 nm × 1.06 nm honeycomb pores [19,20]. SEP has a theoretical specific surface area of up to 900 m2/g, providing it with a strong adsorption capacity and numerous adsorption sites [21].
Previous studies on SEP have mainly focused on its performance in the laboratory instead of its practical application. Meanwhile, research on constructed wetlands also focuses on phosphorus removal performance. Many studies have shown that the phosphorus removal of CW is about 15–70%, which is greatly affected by the type of substrate material and temperature [22,23,24]. The mechanism of phosphorus removal by constructed wetland substrate was not clear and there were few studies in this field. It is speculated that the removal of phosphorus by constructed wetlands is a comprehensive process of physics, chemistry and biology, which can be roughly divided into three parts: (1) absorption and the assimilation of plants; (2) the normal absorption and excessive accumulation of phosphorus by phosphorus accumulating bacteria; (3) interception, filtration and the adsorption of substrates. However, the contribution of each part to phosphorus removal and how the phosphorus form changes in constructed wetlands are studied relatively infrequently.
Therefore, this paper intended to study the forms and distribution of phosphorus in constructed wetlands to reveal the pathway and mechanism of phosphorus removal in constructed wetlands. In this study, thermally modified sepiolite (T-SEP) was prepared and used to remove phosphorus from the effluent of a sewage treatment plant. Isotherm and kinetic models are discussed to explain the adsorption process. Characterization methods such as XRD (X-ray diffraction), FT-IR (Fourier transform infrared), and SEM (scanning electron microscope) were used to further understand the behavior and mechanism of adsorption. After thermal modification, SEP was used as a substrate material of constructed wetlands, and the removal efficiency of phosphorus, variation in pollutant concentration along the path, and form and distribution of phosphorous were studied to reveal the removal pathway of constructed wetlands based on T-SEP. Therefore, T-SEP was proved to have great potential for removal of phosphorus and constructed wetlands based on it had a strong ability to remove phosphorus.
2. Materials and Methods
2.1. Materials
Natural sepiolite (N-SEP) powder with a mesh number of 350 was provided by Chengyu Mining Co., Ltd. (Shijiazhuang City, China). All other chemicals in the study, including NH4Cl, HCl, NaOH, NaCl, KCl, CaCl2, Na2CO3, and Na2SO4, were purchased from Sinopharm Chemical Reagent Co., Ltd. (Beijing, China), were of AR grade, and were not subjected to further purification.
2.2. Modification of SEP
2.2.1. Purification of SEP
N-SEP was added to distilled water at a solid-liquid ratio of 1:10 and stirred in a beaker for 10 min. The solution was poured into a separating funnel and left to stand until stratification was not obvious. The underlying SEP solid was added to distilled water. This process was repeated several times until no stratification occurred. After centrifugation, the supernatant liquid was removed and the SEP was washed several times with distilled water. The solid product was dried in an oven at 120 °C for 24 h. The purified SEP was then ground into powder and sieved through a 200-mesh screen for use.
2.2.2. Thermal Modification
10.0 g of purified N-SEP was placed in muffle furnace and calcined at 700 °C for 4 h (heating rate was 5 °C/min). After natural cooling to room temperature, the samples were washed with distilled water, dried in an oven at 120 °C for 24 h, screened through a 200-mesh sieve, and T-SEP was prepared.
2.3. Characterization of T-SEP
The XRD test was carried out using a German Brook D8 X-ray diffractometer under the following conditions: Cu target, step 0.02°, scanning angle range 5–80°, and scanning speed 12°·min−1. Fourier transform infrared (FT-IR) spectra were recorded on a PerkinElmer 1725X FTIR spectrometer over the spectral range of 4000–400 cm−1 using KBr pellets. The Brunauer–Emmett–Teller (BET) specific surface area was obtained using a Micromeritics ASAP 2020 apparatus, and the porous characteristics of the composites were obtained using theBarrett Joyner–Halenda (Barret-Joyner-Halenda) method through standard nitrogen adsorption/desorption measurements. An FEI Quanta 200 field-emission scanning electron microscope (SEM) was used for morphological analysis.
2.4. Adsorption Experiments
An adsorption experiment was conducted by 0.1 g T-SEP in 50 mL simulated wastewater containing phosphorus, and the pH of the solution was adjusted with 0.1 mol·L−1 HCl or NaOH. The mixture was then stirred at 200 rpm for the desired time at 25 °C. After centrifugation at 5000 rpm for 10 min, the supernatant was filtered through a 0.45 μm membrane, and its concentration of phosphorus was analyzed using the molybdate photometric method. The amount of phosphorus adsorbed by the adsorbent (qe, mg·g−1) was calculated using Equation (1):
Additionally, the removal of phosphorus was estimated using Equation (2):
C0 and Ce represent the initial and final concentrations (mg·L−1) of ammonium ions in the solution, respectively. V represents the volume of the solution (mL), and m represents the dose of the adsorbent (g).
In kinetic studies, 0.1 g adsorbent was added to a conical flask with 50 mL of a 10.0 mg·L−1 nitrogen and phosphorus solution, with various contact times (1, 2, 5, 10, 30, 60, 90, 120, 180, 240, 300, 360, 480, and 600 min). The initial pH was adjusted to 7.0 ± 0.1, and the magnetic stirring speed was 200 rpm.
The experimental data were fitted to the pseudo-first-order, pseudo-second-order, and Elovich models, as shown in Equations (3)–(5).
where t is the adsorption time (min), qe and qt are the amount of nitrogen adsorbed on the adsorbent (mg·g−1) at equilibrium and at time t (min), respectively, and k1 (1·min−1) and k2 (1·min−1) are the adsorption rate constants of the pseudo-first-order and pseudo-second-order models, respectively.
Adsorption isotherm studies were conducted at different initial concentrations (0.5, 1, 2, 5, 10, 15, 20, 30, 40, 50, 80, 100, 150, and 200 mg·L−1). The other operating parameters were as follows: 50 mL of adsorption solution with 0.1 g adsorbent, the adsorption time was maintained at 10 h, the initial pH was fixed at 7.0 ± 0.1, and the magnetic stirring speed was 200 rpm.
The equilibrium data were fitted to the Langmuir, Freundlich, and Sips isotherm models, as shown in Equations (6)–(8):
Ce (mg·L−1) and qe (mg·g−1) are the nitrogen and phosphorus concentrations, respectively, which are the corresponding adsorption capacities at equilibrium. qm (mg·g−1) is the maximum adsorption capacity, and KL is the Langmuir adsorption equilibrium constant, which is related to the adsorption capacity. KF and n are constants in the Freundlich isotherm model that are related to the adsorption capacity and intensity, respectively.
2.5. Design of Constructed Wetlands
As shown in Figure 1, the system consisted of two horizontal subsurface wetlands, each of which was rectangular polyvinyl chloride(PVC) tanks with the same dimensions (length: 1.80 m, width: 0.30 m, height: 0.50 m). The devices were divided into three areas: water distribution, treatment, and catchment. A peristaltic pump was used for inlet water. The length of the distribution area and catchment area was 0.15 m, and the gravel size was 30–50 mm. The length of the treatment area was 1.50 m, the thickness of substrate was 0.40 m, and the height of the running water level was 0.35 m.
The substrates and particle sizes in the two constructed wetlands were as follows: (1) W-G was 1–2 mm gravel and (2) W-S was 1–2 mm T-SEP. Iris pseudacorus L., which has developed a root system, strong resistance to pollution and clean pollution, and salt and alkali resistance [25], was selected as a wetland plant in this experiment.
The experimental device was built in the ecological greenhouse on the 4th floor of the Environment Building in Hohai University, Nanjing, China (32°03′44″ N, 118°46′01″ E). The device was built and tested in May, and the stable operation began from June to May, during which the temperature varied from 2 °C to 37 °C. The inlet water of the constructed wetland was obtained from the effluent of the Jiangxinzhou sewage treatment plant in Nanjing. The relevant water quality parameters are listed in Table 1. Four different hydraulic loads were adopted, and one month was taken as an inlet cycle. The inlet flow rates were designed as 10.98, 14.63, 21.95 and 43.90 L/d, respectively, and the corresponding hydraulic retention times were four, three, two and one day, respectively. During the operation of the device, the continuous flow mode was adopted, and a peristaltic pump was used to maintain the constant inflow rate of the inlet water.
2.6. Samples Analysis
Every three days, 50 mL of water was collected from each sampling point at 9:00 a.m. After passing through a 0.22 μm filter membrane, various water quality indicators were detected. The concentration of TP was analyzed using the molybdate photometric method.
In this study, the method of phosphorus form analysis in fillers suggested by Forbes [26] was adopted. The wet sample of the same weight as the dried sample was placed into the centrifuge tube, and an appropriate amount of leaching solution was added for leaching. At the same time, parallel samples were taken and dried to the balance weight, and the moisture content was measured. The remaining sample was added to the next leaching solution and was extracted in successive steps. After leaching, the sample was centrifuged at 3000 r/min for 10 min to analyze the organophosphorus and total phosphorus in the leaching solution, and the remaining sample was added to the next leaching solution and extracted in successive steps. In addition, the unused substrate was used as blank samples, and the background values of various forms of phosphorus in each filler were determined by the aforementioned method. The increment of each form of phosphorus in substrate was then obtained by subtracting the corresponding background values from the measured values of each form of phosphorus.
The plants in this experiment were harvested, washed, air dried, cut into small segments, and placed in the oven to dry to the balance weight. The biomass dry weight of the plants was then weighed. The dried samples were crushed and passed through a 100-mesh sieve. After digestion with H2SO4 and H2O2, the phosphorus content in the plant was determined by molybdate photometry.
After the operation of constructed wetlands, substrates with a depth of 10–15 cm were collected at each water intake. Collected samples were extracted using a bacterial genomic DNA extraction kit (Omega Bio-tek, Norcross, GA, USA). The bacterial 16S rRNA was then subjected to PCR amplification using the bacterial fused primers 338F (5′-ACTCCTACGGGAGCCAGC-3′) and 1492R (5′-GGTTACCTTCTTACGACTT-3′). The amplified products were detected by electrophoresis on 1% agarose gel. Purified DNA was sequenced using the Illumina Mi-Seq platform.
2.7. Statistical Analysis
Microsoft Excel 2016 and IBM SPSS Statistics 23.0 were used to analyze the experimental data, and three stable values were recorded for each measurement. The mean value and standard deviation were calculated.
3. Results and Discussion
3.1. Optimum Parameters for Preparation of T-SEP
The adsorption capacity of phosphorus by T-SEP calcined at different temperatures was shown in Figure 2a. According to the figure, the adsorption capacity of T-SEP increased with the increase of temperature and reached the maximum at 700 °C (18.634 mg/g). When the calcination temperature was below 300 °C, the morphology and structure of SEP hardly changed. Between 300 °C and 500 °C, the free water and impurities in SEP evaporated due to calcination, and the channels in SEP crystal were unblocked. As the temperature continued to rise to 700 °C, the crystal water and binding water in SEP crystal were removed, and the adsorption capacity was further improved. However, when the temperature exceeded 700 °C, the phosphorus adsorption capacity did not increase much, because the impurities and water in SEP have been almost completely removed at a lower temperature, and further increasing the temperature destroyed the chain layer structure of SEP instead of improving its adsorption performance, which is similar to that of previous studies [27].
Figure 2b showed the adsorption capacity of T-SEP at a calcination temperature of 700 °C and a different calcination time (one, two, three, four, and five hours). It could be observed form Figure 2b that prolonging the calcination time was beneficial to improving the adsorption performance of T-SEP before the calcination time reached 4 h. The adsorption capacity would be decreased in case the calcination time exceeded 4 h. The calcination temperature of 700 °C and calcination time of four hours were selected to be the optimum parameters for subsequent experimental research.
3.2. Characterization of T-SEP
X-ray diffraction diagrams of N-SEP and T-SEP are shown in Figure 3a. The diffraction pattern for SEP has peaks at 7.21°, 20.74°, and 26.48°, corresponding to the (100), (131), and (080) planes of SEP according to the PDF card [13-0595]. Compared with N-SEP, 2θangel at the characteristic diffraction peaks of T-SEP remains unchanged, which proves that modifications can generally preserve the structure of SEP [28]. However, the intensity of the peaks at T-SEP was reduced, which could be ascribed to the calcium ions entering the SEP ion channels, and calcination changes the structure of some channels. The peaks appearing at 28.89° can be indexed to CaCO3 (JCPDS [85-1108]). The characteristic diffraction peaks of CaCO3 at T-SEP were significantly enhanced, which suggests that Ca was successfully loaded onto the surface of the SEP. Active calcium carbonate covers the surface of SEP, forming active adsorption sites and carbonate hydroxyapatite precipitation with phosphate [29].
An FT-IR analysis was performed to verify the change in SEP during the modification process. As shown in Figure 3b, the FT-IR spectra of SEP before and after modification changed slightly, indicating that the modification process did not change the basic structure of the adsorbent. The peaks at 3694 cm−1, 3693 cm−1 and 3695 cm−1 were caused by the tensile vibration of hydroxy (V-OH) connected to octahedral Mg2+, which is the structural water of SEP [30,31]. The peaks at 3437 cm−1, 3420 cm−1, 3427 cm−1 and 3438 cm−1 are ascribed to vibrations caused by the O-H stretching of adsorbed water. The FT-IR spectra of T-SEP did not contain signals associated with structural water (3695–3693 cm−1), indicating that the thermal modification removed the structural water from the SEP structure. Silicate belts were observed in the range of 1200–400 cm−1. The peak at 1073 cm−1 represents the Si-O-Si group tensile vibration of the Si-O bond in the tetrahedral band. The characteristic peaks at 509 cm−1 and 447 cm−1 could be assigned to the bending vibrations of the octahedral zones Si-O-Al and Si-O-Si of SEP, respectively [32,33]. The peaks at 879 cm−1 and 755 cm−1 correspond to the bending vibration of Si-O in the tetrahedral zone and the stretching vibration of Mg-O in the octahedral zone, respectively, which reflect the skeletal structure of SEP.
The specific surface area and pore size distribution of the samples were calculated using the multi-point BET method, and the pore volumes of the samples were calculated using the adsorption capacity at a relative pressure P/P0 = 0.99. The pore size distribution and surface properties of the SEP are shown in Figure 3c,d and Table 2, respectively. Table 3 shows that the specific surface area of T-SEP increased from 12.84 m2·g−1 to 30.41 m2·g−1, and the average pore size increased from 7.37 nm to 12.65 nm; the pore volume increased from 0.0083 cm3·g−1 to 0.0209 cm3·g−1, proving that the specific surface area, pore size and pore volume of the T-SEP was improved, which gives it a stronger adsorption capacity.
As shown in Figure 3c,d, the pore size distributions of SEP and T-SEP are mainly mesopores between 2–50 nm, with a small number of micropores and macropores. Compared with N-SEP, the number of micropores in T-SEP decreased, whereas the number of macroporous and mesoporous pores increased, which could be ascribed to calcination. Owing to the removal of adsorbed, bound, and crystal water, the number of mesopores and macropores increased.
As seen from Figure 3e,f, SEP and T-SEP was an aggregation of fiber bundles, needles, hairs, and sheets, and was covered with impurities, such as talc and calcite, which may affect its adsorption capacity. The surface of the T-SEP was relatively smooth, and the impurities were reduced. The fiber bundle, needle, hair, and flake aggregate structures were looser. The linear structure of T-SEP was broken, and the aggregate was significantly reduced because the surface structure of SEP partially collapses as a result of the thermal modification.
3.3. Adsorption Properties of Phosphorus by T-SEP
3.3.1. Adsorption Kinetics
Figure 4a shows the pseudo-first order, pseudo-second order and Elovich’s kinetic model of the adsorption process of phosphorus by T-SEP. The relevant kinetic model parameters are shown in Table 3. It is obvious that the adsorption rate of phosphorus was very rapid in the first 100 min, yet decreased and gradually tended toward equilibrium after 200 min, which can be explained by the concentration difference in the solution. The adsorption process can be divided into three main steps: (1) external particle diffusion, (2) internal particle diffusion, and (3) adsorption reaction. The initial controlling step of the adsorption process was the external diffusion stage of the particles, the concentration of adsorbent in the solution was high, and the concentration of phosphorus on the surface of T-SEP was 0. The concentration difference between the solid and liquid phases formed the driving force, and phosphorus in the solution migrated to the liquid film on the surface of the adsorbent, hence the adsorption rate was rapid in this stage. As adsorption progressed, the concentration of phosphorus between the solid and liquid reached equilibrium, and the controlling step of adsorption was the internal particle diffusion and adsorption reaction. The reaction rate of these two steps was slower than that of the first stage, thus the adsorption rate also decreased [34].
3.3.2. Adsorption Isotherm
As shown in Figure 4b, the Langmuir, Freundlich, and Sips isotherm models were used to describe the adsorption process of phosphorus by SEP, and the relevant parameters were listed in Table 4. The maximum adsorption capacities for phosphorus was 19.494 mg·g−1. Compared with the Freundlich model (R2 was 0.974), the adsorption processes of phosphorus were more consistent with the Langmuir and Sips models (R2 was 0.989 and 0.993), which indicated that the adsorption of phosphorus by SEP may be dominated by monolayer and chemical adsorption. The 1/n parameter in the Freundlich model reflected the degree of favorable adsorption. When n > 1, adsorption was preferential, and, it was opposite when n < 1 [35]. The n values of SEP in this experiment were greater than 1, which indicated that the adsorption of phosphorus was preferential.
3.4. Phosphorus Removal Effect of T-SEP Substrate Constructed Wetlands
3.4.1. Effect of Hydraulic Retention Time on Total Phosphorus Concentration
The concentration of TP in inflow and outflow of the constructed wetlands based on gravel and SEP and its removal rate at different hydraulic retention times were shown in Figure 5a. The average effluent concentration of TP was 0.39~0.64 mg·L−1 in W-G and 0.07~0.24 mg·L−1 in W-S. It was apparent that removal of TP in W-S was superior to that in W-G, which is related to the excellent adsorption performance of T-SEP. It could be seen that removal of TP was positively correlated with HRT, because removal of phosphorus was related to the adsorption of substrate in the constructed wetland. Therefore, the reduction of HRT reduced the contact time of the substrate and microorganism to the pollutants.
However, excessive HRT may also cause sewage retention and the consumption of DO in the constructed wetlands, resulting in the anaerobic state of the system Additionally, the adsorption capacity of phosphorus reached saturation, and the adsorption was difficult to improve further. Therefore, in the actual operation of the constructed wetlands, the appropriate HRT should be selected according to the specific situation. In this experiment, four days was the best.
3.4.2. Variation of Total Phosphorus along the Way
The variation of TP concentration along the way of W-G and W-S is shown in Figure 5b. The total phosphorus was rapidly adsorbed and degraded in the first quarter of the system, which decreased from the initial 0.48 mg·L−1 to 0.16 mg·L−1, accounting for 72.73% of TP removal in the constructed wetlands. This indicated that in the front of the reactor, the absorption of substrate, the absorption and transformation of plants and the assimilation of microorganisms happened very violently. The TP removal in the second half of the constructed wetlands was mild, mainly to ensure the stability of effluent water quality.
3.4.3. Variation of Phosphorus Removal in Four Seasons
The variation of phosphorus removal in different seasons is shown in Figure 5c. It can be observed that the removal efficiency in W-S was obviously higher than that in W-G, which should be due to the adsorption of SEP. Another noteworthy phenomenon is that the phosphorus removal effect of W-G had an obvious seasonal effect, but the effluent of W-S was very stable. The phosphorus removal efficiency of W-G in winter was only 23.49%, which was only 1/3 of that in summer (63.28%). This phenomenon implied that the plant absorption and enrichment is one of the main pathways of phosphorus removal in W-G, and phosphorus removal is greatly affected by plant death in winter. Conversely, plants account for only a small part of the phosphorus removal by W-S, so the effect of phosphorus removal in winter is only slightly reduced.
3.5. Analysis of Phosphorus Removal Pathway in Constructed Wetland
3.5.1. Spatial Distribution and Form of Phosphorus in Substrate
After one year of operation, the adsorption amount of phosphorus in the substrate basically reached saturation. After sampling, a continuous hierarchical extraction analysis was carried out. The experimental results are shown in Figure 6a.
In W-G, the forms of phosphorus were mainly water-soluble phosphorus and organophosphorus, which indicated that phosphorus removal was mainly achieved through the biological phosphorus removal by DPAO and the surface adsorption of substrate in this system. However, the content of phosphorus in W-S was significantly higher than that in W-G, and the form of phosphorus was mainly calcium-magnesium bound phosphorus and iron-aluminum bound phosphorus, which further proved that the adsorption of phosphorus by substrate was the main way of phosphorus removal in constructed wetlands, and the co-precipitation of calcium and phosphorus played a key role in phosphorus removal.
In W-G and W-S, the contents of Org-P decreased along the way, and the contents of Org-P in the first quarter of the constructed wetlands were 5.46 and 3.28 mg·kg−1, respectively, while the contents of Org-P in the last quarter were only 0.86 and 0.68 mg·kg−1. When sewage was flowing through the front of the constructed wetland, the sewage gradually went through aerobic and anoxic processes, so the concentration of organophosphorus decreased rapidly. The contents of Ca/Mg-P in W-G and W-S along the way were nearly constant, which was about 13~17 and 38~43 mg·kg−1. According to the spatial distribution characteristics of phosphorus, it can be seen that the phosphorus removal of the constructed wetland substrate was saturated.
3.5.2. Analysis of Phosphorus Content in Plants
According to Figure 6b, plant total phosphorus content in W-G and W-S had an obvious seasonal effect, and plant total phosphorus content in W-S was slightly higher than that in W-G. The plant total phosphorus content of W-G in summer, autumn, winter and spring was 1243, 312, 234 and 847 mg, respectively, and that of W-S was 1243, 1357, 357, 198 and 921 mg, respectively. The phosphorus content of plants varied greatly in different periods. This phenomenon may be due to the different ways of phosphorus removal in different seasons. In winter, large amounts of phosphorus was transferred to the roots to conserve nutrients; In the summer and autumn, phosphorus was transferred to the stems and leaves for growth.
3.5.3. Analysis of Phosphorus Removal Pathway in Constructed Wetland
There are two main methods of phosphorus removal in constructed wetlands, which are adsorption and precipitation of substrate and uptake and absorption of plants. Microbial synthesis also plays a role in the initial stage of initiation. Among them, the absorption and assimilation of plants synthesizes phosphorus into organic components such as ATP, DNA and RNA, which can be partially removed from the system by plant harvesting. Microbial synthesis includes the normal assimilation and absorption of phosphorus by microorganisms and the excessive uptake of phosphorus by phosphorus accumulating bacteria.
The system phosphorus removal pathway analysis is shown in Table 5. Other methods of phosphorus removal in the table include system interception of phosphorus removed by suspended matter and the excessive uptake of phosphorus by phosphorus accumulating bacteria normally assimilated and absorbed by phosphorus stored in the underground part of plants.
According to Table 5, the main phosphorus removal pathway in W-G and W-S is adsorption of substrate, and the proportion is 67.2% and 78.2%, respectively. The phosphorus removal by substrate and total phosphorus removal are both significantly higher than those in W-G, which can be attributed to the superior adsorption of T-SEP in W-S. The phosphorus removal by plants accounts for about 15% of the total phosphorus removal, which cannot be ignored, and has a significant seasonal effect. However, the CW based on T-SEP has a more stable operation effect throughout the year, and still has a better removal effect in winter by virtue of substrate adsorption.
As shown in Figure 7, The distribution of influent phosphorus mainly included effluent, plant absorption, microbial absorption and accumulation, substrate adsorption and sedimentation. Phosphorus sedimentation in CW referred to the process of phosphorus storage in wetland through the physical action caused by soluble phosphate in water.
Soluble phosphate (HPO42− and H2PO4−) was absorbed and assimilated into the organic components of plants. The potential rate of phosphorus uptake by plants was limited by their net growth and the mass fraction of phosphorus in plant tissues. The storage capacity of phosphorus in plants depended on the mass fraction of phosphorus in plant tissues and the ultimate biomass accumulation potential. This study emphasized the effect of seasons, and obviously the plants were more vigorous in spring and summer than in autumn and winter, during which temperature is the main controlling factor.
The effects of microorganisms on phosphorus included normal absorption and excessive accumulation. The normal absorption of phosphorus by microorganisms can be divided into two types: autotrophic microorganisms and heterotrophic microorganisms, the former requiring high water temperature and sufficient sunlight, the latter requiring appropriate organic carbon sources. The excess accumulation of phosphorus depended on the over-uptake of phosphorus in aerobic environment and the release of phosphorus in anaerobic environment by DPAO, which usually absorbed much more phosphorus than it released.
From the material accounting of phosphorus, it could be seen that the adsorption of phosphorus by substrate was the main removal pathway of constructed wetland. Most of the phosphorus adsorbed by the substrate was stored in the form of Fe/Al-P and Ca/Mg-P. Compared with other material, the content of Ca/Mg-P in SEP was higher, which was mainly due to Mg2+ in SEP crystals and Ca introduced by thermal modification.
3.5.4. Microbial Community Structure of CW
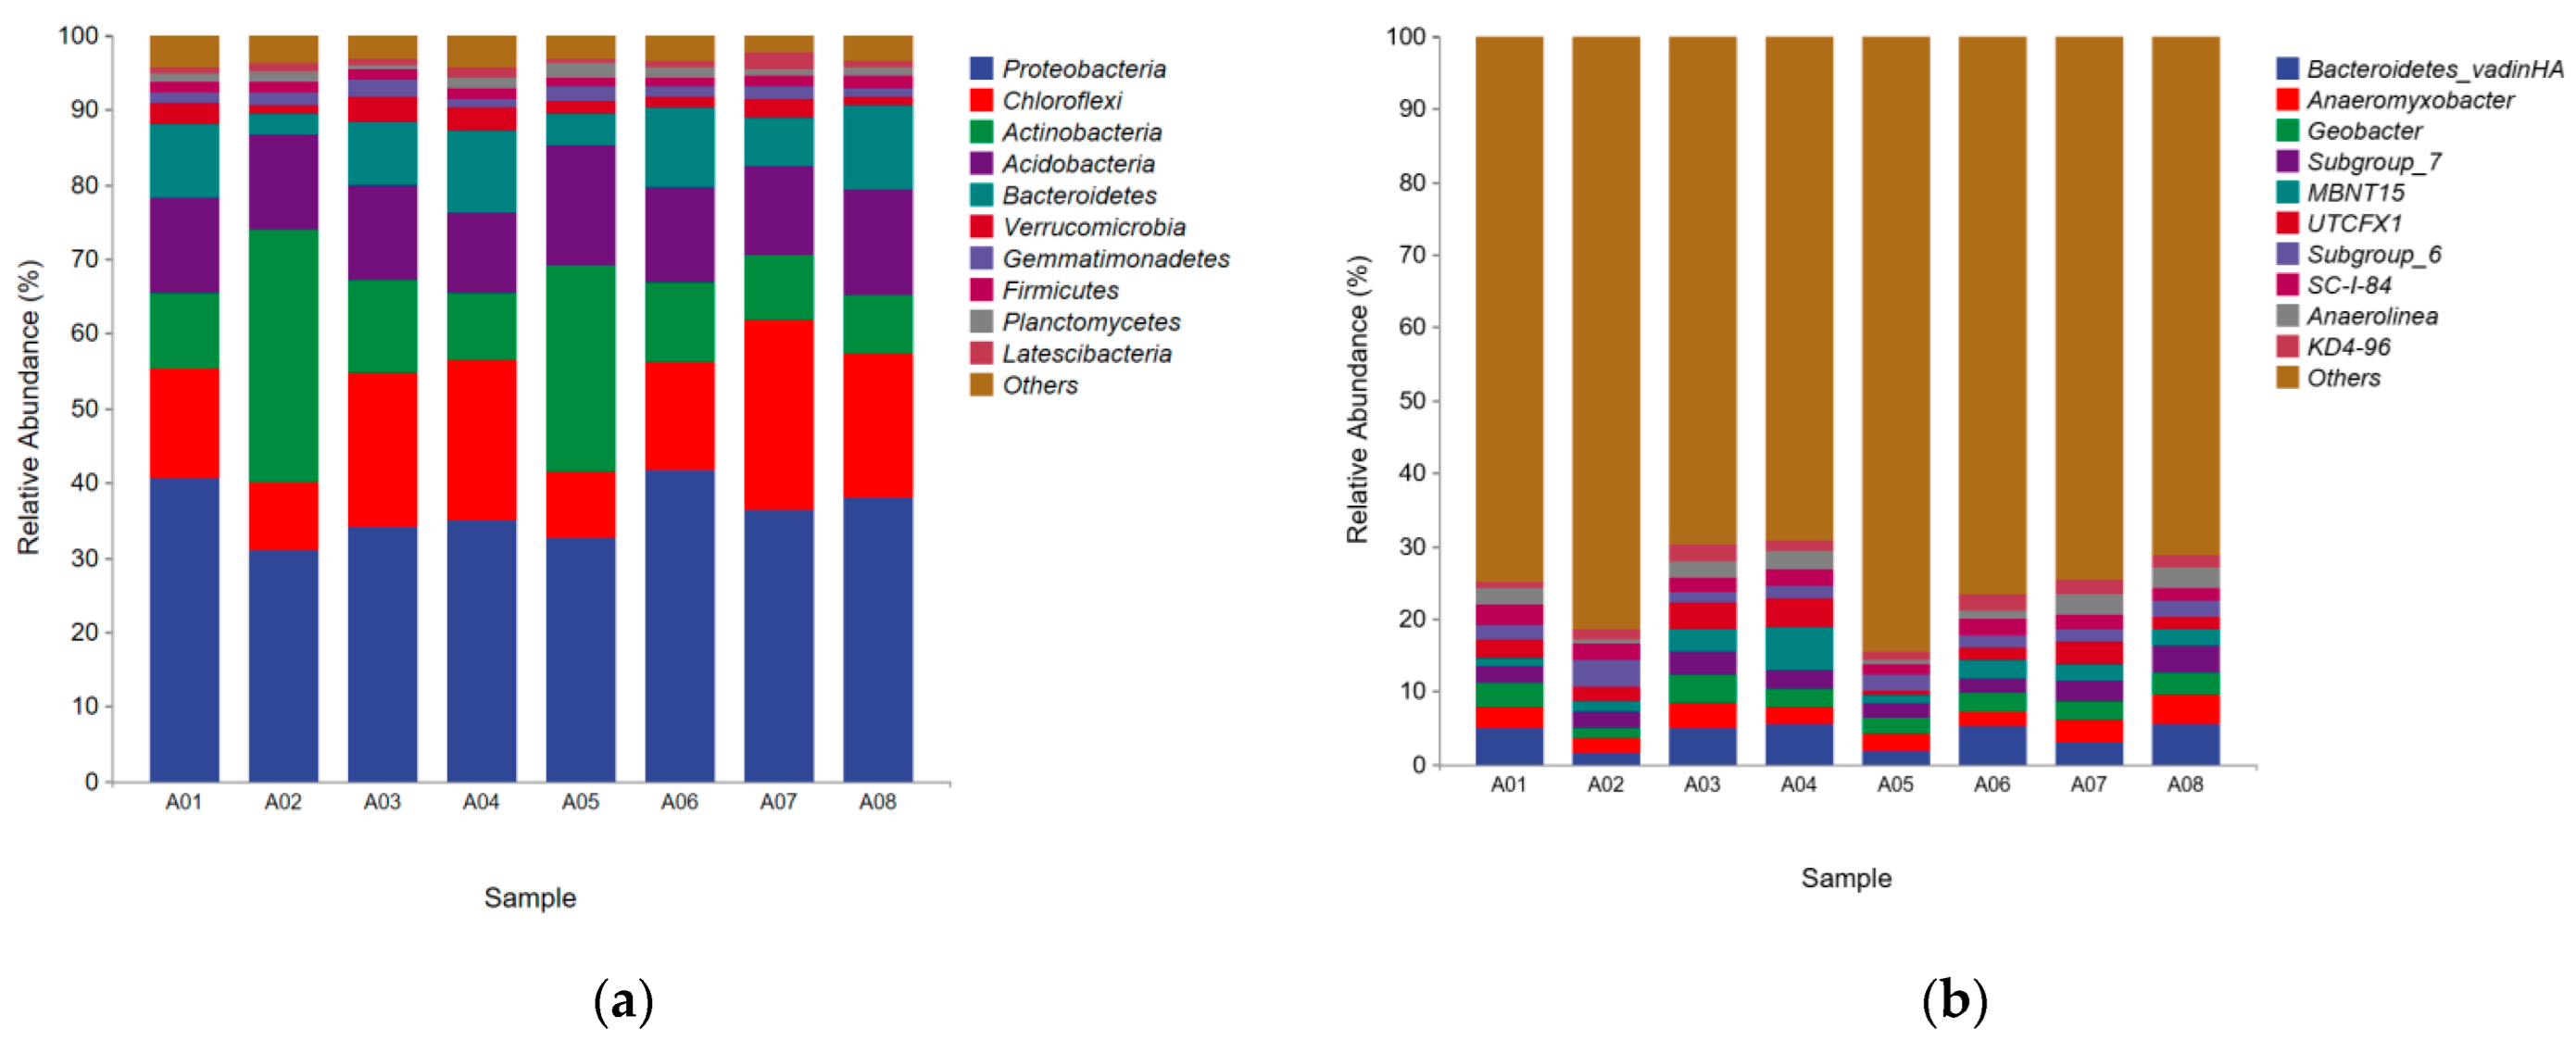
As shown in Figure 8a, at phylum level, the 10 phyla with the highest relative abundance were Proteobacteria (31.06–41.76%), Chloroflexi (8.73–21.52%), Actinobacteria (7.92–33.97%), Acidobacteria (10.93–14.91%), Bacteroides (2.89–10.97%), Verrucomicrobia (1.72–3.38%), Gemmatimonadetes (1.21–1.49%), Firmicutes (0.61–1.18%), Planctomycetes (0.68–1.39%), and Latescibacte Ria (0.61–2.08%), accounting for 95.69–97.21% of the microbial community.
Numerous studies have shown that Proteobacteria contain most of the bacteria with a nitrogen removal function, and Proteobacteria are the dominant flora in the four constructed wetlands; therefore, the constructed wetlands in this experiment have a good nitrogen removal function. Proteobacteria, Bacteroidetes, Actinobacteria, and Acidobacteria were the dominant bacteria responsible for nitrogen removal. Bacteroidetes are a large family of natural chemotrophic bacteria that mainly play a role in COD degradation. Some denitrifying bacteria and most nitrogen-fixing bacteria also belong to this type of microorganism and function in nitrogen removal. These bacteria also play an important role in nitrogen removal in the constructed wetlands. In addition, it is worth noting that the relative abundance of Acidobacteria in A02 is significantly higher than that in other samples. Combined with the best decontamination effect of W-S in previous experiments, we can speculate that Acidobacteria have an important contribution to the process of pollutant removal in constructed wetlands.
Figure 8b shows the top 10 species with relative abundances at the genus level in W-G and W-S. It can be seen that Bacteroidetes_vadinHA17, Anaeromyxobacter, Geobacter, Subgroup_7, MBNT15, UTCFX1, Subgroup_6, SC-I-84, Anaerolinea and KD4-96 were the dominant strains. However, the relative abundance of 17 genera of Bacteroides with the highest proportion was only 1.90–5.66%, while the 10 genera with the highest relative abundance only accounted for 18.6–25.01% of the microbial community, and there were no obvious dominant species, which indicated that the diversity of constructed wetlands at the genus level was high, and the differences between different constructed wetlands at the genus level were greater. This is similar to previous studies [36,37].
4. Conclusions
In this study, T-SEP was prepared, and its physicochemical and adsorption properties were studied. After modification, the structure of the SEP remained unchanged, the surface became smoother as the impurities were reduced, and the specific surface area slightly increased. The optimum calcination temperature was 700 °C and the optimum calcination time was 4 h. The maximum adsorption capacity of T-SEP for total phosphorus was 19.494 mg·g−1. T-SEP was used as a substrate of the constructed wetlands and the removal of phosphorus from the tail water of the sewage treatment plant. The concentration of effluent and the removal of constructed wetlands based on T-SEP was 0.07 mg·g−1 and 91.05%. After analysis of the constructed phosphorus forms in constructed wetlands, it can be concluded that the main phosphorus removal pathway is the adsorption of substrate.
Author Contributions
Conceptualization, P.G.; methodology, P.G.; software, C.Z.; validation, P.G. and C.Z.; formal analysis, P.G.; investigation, P.G. and C.Z.; resources, C.Z.; data curation, C.Z.; writing—original draft preparation, P.G.; writing—review and editing, C.Z.; visualization, C.Z.; supervision, C.Z.; project administration, P.G.; funding acquisition, P.G. All authors have read and agreed to the published version of the manuscript.
Funding
This study was financially supported by the Priority Academic Program Development of Jiangsu Higher Education Institutions (PAPD).
Institutional Review Board Statement
Not applicable.
Informed Consent Statement
Informed consent was obtained from all subjects involved in the study.
Data Availability Statement
Not applicable.
Conflicts of Interest
The authors declare that they have no known competing financial interests or personal relationships that could have influenced the work reported in this study.
References
- Wang, L.; Huang, L.J.; Yun, L.J.; Tang, F.; Zhao, J.H.; Liu, Y.Q.; Zeng, X.; Luo, Q.F. Removal of nitrogen, phosphorus, and organic pollutants from water using seeding type immobilized microorganisms. Biomed. Environ. Sci. 2008, 21, 150–156. [Google Scholar] [CrossRef]
- Li, X.Q.; Liu, W.Z.; Wang, A.J.; Gao, X.Y.; Tao, Y.; Ge, X.Y.; Lin, Z. Enhanced treatment of oily ink wastewater using a modified degreaser by nano-Fe3O4/Na2S2O8: Efficient coagulation and sedimentation. J. Water Process Eng. 2022, 47, 102675. [Google Scholar] [CrossRef]
- Mousavi, I.; Darian, J.T.; Mokhtarani, B. Enhanced nitrogen adsorption capacity on Ca2+ ion-exchanged hierarchical X zeolite. Sep. Purif. Technol. 2021, 264, 118442. [Google Scholar] [CrossRef]
- Saabas, D.; Lee, J. Recovery of ammonia from simulated membrane contactor effluent using bipolar membrane electrodialysis. J. Membr. Sci. 2022, 644, 120081. [Google Scholar] [CrossRef]
- Max, W.; Craig, S.C.; Jörg, E.D.; Konrad, K. A proposed nomenclature for biological processes that remove nitrogen. J. Environ. Sci. Water Res. Technol. 2017, 3, 10–17. [Google Scholar]
- Gong, L.; Zhao, X.; Zhu, G. Pathways of Nitrogen and Phosphorus Utilization and Removal from Cyanobacteria Wastewater by Combining Constructed Wetlands with Aerobic Reactors. Sustainability 2022, 14, 8819. [Google Scholar] [CrossRef]
- Tao, J.; Zhang, Y.; Zhang, T.; You, Z.; Shah, K.J.; Kim, H. Application of Reeds as Carbon Source for Enhancing Denitrification of Low C/N Micro-Polluted Water in Vertical-Flow Constructed Wetland. Appl. Sci. 2022, 12, 6756. [Google Scholar] [CrossRef]
- Wang, T.; Xiao, L.; Lu, H.; Lu, S.; Zhao, X.; Liu, F. Effect of the Influent Substrate Concentration on Nitrogen Removal from Summer to Winter in Field Pilot-Scale Multistage Constructed Wetland–Pond Systems for Treating Low-C/N River Water. Sustainability 2021, 13, 12456. [Google Scholar] [CrossRef]
- Xu, M.; Liu, W.J.; Li, C.; Xiao, C.; Ding, L.L.; Xu, K.; Geng, J.J.; Ren, H.Q. Evaluation of the treatment performance and microbial communities of a combined constructed wetland used to treat industrial park wastewater. Environ. Sci. Pollut. Res. 2016, 23, 10990–11001. [Google Scholar] [CrossRef]
- Zhou, X.; Wang, X.; Zhang, H.; Wu, H. Enhanced nitrogen removal of low C/N domestic wastewater using a biochar-amended aerated vertical flow constructed wetland. Bioresour. Technol. 2017, 241, 269–275. [Google Scholar] [CrossRef]
- Jakubaszek, A. Nitrogen and Phosphorus Accumulation in Horizontal Subsurface Flow Constructed Wetland. Agronomy 2021, 11, 1317. [Google Scholar] [CrossRef]
- Jamwalt, P.; Raj, A.V.; Raveendran, L.; Shirin, S.; Connelly, S.; Yeluripati, J.; Richards, S.; Rao, L.; Helliwell, R.; Tamburini, M. Evaluating the performance of horizontal sub-surface flow constructed wetlands: A case study from southern India. Ecol. Eng. 2021, 162, 106170. [Google Scholar] [CrossRef]
- Dong, S.C.; Ju, S.C.; Hong, J.L.; Heo, J.S. Phosphorus retention capacity of filter media for estimating the longevity of constructed wetland. Water Res. 2005, 39, 2445–2457. [Google Scholar]
- Zhang, Y.; Liu, X.; Fu, C.; Li, X.; Yan, B.; Shi, T. Effect of Fe2+ addition on chemical oxygen demand and nitrogen removal in horizontal subsurface flow constructed wetlands. Chemosphere 2019, 220, 259–265. [Google Scholar] [CrossRef]
- Guo, X.; Cui, X.; Li, H. Effects of fillers combined with biosorbents on nutrient and heavy metal removal from biogas slurry in constructed wetlands. Sci. Total Environ. 2020, 703, 134778. [Google Scholar] [CrossRef]
- Wang, Z.; Dong, J.; Liu, L.; Zhu, G.; Liu, C. Screening of phosphate-removing substrates for use in constructed wetlands treating swine wastewater. Ecol. Eng. 2013, 54, 57–65. [Google Scholar] [CrossRef]
- Wei, L.; Jian, Z.; Zhen, H.; Ji, M.; Yao, G. Phosphorus removal enhancement of magnesium modifiedconstructed wetland microcosm and its mechanism study. Chem. Eng. J. 2018, 335, 209–214. [Google Scholar]
- Marrakchi, F.; Khanday, W.A.; Asif, M.; Hameed, B.H. Cross-linked chitosan/sepiolite composite for the adsorption of methylene blue and reactive orange 16. Int. J. Biol. Macromol. 2016, 93, 1231–1239. [Google Scholar] [CrossRef]
- Darder, M.; López-Blanco, M.; Aranda, P.; Antonio, J.A.; Bravo, J.; Ruiz-Hitzky, E. Micro fibrous chitosan sepiolite nanocomposites. Chem. Mater. 2006, 18, 1602–1610. [Google Scholar] [CrossRef]
- Suárez, M.; García-Romero, E. Variability of the surface properties of sepiolite. Appl. Clay Sci. 2012, 67, 72–82. [Google Scholar] [CrossRef] [Green Version]
- Tartaglione, G.; Tabuani, D.; Camino, G. Thermal and morphological characterisation of organically modified sepiolite. Microporous Mesoporous Mater. 2008, 107, 161–168. [Google Scholar] [CrossRef]
- Cheng, G.; Li, Q.; Su, Z.; Sheng, S.; Fu, J. Preparation, optimization, and application of sustainable ceramsite substrate from coal fly ash/waterworks sludge/oyster shell for phosphorus immobilization in constructed wetlands. J. Clean. Prod. 2018, 175, 572–581. [Google Scholar] [CrossRef]
- Song, N.; Hursthouse, A.; McLellan, I.; Wang, Z. Treatment of environmental contamination using sepiolite: Current approaches and future potential. Environ. Geochem. Health 2021, 43, 2679–2697. [Google Scholar] [CrossRef] [PubMed]
- Yang, Y.; Zhao, Y.; Liu, R.; Morgan, D. Global development of various emerged substrates utilized in constructed wetlands. Bioresour. Technol. 2018, 261, 441–452. [Google Scholar] [CrossRef]
- Ajibade, F.O.; Wang, H.C.; Guadie, A.; Ajibade, T.F.; Fang, Y.K.; Sharif, H.M.A.; Liu, W.Z.; Wang, A.J. Total nitrogen removal in biochar amended non-aerated vertical flow constructed wetlands for secondary wastewater effluent with low C/N ratio: Microbial community structure and dissolved organic carbon release conditions. Bioresour. Technol. 2021, 322, 124430. [Google Scholar] [CrossRef]
- Forbes, M.G.; Dickson, K.L.; Saleh, F.; Waller, W.T.; Doyle, R.D.; Hudak, P. Recovery and Fractionation of Phosphorus Retained by Lightweight Expanded Shale and Masonry Sand Used as Media in Subsurface Flow Treatment Wetlands. Environ. Sci. Technol. 2005, 39, 4621–4627. [Google Scholar] [CrossRef]
- Kong, L.; Tian, Y.; Li, N.; Liu, Y.; Zhang, J.; Zhang, J.; Zuo, W. Highly-effective phosphate removal from aqueous solutions by calcined nano-porous palygorskite matrix with embedded lanthanum hydroxide. Appl. Clay Sci. 2018, 162, 507–517. [Google Scholar] [CrossRef]
- Imre, D.; László, T.; Antonio, F.; János, B.N. The structure of acid treated sepiolites: Small-angle X-ray scattering and multi MAS-NMR investigations. Appl. Clay Sci. 1999, 14, 141–160. [Google Scholar]
- Hong, S.H.; Akem, M.N.; Yoo, S.C.; Lee, C.G.; Park, S.J. Use of calcined sepiolite in removing phosphate from water and returning phosphate to soil as phosphorus fertilizer. J. Environ. Manag. 2020, 270, 110817. [Google Scholar] [CrossRef]
- Lays, B.F.; Tiago, V.; Fernanda, H.T.; Gimenez, J.C.F.; José, A.S.C.; Sandra, A.C. Organically modified sepiolite: Thermal treatment and chemical and morphological properties. Appl. Clay Sci. 2019, 179, 105149. [Google Scholar]
- Jin, X.; Yu, B.; Chen, Z.; Arocena, J.M.; Thring, R.W. Adsorption of Orange II dye in aqueous solution onto surfactant-coated zeolite: Characterization, kinetic and thermodynamic studies. J. Colloid Interface Sci. 2014, 435, 15–20. [Google Scholar] [CrossRef] [PubMed]
- Yin, H.; Kong, M.; Fan, C. Batch investigations on P immobilization from wastewaters and sediment using natural calcium rich sepiolite as a reactive material. Water Res. 2013, 47, 4247–4258. [Google Scholar] [CrossRef] [PubMed]
- Alshameri, A.; Yan, C.J.; Al-Ani, Y.; Dawood, A.S.; Ibrahim, A.; Zhou, C.Y.; Wang, H.Q. An investigation into the adsorption removal of ammonium by salt activated Chinese (Hulaodu) natural zeolite: Kinetics, isotherms, and thermodynamics. J. Taiwan Inst. Chem. Eng. 2014, 45, 554–564. [Google Scholar] [CrossRef]
- Uğurlu, M.; Karaoğlu, M.H. Adsorption of ammonium from an aqueous solution by fly ash and sepiolite: Isotherm, kinetic and thermodynamic analysis. Microporous Mesoporous Mater. 2011, 139, 73–78. [Google Scholar] [CrossRef]
- Ren, Z.J.; Jia, B.; Zhang, G.M.; Fu, X.L.; Wang, Z.X.; Wang, P.F.; Lv, L.L. Study on adsorption of ammonia nitrogen by iron-loaded activatedcarbon from low temperature wastewater. Chemosphere 2021, 262, 127895. [Google Scholar] [CrossRef]
- Qadiri, R.Z.Z.; Gani, K.M.; Zaid, A.; Aalam, T.; Kazmi, A.A.; Khalil, N. Comparative evaluation of the macrophytes in the constructed wetlands for the treatment of combined wastewater (greywater and septic tank effluent) in a sub-tropical region. Environ. Chall. 2021, 5, 100265. [Google Scholar] [CrossRef]
- Wang, Y.; Li, Q.; Zhang, W.; Wang, S.; Peng, H. Pollutants removal efficiency assessment of constructed subsurface flow wetlands in lakes with numerical models. J. Hydrol. 2021, 598, 126289. [Google Scholar] [CrossRef]
Figure 1.
Diagram of CW experimental set-up.

Figure 2.
Effect of preparation conditions on adsorption of phosphorus by T-SEP. (a) Calcination temperature; (b) Calcination time.
Figure 2.
Effect of preparation conditions on adsorption of phosphorus by T-SEP. (a) Calcination temperature; (b) Calcination time.
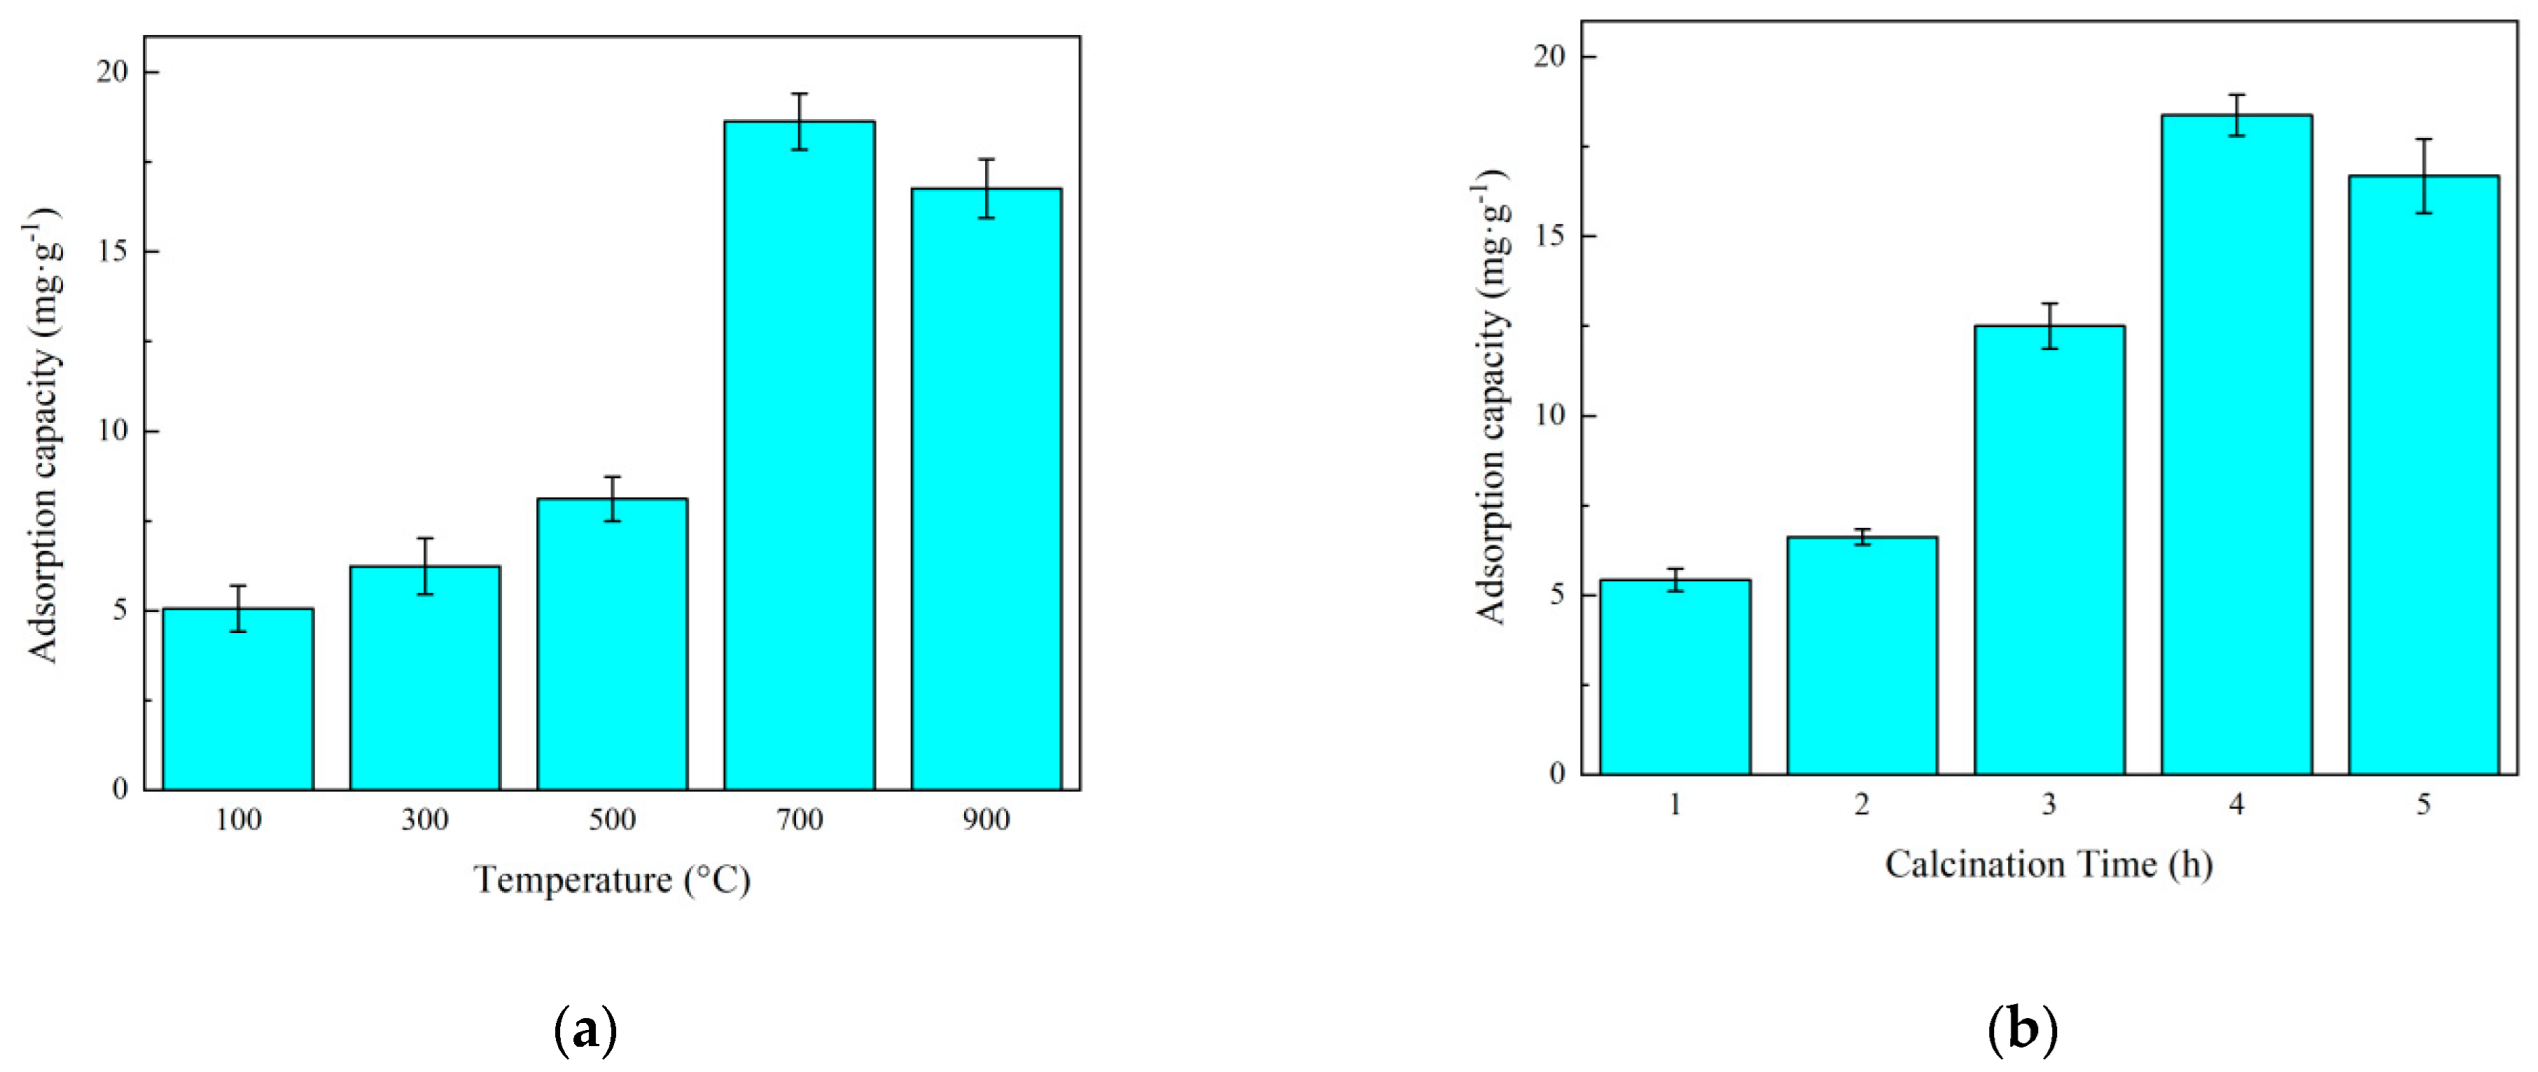
Figure 3.
(a) The XRD pattern of sepiolite; (b) The FT-IR spectra of SEP; (c) The curves of particle size distribution for N-SEP; (d) The curves of particle size distribution for T-SEP; (e) SEM images of N-SEP; (f) SEM images of T-SEP.
Figure 3.
(a) The XRD pattern of sepiolite; (b) The FT-IR spectra of SEP; (c) The curves of particle size distribution for N-SEP; (d) The curves of particle size distribution for T-SEP; (e) SEM images of N-SEP; (f) SEM images of T-SEP.
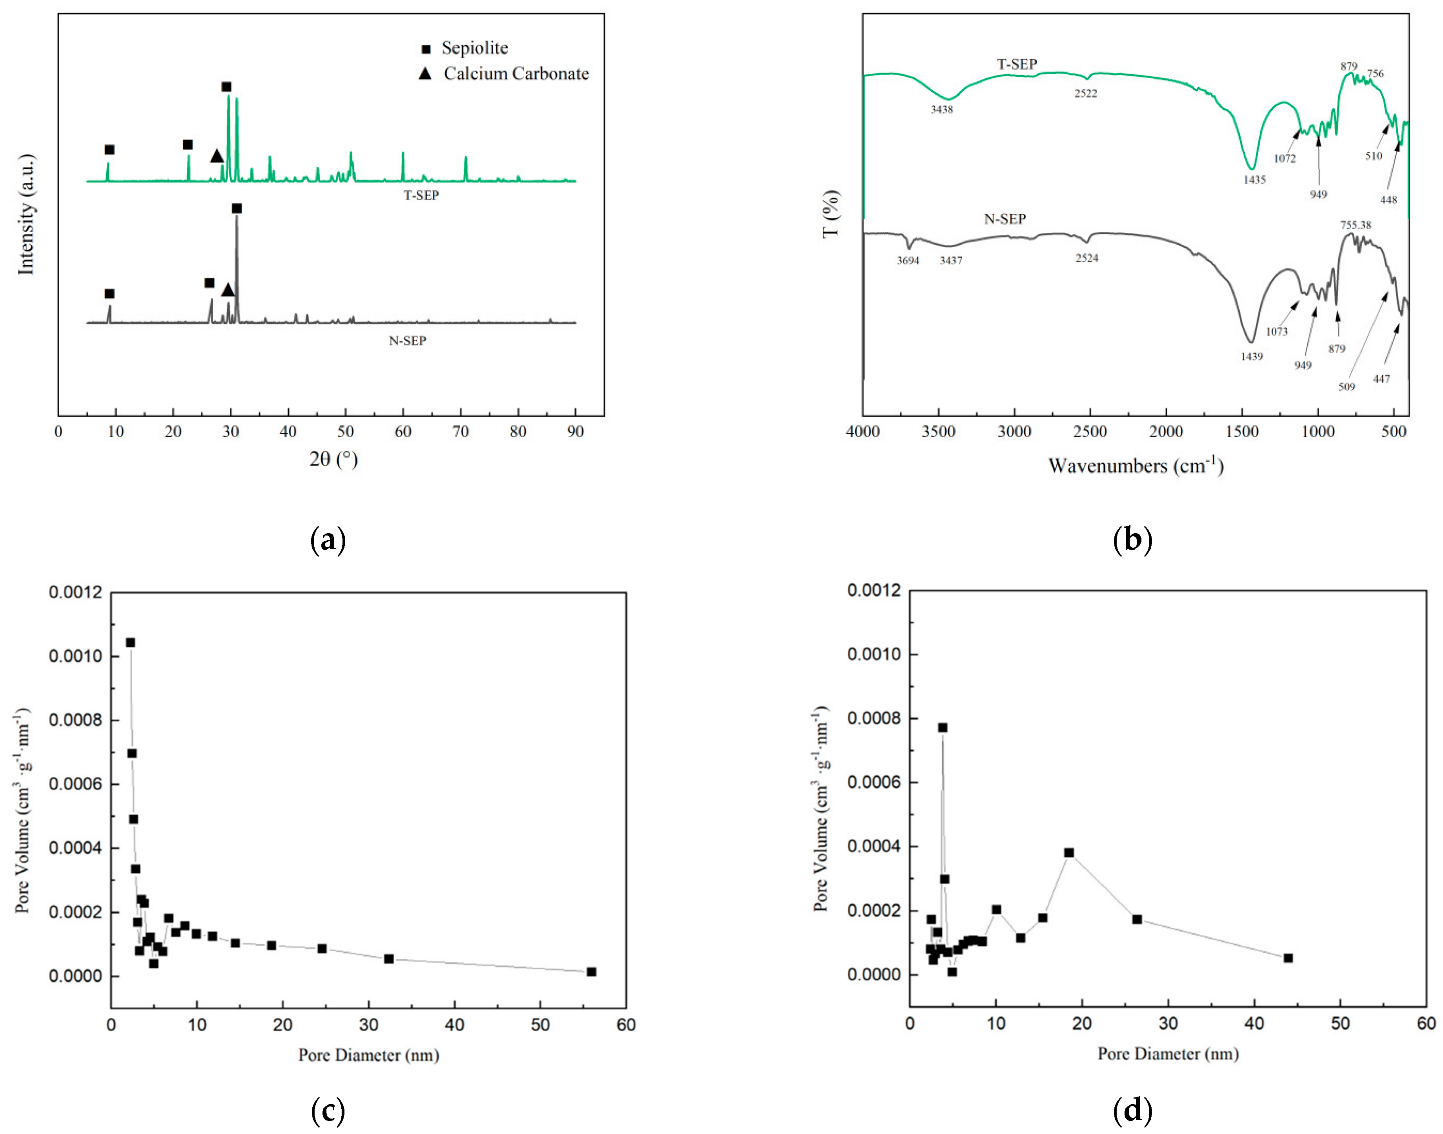
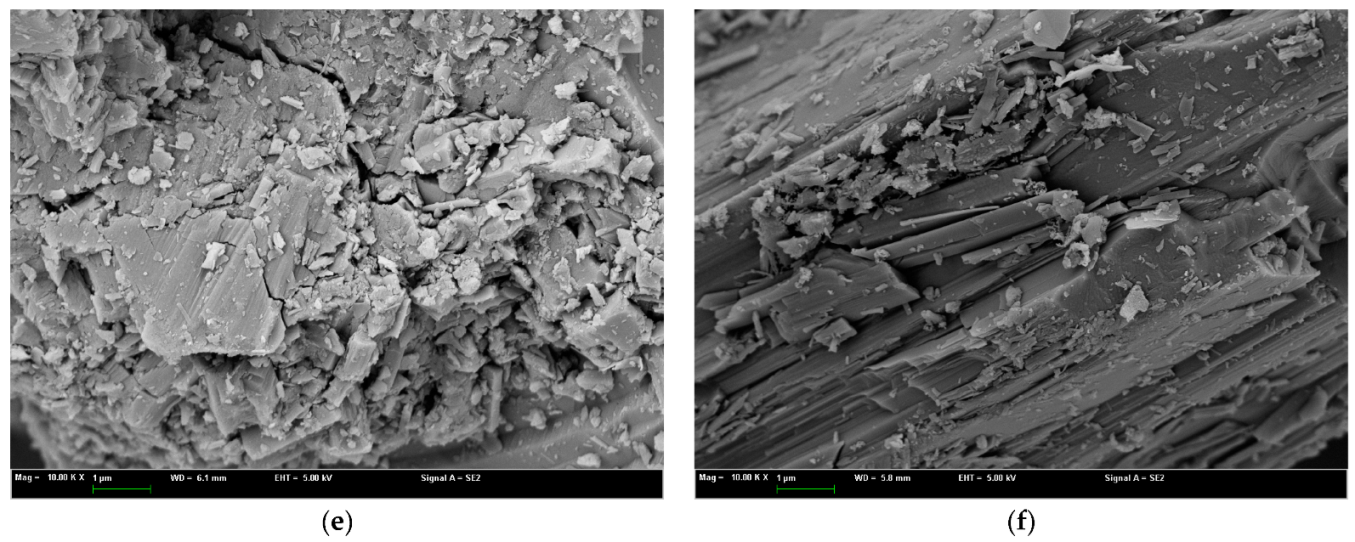
Figure 4.
Adsorption (a) kinetics and (b) isotherms for phosphorus by SEP.
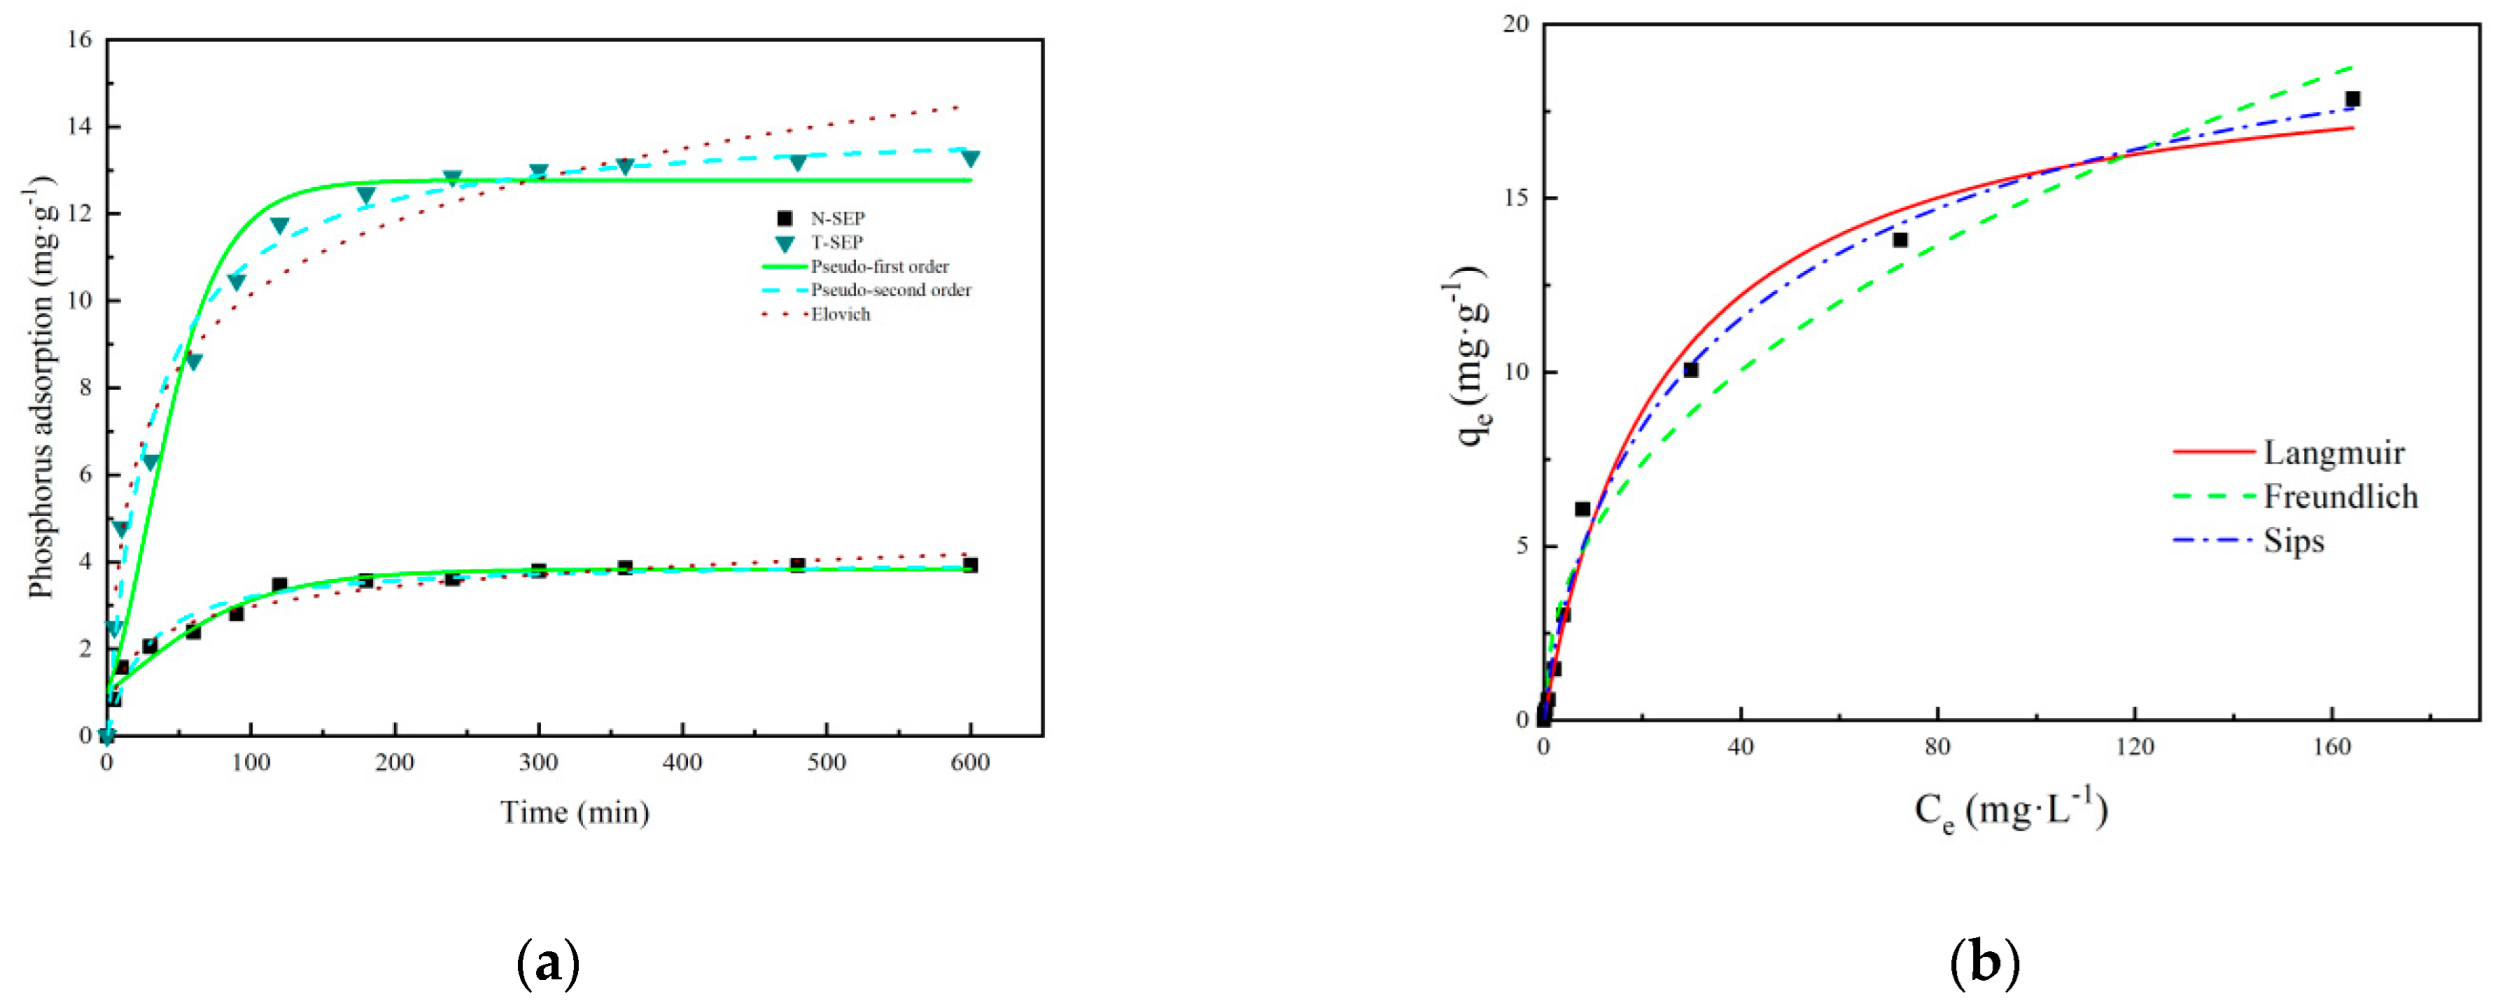
Figure 5.
Influencing factors of total phosphorus removal in constructed wetlands. (a) HRT; (b) Distance; (c) seasons.
Figure 5.
Influencing factors of total phosphorus removal in constructed wetlands. (a) HRT; (b) Distance; (c) seasons.
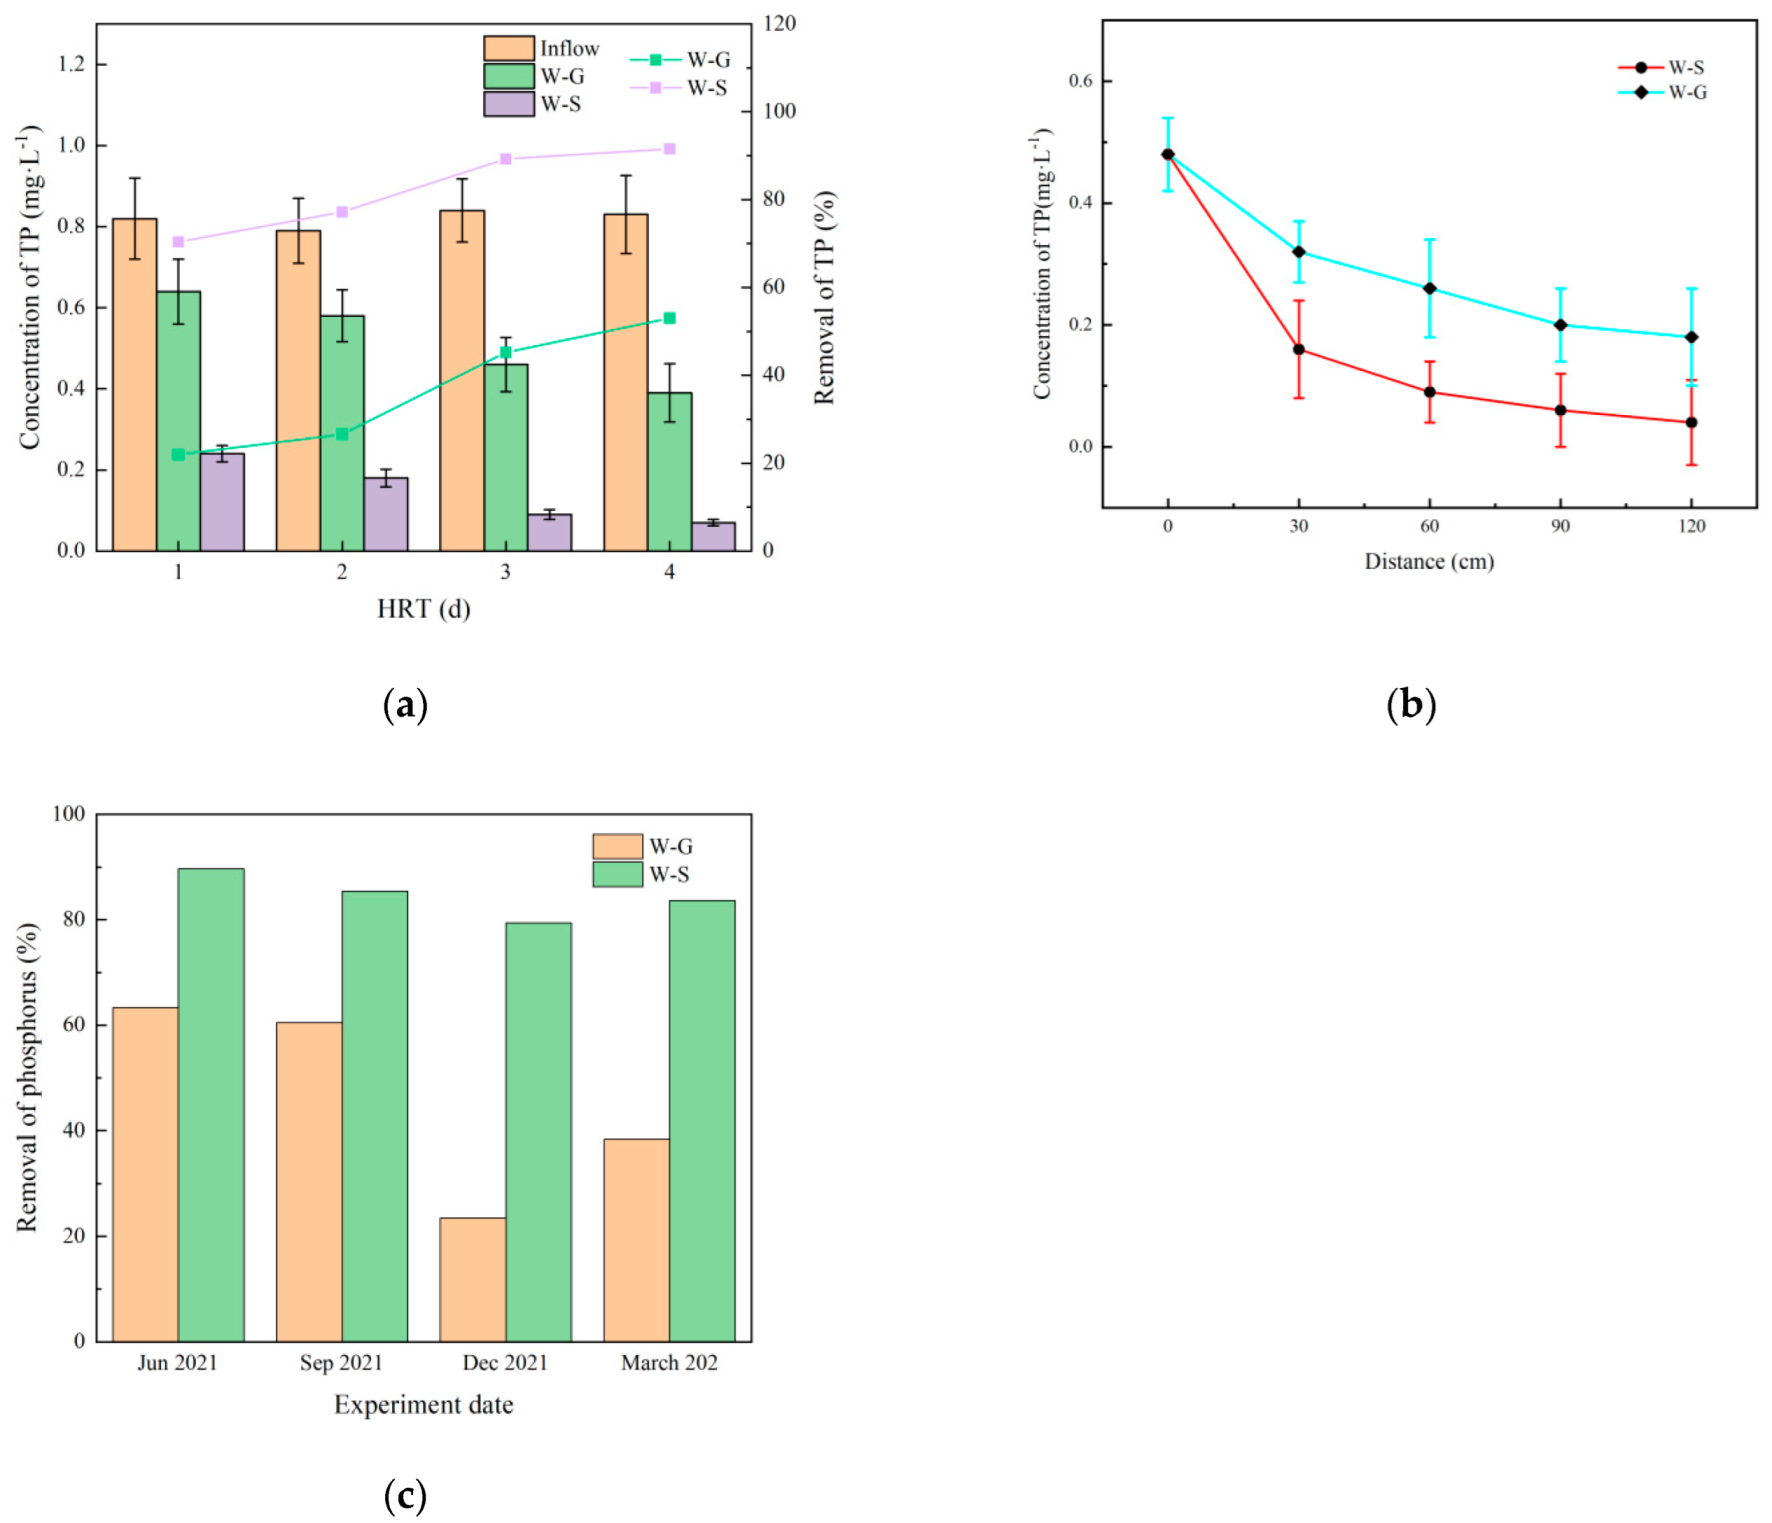
Figure 6.
Form and content of phosphorus in constructed wetland. (a) Substrate; (b) Plant.
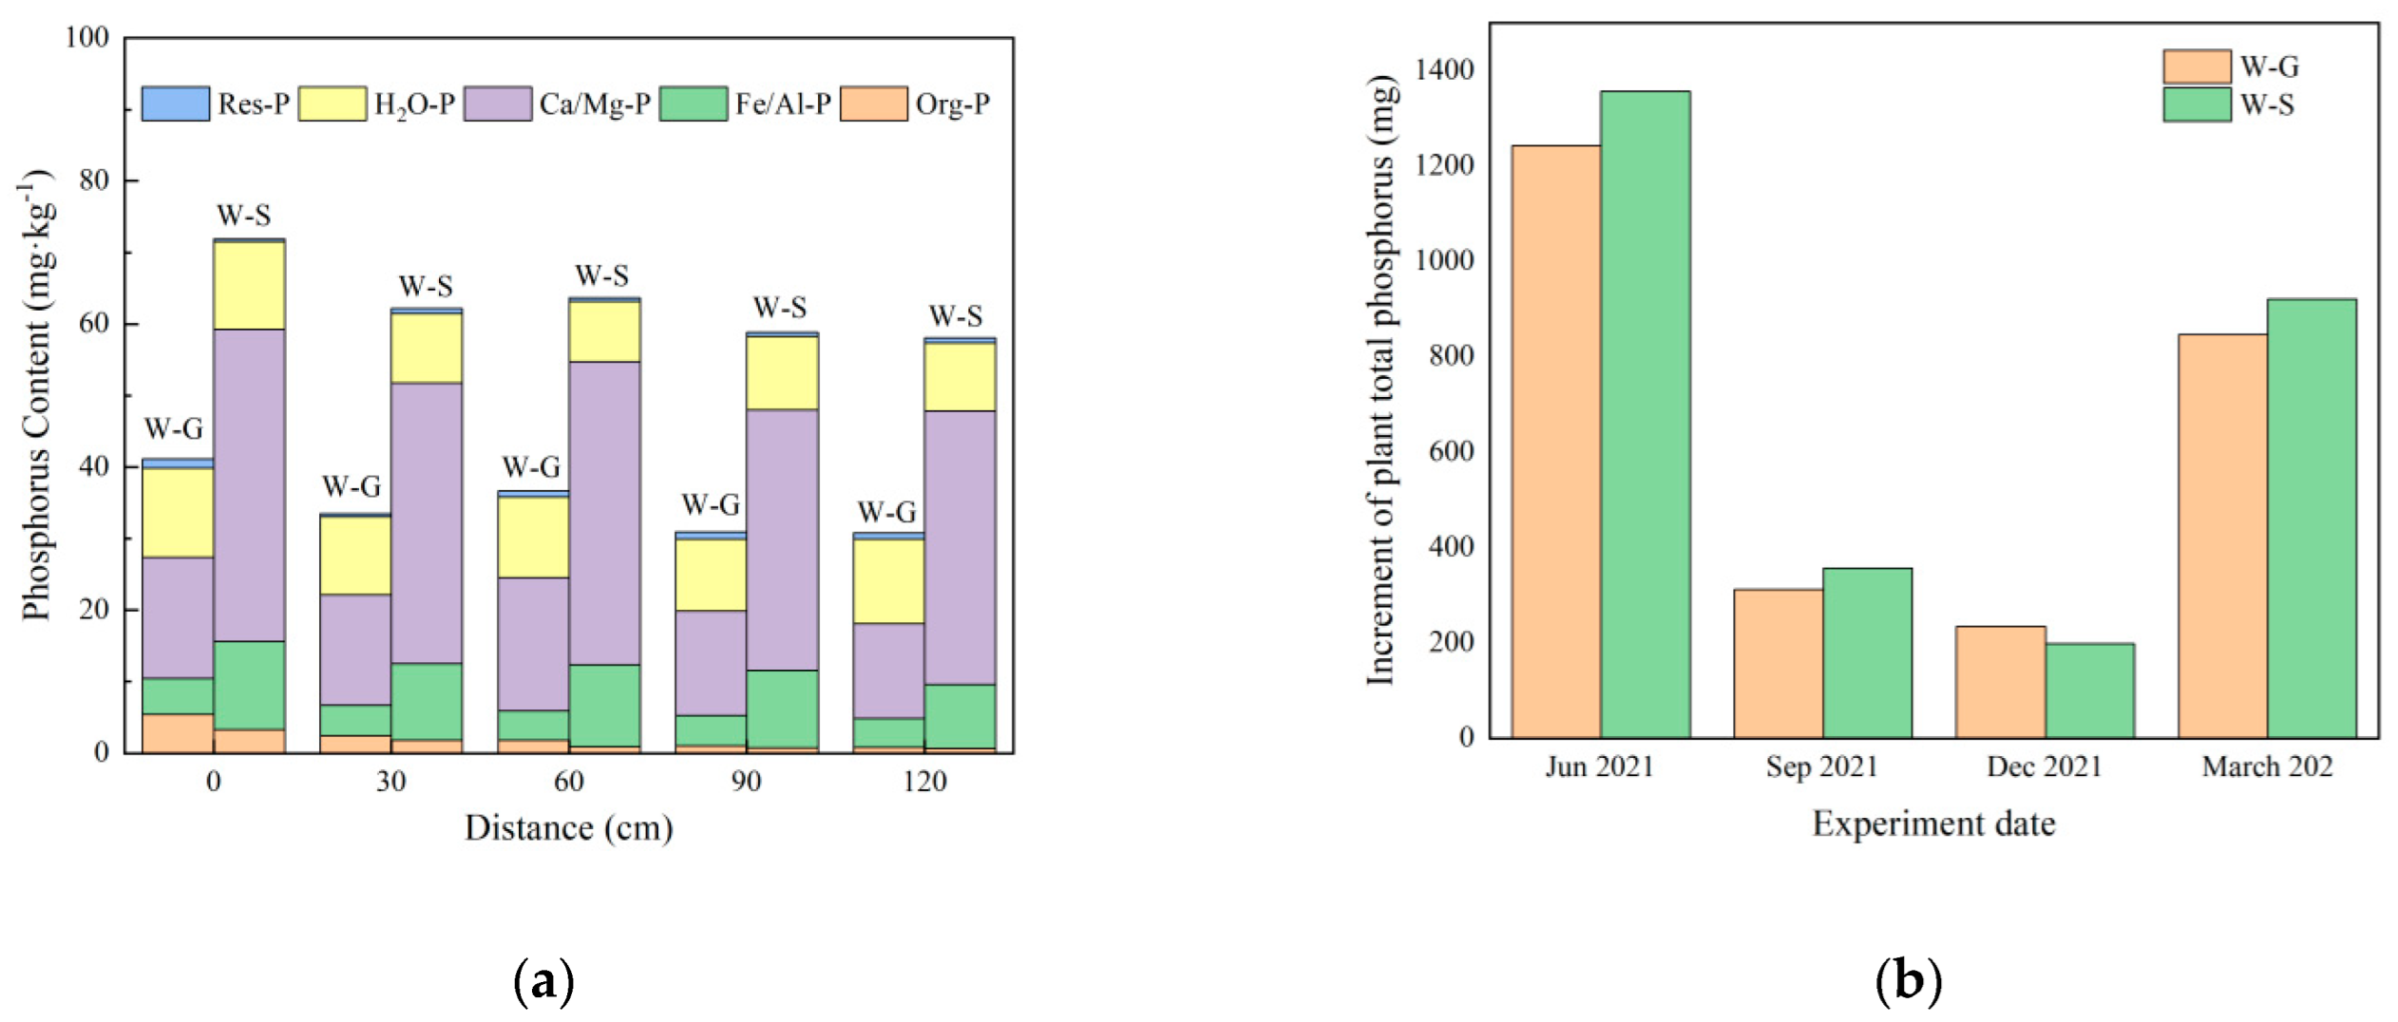
Figure 7.
Different pathways of P removal in CW based on T-SEP.
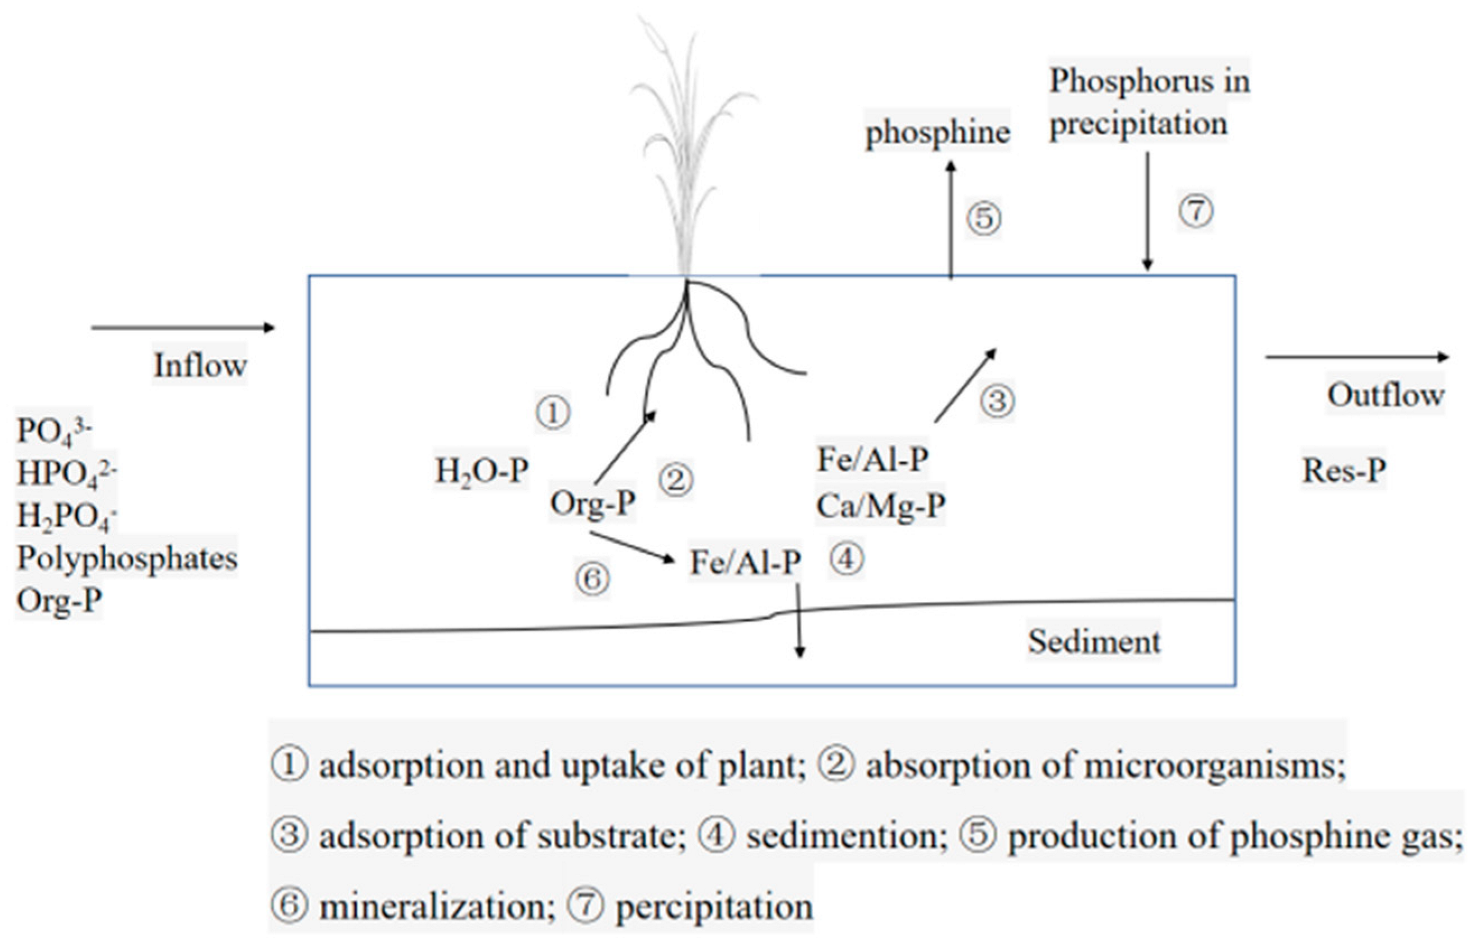
Figure 8.
The relative abundance of microbial community (A01, A02, A03 and A04 are samples of W-S in summer, autumn, winter and spring, respectively; A05, A06, A07 and A08 are samples of W-G in summer, autumn, winter and spring, respectively): (a) Phylum level; (b) Genus level.
Figure 8.
The relative abundance of microbial community (A01, A02, A03 and A04 are samples of W-S in summer, autumn, winter and spring, respectively; A05, A06, A07 and A08 are samples of W-G in summer, autumn, winter and spring, respectively): (a) Phylum level; (b) Genus level.

Table 1.
Water quality index and analysis method of constructed wetlands.
| Water Quality Index | Inlet Value Range |
|---|---|
| CODCr | 43.2~46.8 mg·L−1 |
| TN | 12.4~14.3 mg·L−1 |
| NH3-N | 3.6~4.2 mg·L−1 |
| TP | 0.6~1.0 mg·L−1 |
| SS | 12.3~23.4 mg·L−1 |
| DO | 6.2~8.3 mg·L−1 |
| pH | 6.5~8.1 |
| Temperature | 15.2~32.4 °C |
Table 2.
Specific surface area and pore volume of N-SEP, A-SEP, S-SEP and T-SEP.
| Absorbent | SBET (m2·g−1) | Da (nm) | Vmicro (cm3·g−1) |
|---|---|---|---|
| N-SEP | 12.84 | 7.37 | 0.0083 |
| T-SEP | 30.41 | 12.65 | 0.0209 |
Table 3.
Kinetic model parameters of phosphorus by T-SEP.
| Models | Parameters | Value |
|---|---|---|
| Pseudo-first order | K1 (min−1) | 0.035 |
| qe (mg·g−1) | 12.776 | |
| R2 | 0.945 | |
| Pseudo-second order | K2 (g·mg−1·min−1) | 0.003 |
| qe (mg·g−1) | 14.15 | |
| R2 | 0.985 | |
| Elovich model | α (g·min−1) | 1.612 |
| β (g·mg−1·min−1) | 0.414 | |
| R2 | 0.974 |
Table 4.
Isotherm model parameters of phosphorus adsorption by T-SEP.
| Isotherm | Parameters | Value |
|---|---|---|
| Langmuir | KL (L·mg−1) | 0.042 |
| qm (mg·g−1) | 19.494 | |
| R2 | 0.989 | |
| Freundlich | KF (L·mg−1) | 1.965 |
| 1/n | 0.442 | |
| R2 | 0.974 | |
| Sips | αs | 0.053 |
| 1/n | 0.782 | |
| qm (mg·g−1) | 23.695 | |
| R2 | 0.993 |
Table 5.
Phosphorus removal by primary way in constructed wetland.
| Phosphorus Removal Way | W-G | W-S | ||
|---|---|---|---|---|
| Quality (mg) | Proportion (%) | Quality (mg) | Proportion (%) | |
| Phosphorus removal by substrate | 8316 | 67.2 | 14,385 | 78.2 |
| Phosphorus removal by plant | 2636 | 21.3 | 2833 | 15.4 |
| Phosphorus removal by other means | 1423 | 11.5 | 1177 | 6.4 |
| Total phosphorus removal | 12,375 | 100 | 18,396 | 100 |
Publisher’s Note: MDPI stays neutral with regard to jurisdictional claims in published maps and institutional affiliations. |
© 2022 by the authors. Licensee MDPI, Basel, Switzerland. This article is an open access article distributed under the terms and conditions of the Creative Commons Attribution (CC BY) license (https://creativecommons.org/licenses/by/4.0/).
Share and Cite
MDPI and ACS Style
Gao, P.; Zhang, C. Study on Phosphorus Removal Pathway in Constructed Wetlands with Thermally Modified Sepiolite. Sustainability 2022, 14, 12535. https://doi.org/10.3390/su141912535
AMA Style
Gao P, Zhang C. Study on Phosphorus Removal Pathway in Constructed Wetlands with Thermally Modified Sepiolite. Sustainability. 2022; 14(19):12535. https://doi.org/10.3390/su141912535
Chicago/Turabian StyleGao, Pan, and Chao Zhang. 2022. "Study on Phosphorus Removal Pathway in Constructed Wetlands with Thermally Modified Sepiolite" Sustainability 14, no. 19: 12535. https://doi.org/10.3390/su141912535
Note that from the first issue of 2016, this journal uses article numbers instead of page numbers. See further details here.