

The Eco-Efficiency of Russian Regions in North Asia: Their Green Direction of Regional Development
 ,
,
Abstract
:1. Introduction
2. Materials and Methods
2.1. Literature Review
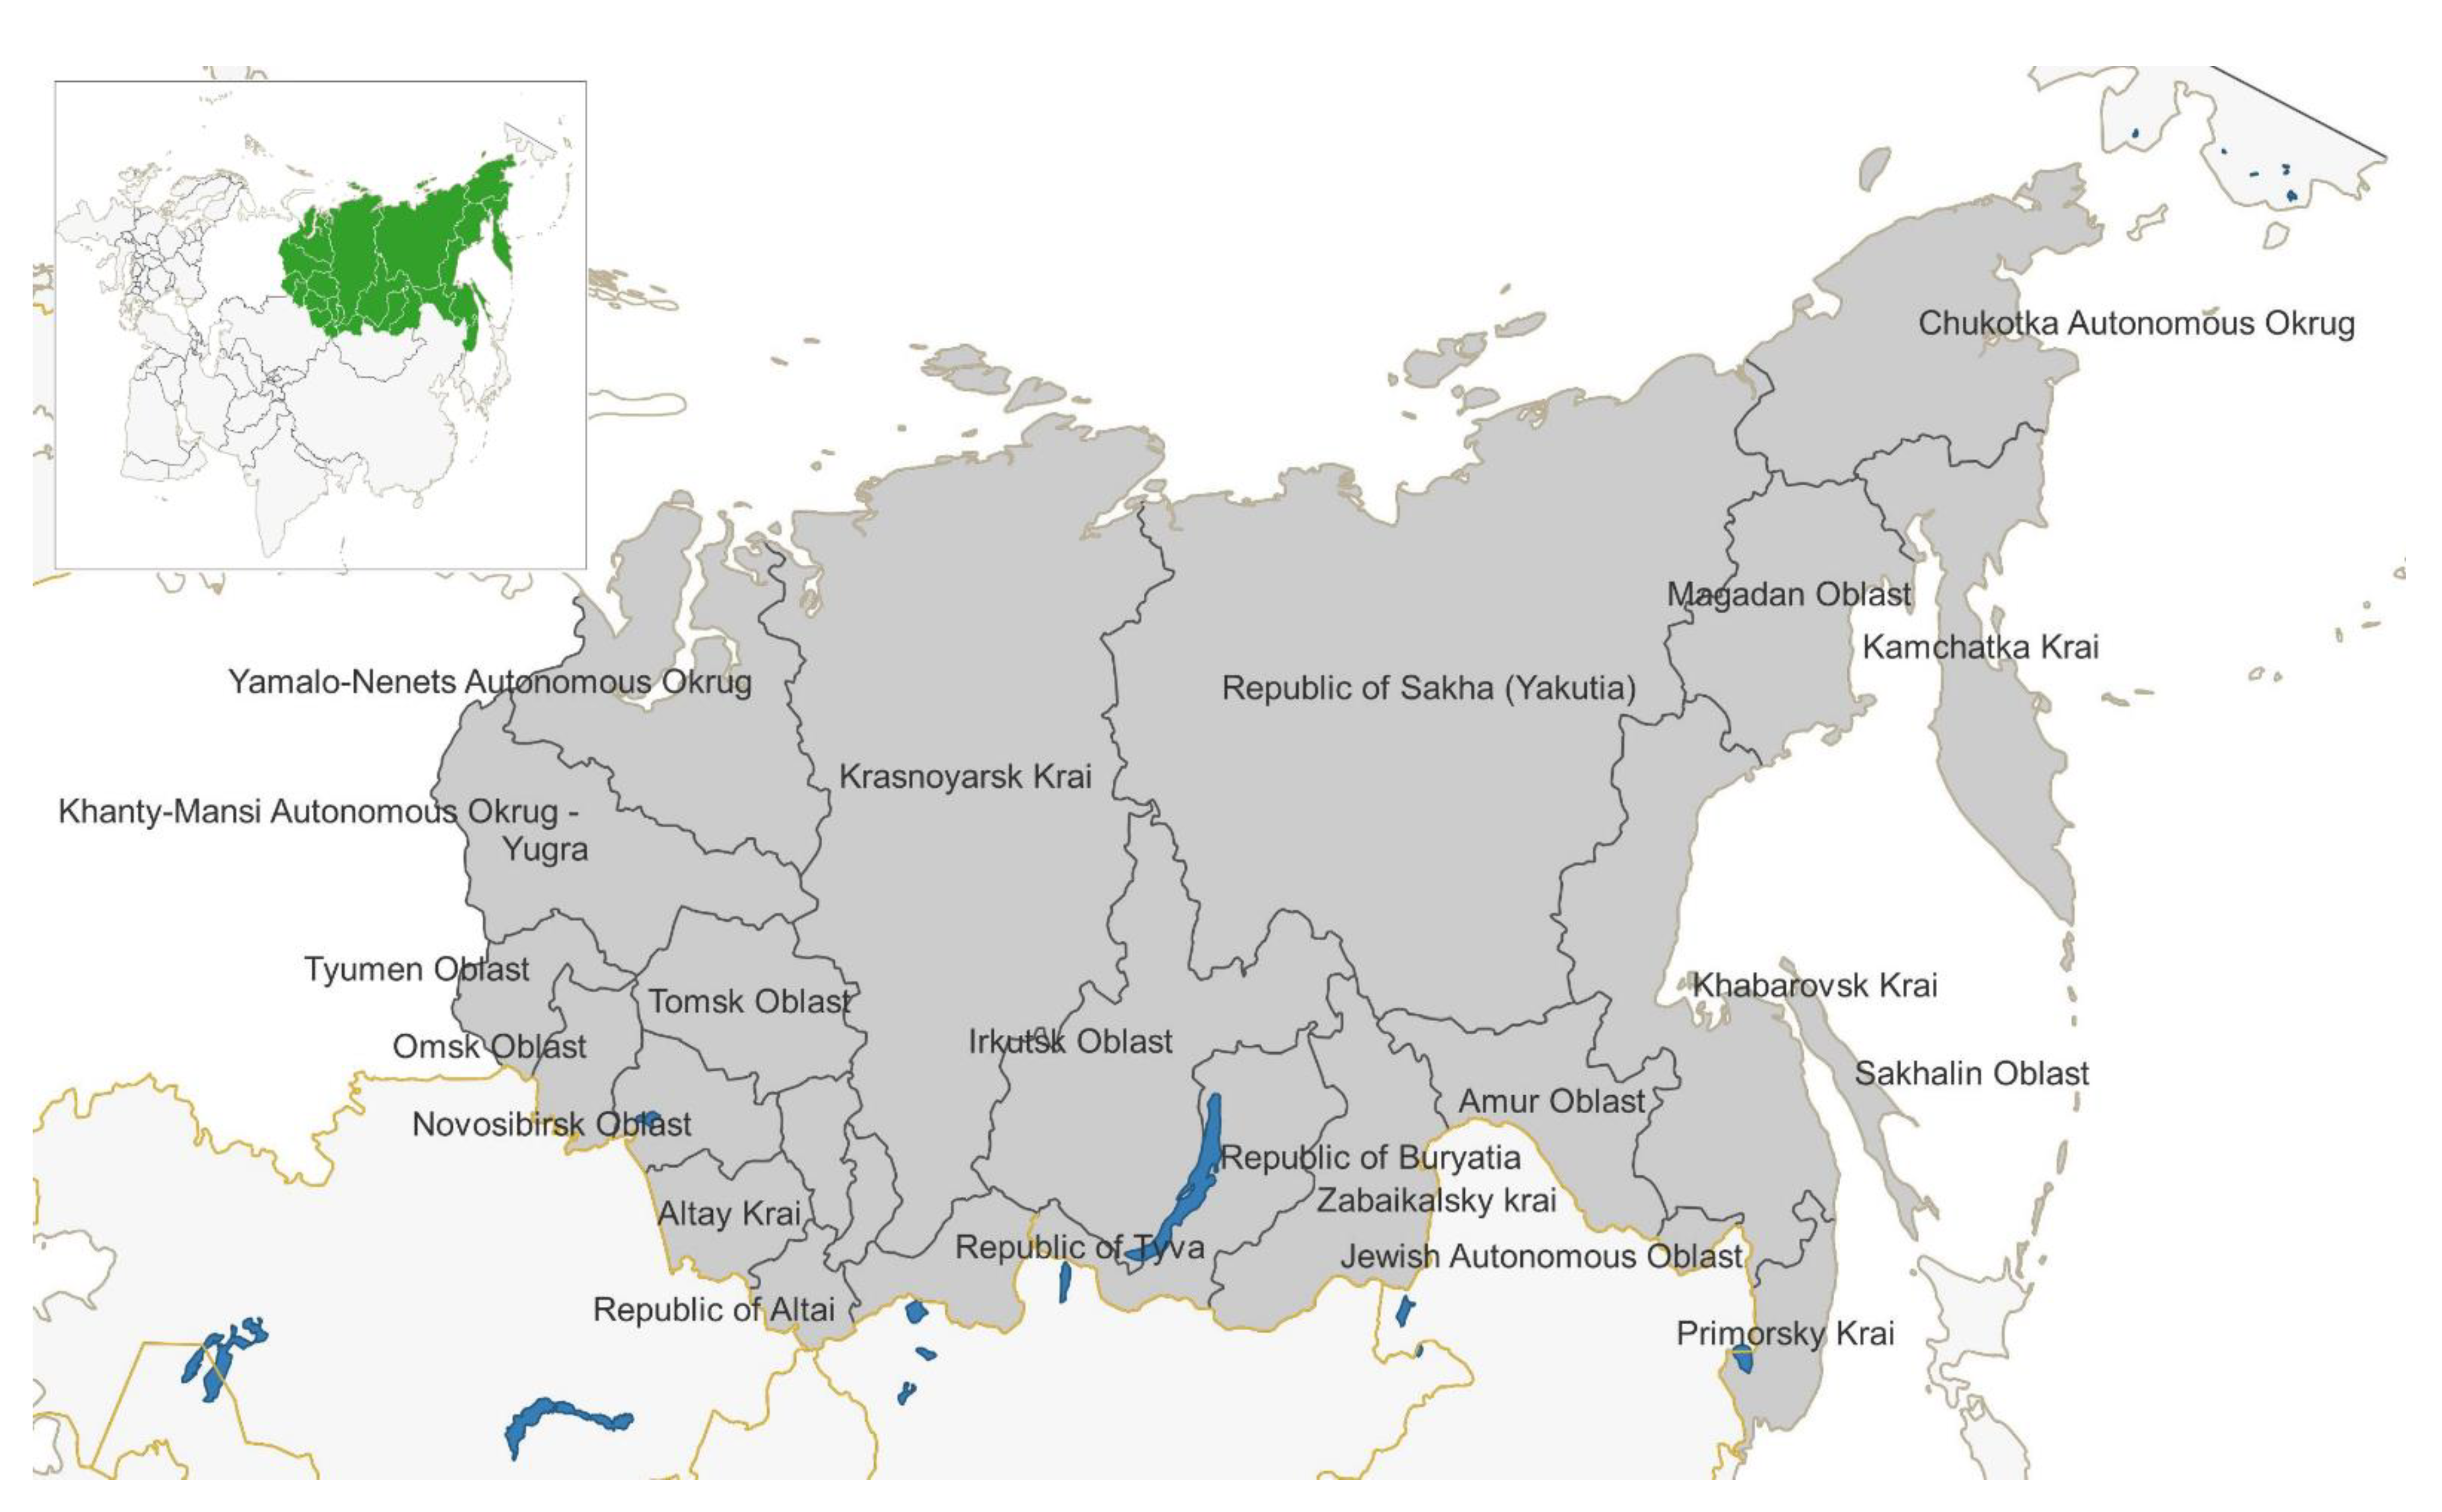
2.2. Study Area
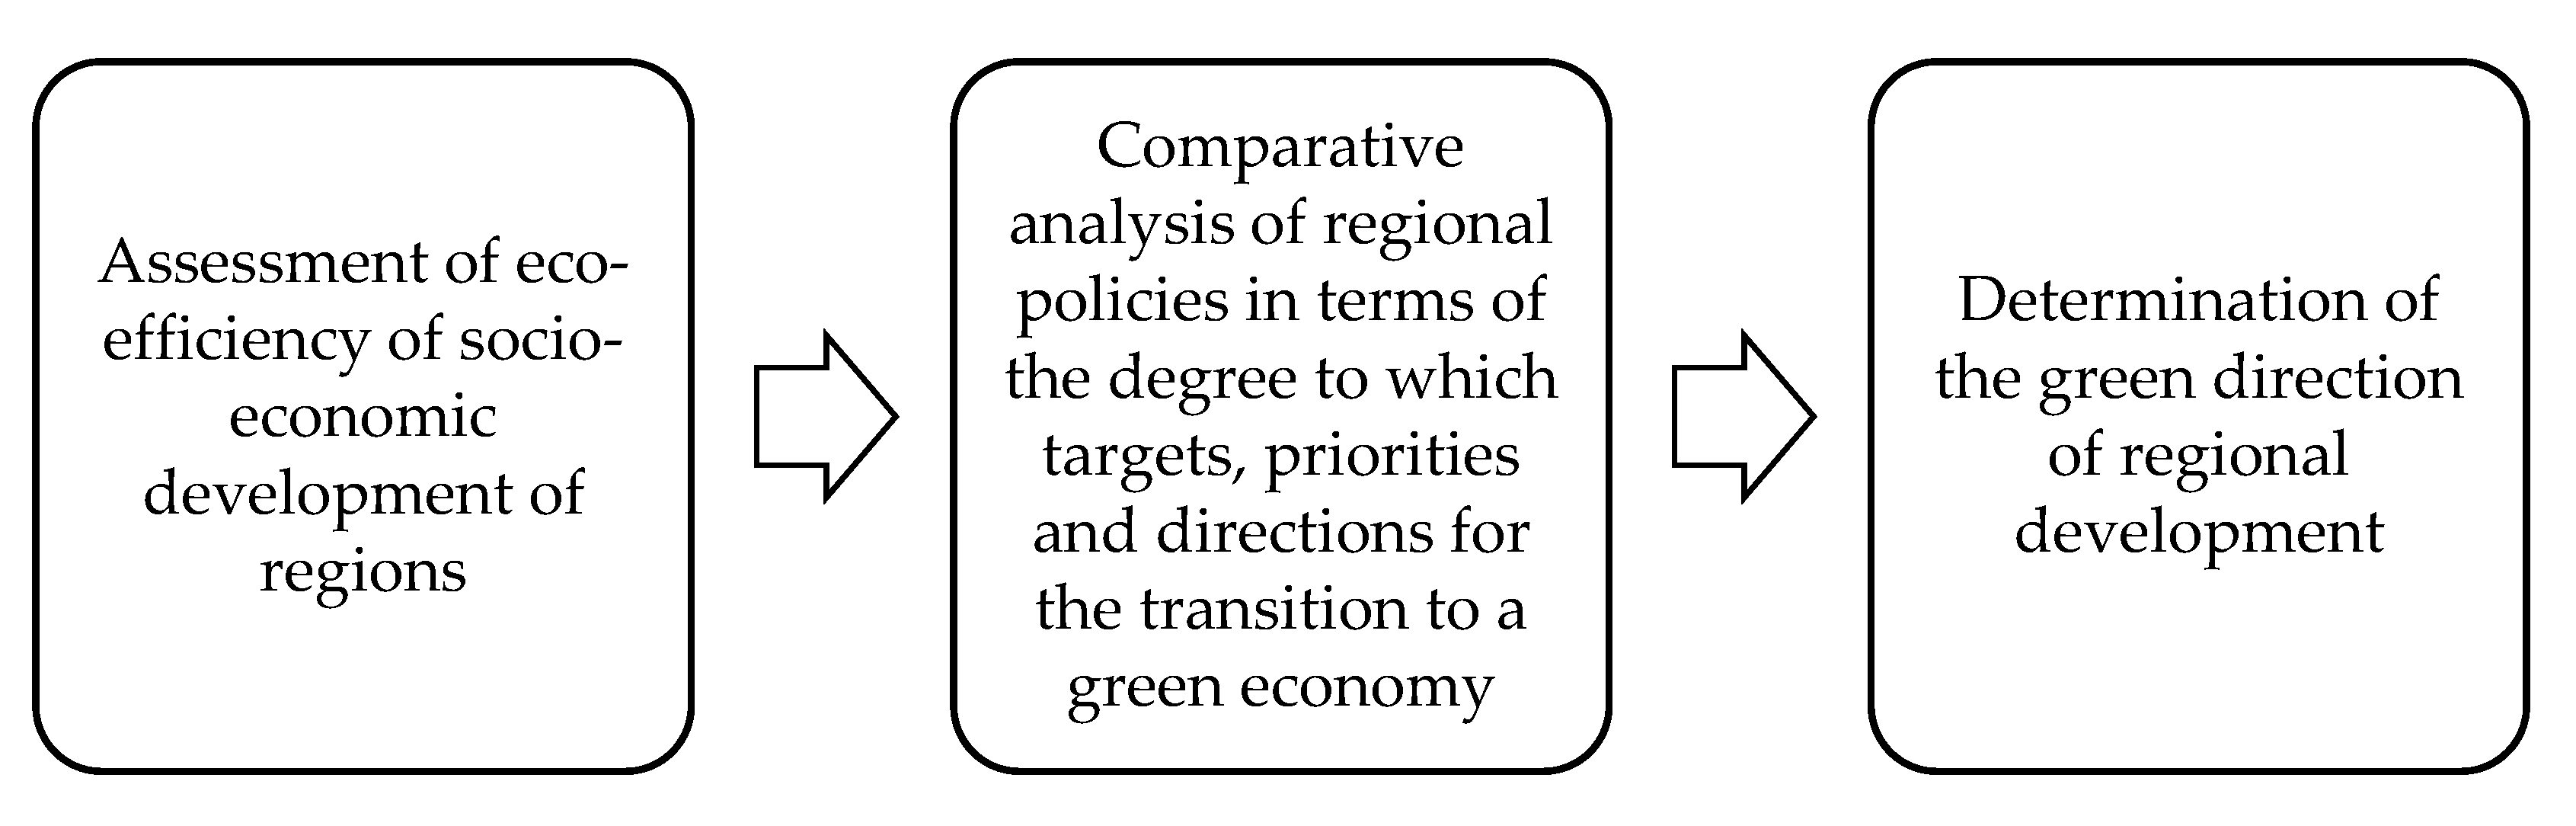
2.3. Methodology
- s.t.
- where , are the slacks;
- is a measure of the efficiency of the j-th DMU, while ∈ (0; 1];
- is the degree of similarity of the j-th DMU to other DMUs of the of the studied set by the ratios of the values of the variables.
- greening of key economic sectors;
- green energy;
- recycling;
- zero-waste production;
- model areas for green economy development;
- green enterprises;
- green technologies;
- green innovations;
- green products (environmentally friendly products, organic products);
- green skills and green jobs;
- green standards;
- green bonds;
- environmental sustainability in the development of cities and territories;
- eco-tourism;
- green image;
- environmental regulation;
- pro-environmental behavior.
3. Results
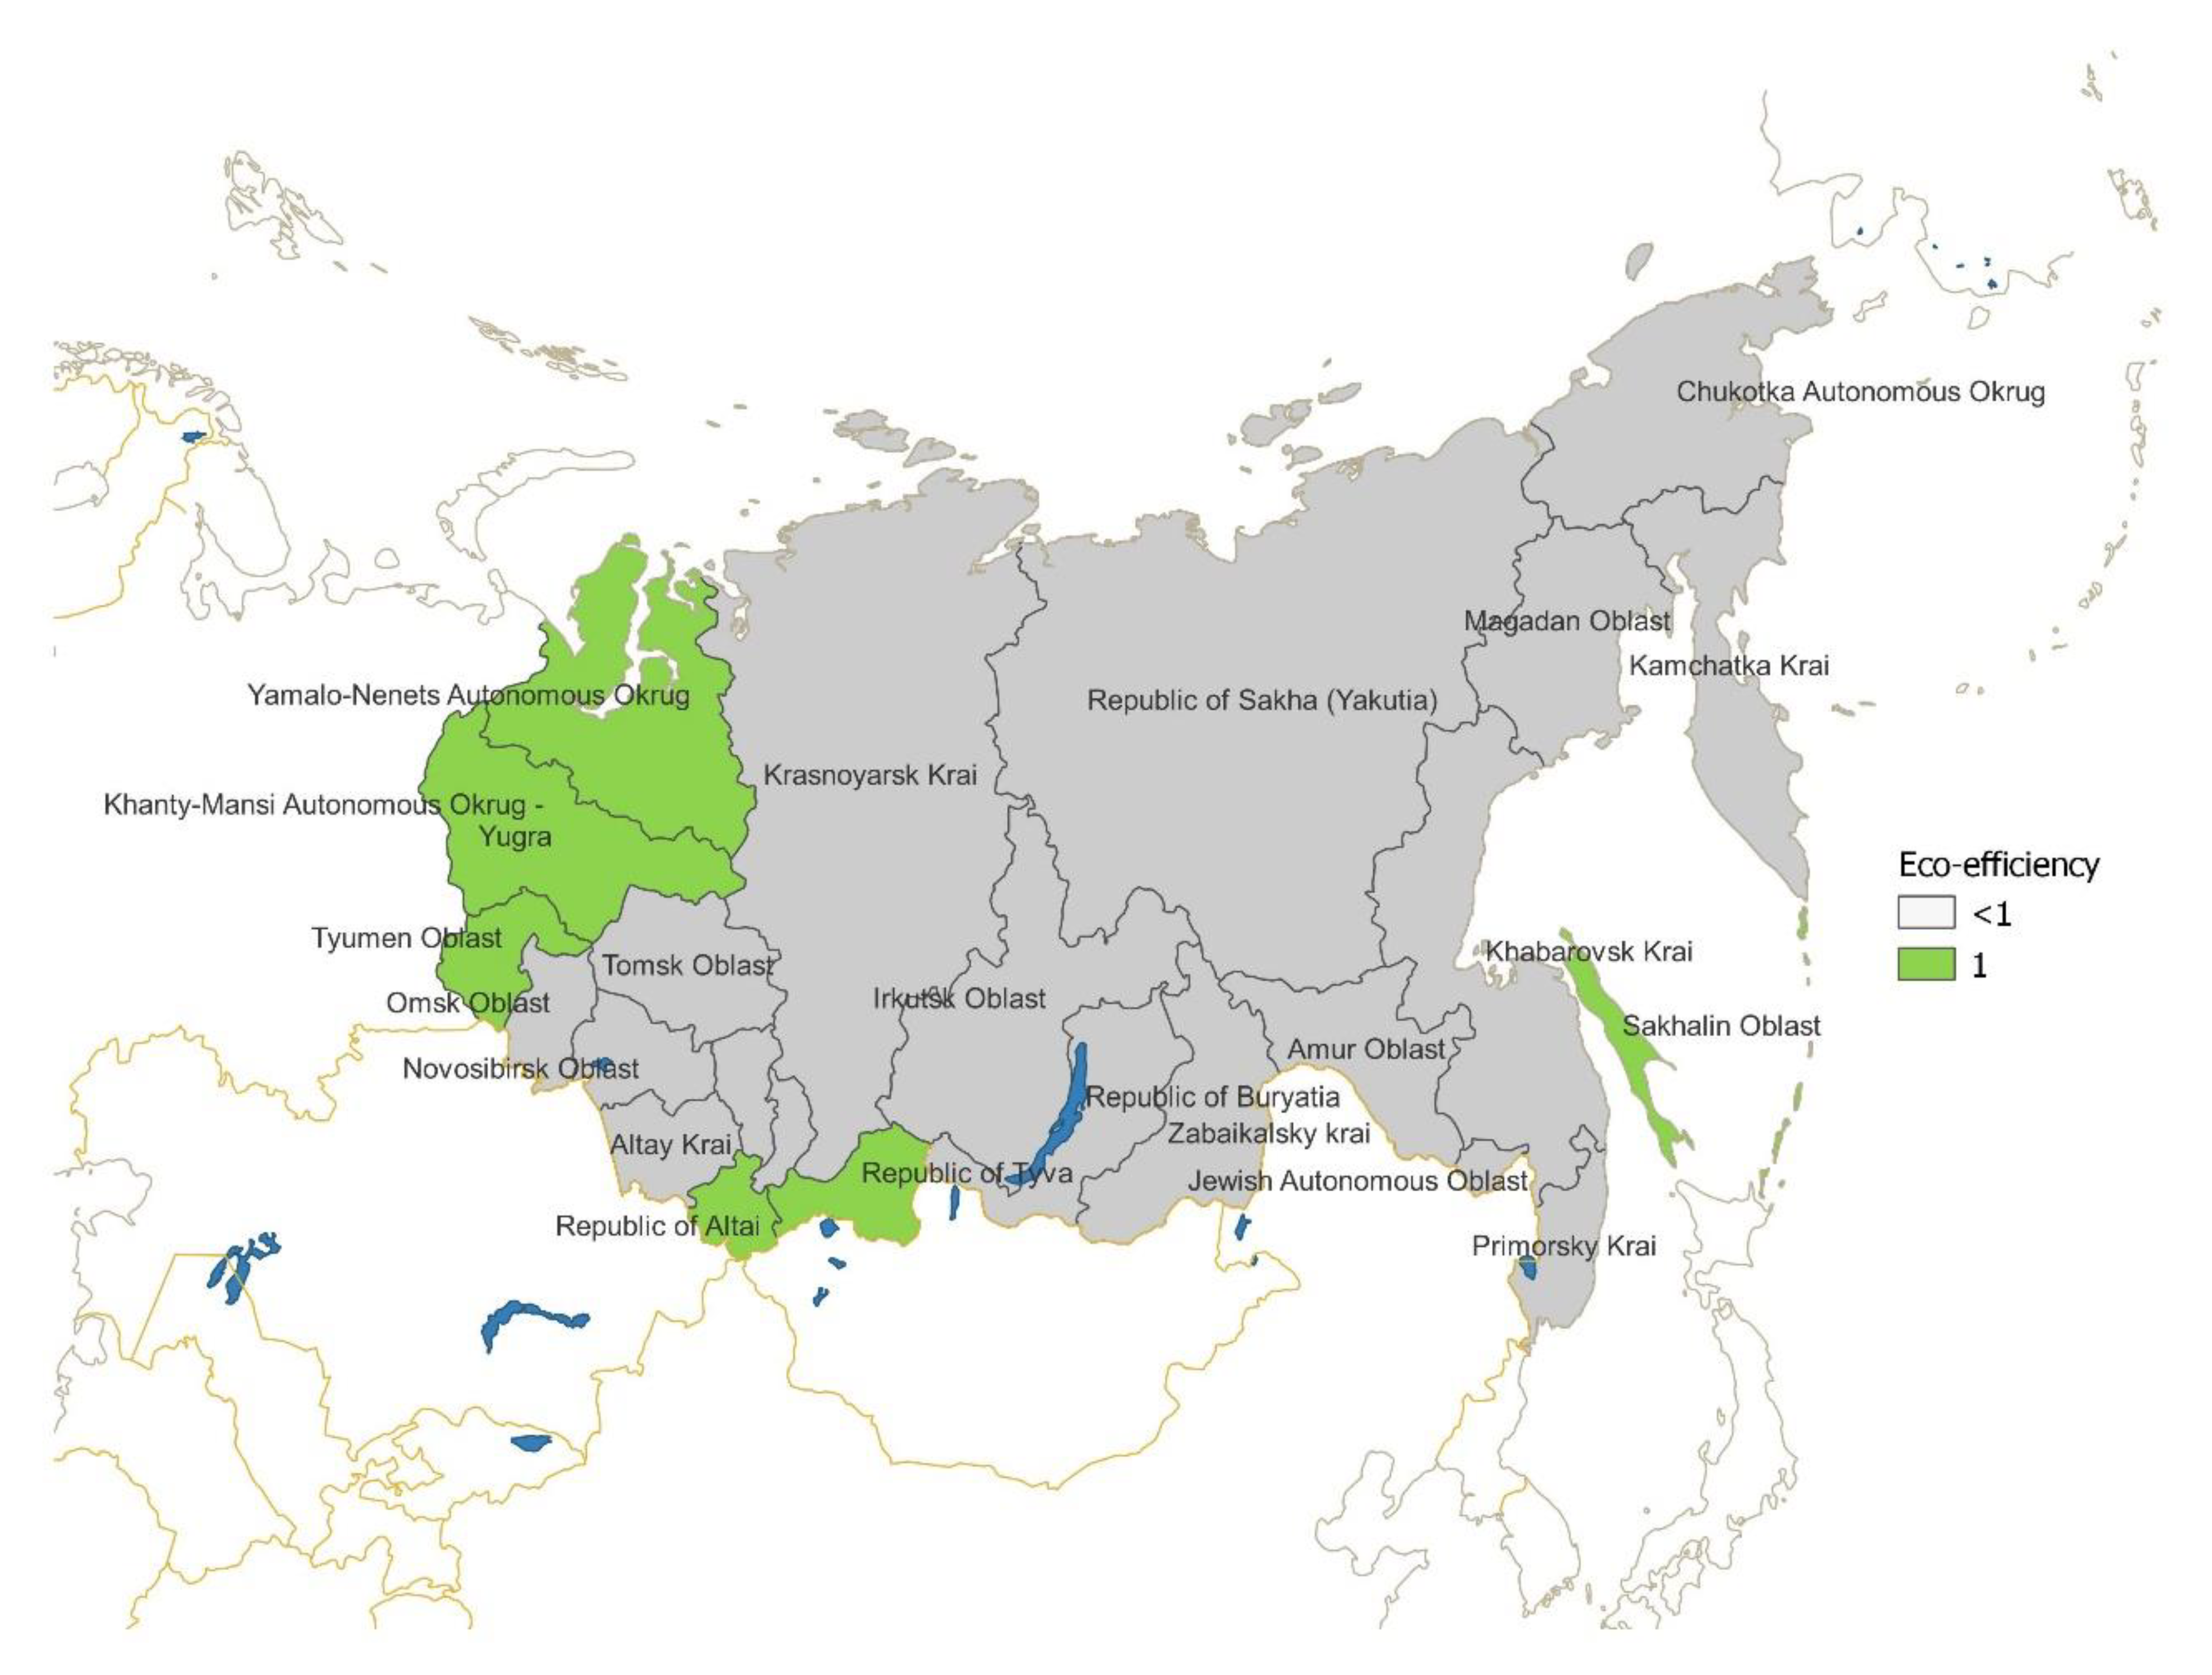
3.1. Assessment of Eco-Efficiency of the Socio-Economic Development in the Russian North Asian Regions from 2010 to 2019
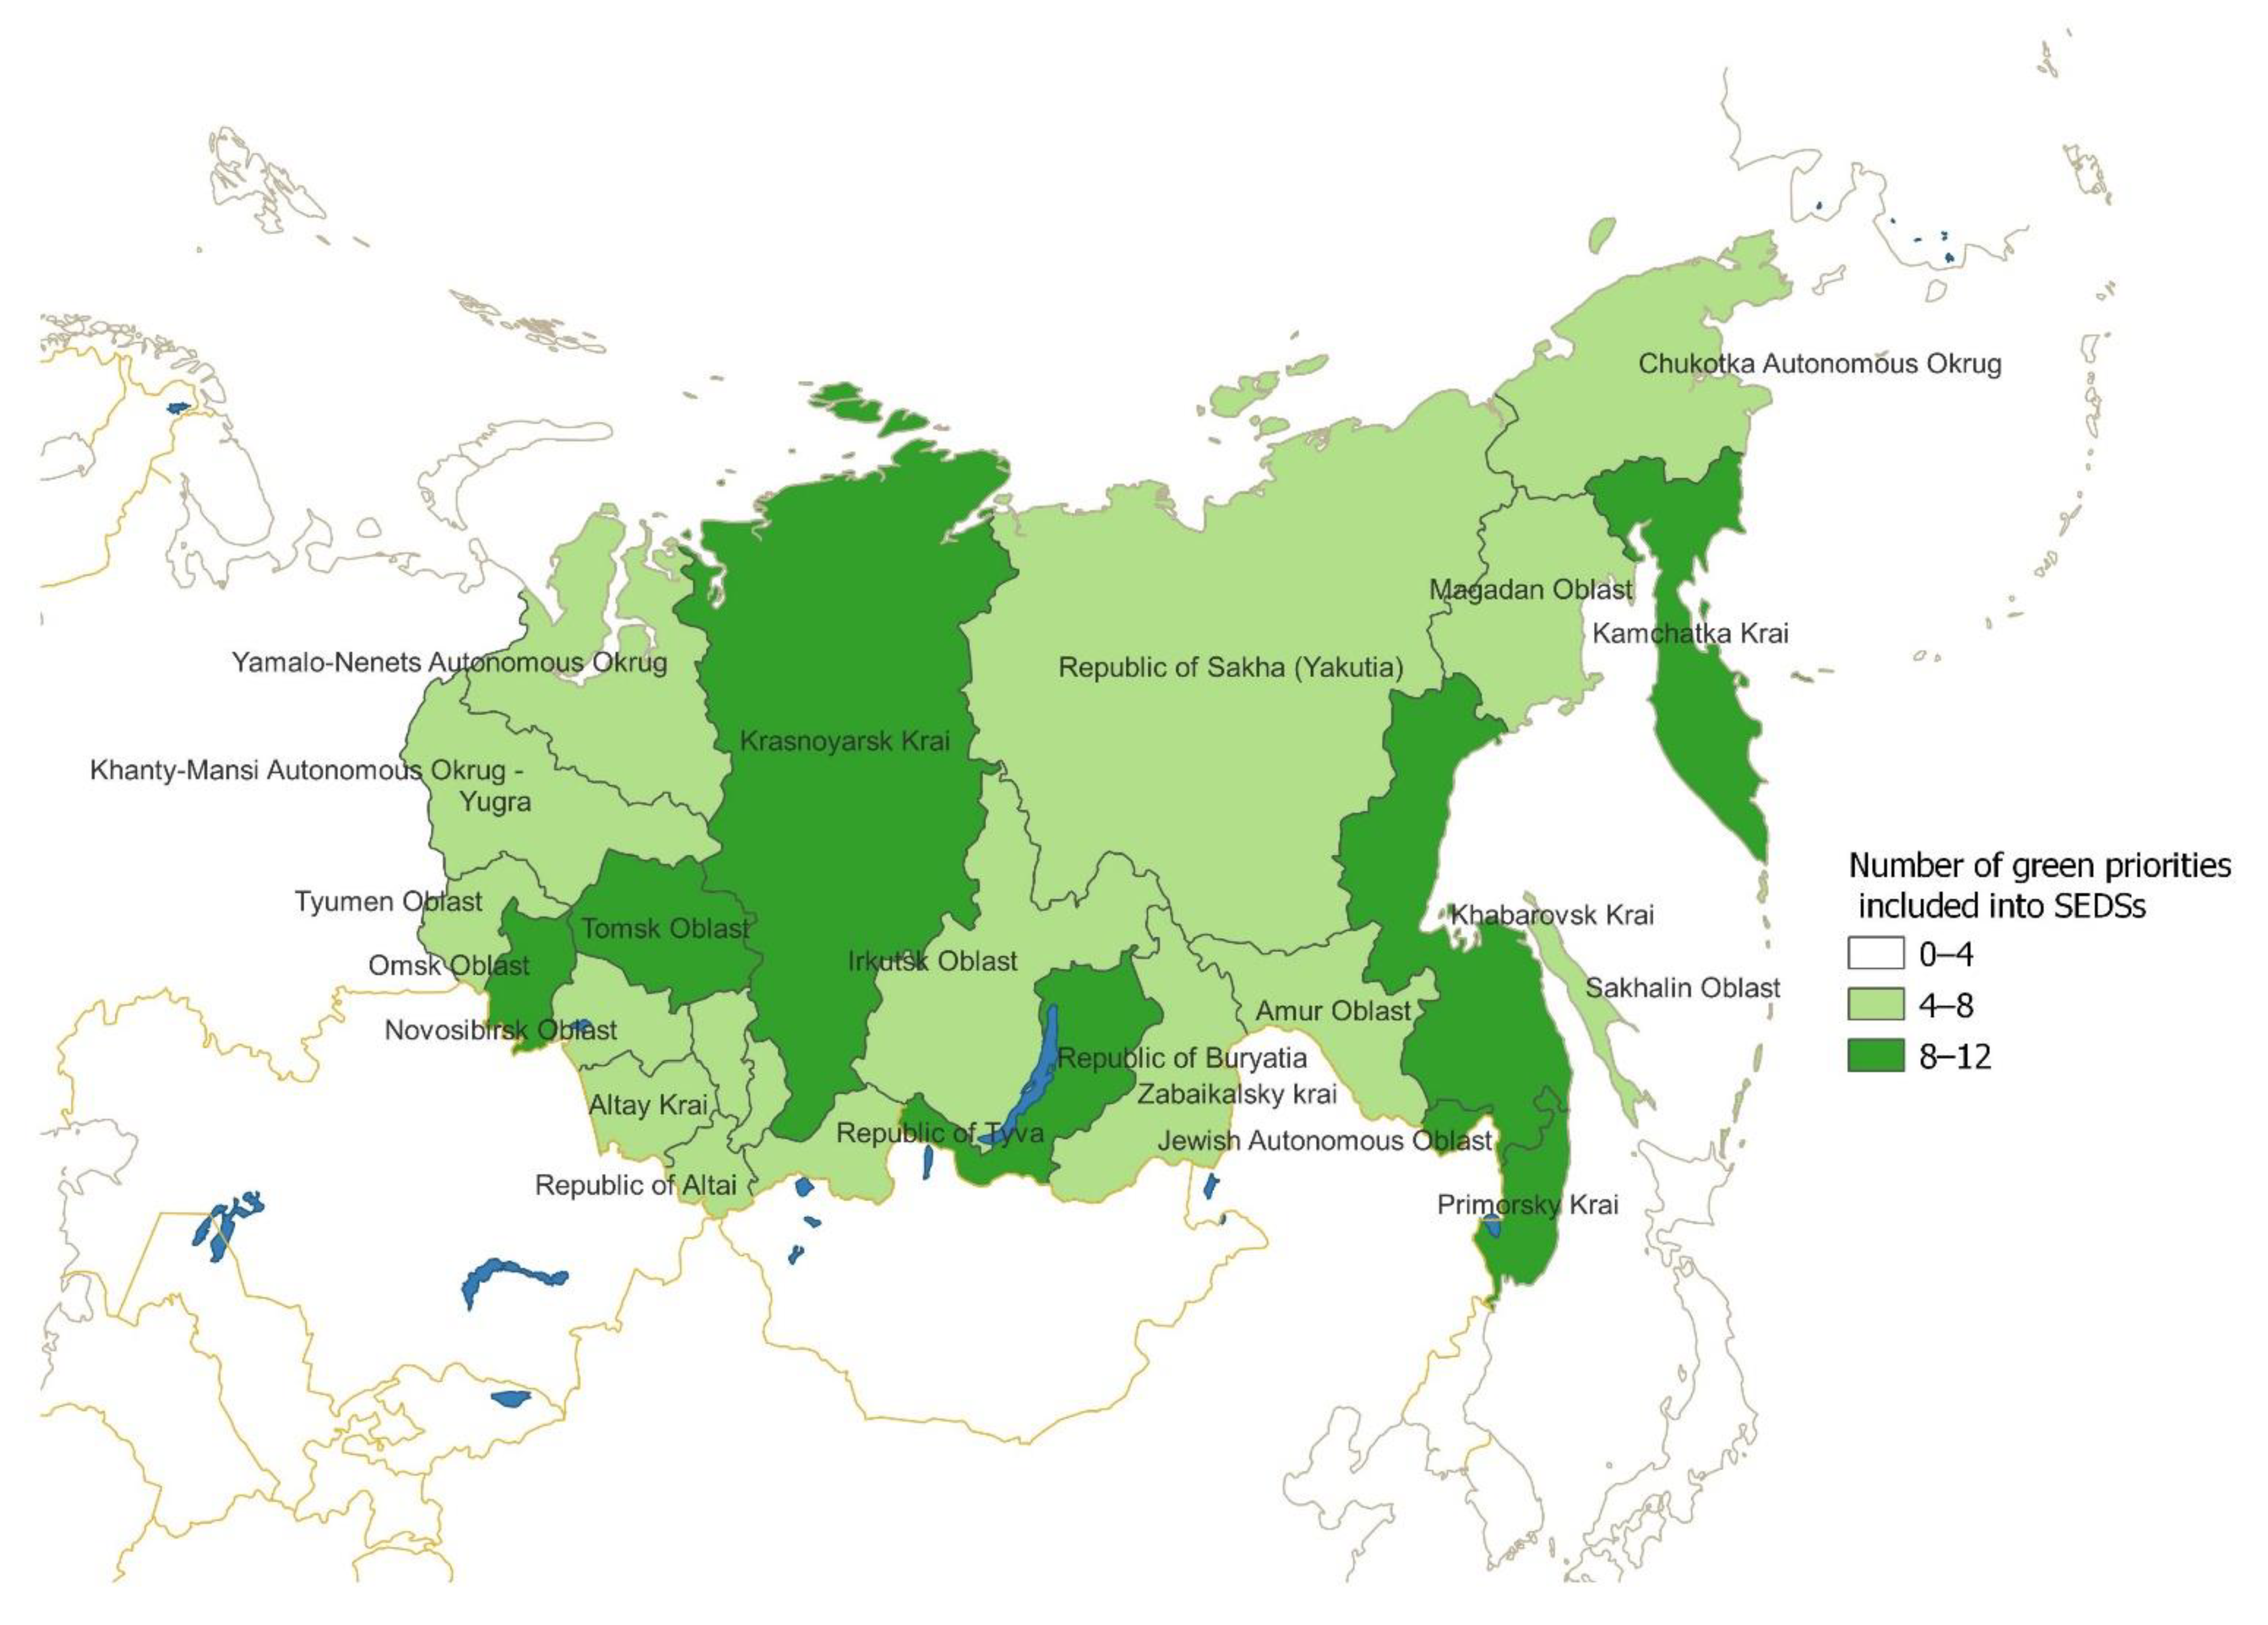
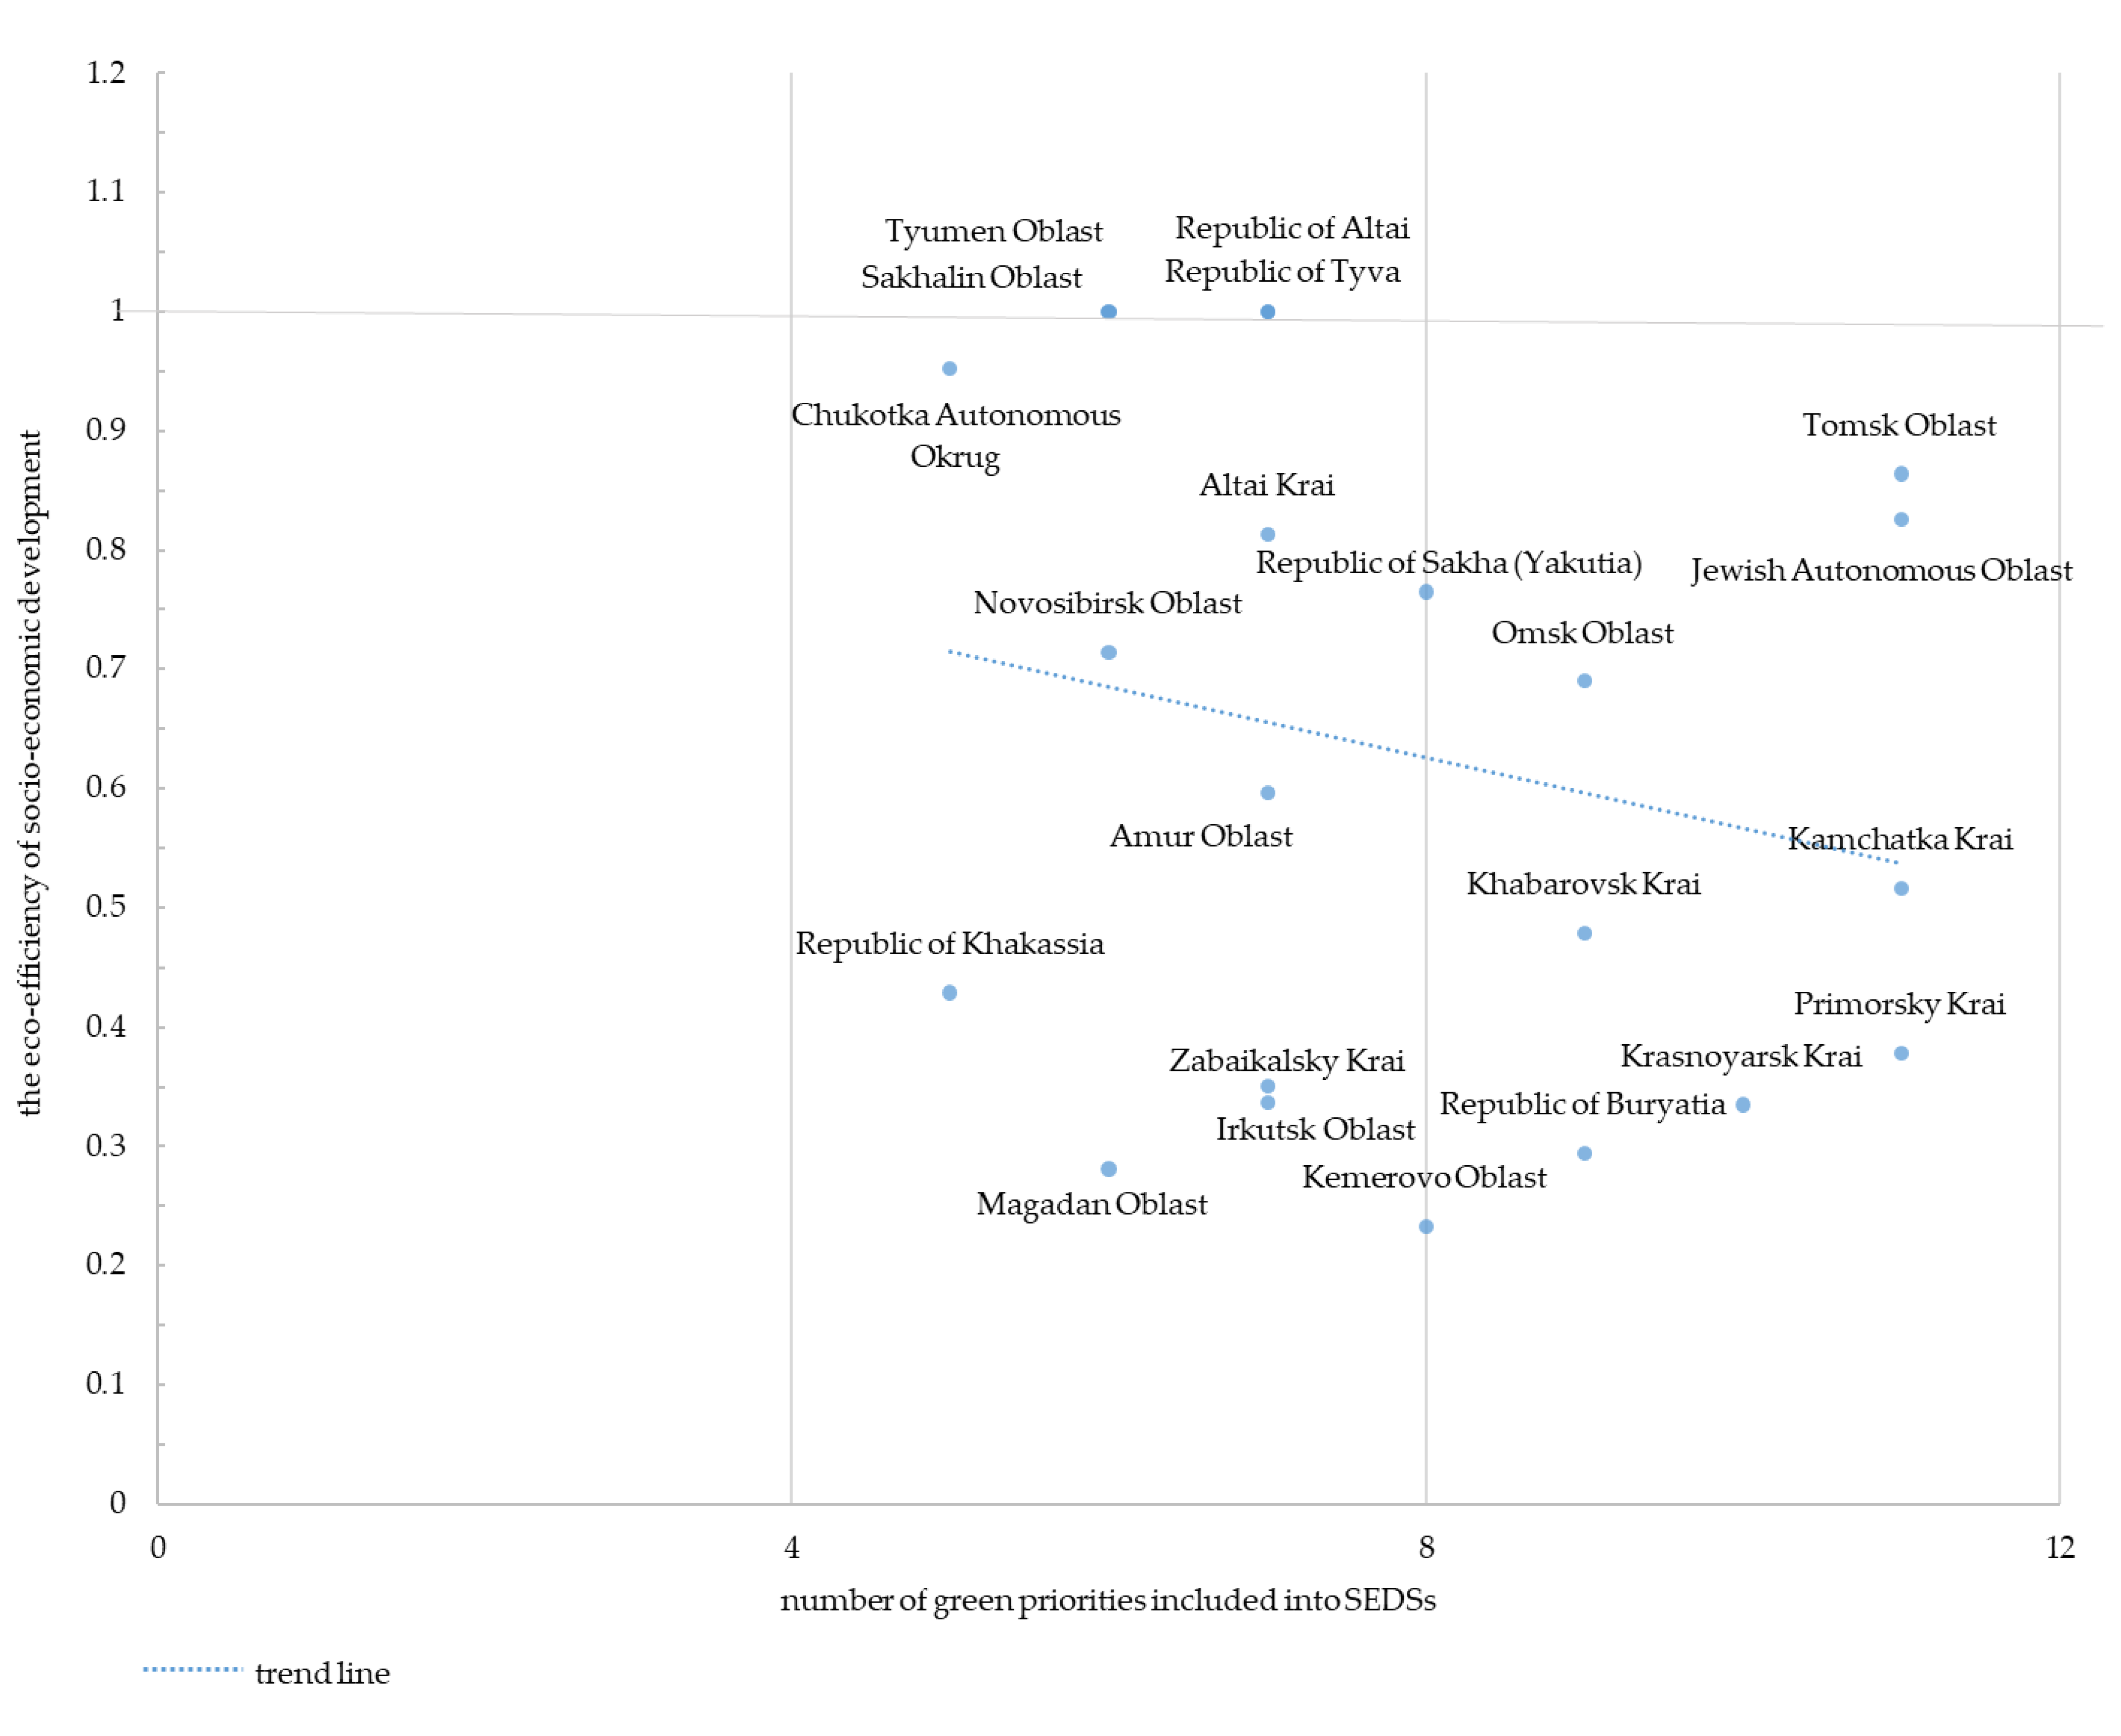
3.2. Analysis of SEDS of the Russian North Asian Regions
4. Discussion
Limitations and Suggestions for Future Research
5. Concluding Remarks
Author Contributions
Funding
Institutional Review Board Statement
Informed Consent Statement
Data Availability Statement
Conflicts of Interest
References
- Dogaru, L. Green Economy and Green Growth—Opportunities for Sustainable Development. Proceedings 2020, 63, 70. [Google Scholar] [CrossRef]
- Towards a Green Economy Pathways to Sustainable Development and Poverty Eradication. Available online: https://www.unep.org/resources/report/towards-green-economy-pathways-sustainable-development-and-poverty-eradication-10 (accessed on 15 April 2022).
- Transforming Our World: The 2030 Agenda for Sustainable Development. Resolution Adopted by the General Assembly on 25 September 2015. Available online: https://www.un.org/en/development/desa/population/migration/generalassembly/docs/globalcompact/A_RES_70_1_E.pdf (accessed on 27 September 2022).
- Steblyanskaya, A.; Ai, M.; Bocharnikov, V.; Denisov, A. Strategies for Green Economy in China. Foresight STI Gov. 2021, 15, 74–85. [Google Scholar] [CrossRef]
- The Future We Want. Resolution Adopted by the General Assembly on 27 July 2012. Available online: https://www.un.org/en/development/desa/population/migration/generalassembly/docs/globalcompact/A_RES_66_288.pdf (accessed on 27 September 2022).
- Declaration on Green Growth. OECD. Available online: http://www.oecd.org/env/44077822.pdf (accessed on 27 September 2022).
- A European Green Deal. Available online: https://ec.europa.eu/info/strategy/priorities-2019-2024/european-green-deal_en (accessed on 25 September 2022).
- Voluntary National Review of the Implementation of the 2030 Agenda for Sustainable Development. Analytical Center for the Government of the Russian Federation. Available online: https://ac.gov.ru/uploads/2-Publications/analitika/DNO.pdf (accessed on 23 September 2022).
- Maran, R.M.; Nedelea, A.M. Green economy: Challenges and opportunities. Ecoforum 2017, 6. Available online: http://ecoforumjournal.ro/index.php/eco/article/view/6432022 (accessed on 12 April 2022).
- Loiseau, E.; Saikku, L.; Antikainen, R.; Droste, N.; Hansjürgens, B.; Pitkänen, K.; Leskinen, P.; Kuikman, P.; Thomsen, M. Green economy and related concepts: An overview. J. Clean Prod. 2016, 139, 361–371. [Google Scholar] [CrossRef]
- Pearce, D.; Markandya, A.; Barbier, E. Blueprint for a Green Economy; Earthscan: London, UK, 1989. [Google Scholar] [CrossRef]
- Merino-Saum, A.; Clement, J.; Wyss, R.; Baldi, M.G. Unpacking the Green Economy concept: A quantitative analysis of 140 definitions. J. Clean Prod. 2020, 242, 118339. [Google Scholar] [CrossRef]
- Tarkhanova, E.A.; Chizhevskaya, E.L.; Fricler, A.V.; Baburina, N.A.; Firtseva, S.V. Green economy in Russia: The investments’ review, indicators of growth and development prospects. Entrep. Sustain. Issues 2020, 8, 649–661. [Google Scholar] [CrossRef]
- Dvoretskaya, A.E. Green financing as a modern trend in the global economy. Vestn. Akademii. 2017, 2, 60–65. [Google Scholar]
- Bocharnikov, V.N. Russia needs a new vector—“Green economy” and nature. Bull. Assoc. Russ. Geogr. Soc. Sci. 2020, 1, 106–113. [Google Scholar]
- Weng, Q.; Xu, H.; Ji, Y. Growing a green economy in China. IOP Conf. Ser. Earth Environ. Sci. 2018, 121, 052082. [Google Scholar] [CrossRef]
- Alekna, R.; Kazlauskienė, E. Evaluation Indicators of Green Economic Development: The Case of the Baltic Countries. Econ. Cult. 2020, 17, 150–163. [Google Scholar] [CrossRef]
- Vertakova, Y.V.; Evchenko, A.V.; Shcherbakov, D.V. Green economy and sustainable development: Towards “ecologization” state socio-economic policy in the context of institutional transformation. Proc. Southwest State Univ. Ser. Econ. Sociol. Manag. 2020, 10, 24–36. [Google Scholar]
- Pakhomova, N.V.; Rikhter, K.K.; Vetrova, M.A. Transition to circular economy and closed-loop supply chains as driver of sustainable development. St Petersburg Univ. J. Econ. Stud. 2017, 33, 244–268. [Google Scholar] [CrossRef] [Green Version]
- Yi, H.; Liu, Y. Green economy in China: Regional variations and policy drivers. Glob. Environ. Chang. 2015, 31, 11–19. [Google Scholar] [CrossRef]
- Alia, E.B.; Anufriev, V.P.; Amfob, B. Green economy implementation in Ghana as a road map for a sustainable development drive: A review. Sci. Afr. 2021, 12, e00756. [Google Scholar] [CrossRef]
- Republic of Korea, National Strategy for Green Growth and Five-Year Plan (Seoul, Presidential Committee on Green Growth, 2009). Available online: http://www.greengrowth.go.kr/?page_id=2450 (accessed on 10 February 2022).
- Green Growth Strategy Through Achieving Carbon Neutrality in 2050 Formulated. Available online: https://www.meti.go.jp/english/press/2020/1225_001.html (accessed on 11 February 2022).
- Bobylev, S.N.; Vishnyakova, V.S.; Komarova, I.I.; Kurteev, V.V.; Lipina, S.A.; Nazarova, V.O.; Pashennykh, F.S.; Tkachenko, N.F.; Udod, V.I.; Shumikhin, O.V.; et al. Green Economy. A New Paradigm for the Country’s Development; SOPS: Moscow, Russia, 2015. [Google Scholar]
- Strategy for Socio-Economic Development of the Russian Federation with Low Greenhouse Gas Emissions until 2050. Available online: http://static.government.ru/media/files/ADKkCzp3fWO32e2yA0BhtIpyzWfHaiUa.pdf (accessed on 12 March 2022).
- Zabortseva, T.I.; Kuznetsova, A.N.; Violin, S.I.; Sysoeva, N.M. The potential of a “green” economy in the socio-economic development of Irkutsk Oblast. Geogr. Nat. Resour. 2017, 4, 154–161. [Google Scholar]
- Kozhevnikov, S.A.; Lebedeva, M.A. Problems of transition to green economy in the region (based on materials of the European North of Russia). Probl. Territ. Dev. 2019, 4, 72–88. [Google Scholar] [CrossRef]
- Bilgaev, A.; Sadykova, E.; Li, F.; Mikheeva, A.; Dong, S. Socio-Economic Factor Impact on the Republic of Buryatia (Russia) Green Economic Development Transition. Int. J. Environ. Res. Public Health 2021, 18, 10984. [Google Scholar] [CrossRef]
- Global Green Economy Index—Dual Citizen LLC. Available online: https://dualcitizeninc.com › global-green-economy-index (accessed on 20 March 2022).
- Zhang, N.; Kong, F.; Choi, Y. Measuring sustainability performance for China: A sequential generalized directional distance function approach. Econ. Model. 2014, 41, 392–397. [Google Scholar] [CrossRef]
- Lebedeva, M.A. Green economy development in a region: Assessment and prospects (on the materials of the European North of Russian regions). Urgent Probl. Econ. Manag. 2020, 3, 81–91. [Google Scholar]
- Schaltegger, S.; Sturm, A. Ökologieinduzierte Entscheidungsprobleme des Managements: Ansatzpunkte zur Ausgestaltung von Instrumenten; WWZ-Discuss. Pap. No. 8914. WWZ: Basel, Switzerland, 1989. [Google Scholar]
- Eco-Efficiency; OECD Publishing: Paris, France, 2008. [CrossRef]
- Eco-Efficiency Indicators: Measuring Resource-Use Efficiency and the Impact of Economic Activities on the Environment. UN.ESCAP. 2009. Available online: https://hdl.handle.net/20.500.12870/1598 (accessed on 20 March 2022).
- Charnes, A.; Cooper, W.W.; Rhodes, E. Measuring the efficiency of decision making units. Eur. J. Oper. Res. 1978, 2, 429–444. [Google Scholar] [CrossRef]
- Farrell, M.J. The Measurement of Productive Efficiency. J. R. Stat. Soc. 1957, 120, 253–281. [Google Scholar] [CrossRef]
- Athanassopoulos, A.D. Performance improvement decision aid systems (PIDAS) in retailing organizations using data envelopment analysis. J. Product. Anal. 1995, 6, 153–170. [Google Scholar] [CrossRef]
- Barr, R.S.; Seiford, L.M.; Siems, T.F. An envelopment-analysis approach to measuring the managerial efficiency of banks. Ann. Oper. Res. 1993, 45, 1–19. [Google Scholar] [CrossRef]
- Charnes, A. Comparisons of DEA and Existing Ratio and Regressions Systems for Effecting Efficiency Evaluations of Regulated Elective Cooperatives in Texas. Res. Gov. Nonprofit Account. 1989, 5, 187–210. [Google Scholar]
- Zurano-Cervelló, P.; Pozo, C.; Mateo-Sanz, J.M.; Jiménez, L.; Guillén-Gosálbez, G. Eco-efficiency assessment of EU manufacturing sectors combining input-output tables and data envelopment analysis following production and consumption-based accounting approaches. J. Clean Prod. 2018, 174, 1161–1189. [Google Scholar] [CrossRef]
- Zhou, H.; Yang, Y.; Chen, Y.; Zhu, J. Data envelopment analysis application in sustainability: The origins, development and future directions. Eur. J. Oper. Res. 2018, 264, 1–16. [Google Scholar] [CrossRef]
- Ratner, S.V. Dynamic problems of estimation of ecological-economic efficiency of regions based on basic models of data envelopment analysis. Large-Scale Syst. Control 2017, 67, 81–106. [Google Scholar] [CrossRef]
- Zemtsov, S.P.; Kidyaeva, V.M.; Barinova, V.A.; Lanshina, T.A. Ecological efficiency and sustainable regional development in Russia during the 20 years of resource-based growth. Econ. Policy 2020, 15, 18–47. [Google Scholar] [CrossRef]
- Bobylev, S.N.; Kiryushin, P.A.; Kudryavtsev, O.V. (Eds.) Green Economy and Sustainable Development Goals for Russia: Collective Monograph; Faculty of Economics of Moscow State University Named after M.V. Lomonosov: Moscow, Russia, 2019. [Google Scholar]
- Tulokhonov, A.K. Political Geography of the Northern Asian States in the Globalization or How to Equip the Russian Periphery; EKOS: Ulan-Ude, Russia, 2014. [Google Scholar]
- Tone, K.A. A slacks-based measure of efficiency in data envelopment analysis. Eur. J. Oper. Res. 2001, 130, 498–509. [Google Scholar] [CrossRef] [Green Version]
- Tone, K. On the Consistency of Slacks-based Measure-max Model and Super-slacks-based Measure Model Kaoru Tone. Univers. J. Manag. 2017, 5, 160–165. [Google Scholar] [CrossRef] [Green Version]
- Lissitsa, A.; Babiéceva, T. The Data Envelopment Analysis (DEA) for Determining the Efficiency of a Production. Discussion Paper, No. 50. Institute of Agricultural Development in Central and Eastern Europe (IAMO): Halle (Saale), 2003. Available online: http://hdl.handle.net/10419/28581 (accessed on 20 March 2022). (In Russian).
- Chen, Y.; Miao, J.; Zhu, Zh. Measuring green total factor productivity of China’s agricultural sector: A three-stage SBM-DEA model with non-point source pollution and CO2 emissions. J. Clean Prod. 2021, 318, 128543. [Google Scholar] [CrossRef]
- Du, Y.-W.; Jiang, J.; Li, C.-H. Ecological efficiency evaluation of marine ranching based on the Super-SBM model: A case study of Shandong. Ecol. Indic. 2021, 131, 108174. [Google Scholar] [CrossRef]
- Hong, L.; Fang, K.; Wei, Y.; Hong, X.X. Regional environmental efficiency evaluation in China: Analysis based on the SuperSBM model with undesirable outputs. Math. Comput. Model. 2013, 58, 1018–1031. [Google Scholar] [CrossRef]
- Djordjević, B.; Krmac, E. Evaluation of Energy-Environment Efficiency of European Transport Sectors: Non-Radial DEA and TOPSIS Approach. Energies 2019, 12, 2907. [Google Scholar] [CrossRef] [Green Version]
- Park, Y.S.; Lim, S.H.; Egilmez, G.; Szmerekovsky, J. Environmental efficiency assessment of U.S. transport sector: A slack-based data envelopment analysis approach. Transp. Res. Part D Transp. Environ. 2018, 61, 152–164. [Google Scholar] [CrossRef]
- Sueyoshi, T.; Goto, M. Returns to Scale and Damages to Scale with Strong Complementary Slackness Conditions in DEA Assessment: Japanese Corporate Effort on Environment Protection. Energy Econ. 2012, 34, 1422–1434. [Google Scholar] [CrossRef]
- Scheel, H. Undesirable outputs in efficiency evaluation. Eur. J. Oper. Res. 2001, 132, 400–410. [Google Scholar] [CrossRef]
- You, S.; Yan, H. A new approach in modelling undesirable output in DEA model. J. Oper. Res. Soc. 2011, 62, 2146–2156. [Google Scholar] [CrossRef]
- Jahanshahloo, G.R.; Hosseinzadeh, L.F.; Maddahi, R.; Jafari, Y. Efficiency and benchmarking in the presence of undesirable (bad) outputs: A DEA approach. Int. J. Appl. Math. Res. 2012, 3, 178–188. [Google Scholar] [CrossRef]
- Tone, K. Dealing with Undesirable Outputs in DEA: A Slacks-Based Measure (SBM) Approach; National Graduate Institute for Policy Studies: Tokyo, Japan, 2003; Available online: https://www.researchgate.net/profile/Kaoru-Tone/publication/284047010_Dealing_with_undesirable_outputs_in_DEA_a_Slacks-Based_Measure_SBM_approach (accessed on 23 September 2022).
- Demiral, E.; Sağlam, Ü. Eco-efficiency and Eco-productivity assessments of the states in the United States: A two-stage Non-parametric analysis. Appl. Energy 2021, 303, 117649. [Google Scholar] [CrossRef]
- Golany, B.; Roll, Y. An application procedure for DEA. Int. J. Manag. Sci. 1989, 17, 237–250. [Google Scholar] [CrossRef]
- Decoupling Natural Resource Use and Environmental Impacts from Economic Growth. UNEP. 2011. Available online: http:// www.gci.org.uk/Documents/Decoupling_Report_English.pdf (accessed on 10 February 2022).
- Tyteca, D. Linear Programming Models for the Measurement of Environmental Performance of Firms-Concepts and Empirical Results. J. Prod. Anal. 1997, 8, 183–197. [Google Scholar]
- Zhang, B.; Bi, J.; Yuan, Z.; Yuan, Z.W.; Ge, J.J. Eco-efficiency analysis of industrial system in China: A data envelopment analysis approach. Ecol. Econ. 2008, 68, 306–316. [Google Scholar] [CrossRef]
- Egilmez, G.; Kucukvar, M.; Tatari, O. Sustainability assessment of U.S. manufacturing sectors: An economic input output-based frontier approach. J. Clean. Prod. 2013, 53, 91–102. [Google Scholar] [CrossRef]
- Guo, L.; Xu, S.Q. Industrial eco-efficiency based on super-efficiency DEA: Take the data of six provinces in central China for 2003–2013 as an example. Econ. Geogr. 2016, 36, 116–121. [Google Scholar]
- Krippendorff, K. Content Analysis. An Introduction to Its Methodology; SAGE Publication Inc.: Los Angeles, CA, USA, 2018. [Google Scholar]
- Boshno, S. Content analysis as a method of scientific activity. Law and Modern States 2021, 5–6, 26–44. [Google Scholar] [CrossRef]


| Variable | Indicator | Unit | Mean | Max | Min | Std.dev. |
|---|---|---|---|---|---|---|
| Input | Total annual emissions of pollutants into the atmospheric air from stationary sources | million tons | 0.419 | 3.520 | 0.004 | 0.741 |
| Total annual emissions of pollutants into the atmospheric air from mobile sources | million tons | 0.130 | 0.531 | 0.001 | 0.117 | |
| Volumes of non-treated or non-sufficiently treated wastewaters that were discharged into water bodies | million cubic meters | 133.25 | 1009.24 | 0.24 | 177.21 | |
| Amount of landfilled waste | million tons | 96.91 | 1897.89 | 0.001 | 498.04 | |
| Volume of freshwater abstraction (surface and groundwaters) | million cubic meters | 580.40 | 4158.19 | 6.95 | 835.28 | |
| Output | Gross regional product in constant prices | millions of chained 2010 rubles | 467,565.07 | 3,812,654.47 | 22,393.7 | 718,071.7 |
| Resident population | million person | 1.321 | 3.74 | 0.05 | 1.048 |
| Regions | 2010 | 2011 | 2012 | 2013 | 2014 | 2015 | 2016 | 2017 | 2018 | 2019 | Average Value for 2010–2019 |
|---|---|---|---|---|---|---|---|---|---|---|---|
| Altai Krai | 1.000 | 0.661 | 0.661 | 1.000 | 1.000 | 1.000 | 1.000 | 0.754 | 0.711 | 0.340 | 0.813 |
| Amur Oblast | 0.503 | 0.507 | 0.507 | 0.450 | 0.596 | 0.505 | 0.631 | 0.562 | 0.700 | 1.000 | 0.596 |
| Jewish Autonomous Oblast | 1.000 | 1.000 | 1.000 | 0.540 | 0.488 | 0.446 | 1.000 | 1.000 | 1.000 | 0.783 | 0.826 |
| Zabaikalsky Krai | 0.315 | 0.320 | 0.320 | 0.391 | 0.402 | 0.325 | 0.353 | 0.328 | 0.337 | 0.414 | 0.351 |
| Irkutsk Oblast | 0.253 | 0.237 | 0.237 | 0.227 | 0.472 | 0.327 | 0.338 | 0.551 | 0.356 | 0.370 | 0.337 |
| Kamchatka Krai | 0.535 | 0.563 | 0.563 | 0.414 | 1.000 | 0.469 | 0.563 | 0.413 | 0.414 | 0.224 | 0.516 |
| Kemerovo Oblast | 0.267 | 0.258 | 0.258 | 0.253 | 0.266 | 0.203 | 0.205 | 0.212 | 0.196 | 0.215 | 0.233 |
| Krasnoyarsk Krai | 0.288 | 0.292 | 0.292 | 0.274 | 0.539 | 0.298 | 0.332 | 0.384 | 0.412 | 0.244 | 0.335 |
| Magadan Oblast | 0.307 | 0.305 | 0.305 | 0.311 | 0.310 | 0.303 | 0.287 | 0.297 | 0.279 | 0.110 | 0.281 |
| Novosibirsk Oblast | 0.745 | 0.770 | 0.770 | 0.626 | 1.000 | 0.543 | 1.000 | 0.553 | 0.557 | 0.572 | 0.714 |
| Omsk Oblast | 0.622 | 0.537 | 0.537 | 0.602 | 0.723 | 0.529 | 0.684 | 1.000 | 1.000 | 0.668 | 0.690 |
| Primorsky Krai | 0.355 | 0.379 | 0.379 | 0.377 | 0.395 | 0.313 | 0.333 | 0.400 | 0.428 | 0.419 | 0.378 |
| Republic of Altai | 1.000 | 1.000 | 1.000 | 1.000 | 1.000 | 1.000 | 1.000 | 1.000 | 1.000 | 1.000 | 1.000 |
| Republic of Buryatia | 0.399 | 0.362 | 0.362 | 0.317 | 0.268 | 0.223 | 0.241 | 0.257 | 0.250 | 0.263 | 0.294 |
| Republic of Sakha (Yakutia) | 0.613 | 0.506 | 0.506 | 0.552 | 1.000 | 1.000 | 1.000 | 1.000 | 0.477 | 1.000 | 0.765 |
| Republic of Tyva | 1.000 | 1.000 | 1.000 | 1.000 | 1.000 | 1.000 | 1.000 | 1.000 | 1.000 | 1.000 | 1.000 |
| Republic of Khakassia | 0.379 | 0.423 | 0.423 | 0.479 | 0.467 | 0.428 | 0.461 | 0.446 | 0.319 | 0.467 | 0.429 |
| Sakhalin Oblast | 1.000 | 1.000 | 1.000 | 1.000 | 1.000 | 1.000 | 1.000 | 1.000 | 1.000 | 1.000 | 1.000 |
| Tomsk Oblast | 1.000 | 1.000 | 1.000 | 0.815 | 1.000 | 0.610 | 1.000 | 1.000 | 0.845 | 0.370 | 0.864 |
| Tyumen Oblast 1 | 1.000 | 1.000 | 1.000 | 1.000 | 1.000 | 1.000 | 1.000 | 1.000 | 1.000 | 1.000 | 1.000 |
| Khabarovsk Krai | 0.569 | 0.518 | 0.518 | 0.572 | 0.461 | 0.419 | 0.417 | 0.477 | 0.456 | 0.380 | 0.479 |
| Chukotka Autonomous Okrug | 1.000 | 1.000 | 1.000 | 1.000 | 1.000 | 1.000 | 0.519 | 1.000 | 1.000 | 1.000 | 0.952 |
| The Strategic Priorities Included into SEDSs | ||||||||||
|---|---|---|---|---|---|---|---|---|---|---|
| Regions | Social Policy | Economic Policy | Infrastructure Policy | Spatial Development Policy | Environmental Policy | Effective Public Administration | Science and Innovation | Foreign Economic | Digital Society Infrastructure | New Positioning in the Far East and in the Asia-Pacific Region |
| Altai Krai | ||||||||||
| Amur Oblast | ||||||||||
| Jewish Autonomous Oblast | ||||||||||
| Zabaikalsky Krai | ||||||||||
| Irkutsk Oblast | ||||||||||
| Kamchatka Krai | ||||||||||
| Kemerovo Oblast | ||||||||||
| Krasnoyarsk Krai | ||||||||||
| Magadan Oblast | ||||||||||
| Novosibirsk Oblast | ||||||||||
| Omsk Oblast | ||||||||||
| Primorsky Krai | ||||||||||
| Republic of Altai | ||||||||||
| Republic of Buryatia | ||||||||||
| Republic of Sakha (Yakutia) | ||||||||||
| Republic of Tyva | ||||||||||
| Republic of Khakassia | ||||||||||
| Sakhalin Oblast | ||||||||||
| Tomsk Oblast | ||||||||||
| Tyumen Oblast 1 | ||||||||||
| Khabarovsk Krai | ||||||||||
| Chukotka Autonomous Okrug | ||||||||||
| Total | 21 | 21 | 11 | 11 | 9 | 6 | 6 | 3 | 1 | 1 |
Publisher’s Note: MDPI stays neutral with regard to jurisdictional claims in published maps and institutional affiliations. |
© 2022 by the authors. Licensee MDPI, Basel, Switzerland. This article is an open access article distributed under the terms and conditions of the Creative Commons Attribution (CC BY) license (https://creativecommons.org/licenses/by/4.0/).
Share and Cite
Lubsanova, N.B.; Maksanova, L.B.-Z.; Eremko, Z.S.; Bardakhanova, T.B.; Mikheeva, A.S. The Eco-Efficiency of Russian Regions in North Asia: Their Green Direction of Regional Development. Sustainability 2022, 14, 12776. https://doi.org/10.3390/su141912776
Lubsanova NB, Maksanova LB-Z, Eremko ZS, Bardakhanova TB, Mikheeva AS. The Eco-Efficiency of Russian Regions in North Asia: Their Green Direction of Regional Development. Sustainability. 2022; 14(19):12776. https://doi.org/10.3390/su141912776
Chicago/Turabian StyleLubsanova, Natalia Borisovna, Lyudmila Bato-Zhargalovna Maksanova, Zinaida Sergeevna Eremko, Taisiya Borisovna Bardakhanova, and Anna Semenovna Mikheeva. 2022. "The Eco-Efficiency of Russian Regions in North Asia: Their Green Direction of Regional Development" Sustainability 14, no. 19: 12776. https://doi.org/10.3390/su141912776