Article

Scenario Simulation for the Urban Carrying Capacity Based on System Dynamics Model in Shanghai, China

1
School of Civil Engineering, Shandong Jiaotong University, Ji’nan 250307, China
2
College of Surveying and Geo-Informatics, Tongji University, Shanghai 200092, China
*
Author to whom correspondence should be addressed.
Sustainability 2022, 14(19), 12910; https://doi.org/10.3390/su141912910
Submission received: 24 August 2022 / Revised: 8 October 2022 / Accepted: 8 October 2022 / Published: 10 October 2022

Abstract

:
Shanghai, as an international metropolis, has an ever-growing population and ongoing economic development, so the pressure on the natural resources and the environment is continually increased. How to ease the tension among economy, resources and the environment? The sustainable green development of Shanghai has been the focus of the public and the government. Urban carrying capacity involves complex interactions among population, the economy and the environment. Understanding the balance between these elements is an important scientific issue for sustainable green development in Shanghai. For this purpose, the balance between urban development and ecological resources was emphasized, and population carrying capacity, GDP (Gross Domestic Product), green ecological index and added value of secondary industry were investigated to measure urban carrying capacity. The dynamic changes of the carrying population, GDP, green ecological index and the added value of the secondary industry in Shanghai during 2018–2035 were simulated using a system dynamics model including three subsystems and 66 variables from a macroscopic perspective. Five development scenarios were employed during the simulation, namely a status-quo scenario, an economic-centric scenario, a high-tech-centric scenario, an environment-centric scenario and a coordinated equilibrium scenario. The simulation results indicated that the potential of carrying population will decline by 2035, and the economic and ecological indicators will also be at a low level under the status-quo scenario, which is an inferior option, while the under coordinated equilibrium scenario, the ecological environment, population growth and economic development will all perform excellently, which is the best option. Therefore, the urban carrying capacity of population, economy and resources in Shanghai may be improved by increasing investment in scientific research, increasing the expenditure on environmental protection and improving the recycling efficiency of waste solid and water. The results provide insights into the urban carrying capacity of Shanghai city.

Graphical Abstract

1. Introduction

The coordinated development of society, the economy and the environment has always been the key issue of regional sustainable development since the concept of sustainable development was put forward by the Commission on World and Environmental Development in 1987 [1,2]. With the advancement in worldwide urbanization and industrialization, the contradiction between socio-economic development, population, resources and environment have become increasingly prominent, which restricts the sustainable development of the region [3,4]. Since the open-door reform policy in 1978 in China, much has changed [5]. One of the major changes is the tremendous improvement of social productivity and rapid economic growth [6]. Another change is the rapid population growth in large cities [7]. Meanwhile, many global environmental issues have emerged, such as excessive exploitation of natural resources, municipal solid waste and the deterioration of the human settlement environment [8,9,10]. In order to tackle these problems, we integrated the concept of carrying capacity into the management of urban development. Urban carrying capacity (UCC), or urban comprehensive carrying capacity, is an important barometer of urban sustainable development. This research topic is, however, not easy to standardize due to different meanings, principles, and focal points [11,12,13].
Overall, the development of urban carrying capacity can be divided into three phases. In phase 1, in the twenty years of China’s reform and opening up, insufficient natural resources and environmental destruction phenomena has emerged as the urban economy grew rapidly. While the research on urban carrying capacity in this period considered urban resources and the environment, economic development was still a primary issue for city builders. In phase 2, practitioners and academics began to attach great importance to the resource availability and environmental quality within a city from the late 1990s to the early 2000s. Currently, China, at its third stage of urban carrying capacity, is undergoing comprehensive development, which should consider resource, environmental, economic, and social factors. Among these, social factors include not only the direct promotion effect brought by basic public facilities to the city but also soft condition improvement. These factors are closely related to social productivity and production relations. The facility element is an important part of the social subsystem because it includes a series of materialized or knowledgeable human labor products, such as technology, infrastructure and public facilities. Soft conditions, such as laws, cultural, education, social relations, and medical and health care based on production relations, also play an important supporting role in maintaining the production, distribution and circulation of social subsystems [14].
Against this background, the research on urban carrying capacity has gained increasing attention in the scientific community. The term ‘carrying capacity’ was first proposed in studies of physics, demography, and biology [15]. With advances in research on UCC, previous published studies have been limited to a single issue, such as land carrying capacity [16,17], water resource carrying capacity [6,18,19], tourist environmental carrying capacity [20,21] and economy carrying capacity [22].
From the perspective of the whole research process, although the connotation of carrying capacity is constantly enriched, relative research about urban carrying capacity is still in its infancy. Generally speaking, recent studies have not formed a unified and robust basic theory, and the model method has been single. In respect of research methods of urban carrying capacity, these have been mainly focused on the index evaluation method and system dynamics (SD) method [23,24]. Index evaluation methods, such as principal component analysis [25,26], artificial neural networks [27], the expert evaluation method [28] and fuzzy comprehensive evaluation method have been universally accepted because of their simple operation. Zhang et al. (2019) [26] evaluated the variation trend of water resources carrying capacity on a time scale using principal component analysis. However, the interpretation of the principal component is fuzzy, which has poor explanatory value for real life. Artificial neural network prediction is based on relatively independent systems, which implies that the coupling between the systems is relatively challenging. The expert evaluation method has a certain level of subjectivity in determining the weight of the index. Due to the systemic, dynamics and feedback of urban carrying capacity, traditional low-order and linear theories are not conducive to effectively solve this complex system problem. The SD method simulates the causality between factors through positive and negative feedback. It has the ability to deal with high-order, nonlinear and other complex system problems and is gradually used by scholars to investigate the carrying capacity of water resources [29] and land resources [30]. The biggest difference between SD and other methods is that it has its own negative feedback system, that is, a readjustment of constraint conditions [31,32]. Hence, a system dynamics model is introduced to solve this problem. As a comprehensive simulation model, a system dynamics model can be used to study the behavior of complex systems over time and interact through feedback loops [33].
In this study, five scenarios were designed based on the system dynamics model of Shanghai’s comprehensive urban carrying capacity, which is composed of a social subsystem, an economic subsystem, and an environment subsystem. In addition, the population, economic development and green ecological index of each scenario were simulated and predicted. In conclusion, this paper establishes a coupling model composed of a society-economy-environment(‘SEE’) subsystem to comprehensively evaluate urban carrying capacity, which makes up for the deficiency of single carrying capacity research. Through the green ecological index, the evaluation model of urban carrying capacity is further enriched. The five kinds of urban development scenarios make it more comprehensive in pattern research.

2. Materials and Methods
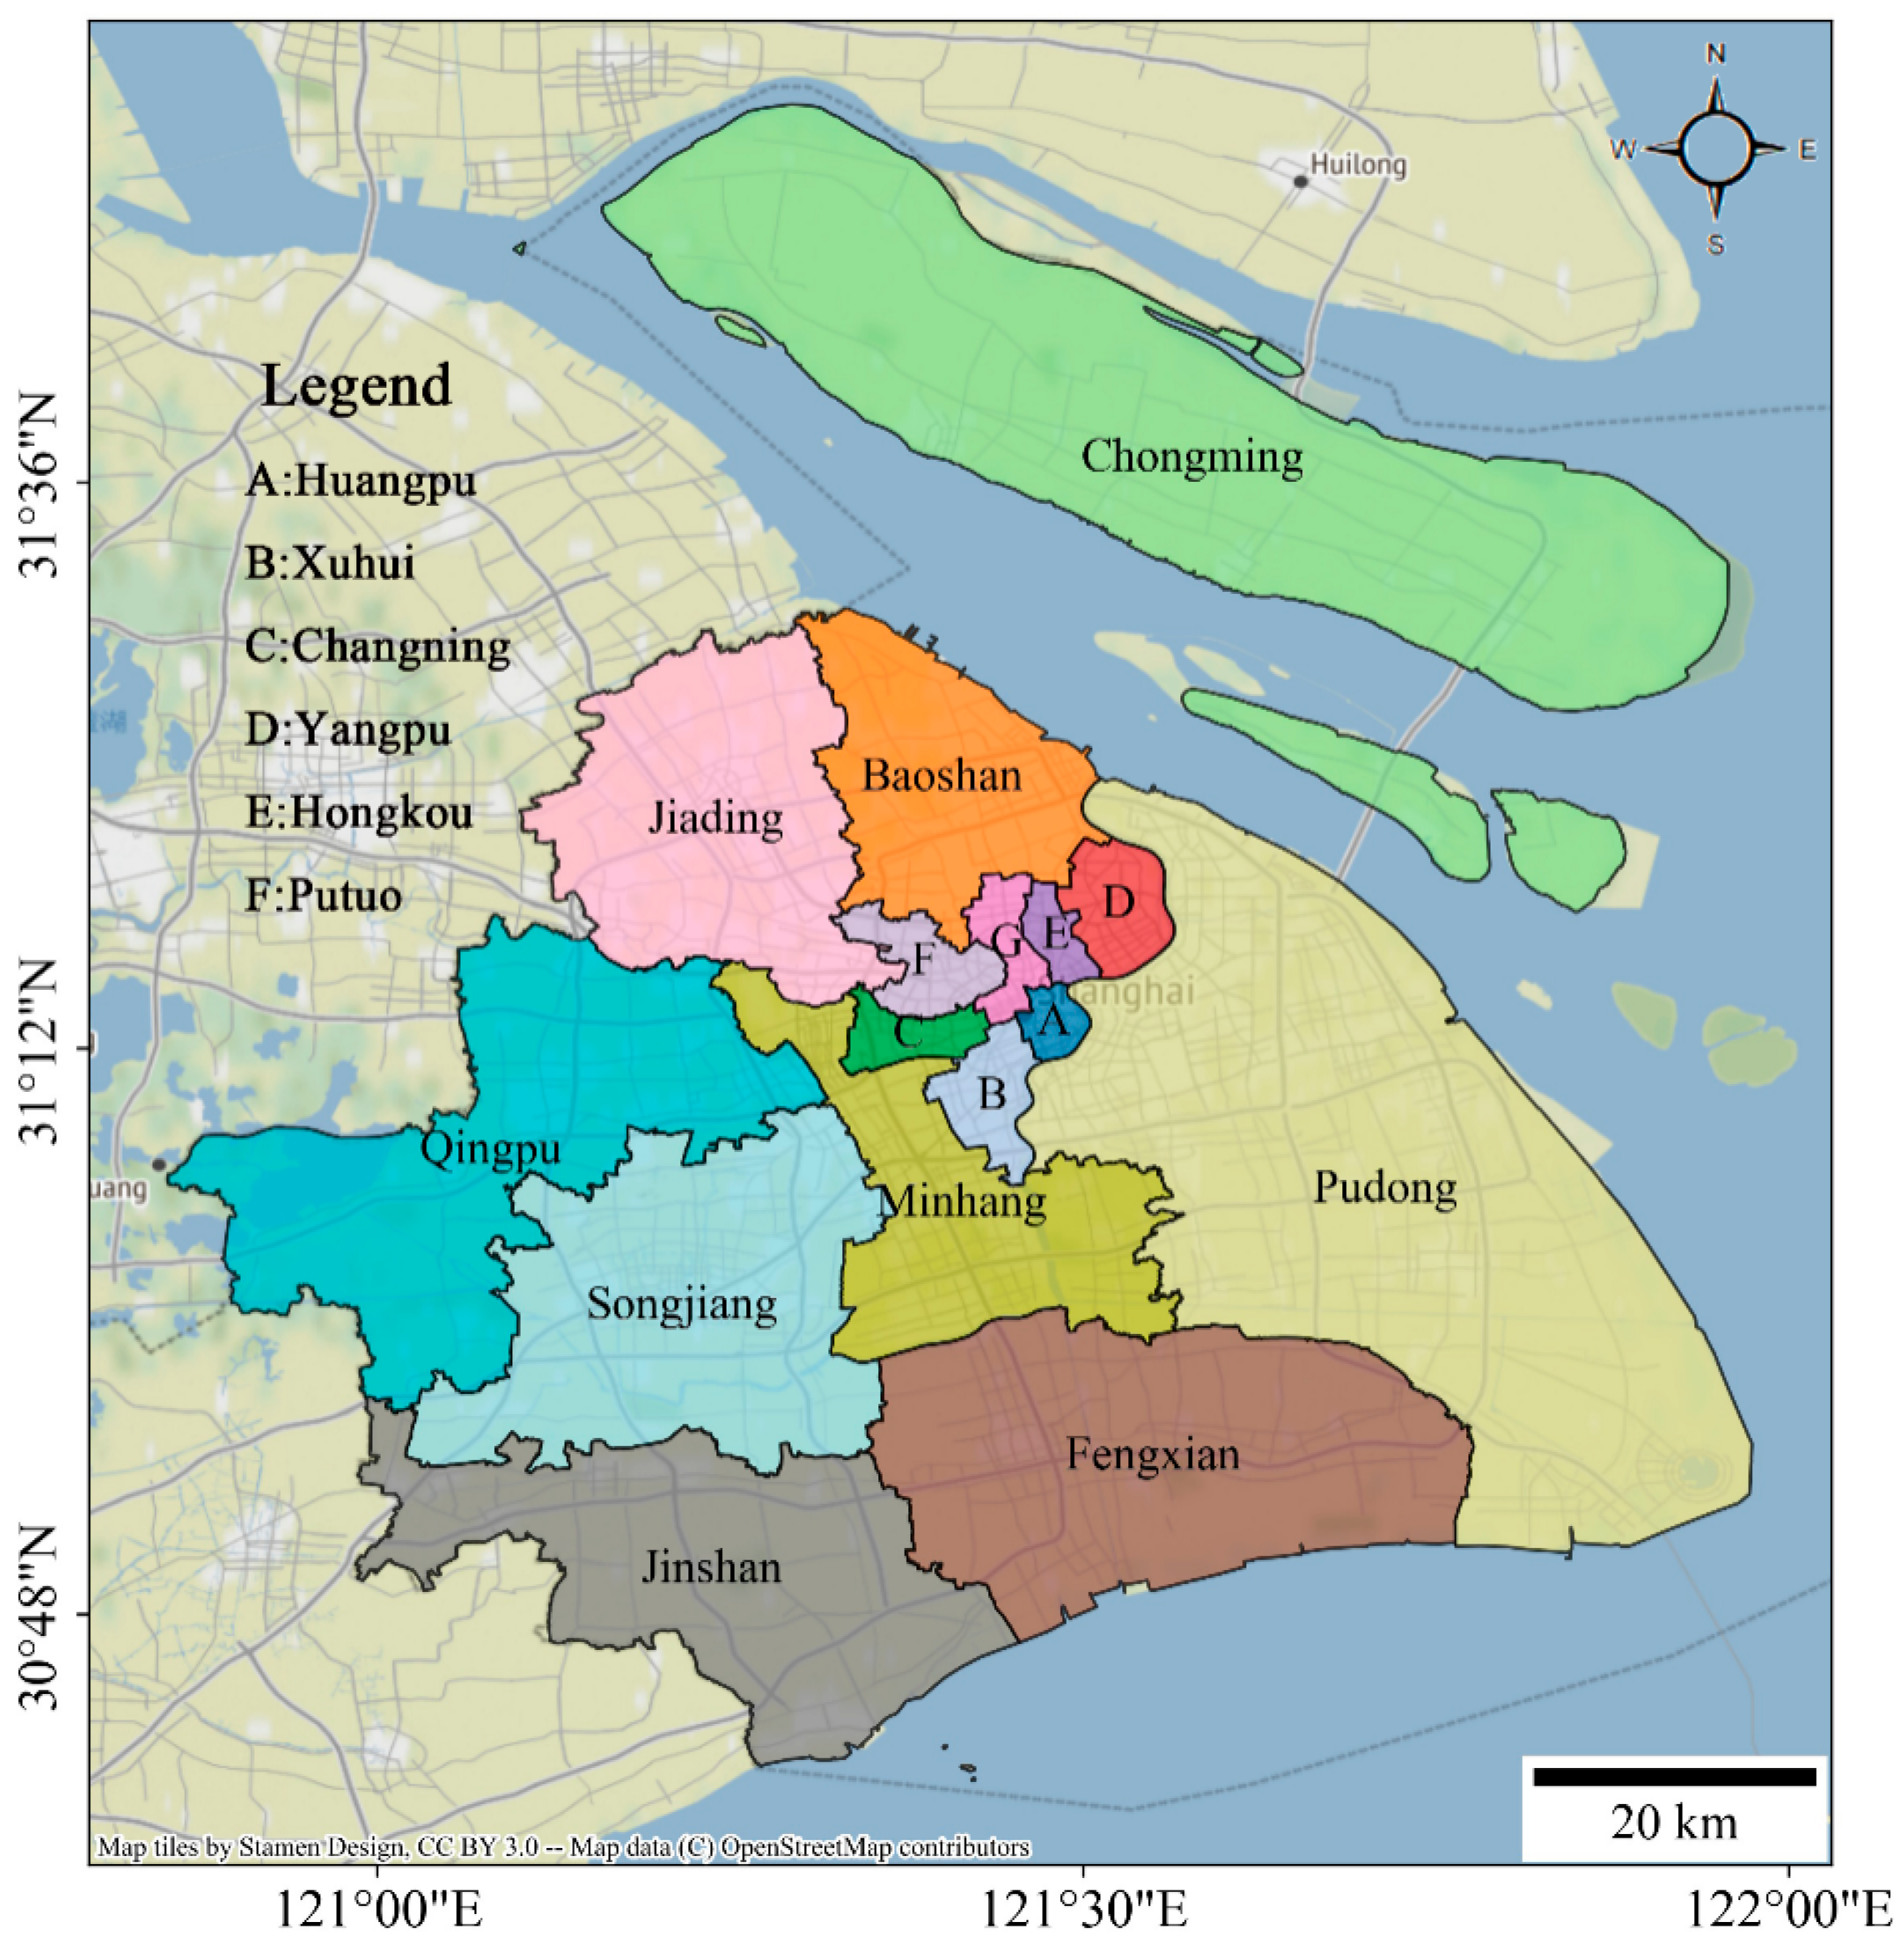
2.1. Study Area

As our research area, we selected Shanghai, which is located at the T-junction of China’s coastal economic belt and the Yangtze River economic belt. As shown in Figure 1, there are 16 districts in Shanghai consisting of nine in the suburbs and seven districts in the downtown, covering a land area of 6833 square kilometers. According to China’s seventh national census in 2020, the permanent population of Shanghai is about 24.87 million, which is an increase of 1.85 million from 10 years ago. From a socio-economic perspective, Shanghai’s GDP ranked first among China’s cities in 2020 and increased 2.5-fold within 10 years from 1.6 to 3.9 trillion yuan. In terms of industrial structure, tertiary industry was the highest, accounting for 72%, while primary industry was the lowest (less than 1%).
The drastic expansion of land use and environmental variations were accompanied by an increase of construction land year by year in Shanghai. Meanwhile, with a proportion of construction land over 40%, the scale of construction land is much higher than Paris and Tokyo, whereas, forest cover was only 15% in 2015, below the national average of 22% and far from the international level of forest coverage of 40% to 60%. It is therefore urgent and challenging to ensure the coordinated development of the society, economy, population, resources and the environment in Shanghai in the future.

2.2. Data Sources

Datasets of population, social economy, ecological resources, new and high technology were used in this research. The main data sources were the Shanghai Statistical Yearbooks (2010–2018), Statistical Communique of Shanghai National Economic and Social Development (2010–2018), the Shanghai Ecological Environment Conditions Bulletin (2010–2018), Shanghai Master Plan 2017–2035 and Statistical Yearbooks of Chinese Cities (2011–2018).

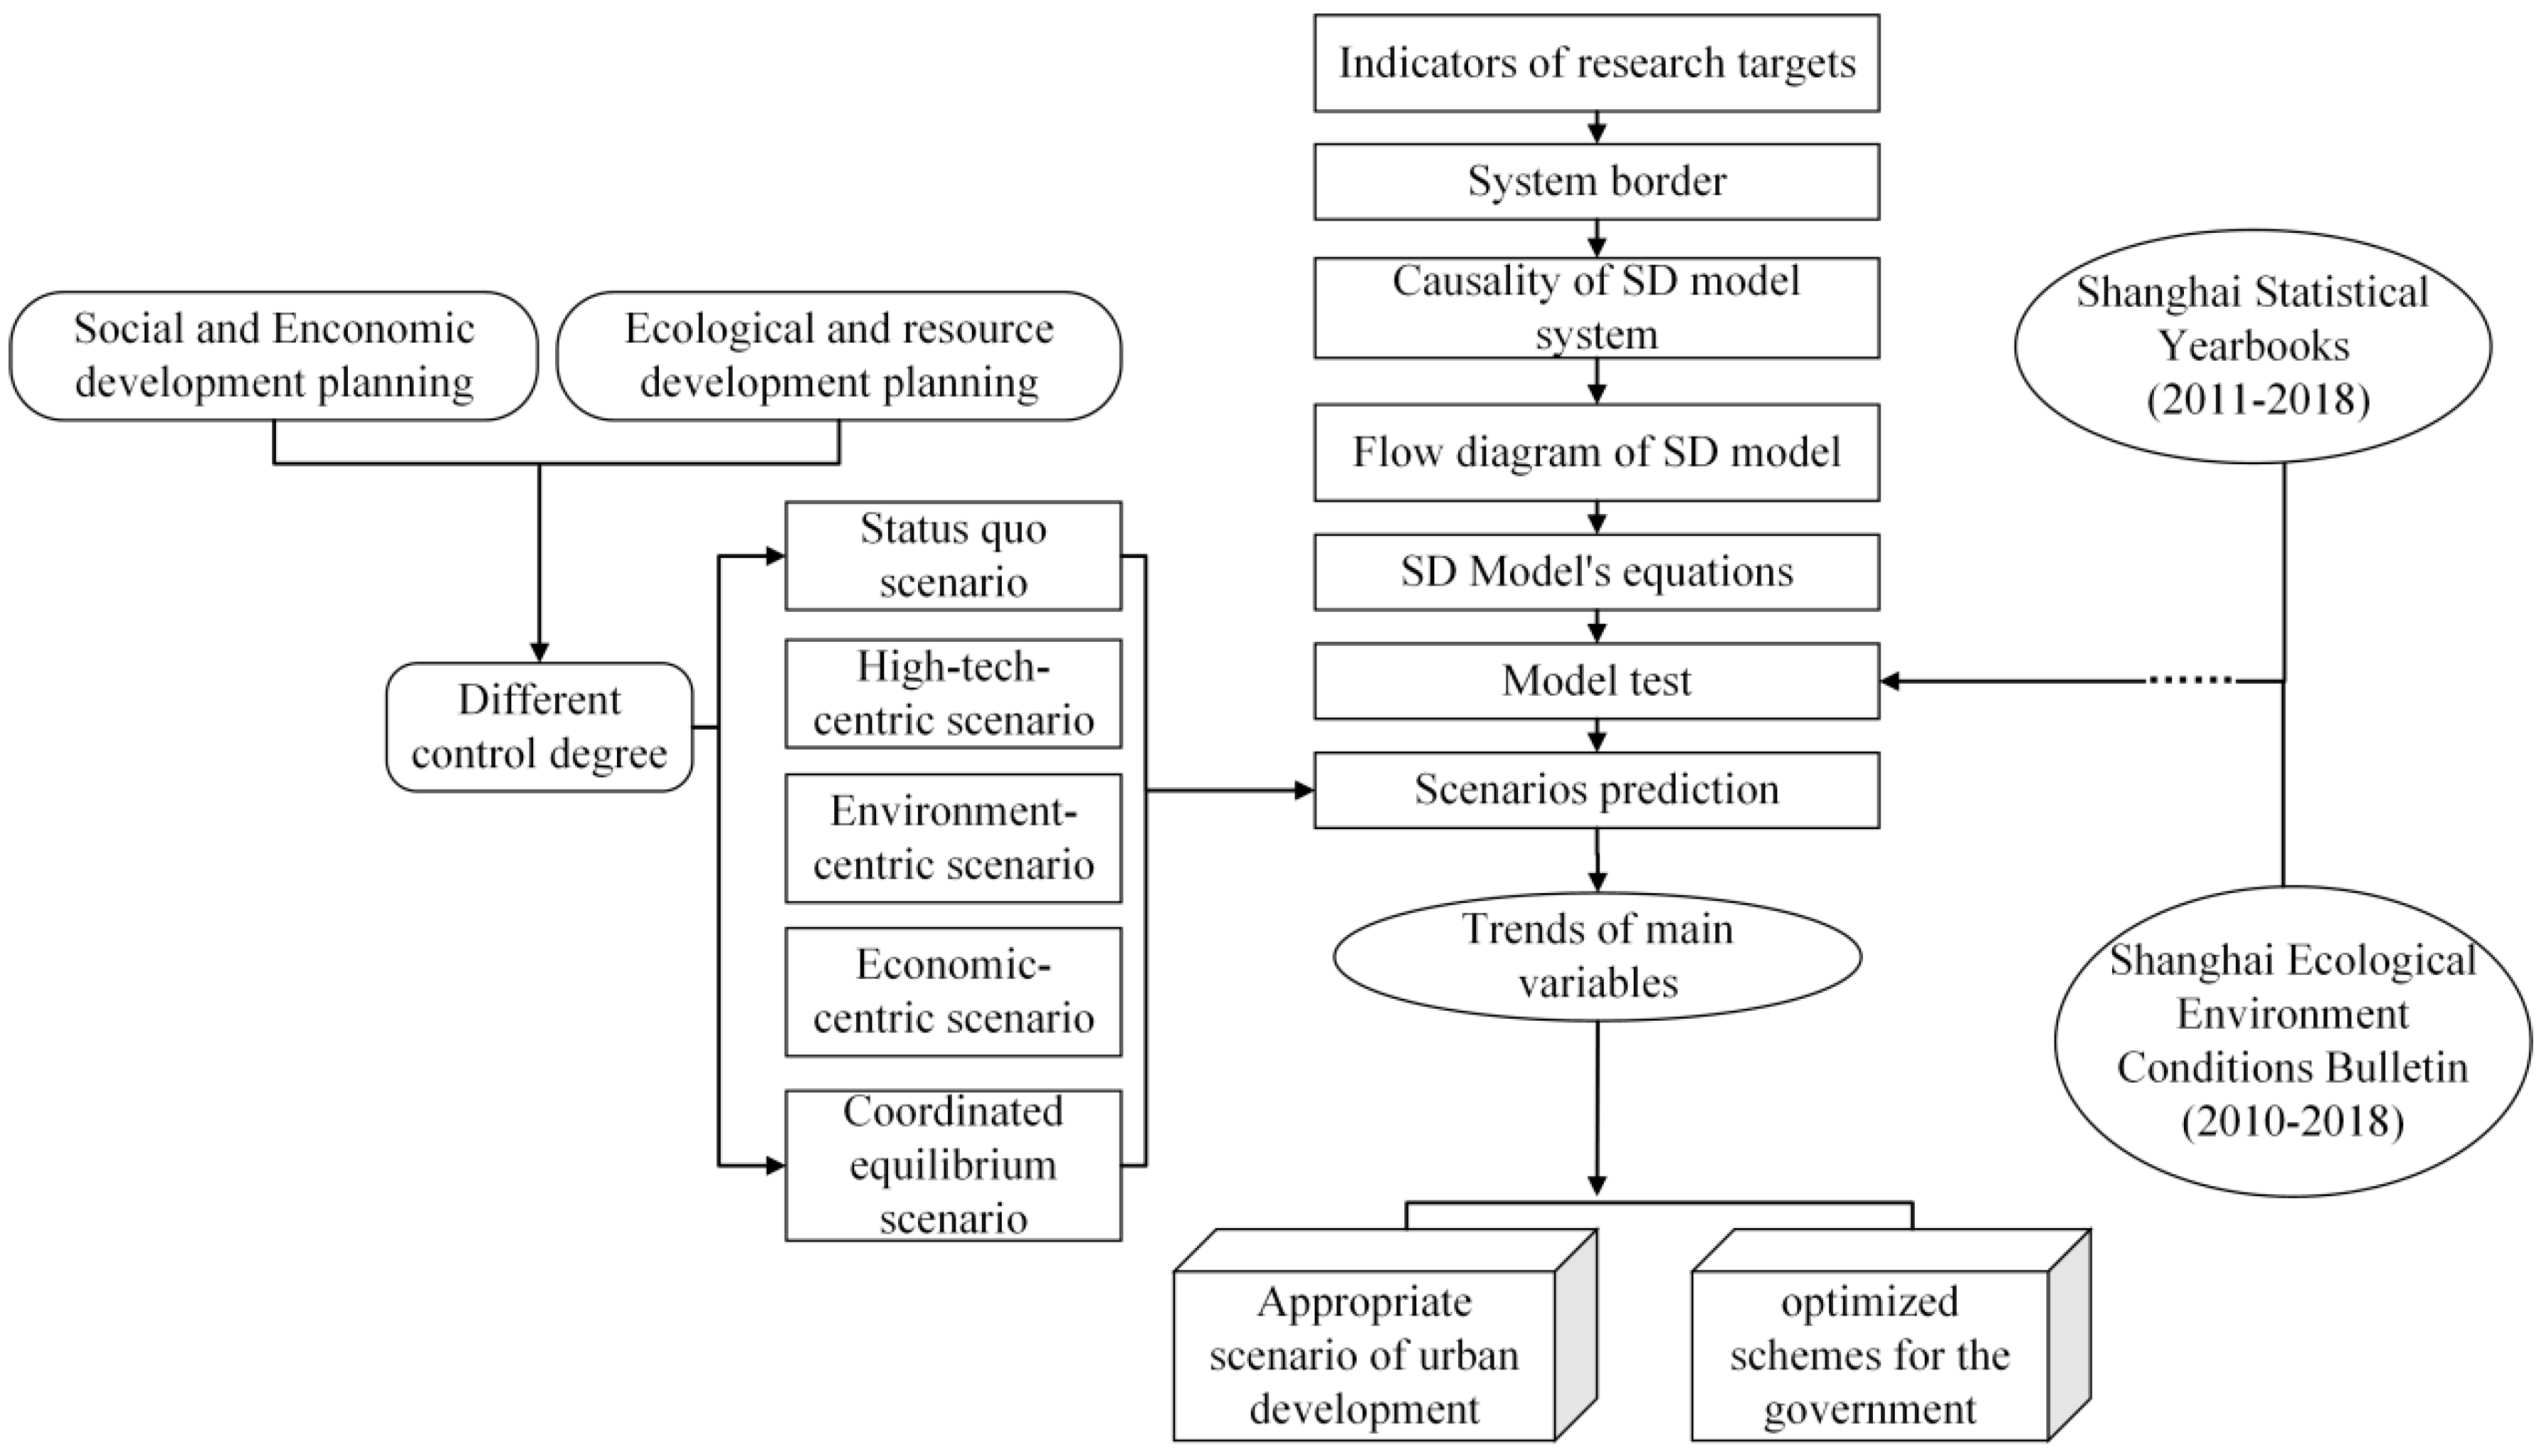
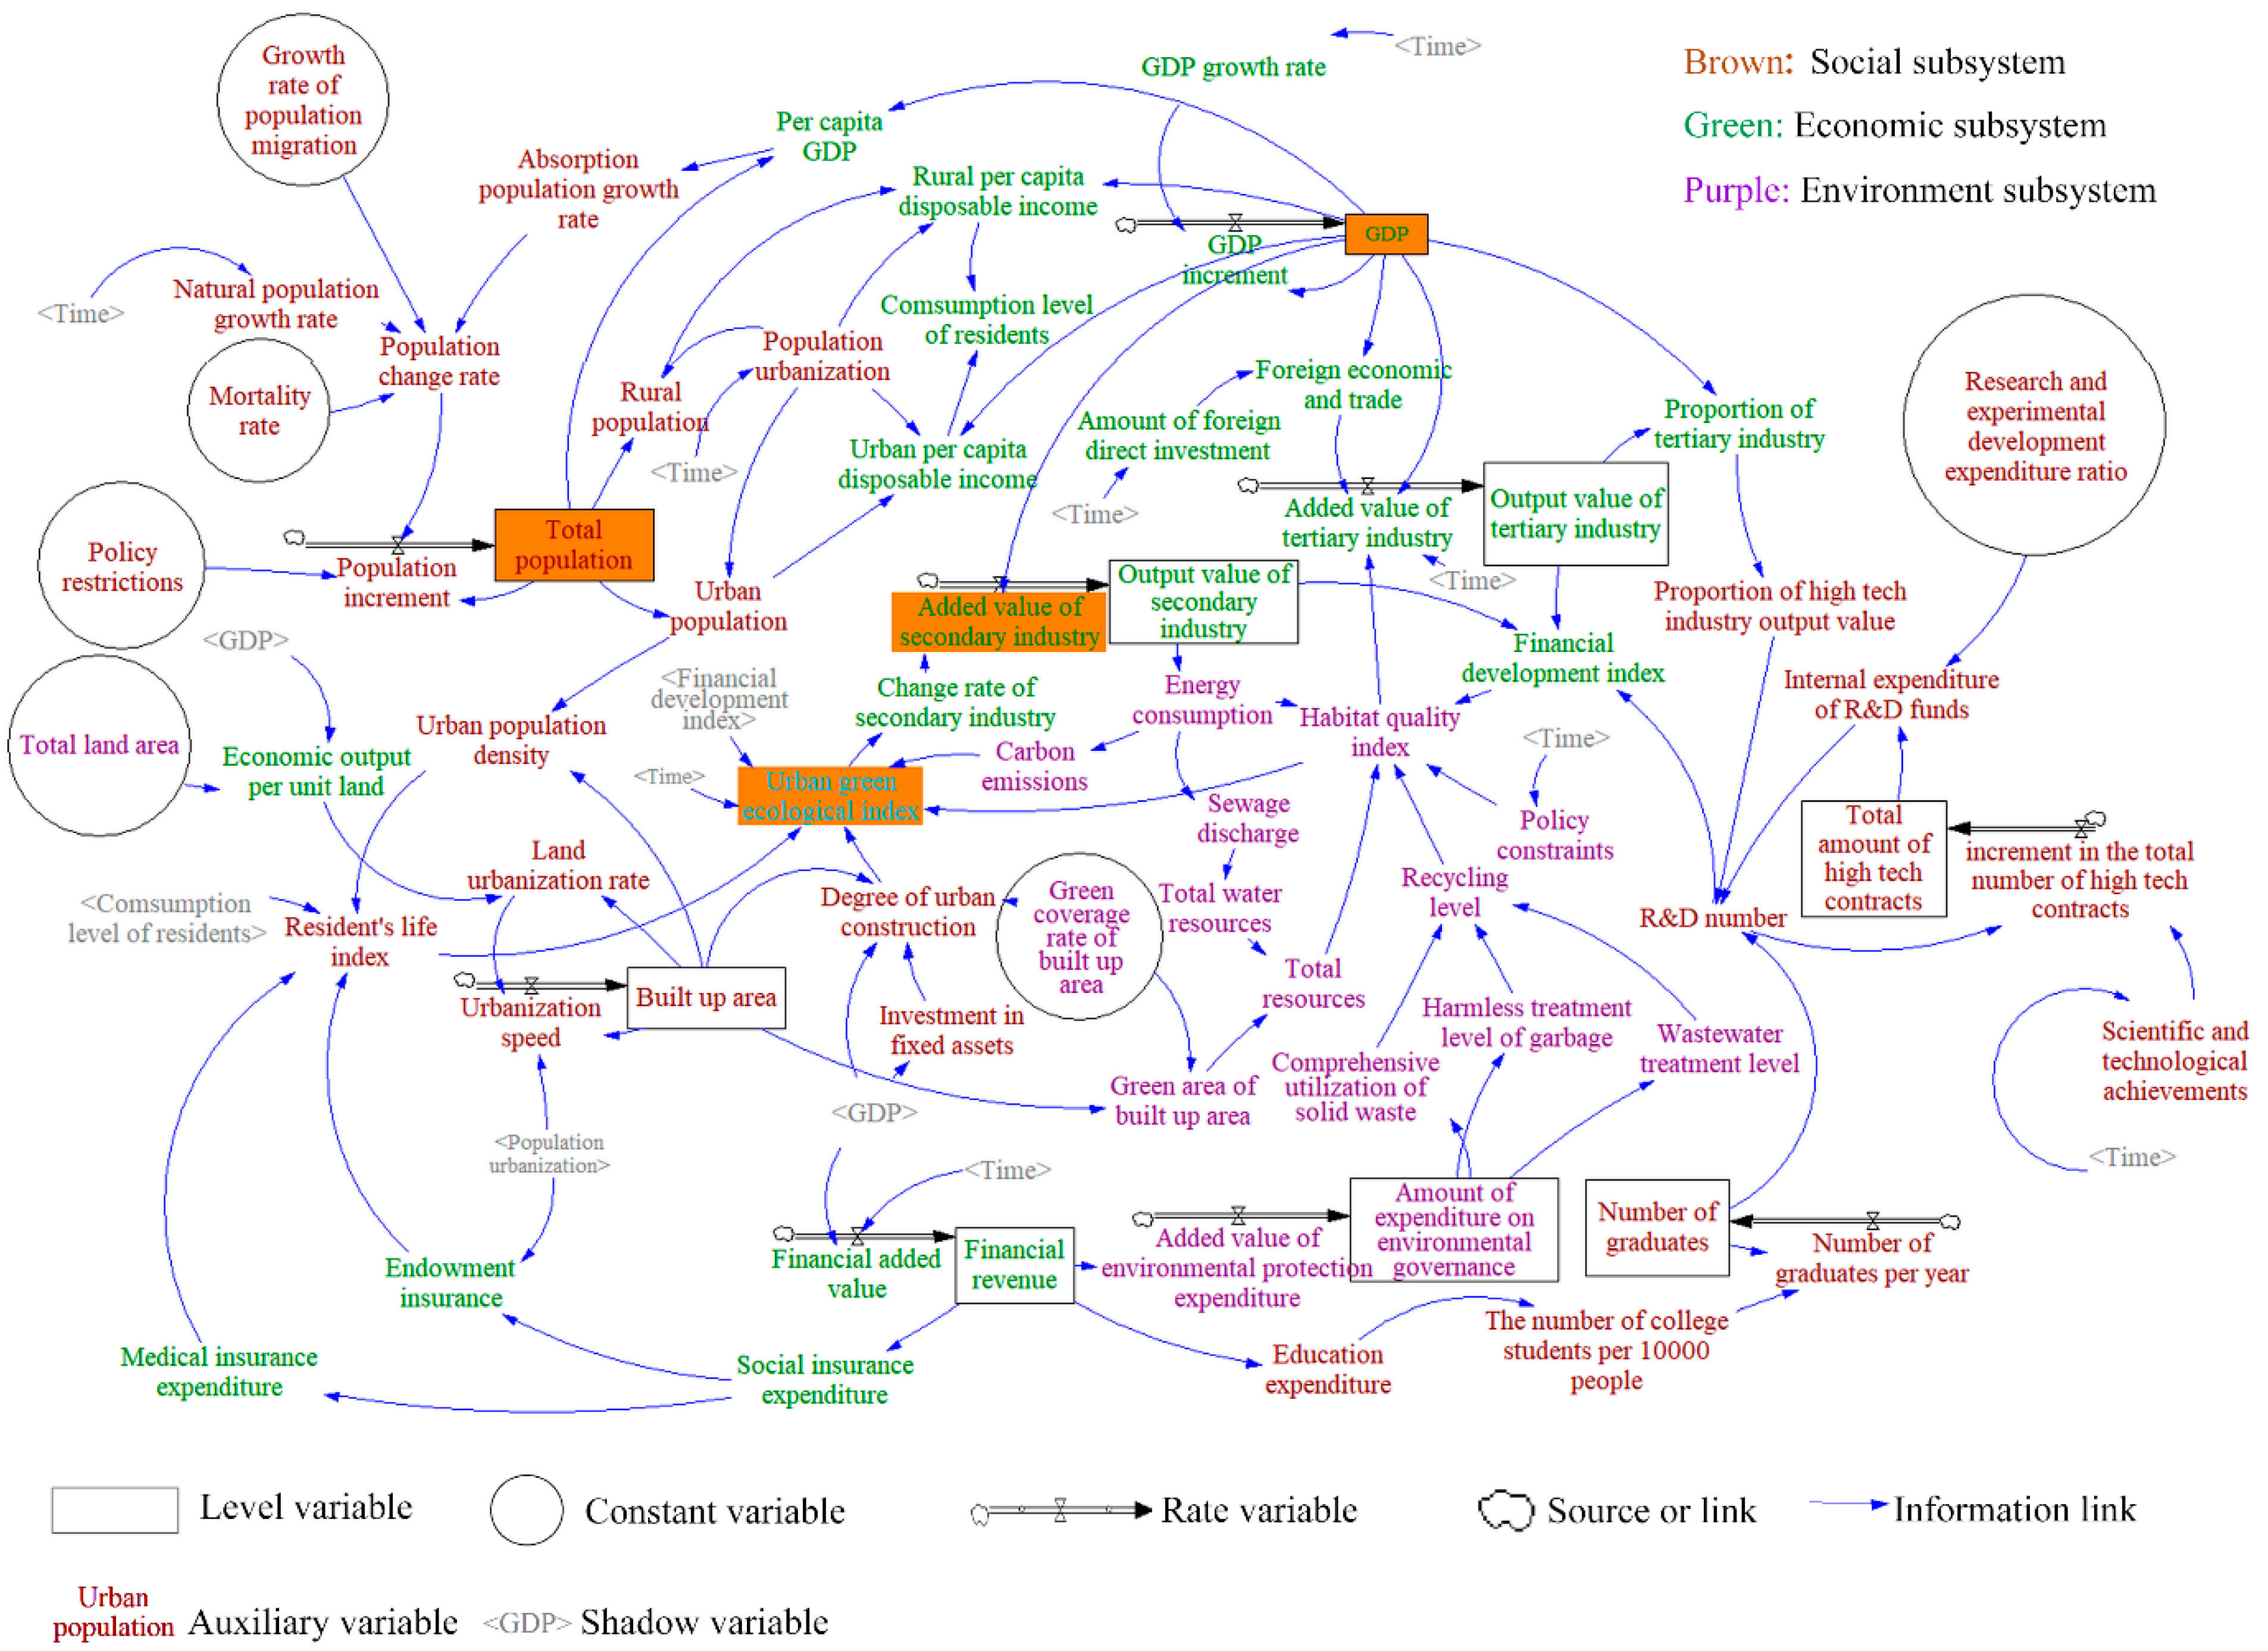
2.3. System Dynamics Model

The system dynamics model was proposed by Prof. Forrester to address issues of enterprise management [34]. Nowadays, system dynamics has become a comprehensive discipline based on system theory, including cybernetics, information theory, collaboration theory, structure theory and other basic disciplines. There are three main reasons why we chose to use an SD model for studying the urban carrying capacity of Shanghai. First, SD is a powerful quantitative research tool. There are currently as many as 25 functions to describe the characteristics of variables and the structure rules between variables. Second, SD specializes in complex system problems. SD pays more attention to the interconnection and interaction between subsystems and their behavior patterns over time are determined by the internal dynamic structure, which is not affected by external factors. Third, multi-scenario simulations can be undertaken by the system dynamic model. The SD model is essentially a differential equation system that through numerical analysis simulates the behavior of complex systems. By setting the key parameters in the SD model, patterns of future urban development can be established. In doing so, urban carrying capacity can be described comprehensively from multiple-angles.
In this study, it was unreasonable to define the system boundary as the administrative boundary, because strong openness exists in Shanghai, resulting in a continuous exchange of material, energy and information in space. When describing the urban system circulation from a macro scale, various resources circulate freely within a city which is influenced by the richness of the upper urban agglomeration and its own trade input, so it can be regarded as an equilibrium state. Vensim PLE software was selected to calculate the SD model. Based on the above analysis of urban carrying capacity, the determination of evaluation indicators should follow principles of comprehensiveness, universality and adaptation to local conditions. According to previous studies [2,16,32,35] and data availability, the following system boundaries were determined: (1) the total population that can be supported in Shanghai; (2) GDP; (3) built-up area; (4) output value of secondary industry; (5) output value of tertiary industry; (6) financial revenue; (7) total investment in environmental protection; (8) the number of graduates; (9) total amount of high-tech contracts. The above system boundaries cover population, society, economy and environment subsystems, which can reflect the current situation of urban development in Shanghai. It should be noted that the time boundary of the model was set from 2010 to 2035. The period of the historical data regulation stage was from 2010 to 2017, and the period of prediction simulation was from 2018 to 2035. Furthermore, the time step used in the simulation was 1 year and the running time of the model was 25 years.
Figure 2 shows a work-flow diagram of the system dynamics model in this study. According to urban development planning, five simulation scenarios (see Section 3.3 for detailed settings) were proposed. The right part of Figure 2 includes model construction, testing, and simulation. The appropriate scenario and optimized schemes of urban development could be obtained by checking trends of main variables [24].

3. Establishing the Evaluation Index System and SD Model for the UCC in Shanghai

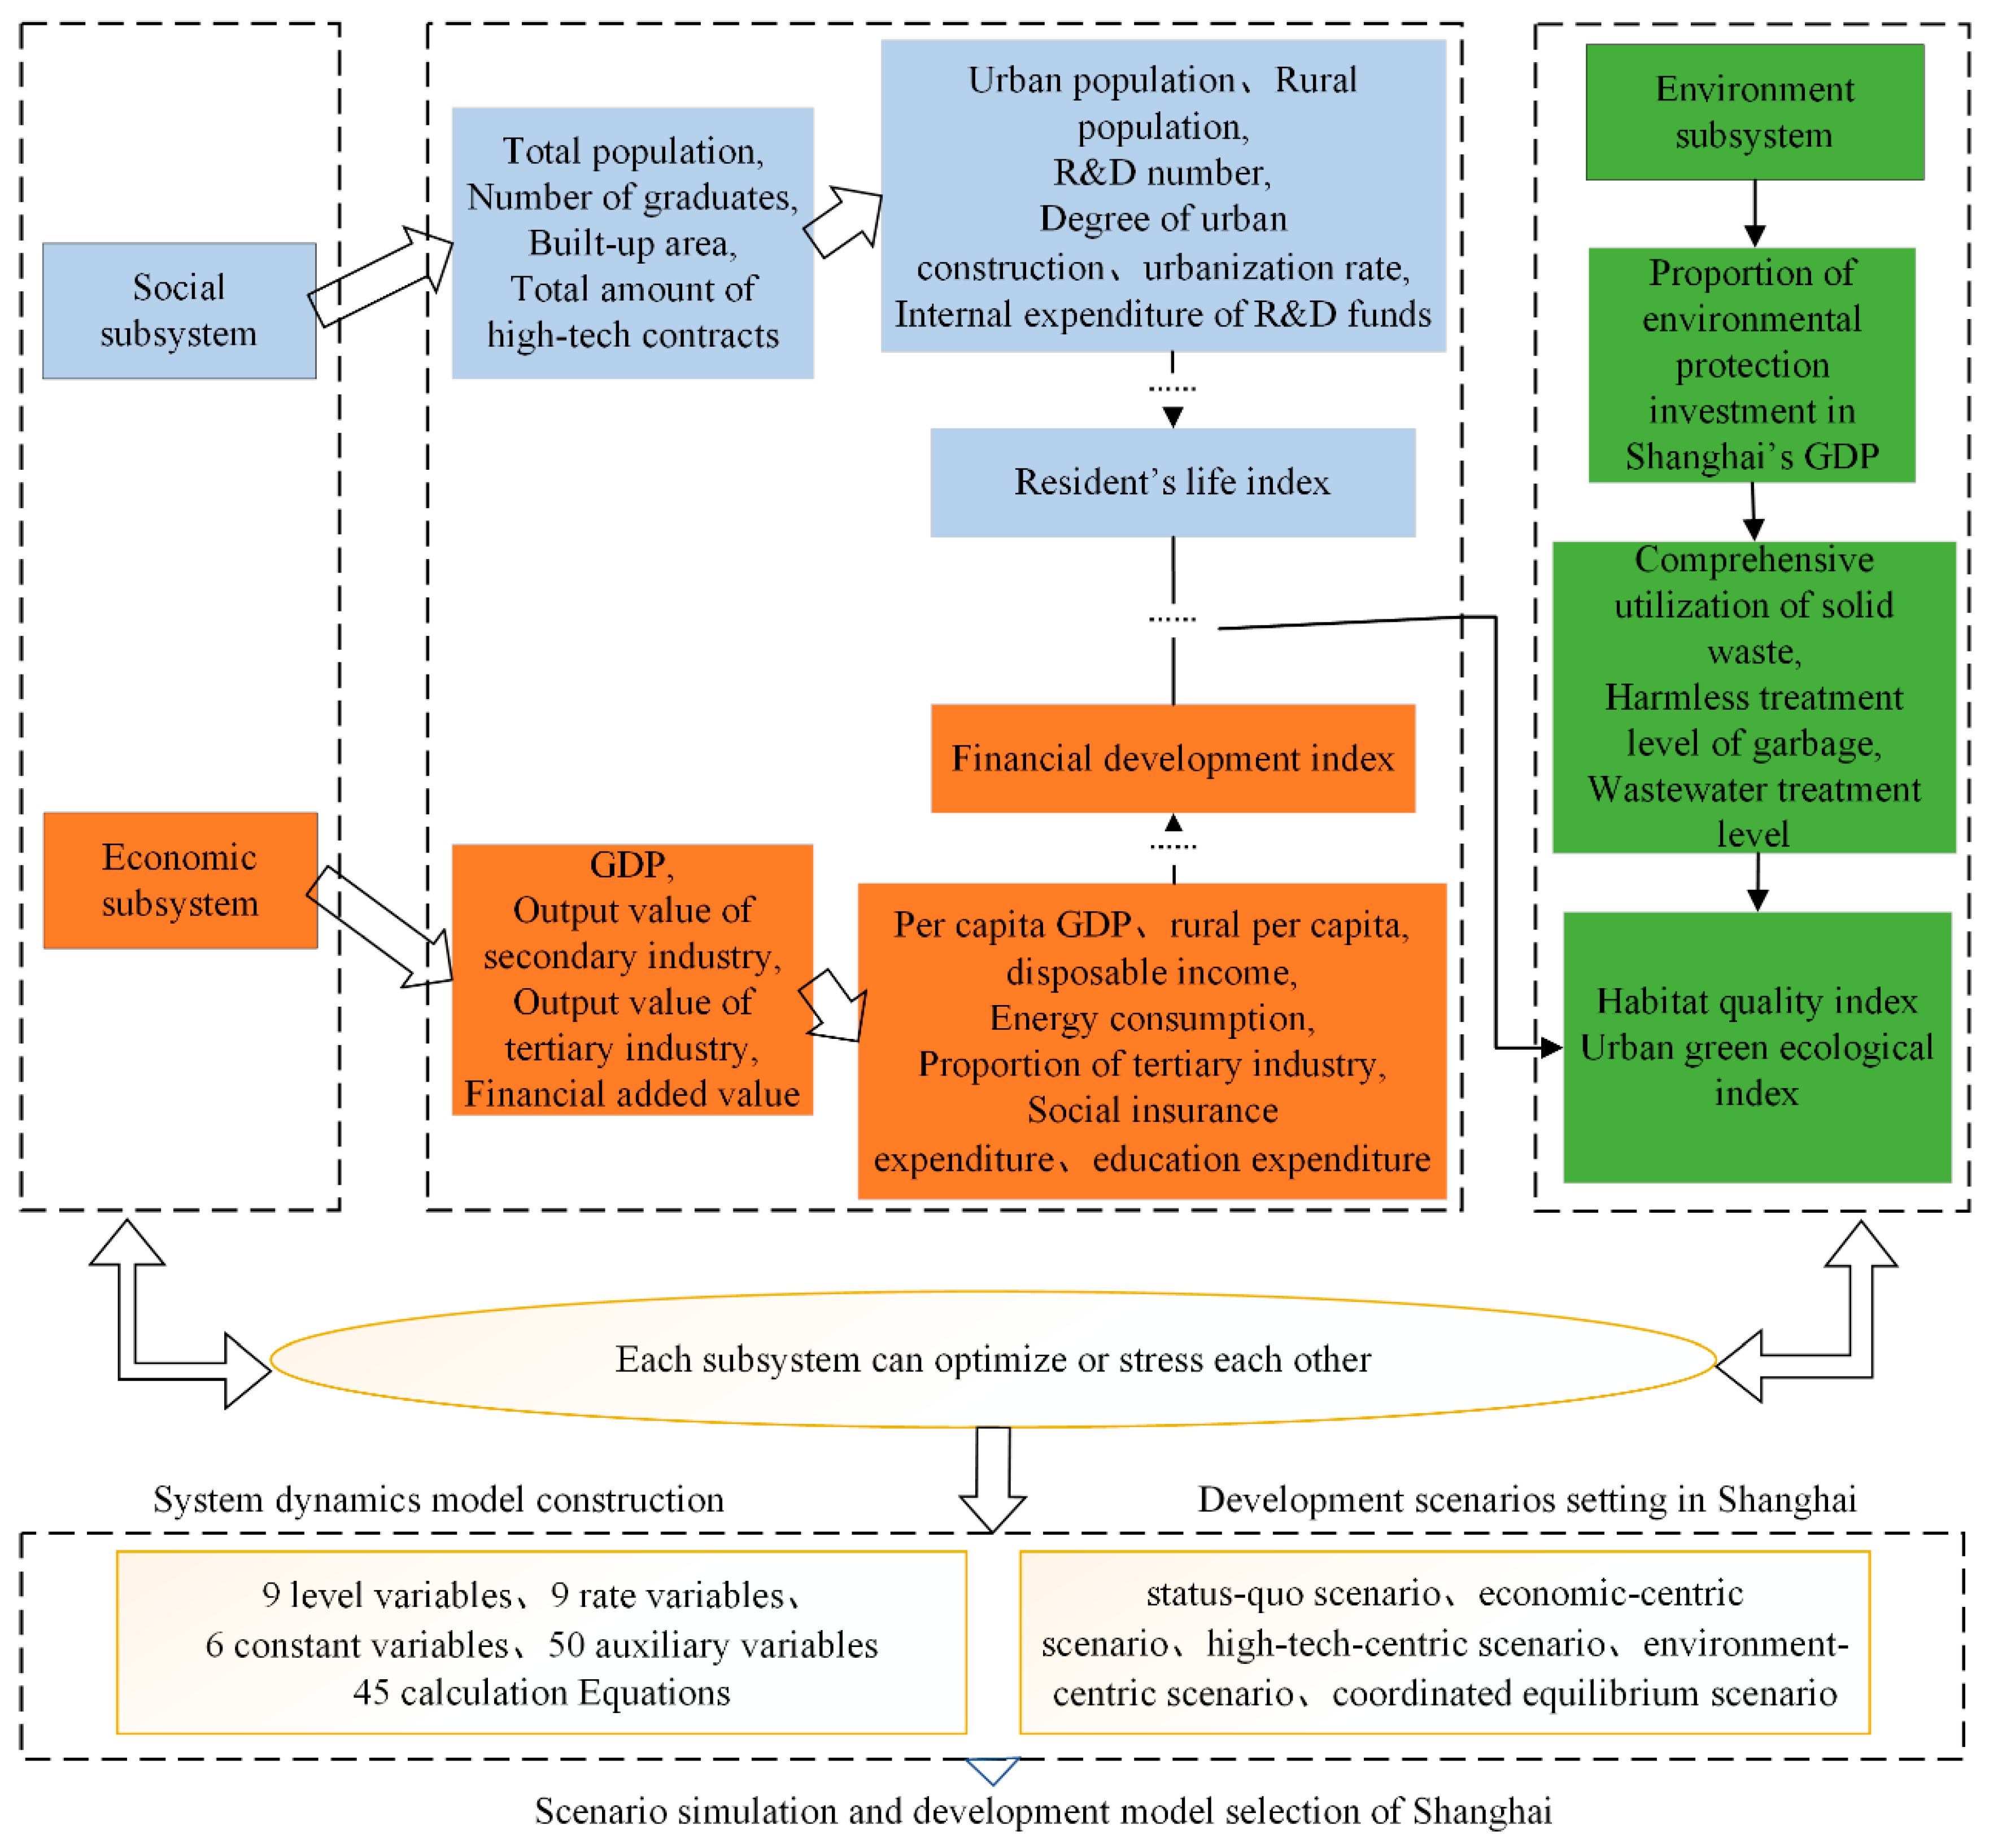
3.1. SD model Formulation

Urban carrying capacity is a complex and expansive system, which is impacted and restricted by many aspects. It is necessary to incorporate a social subsystem, an economic subsystem, and an environment subsystem into the research system of urban carrying capacity.

3.1.1. Social Subsystem

The social subsystem mainly reflects some basic urban elements such as urban population, economic base and superstructure, and represents the integration of social groups. It mainly includes the total carrying population, the number of college graduates and the residents’ life index. Among them, the demographic factor is an active factor in the social subsystem [14]. The quantity, quality and structure of demographic factors directly affect the total economic output, the amount usage of social resources, and energy consumption. Changes in social resources, in turn, affect the carrying capacity of the population. This forms the corresponding feedback adjustment.

3.1.2. Economic Subsystem

Economic development is the main driving force of urbanization and an important indicator to measure urban carrying capacity. To a certain extent, it directly affects the speed of regional development, and thus determines urban attraction and vitality. The gross domestic product is the core index of economic accounting and represents the level of regional social and economic development. Accordingly, the gross domestic product, and secondary and tertiary industry output value are vital components of the economic subsystem. In addition, the integrated development of secondary and tertiary industries is a major trend of global industrial development, and a necessary choice for Shanghai to continuously improve its economic strength. Steady economic growth affects population change and the proportion of high-tech industries in today’s increasingly accelerated globalization.

3.1.3. Environment Subsystem

The environment subsystem involves urban ecology and resources. A sound urban ecological environment provides essential support for economic development, such as water resources, pollution control and climate regulation. The ecological subsystem comprises green coverage rate of built-up area, urban green ecological index and so on. Specifically, a more sustainable and resilient ecological city goal was put forward in the Shanghai Master Plan (2017–2035), aiming to enhance public awareness to curb pollution and improve eco-quality. Urban resources play a role in regulating the urban environment. Urban resources include resource richness, sewage discharge and utilization rate of industrial wastewater treatment. Cities tend to increase their populations, and the growth of population is bound to produce dependence on and consumption of resources. The shortage of cultivated land and freshwater resources is serious, and restricts sustainable development. From all kinds of aspects, saving and optimizing the industrial structure of resources can be achieved by improving urban governance ability, such as establishing harmless treatment of garbage, improving the recycling rate of waste materials and wastewater. Sound resource security involves combining the urban environment with socio-economic development.
With respect to the above analysis, the SD model flowchart of Shanghai’s urban carrying capacity is shown in Figure 3. In this model, the variable located at the tail of the blue arrow represents the dependent variable, and the variable at the position of the blue arrow represents the independent variable. Variables with a square are level variables, and those with a round symbol are constant variables. The grey variables are shadow variables. Brown, green and red represent the social subsystem, the economic subsystem and the environmental subsystem respectively, adding to the readability of the model.

3.2. Evaluation Index System

The SD model expresses the relationship among the directly related variables through a function called the simulation equation. The subsystems, bridged by population, economy and environment, are interlinked into a complex system that affects the urban comprehensive carrying capacity. Therefore, to avoid inaccurate results caused by the single-criterion evaluation method, we adopted a multi-factor evaluation method. The evaluation indexes should reflect the actual situation of Shanghai, and also present the changes in urban population, the economy and the environment. Based on previous research achievements and data availability, we built an evaluation index system composed of 66 evaluation indexes for the urban carrying capacity of Shanghai. Due to too many evaluation indicators, representative evaluation indicators, the initial values and the formula operations between variables (in Vensim language) are listed in Table 1.

3.3. Multi-Scenarios Setting

The main purpose of this paper was to present the development trend of Shanghai’s urban carrying capacity under different scenarios. From the perspective of optimizing resource allocation, improving the level of science and technology, advocating green development, and optimizing industrial structure, five scenarios were set by adjusting decision variables such as table function and the constant variable in the model. For instance, GDP increment, added value of secondary industry, green coverage rate of the built-up area, added value of environmental protection investment and research, and experimental development expenditure ratio, were selected as decision variables. Based on the current situation of urban carrying capacity and the changing trend of society, economics and the environment in Shanghai, four indicators including the total population, GDP, added value of secondary industry, and urban green ecological index, were selected to evaluate the carrying capacity under different scenarios. It should be noted that the overall index of urban carrying capacity was not measured in this paper.
Details of the five simulation scenarios set up using control variables are described as follows. ① The status quo scenario maintained the status quo social, economic, environment development mode and did not need to adjust any parameters. This status quo scenario can be used as a reference for other scenes. ② The high-tech-centric scenario was achieved by increasing high-tech-related indicators (the number of R&D employees, increment in the total number of high-tech contracts and scientific and technological achievements) by 20%, leaving others unchanged. ③ For the environment-centric scenario, we increased the ecological and environmental protection indicator (added value of environmental protection expenditure) by 20%. ④ The economic-centric scenario increased the GDP-related variables (GDP growth rate and GDP increment) by 20%, thus simulating the chain reaction of the variables in the system from 2018–2035. ⑤ The coordinated equilibrium scenario was developed based on the high-tech-centric scenario, environment-centric and economic-centric by adjusting related indicators by 20%.
In the economic subsystem, GDP growth promotes the increment of financial development through a dynamic proportionality factor in the SD model. In the social subsystem, the population increment promotes the residents’ life index through a dynamic proportionality factor. Next, the residents’ life index and financial development index cause the urban green ecological index to increase, which is a link for the environment subsystem to the social and economic subsystem. The three subsystems promote and inhibit each other [34]. After SD model construction and development scenarios setting, the most appropriate scenario and development model in Shanghai was found (See Figure 4).

3.4. Testing Effectiveness of the Model

The test and validation of the model used by the SD model before scenario predictions were mainly based on historical data from 2010 to 2018, which was expressed by the absolute relative error (ARE) between the historical and the simulated data [36,37]. The calculation formula of ARE is decomposed as:
A R E = | Y ¯ t Y t Y t |
where Y ¯ t denotes the simulated values, Yt is the historical values and t represents year. If all absolute relative errors are within 10%, and at least half are within 5%, we assume that the model is valid.

4. Simulation Results under the Different Scenarios

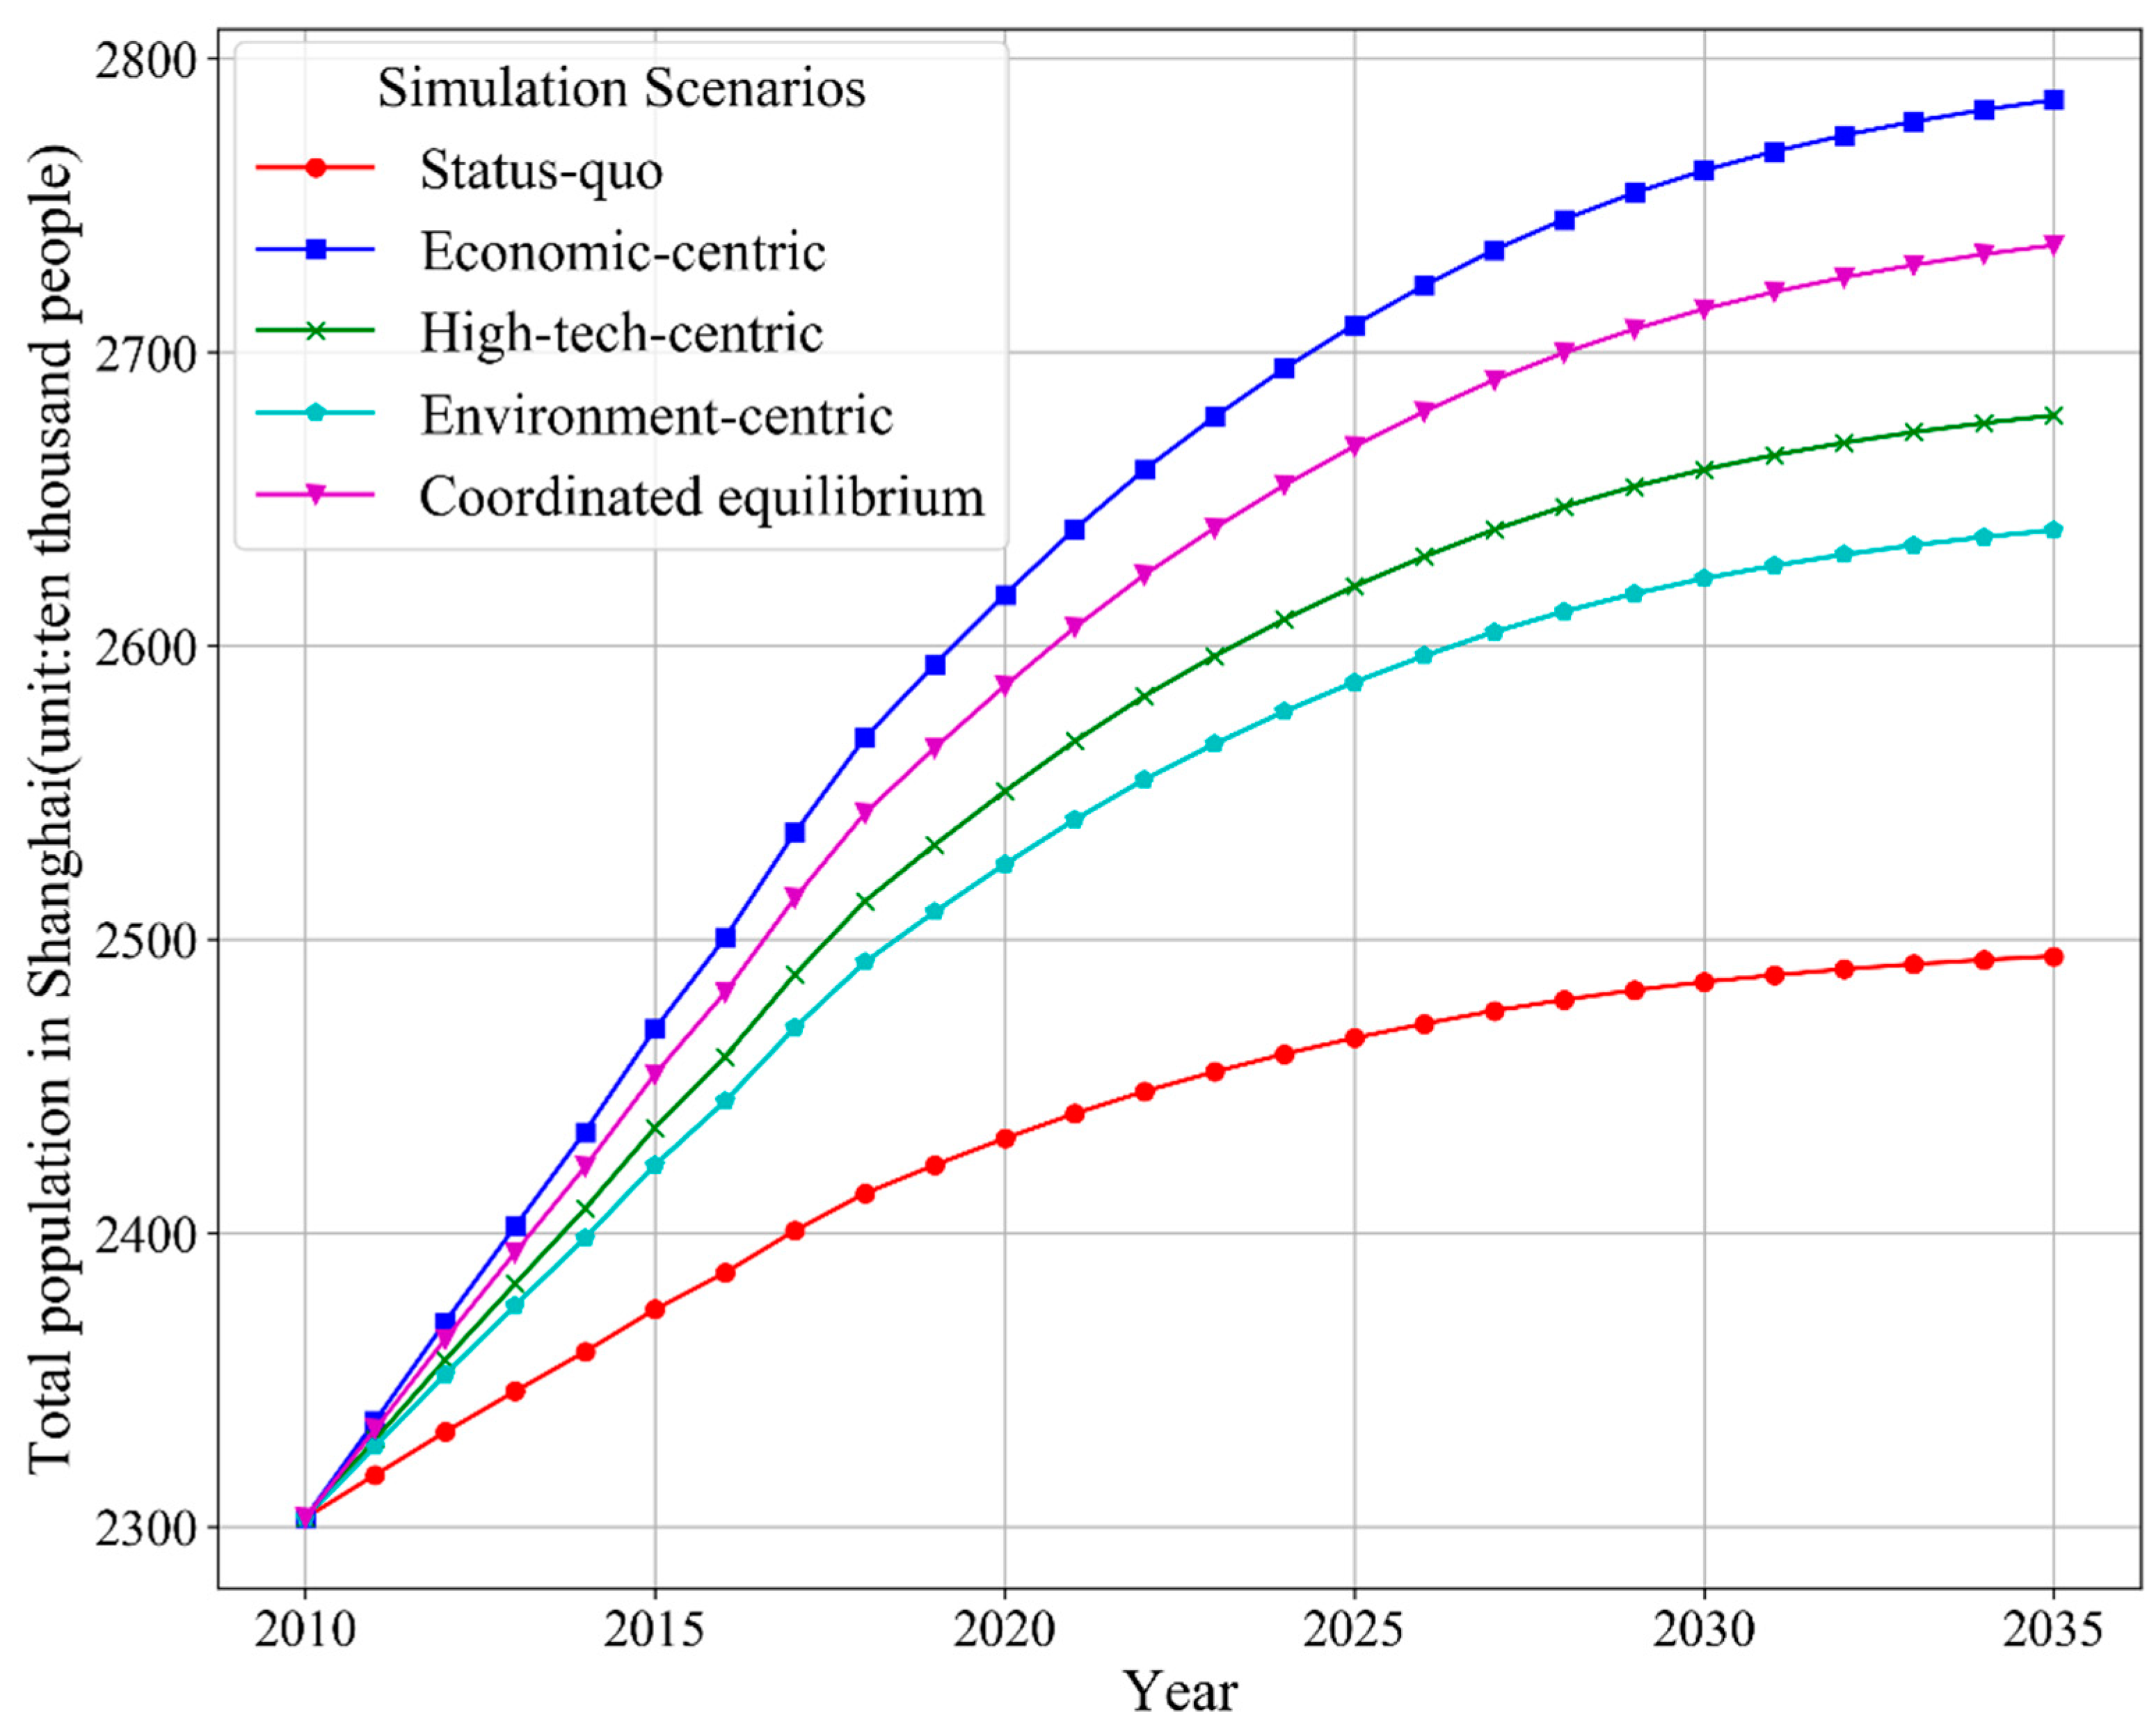
4.1. Carrying Population Simulation
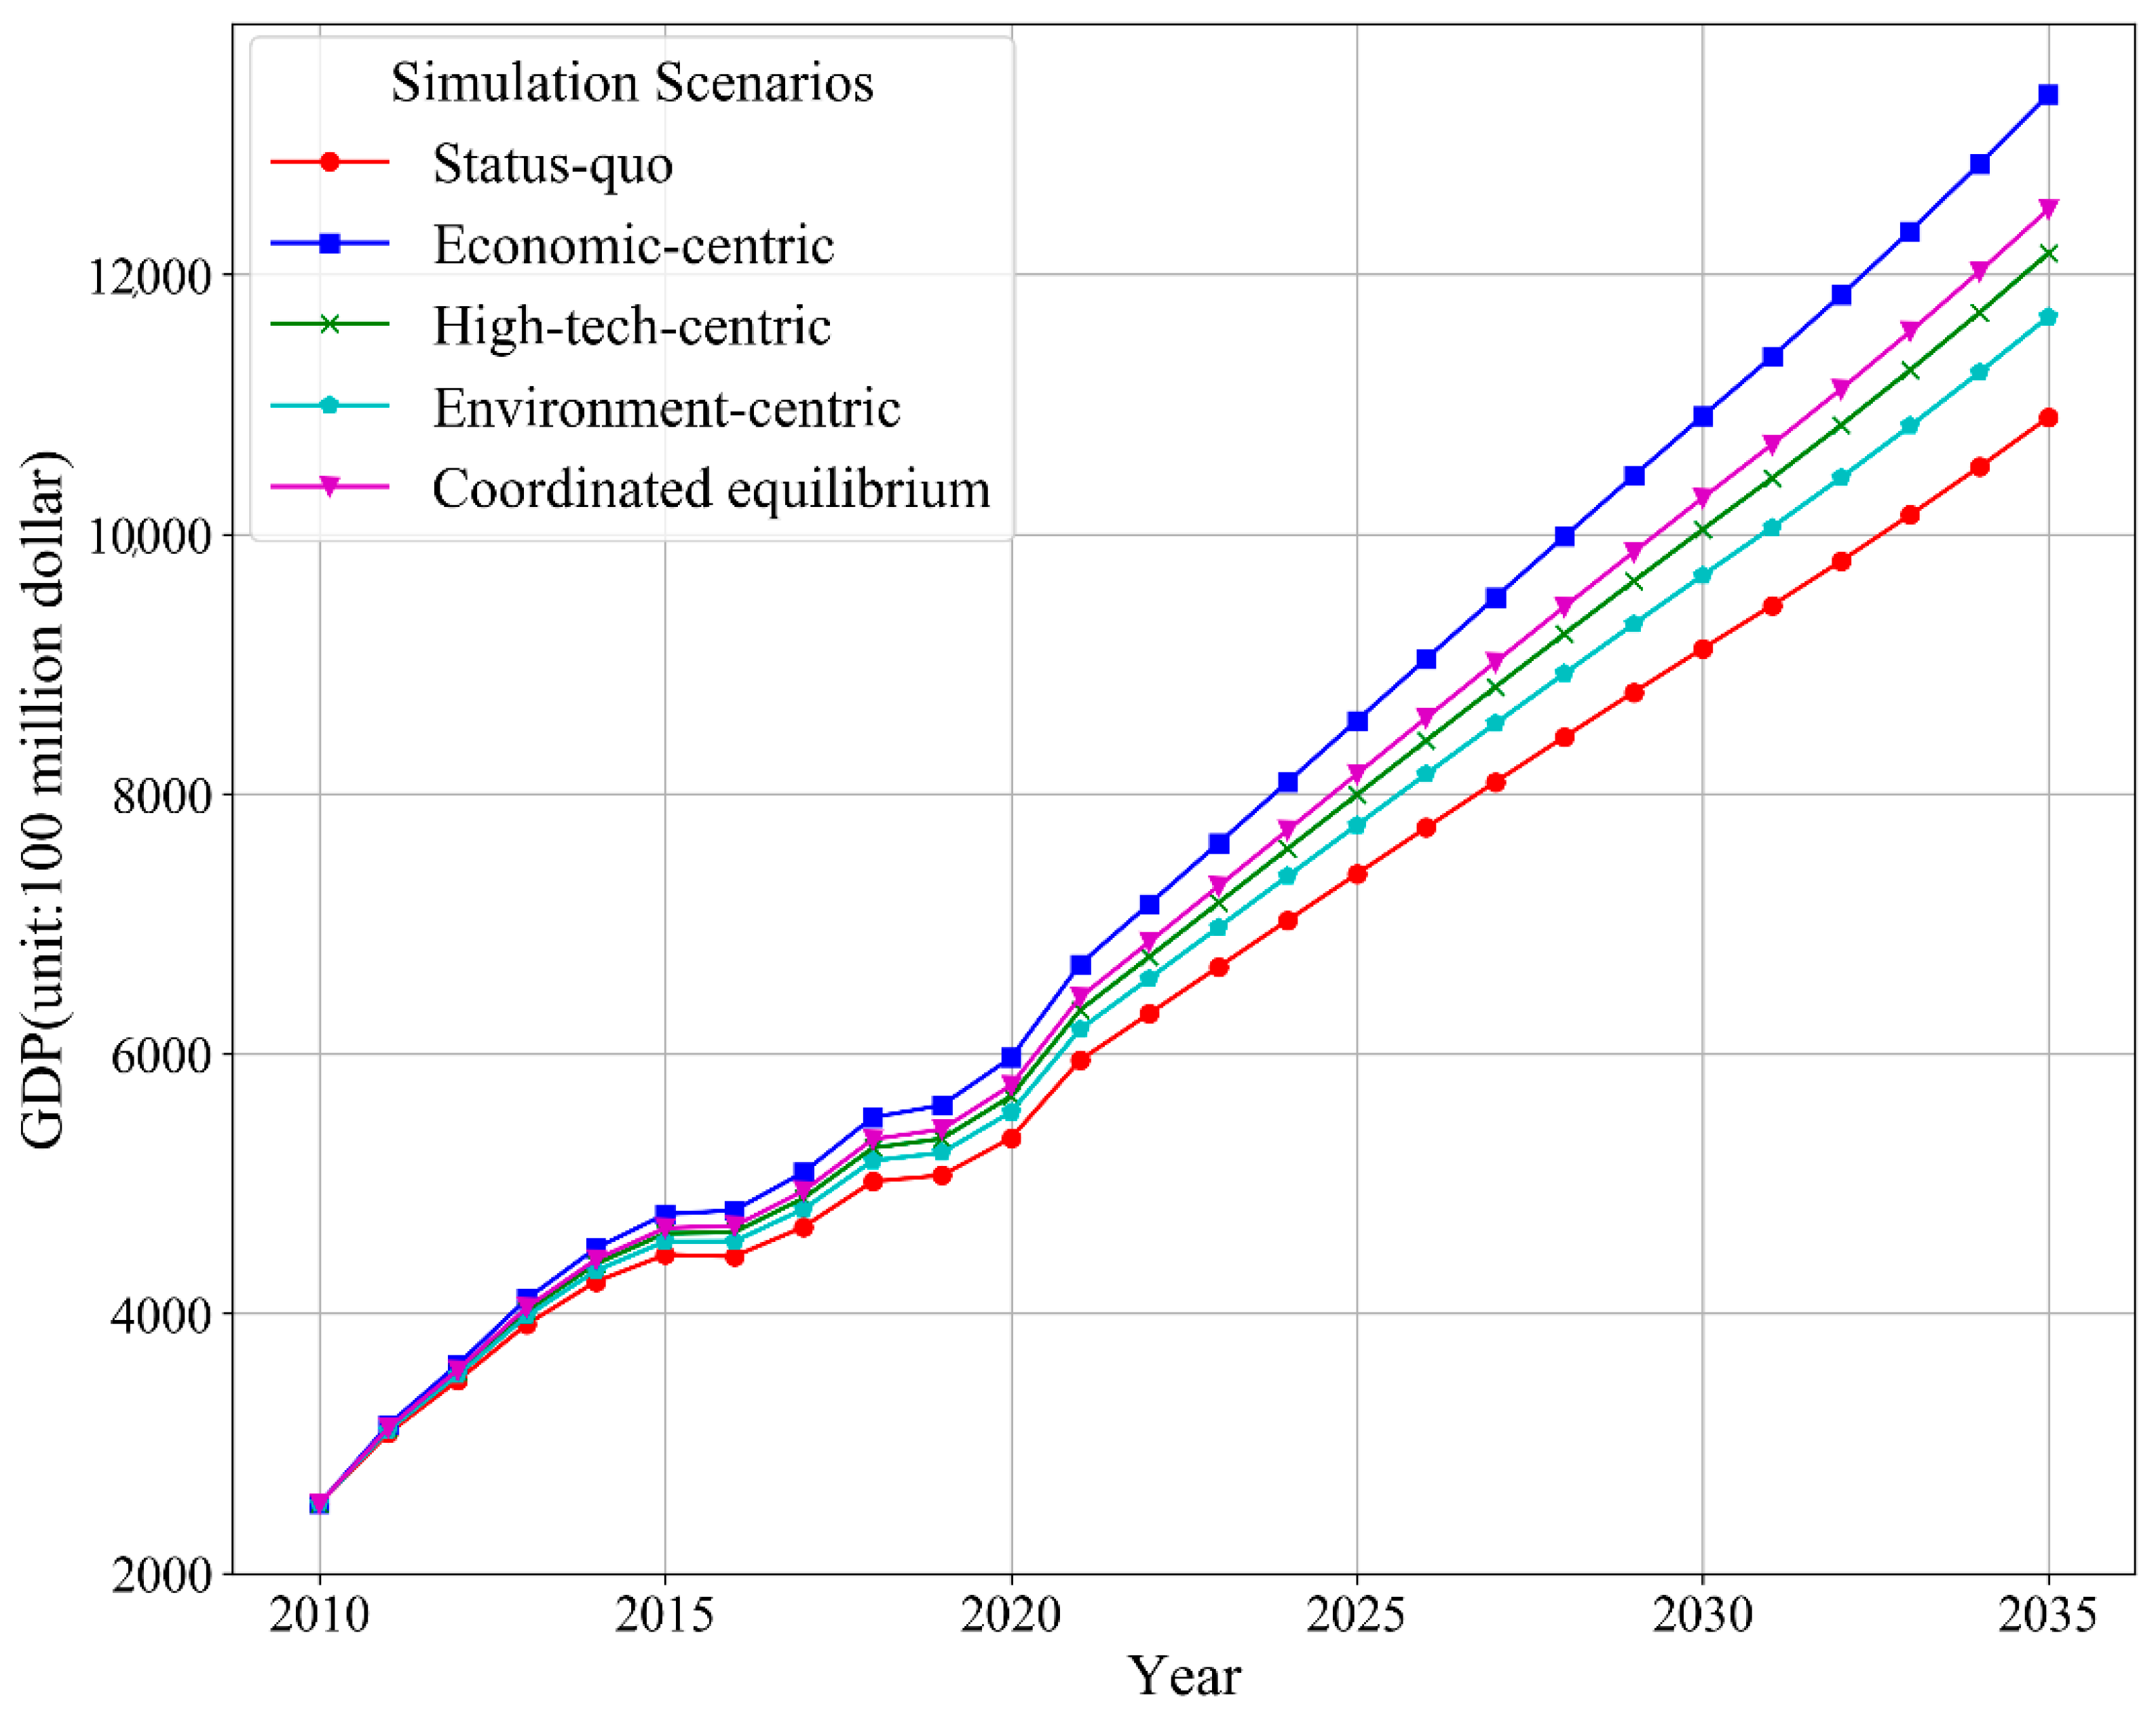
Maintaining the status quo, the total population capacity of Shanghai will gradually reach a limit after 2025, at about 25 million. In this case, the growth rate of the total population would tend to drop below 0.2% in 2025 and then 0.1% in 2031, basically losing the carrying potential of the population. Each of the other four scenarios would ultimately not reach the population carrying limit in 2035. Among them, the population that could be carried under the economic-centric scenario is the largest, and could reach 27.86 million in 2035 (Figure 5). There is a big difference in the number of people in 2035 between the status quo and the economic-centric scenario, which is similar to Wang’s [32] research in Changchun city in China. Rapid economic growth has not only improved the per capita GDP of Shanghai but also provided more jobs, causing an increase in Shanghai’s adsorbed population and the carrying population. Under the coordinated equilibrium scenario, the population growth will slow down from 2020 and eventually reach 27.36 million in 2035. The carrying population in Shanghai could reach 26.78 million and 26.39 million respectively by 2035 in the high-tech-centric and environment-centric scenario. From the perspective of the population carrying capacity, the economic-centric scenario bears the largest population, followed by the coordinated equilibrium, and the status quo the least.

4.2. GDP Simulation

As shown in Figure 6, the GDP of Shanghai will rise continuously in either scenario, and the overall gap is not very large. Specifically, under the economic-centric scenario, the GDP value will grow quickly, by 2035 and reach 1.34 trillion dollars, which is much higher than that in the status quo scenario. The explanation for this is related to the overall increase in the economic index of this development model. In the coordinated equilibrium scenario, the GDP in 2035 will reach 1.25 trillion dollars, second only to that in the economic-centric scenario, and its GDP growth rate will remain at 4% from 2030 to 2035, which is more healthy and stable. Moreover, the GDP in the high-tech-centric scenario and environment-centric scenario can reach 1.22 trillion dollars and 1.17 trillion dollars, respectively, by 2035, with little difference. Thus, in terms of seeking more stable, healthy and potential economic development, the simulation of GDP results show that the coordinated equilibrium scenario is more effective than the above-mentioned scenario.

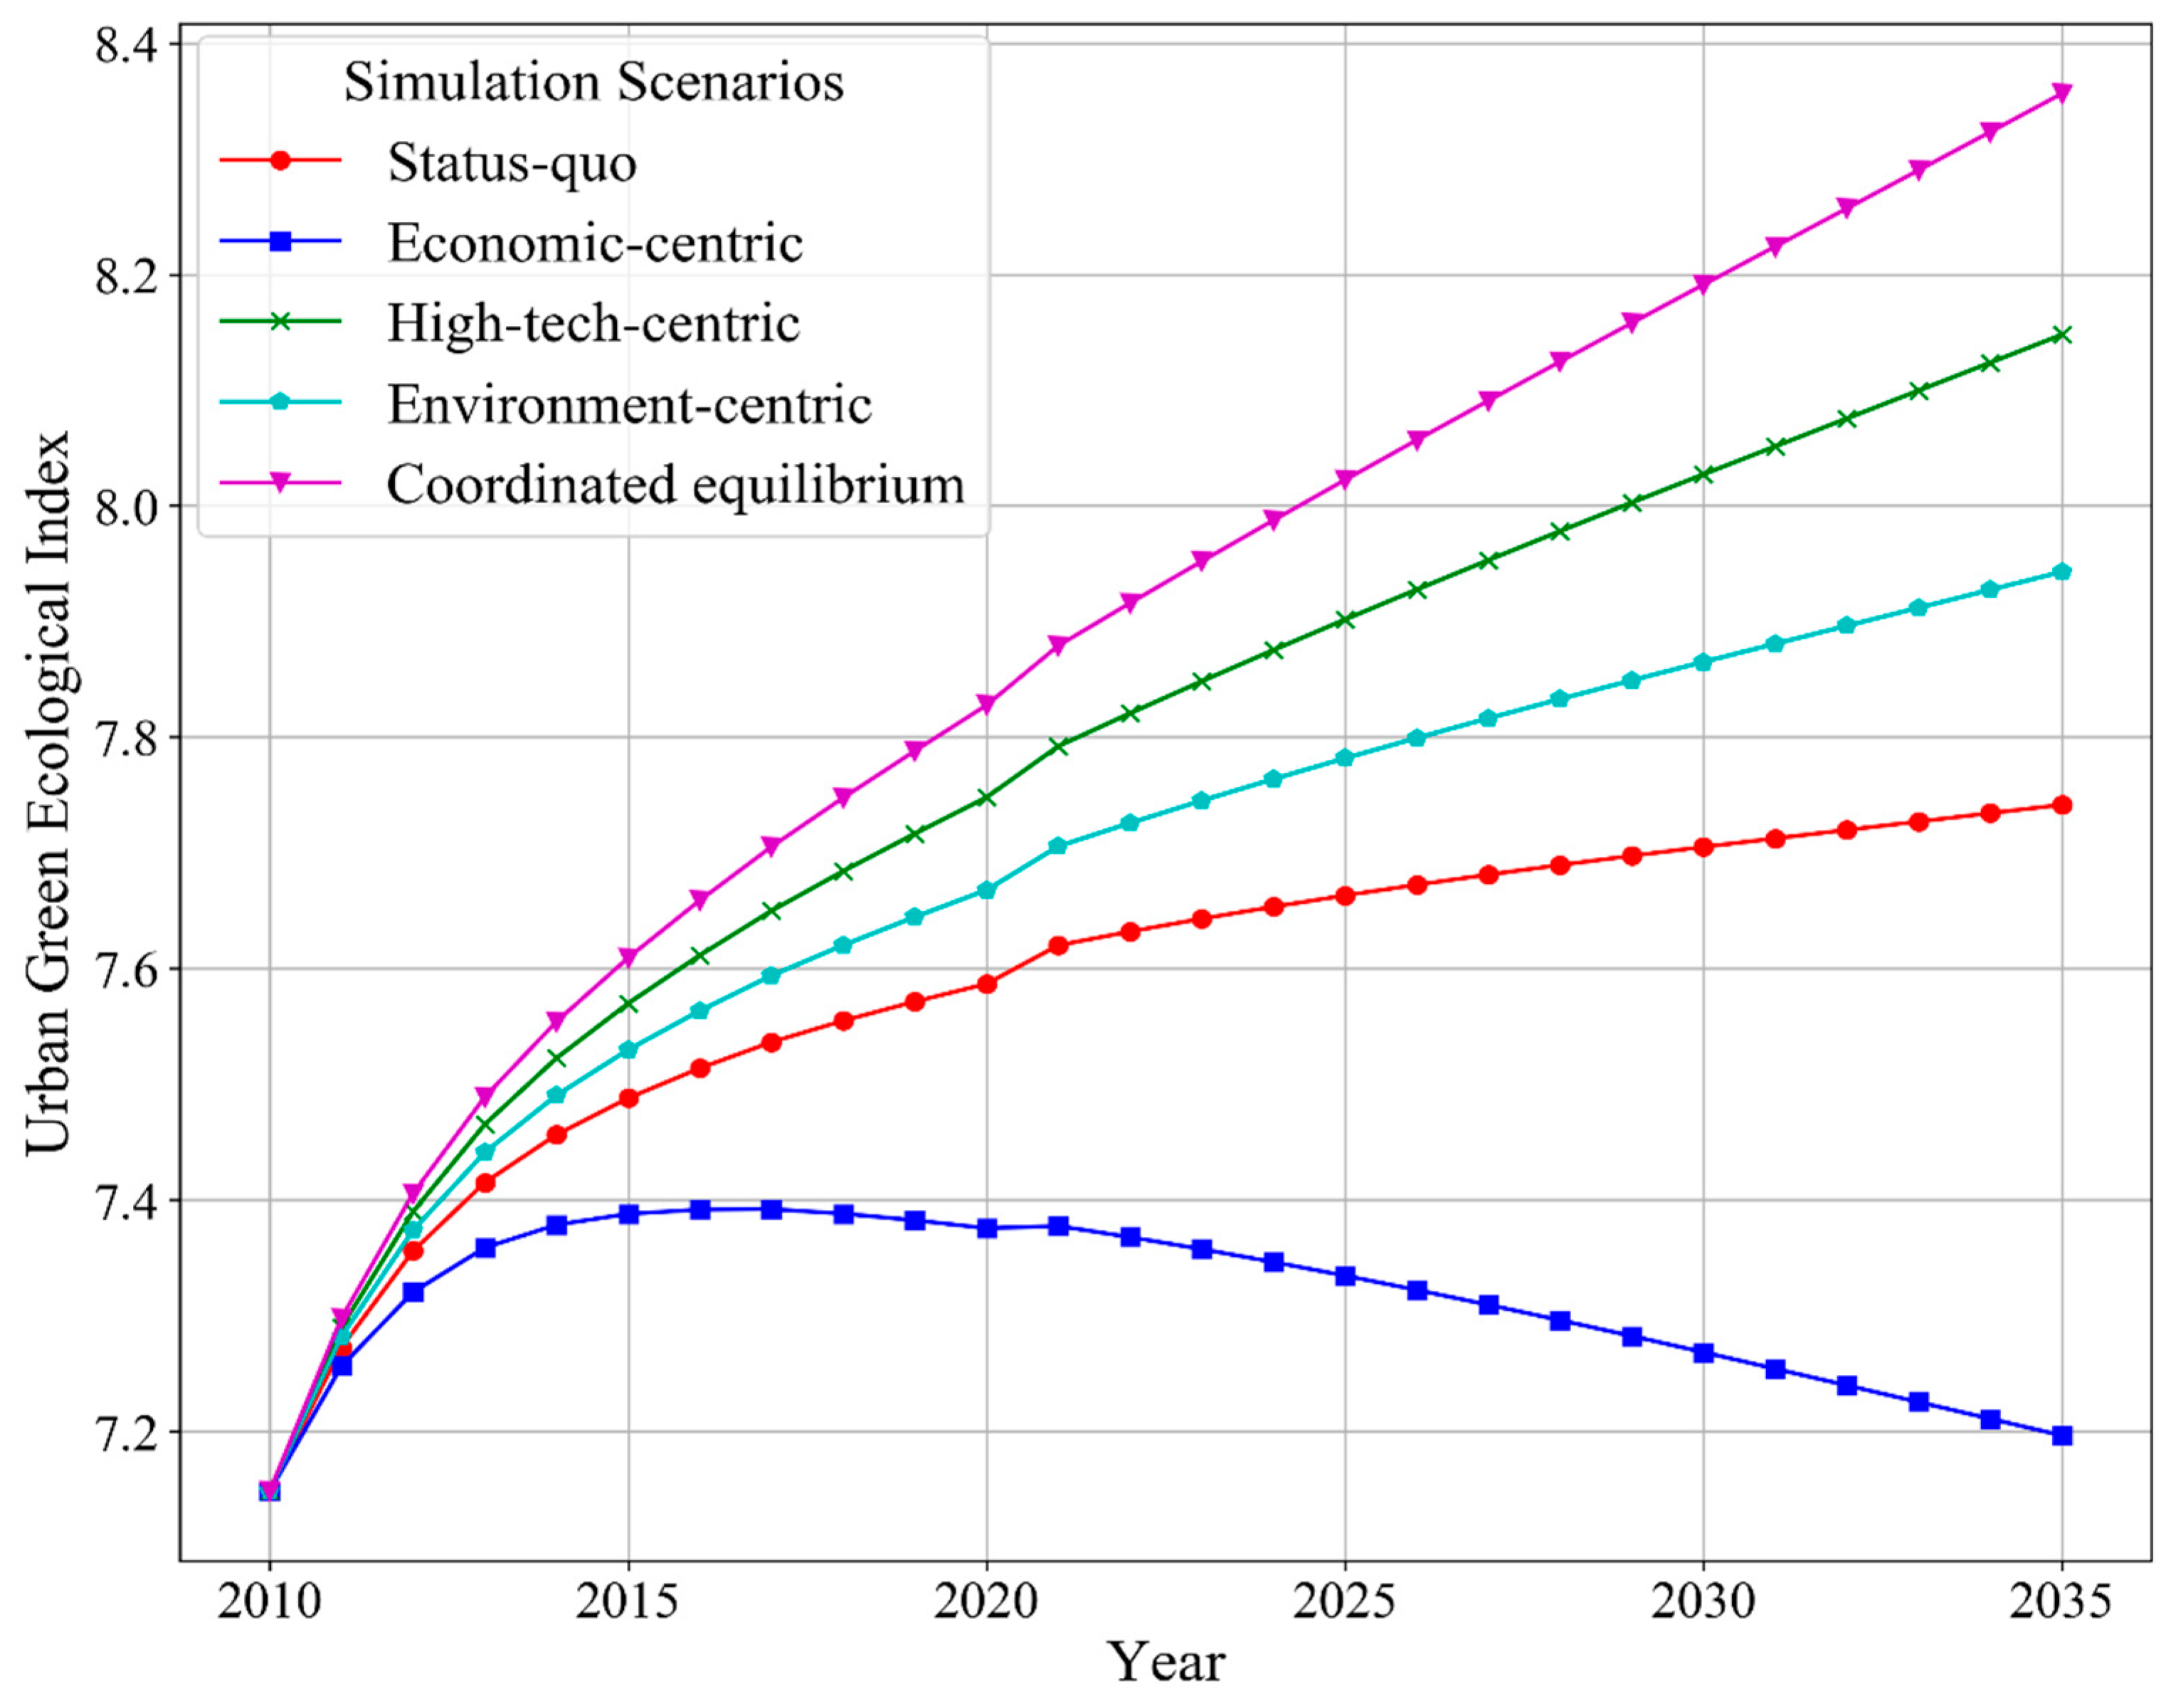
4.3. Urban Green Ecological Index Simulation

The urban green ecological index is a coupling of Shanghai’s economic development index, residents’ life index, degree of urban construction, carbon emissions, and green coverage rate of built-up areas, which is a very important intermediate variable constructed in this research. It can be seen from Figure 7 that the urban green ecological index will gradually decrease after reaching 7.39 in 2016, and show a sharp downward trend from poor to nearly weak following the economic-centric scenario. This indicates that complete focus on economic construction without considering other factors will inevitably cause environmental pollution and reduce the quality of life of residents, which will affect the sustainable development of the city. There were similar uprising trends in the other four scenarios. In summary, the coordinated equilibrium scenario is effective in urban green ecological index and has the best performance.

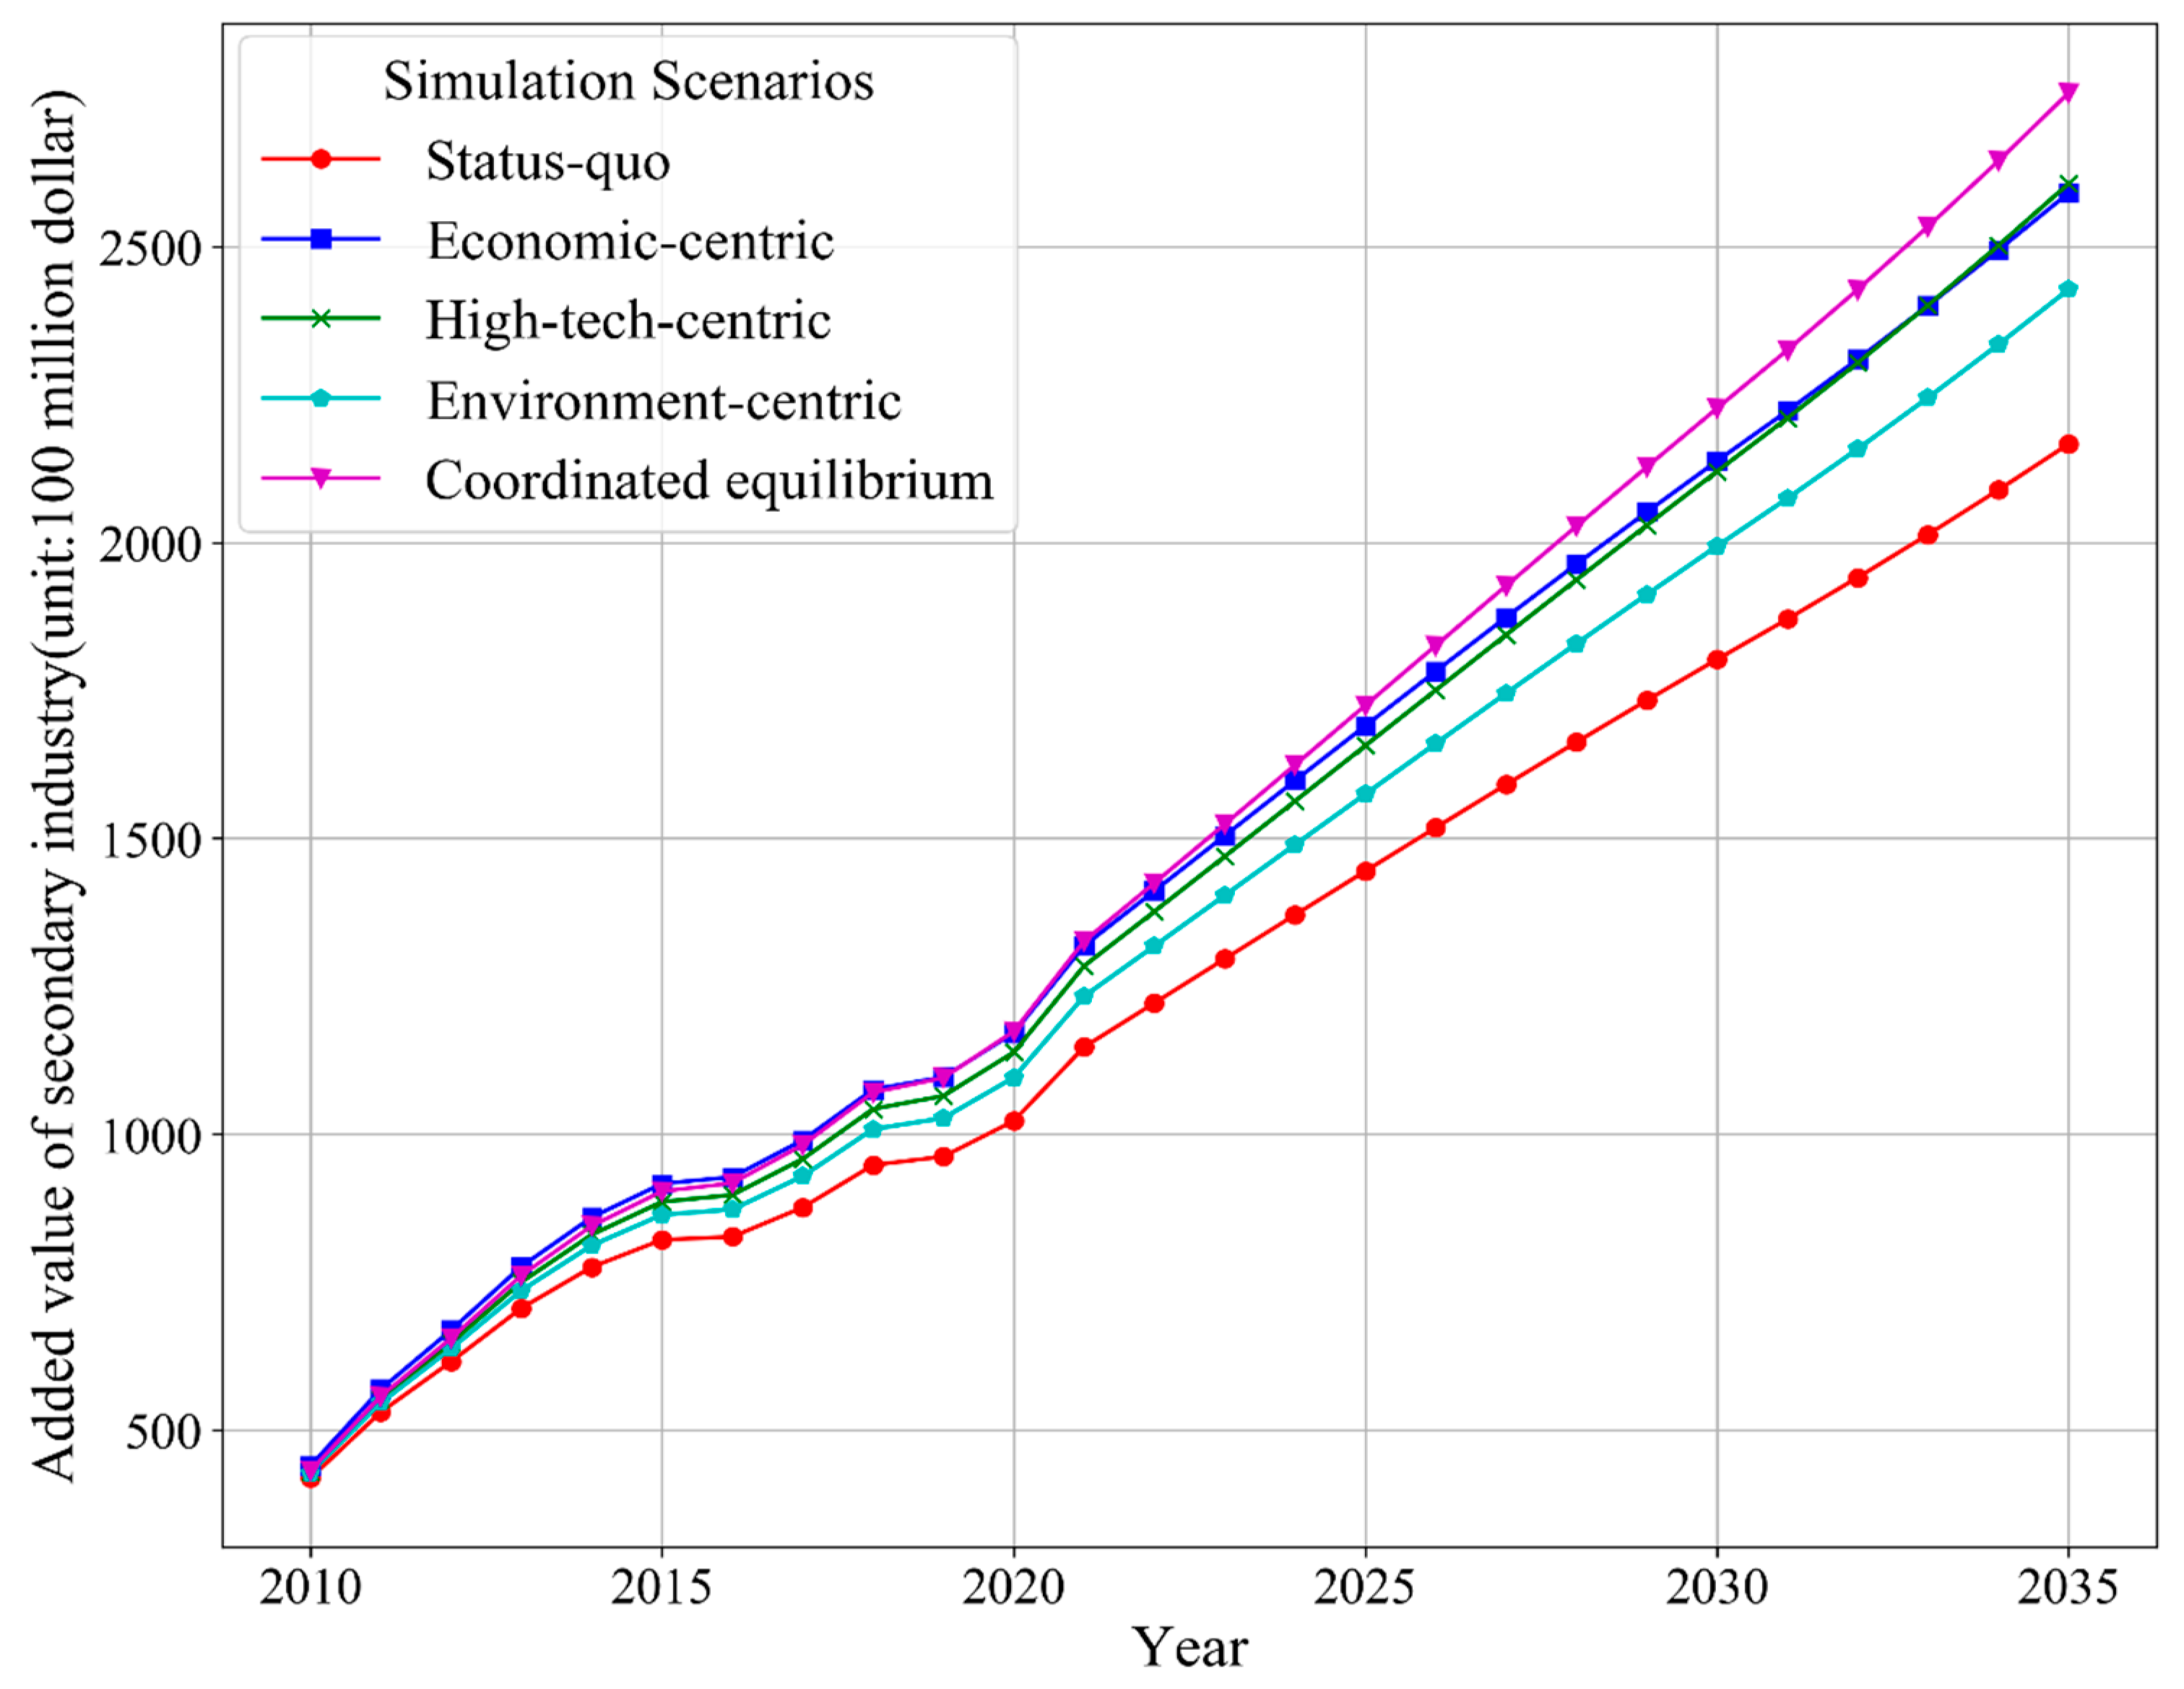
4.4. Simulation of Added Value of Secondary Industry

Regardless of the scenario, the added value of the secondary industry will gradually mount, which is similar to the simulation trend of GDP (Figure 8). In the coordinated equilibrium scenario, while its annual growth rate has gradually decreased from the initial 14.93% to 4.37%, the added value of the secondary industry can reach 0.28 trillion dollars by 2035. The simulation results are presented in an interleaved and similar manner under the economic-centric and high-tech-centric scenarios, which both reach 0.26 trillion dollars by 2035, whereas in the status quo, it is only 0.22 trillion yuan in 2035, far lower than that in other scenarios. Thus, for the added value of secondary industry, the coordinated equilibrium scenario was found to have the highest performance, as in the previous section.

5. Discussion

The SD model of urban carrying capacity in this paper was coupled with nine typical first-order systems with nine level variables. Because of the complexity of the system, the behavior of urban carrying capacity is not limited to linear growth, exponential growth, S-shaped growth, spiral rise and damping oscillation, but the complex combination of them. Thus, the quality of the model simulation depends on whether it properly represents the real-world system [38]. Due to the large number of parameters in the model, representative indicators were extracted to test the error size between the actual and the simulation value. As Table 2 shows, the total population of Shanghai, GDP, output value of the tertiary industry and urban green ecological index were employed to test the model from 2010 to 2017.
Through comparison, it was found that the relative errors of the four indicators from 2010 to 2017 all met the requirements of the pre-design, and the relative errors of the data were less than 5%, accounting for 57% of the total checked data. Therefore, the system dynamics model has high accuracy and is suitable for the simulation of urban carrying capacity in Shanghai.
Table 3 displays the simulation ranking results of the four indicators in five simulation scenarios by 2035. The simulations show that if the status quo of social development is maintained, the carrying population size, economic development and green ecological index will increase, but the population carrying potential and ecological environment construction will gradually slow down over the next fifteen years. The simulation results in the status quo of the indicators are all poor, as shown in Table 3. Meanwhile, the growth rate of the economy is faster than the population size, which is likely to lead to a drop in the competitiveness and attractiveness of urban development and is not conducive to the healthy development of the urban economy. Note that the economic-centric scenario is obviously not feasible, and that the green ecological index ranks fourth (worst), showing a downward trend and causing environmental pollution and the decline of residents’ living standards. Furthermore, in the environment-centric scenario, while it is possible to improve the urban ecological environment from the third ranking, it is still not conducive to the overall development of Shanghai from the perspective of economic development and population relations. In the high-tech scenario, the green ecological index and the added value of the secondary industry rank second, and its total population and GDP rank third, which is a suitable development scenario. In addition, compared to the above four scenarios, the optimal scheme is the coordinated equilibrium scenario, in which the green ecological index, the added value of secondary industry, the total population, and GDP, all have top-ranked results.
The status quo scenario sustains the current development situation. In this scenario, the population simulation result in 2035 will be within the range of about 25 million planned in the Shanghai Master Plan 2017–2035. However, the current development model restricts large-scale development of the future economy and society. In addition, by 2035, GDP, the added value of secondary industry and other indicators are the lowest compared to other scenarios, but the basic economic, social and ecological development of Shanghai will barely be maintained.
With other system parameters unchanged, under the economic-centric scenario, the level of urban economic development is adjusted from the perspective of per capita disposable income and industrial structure. Simulation results revealed that Shanghai’s GDP and the added value of secondary industry are at the forefront, but the green ecological index has been declining since 2018. There is a contradictory trend between ecological and economic development. This means that the post-2018 carrying capacity is inadequate because it is unable to provide suitable ecological functions for the humans in Shanghai. The development of secondary industry needs considerable energy and resources, while huge pollution emissions are generated [39]. Consequently, the secondary industry has an important impact on China’s ecological environment.
The high-tech-centric scenario focuses on increasing investment in high-tech industries. Natural resources in Shanghai are not abundant. Economic development relies more on tertiary industry, in which the proportion of tertiary industry and the proportion of tertiary industry employees gradually increase year by year [40]. The extensive economic growth model has been replaced by a “post-industrial” model dominated by modern services, supplemented by high-end manufacturing and high-tech industries. In this scenario, the secondary and tertiary production and GDP will increase significantly. With the advantages of being in a coastal area, convenient geographical location and open policy orientation, the economic aggregate of Shanghai has been far ahead in China for a long time. However, due to historical and other reasons, there is still room for Shanghai’s economic scale to increase, compared with typical global cities, in various aspects. Shanghai must build an outstanding global city to maintain harmonious development of the market economy, scientific and technological innovation and ecological environment. The proportion of R&D expenses in GDP in 2018 exceeded 4% for the first time, which is comparable to that of Paris. However, R&D investment in Shanghai was about 100 billion yuan less than that in Shenzhen, which has more high-tech enterprises. Hence, it is necessary to make a series of science and technology policies to support innovation to synchronize economic development. Shanghai enterprises should be encouraged to invest in R&D, and close coordination between government and enterprises should be emphasized to avoid investment dispersion. We should also pay attention to industrial innovation in the suburbs, which is a relatively weak point in Shanghai.
The environment-centric scenario not only ensures economic development but also has a small impact on environmental load, resulting in a good sustainable carrying state. More and more attention has been paid to the strengthening effect of solid waste treatment, ecological environment restoration, sewage treatment and environmental protection equipment manufacturing, on ecological resource carrying capacity [10,41]. For example, Sanjuan et al. (2022) [41] considered that municipal solid waste recycling is ecologically and economically viable, and socially acceptable. Over recent years, with respect to the problems of garbage treatment and classification, compulsory garbage classification has been pioneered in Shanghai, resulting in the first local law on garbage sorting [42]; a major achievement in Shanghai. By the end of October 2019, the daily recycling volume of recyclable materials reached 5960 tons, and the amount of wet garbage exceeded 8710 tons, an increase of 4.6 times and 1 time compared with October 2018, respectively. The daily discharge of hazardous waste was 1 ton, a nine-fold increase compared with the average daily discharge in 2018. Additionally, strengthening the construction of social governance capacity and creating a market for waste classification and resource utilization may greatly promote the utilization rate of resources and the urban carrying capacity.
The combination of multiple scenarios in the coordinated equilibrium scenario produces a marked improvement in the urban carrying capacity. All indicators are excellent. This indicates that urban carrying capacity is the result of the comprehensive effects of society, economy and ecology. In conclusion, the coordinated equilibrium scenario greatly contributes to the harmonious development of society, economy and ecology. In addition, protection of the ecological environment is an important indicator of urban competitiveness. From 2010 to 2019, the forest coverage rate of Shanghai showed an overall increasing trend. In 2019, the total forest area of Shanghai was 1.67 million mu, accounting for 17.59%, an increase of 5% compared with that of 2011. By 2020, Shanghai plans to create 70,000 mu of woodland, with a forest coverage rate of more than 18%. Overall atmospheric pollution in Shanghai is not serious compared to China as a whole, but there is still some improvements that need to be made. For example, in Zhongshan Street of Songjiang district, there are large garbage dumps and small and medium-sized polluting enterprises, so the dilution capacity of air pollutants is poor, and the heat island effect is high. Creating green vegetation borders laid along walls of surrounding buildings, restricting screening and regulating pollution from industries, are good solutions to increase large areas of ecological green space and improve environmental quality. Adhering to a spatial layout structure with multiple centres with green wedges and a green belt around the city can greatly promote positive development of the urban environment and the goal of harmonious coexistence between humans and nature.
There are certain limitations to this research:
(1)
Urban carrying capacity is a complex, multi-factor system. Although this study involves as many relevant influencing factors as possible, it still cannot cover all of them. Some influencing factors, such as land subsidence on the carrying population, have been simplified or not taken into account.
(2)
Four indicators were used to represent the level of urban carrying capacity of urban population, economy and ecology. In subsequent studies, land change can be integrated into the model for simulation of urban land change.
Research on urban carrying capacity involves economics, environmental management and resource management. With richer data and more advanced technology, researchers will obtain more scientifically sound results. For more comprehensive studies in the future, SD models can be combined with a fuzzy comprehensive evaluation method or other relevant models [32].

6. Conclusions

A system dynamic model is an important method for studying complex social-economic-environment systems and integrates complex socio-economic systems. Based on the SD method, a model of the urban carrying capacity of four mutually restricted subsystems in Shanghai was established. The development of urban carrying capacity (including carrying population, GDP, green ecological index and the added value of secondary industry) were simulated and analyzed under five scenarios for the period 2018–2035 [43]. The results are consistent with the historical status of the Shanghai Statistical Yearbook, confirming the reliability of the model.
It is not feasible to promote sustainable urban development of Shanghai by only relying on environmental governance or accelerating economic development. Through comparative analysis, it was found that the simulation results of major variables of coordinated equilibrium scenario were better than in other scenarios. This represents a rapid, ecological and coordinated systematic development model, which mainly benefits from the coordinated and unified development of environmental governance, resource utilization and economic benefits. Coordinated development is an important criterion to evaluate high-quality development, but it also has several limitations. For example, compared with the Paris region, which accounts for 40% of the R&D (research and development) expenditure in France, the R&D expenditure in Shanghai is not as great [44]. Therefore, Shanghai needs to give full play to its geographical and cultural advantages, and deploy high-tech to drive industrial transformation, thereby enhancing its economic competitiveness. In addition, from a cultural perspective, people should be guided to establish an ecological concept of harmony between humans and nature. From a technical point of view, we should vigorously develop environmental pollution control technology and improve the level of science and technology step by step. For Shanghai to become an excellent global city, a city of innovation, humanity and ecology, and a modern international metropolis with global influence, it must take the road of coordinated equilibrium development.

Author Contributions

Manuscript revising, data processing and visualization, T.T.; Manuscript writing, conceptual design and fund acquisition W.Y. All authors have read and agreed to the published version of the manuscript.

Funding

This research was supported by “study on spatio-temporal process and mechanism of land use urbanization transformation based on GIS and RS” (ZR2022QD146).

Institutional Review Board Statement

Not applicable.

Informed Consent Statement

Not applicable.

Data Availability Statement

Data and materials are available from the authors upon request.

Acknowledgments

We sincerely appreciate the three anonymous reviewers’ helpful comments and the editor’s efforts in improving this manuscript.

Conflicts of Interest

The authors declare no conflict of interest.

References

  1. Zou, H.; Ma, X. Identifying resource and environmental carrying capacity in the Yangtze River Economic Belt, China: The perspectives of spatial differences and sustainable development. Environ. Dev. Sustain. 2021, 23, 14775–14798. [Google Scholar] [CrossRef]
  2. Zhang, Y.; Wei, Y.; Zhang, J. Overpopulation and urban sustainable development—Population carrying capacity in Shanghai based on probability-satisfaction evaluation method. Environ. Dev. Sustain. 2021, 23, 3318–3337. [Google Scholar] [CrossRef]
  3. Bao, H.; Wang, C.; Han, L.; Wu, S.; Lou, L.; Xu, B.; Liu, Y. Resources and Environmental Pressure, Carrying Capacity, And Governance: A Case Study of Yangtze River Economic Belt. Sustainability 2020, 12, 1576. [Google Scholar] [CrossRef] [Green Version]
  4. Bibri, S.E.; Krogstie, J.; Kärrholm, M. Compact city planning and development: Emerging practices and strategies for achieving the goals of sustainability. Dev. Built Environ. 2020, 4, 100021. [Google Scholar] [CrossRef]
  5. Lin, S.; Sun, J.; Marinova, D.; Zhao, D. Effects of Population and Land Urbanization on China’s Environmental Impact: Empirical Analysis Based on the Extended STIRPAT Model. Sustainability 2017, 9, 825. [Google Scholar] [CrossRef] [Green Version]
  6. Yang, G.; Dong, Z.; Feng, S.; Li, B.; Sun, Y.; Chen, M. Early warning of water resource carrying status in Nanjing City based on coordinated development index. J. Clean. Prod. 2021, 284, 124696. [Google Scholar] [CrossRef]
  7. Shi, Y.; Shi, S.; Wang, H. Reconsideration of the methodology for estimation of land population carrying capacity in Shanghai metropolis. Sci. Total. Environ. 2019, 652, 367–381. [Google Scholar] [CrossRef]
  8. Li, J.; Liu, Z.; He, C.; Yue, H.; Gou, S. Water shortages raised a legitimate concern over the sustainable development of the drylands of northern China: Evidence from the water stress index. Sci. Total Environ. 2017, 590–591, 739–750. [Google Scholar] [CrossRef]
  9. Zheng, B.; Tong, D.; Li, M.; Liu, F.; Hong, C.; Geng, G.; Li, H.; Li, X.; Peng, L.; Qi, J.; et al. Trends in China’s anthropogenic emissions since 2010 as the consequence of clean air actions. Atmos. Chem. Phys. 2018, 18, 14095–14111. [Google Scholar] [CrossRef] [Green Version]
  10. Khan, A.H.; López-Maldonado, E.A.; Alam, S.S.; Khan, N.A.; López, J.R.L.; Herrera, P.F.M.; Abutaleb, A.; Ahmed, S.; Singh, L. Municipal solid waste generation and the current state of waste-to-energy potential: State of art review. Energy Convers. Manag. 2022, 267, 115905. [Google Scholar] [CrossRef]
  11. Rees, W.E. Ecological footprints and appropriated carrying capacity: What urban economics leaves out. Environ. Urban. 1992, 4, 121–130. [Google Scholar] [CrossRef]
  12. Cao, X.; Shi, Y.; Zhou, L. Research on Urban Carrying Capacity Based on Multisource Data Fusion—A Case Study of Shanghai. Remote Sens. 2021, 13, 2695. [Google Scholar] [CrossRef]
  13. Shi, Y.; Wang, H.; Yin, C. Evaluation method of urban land population carrying capacity based on GIS—A case of Shanghai, China. Comput. Environ. Urban Syst. 2013, 39, 27–38. [Google Scholar] [CrossRef]
  14. Wang, K.; Cai, Z.; Xu, Y.; Zhang, F. Hexagonal cyclical network structure and operating mechanism of the social-ecological system. Ecol. Indic. 2022, 141, 109099. [Google Scholar] [CrossRef]
  15. Plumb, G.E.; White, P.J.; Coughenour, M.B.; Wallen, R.L. Carrying capacity, migration, and dispersal in Yellowstone bison. Biol. Conserv. 2009, 142, 2377–2387. [Google Scholar] [CrossRef]
  16. Zhao, W.; Jiang, C.J.; Li, X.Y. Study on influence effect and coupling coordination of dynamic factors of urban land carrying capacity based on VAR model. J. Henan Agric. Univ. 2019, 53, 926–933. (In Chinese) [Google Scholar]
  17. Tang, Y.; Yuan, Y.; Zhong, Q. Evaluation of Land Comprehensive Carrying Capacity and Spatio-Temporal Analysis of the Harbin-Changchun Urban Agglomeration. Int. J. Environ. Res. Public Health 2021, 18, 521. [Google Scholar] [CrossRef]
  18. Song, X.M.; Kong, F.Z.; Zhan, C.S. Assessment of Water Resources Carrying Capacity in Tianjin City of China. Water Resour. Manag. 2011, 25, 857–873. [Google Scholar] [CrossRef]
  19. Yan, G.Q.; He, Y.C.; Zhang, X.H. Green Technology Progress, Agricultural Economic Growth and Pollution Space Spillover Effect: Evidence of Agricultural Water Utilization Process in China. Resour. Environ. Yangtze Basin 2019, 28, 129–143. (In Chinese) [Google Scholar]
  20. Pu, J.-W.; Zhao, X.-Q.; Miao, P.-P.; Li, S.-N.; Tan, K.; Wang, Q.; Tang, W. Integrating multisource RS data and GIS techniques to assist the evaluation of resource-environment carrying capacity in karst mountainous area. J. Mt. Sci. 2020, 17, 2528–2547. [Google Scholar] [CrossRef]
  21. Wu, X. An ecological environmental carrying capacity estimation of tourist attractions based on structural equation. Int. J. Environ. Technol. Manag. 2022, 25, 310–323. [Google Scholar] [CrossRef]
  22. Di, Q.B.; Han, S.S.; Han, Z.L. Spatial pattern of economic carrying capacity of cities at prefecture level and above in China. Geogr. Res. 2016, 35, 337–352. (In Chinese) [Google Scholar]
  23. Wang, D.; Ma, G.; Song, X.; Liu, Y. Energy price slump and policy response in the coal-chemical industry district: A case study of Ordos with a system dynamics model. Energy Policy 2017, 104, 325–339. [Google Scholar] [CrossRef]
  24. Zhou, Y.; Zhou, J. Urban atmospheric environmental capacity and atmospheric environmental carrying capacity constrained by GDP–PM2.5. Ecol. Indic. 2017, 73, 637–652. [Google Scholar] [CrossRef] [Green Version]
  25. Xing, X.G.; Shi, W.J.; Zhang, Y.D.; Xie, J.Y. Assessment of Groundwater Resources Carrying Capacity in Xi’an City Based on Principal Component Analysis. J. China Hydrol. 2013, 33, 35–38. (In Chinese) [Google Scholar]
  26. Zhang, J.; Zhang, C.; Shi, W.; Fu, Y. Quantitative evaluation and optimized utilization of water resources-water environment carrying capacity based on nature-based solutions. J. Hydrol. 2019, 568, 96–107. [Google Scholar] [CrossRef]
  27. Luo, M.; Huang, E.; Ding, R.; Lu, X. Research on water resources carrying capacity based on maximum supportable population. Fresenius Environ. Bull. 2019, 28, 100–110. [Google Scholar]
  28. Li, Y.; Huang, C.J.; Wang, K.; Wang, Y.T.; Zhang, D.H. Forest Ecological Carrying Capacity Evaluation and Gravity Center Transfer Analysis in Anhui Province. Resour. Environ. Yangtze Basin 2021, 30, 87–96. (In Chinese) [Google Scholar]
  29. Mashaly, A.F.; Fernald, A.G. Identifying Capabilities and Potentials of System Dynamics in Hydrology and Water Resources as a Promising Modeling Approach for Water Management. Water 2020, 12, 1432. [Google Scholar] [CrossRef]
  30. Zhu, X.Z.; Li, X.W.; Jia, K.J.; Qi, F. A Study on system dynamics of land comprehensive carrying capacity in Shanghai city. China Land Sci. 2014, 28, 90–96. (In Chinese) [Google Scholar]
  31. Barati, A.A.; Azadi, H.; Scheffran, J. A system dynamics model of smart groundwater governance. Agric. Water Manag. 2019, 221, 502–518. [Google Scholar] [CrossRef]
  32. Wang, G.; Xiao, C.; Qi, Z.; Meng, F.; Liang, X. Development tendency analysis for the water resource carrying capacity based on system dynamics model and the improved fuzzy comprehensive evaluation method in the Changchun city, China. Ecol. Indic. 2021, 122, 107232. [Google Scholar] [CrossRef]
  33. Zomorodian, M.; Lai, S.H.; Homayounfar, M.; Ibrahim, S.; Fatemi, E.; El-Shafie, A. The state-of-the-art system dynamics application in integrated water resources modeling. J. Environ. Manag. 2018, 227, 294–304. [Google Scholar] [CrossRef] [PubMed]
  34. Forrester, J.W. System dynamics, systems thinking, and soft OR. Syst. Dyn. Rev. 1994, 10, 245–256. [Google Scholar] [CrossRef]
  35. Zhou, J.; Chang, S.; Ma, W.; Wang, D. An unbalance-based evaluation framework on urban resources and environment carrying capacity. Sustain. Cities Soc. 2021, 72, 103019. [Google Scholar] [CrossRef]
  36. Aman, R.; Fang, C. Research on development models are suitable for water resources based on system dynamics model: Take Xinjiang as an example. Ecol. Econ. 2021, 37, 177–186. (In Chinese) [Google Scholar]
  37. Shad, M.; Sharma, Y.D.; Singh, A. Forecasting of monthly relative humidity in Delhi, India, using SARIMA and ANN models. Model. Earth Syst. Environ. 2022, 1–9. [Google Scholar] [CrossRef]
  38. Wang, C.; Hou, Y.; Xue, Y. Water resources carrying capacity of wetlands in Beijing: Analysis of policy optimization for urban wetland water resources management. J. Clean. Prod. 2017, 161, 1180–1191. [Google Scholar] [CrossRef]
  39. Ehrlich, C.; Noll, G.; Kalkoff, W.D.; Baumbach, G.; Dreiseidler, A. PM10, PM2.5 and PM1.0—Emissions from industrial plants—Results from measurement programmes in Germany. Atmos. Environ. 2007, 41, 6236–6254. [Google Scholar] [CrossRef]
  40. Xu, M.; Tan, R. Removing energy allocation distortion to increase economic output and energy efficiency in China. Energy Policy 2021, 150, 112110. [Google Scholar] [CrossRef]
  41. Sanjuan-Delmás, D.; Taelman, S.E.; Arlati, A.; Obersteg, A.; Vér, C.; Óvári, Á.; Tonini, D.; Dewulf, J. Sustainability assessment of organic waste management in three EU Cities: Analysing stakeholder-based solutions. Waste Manag. 2021, 132, 44–55. [Google Scholar] [CrossRef] [PubMed]
  42. Zhao, C.; Liu, M.; Du, H.; Gong, Y. The Evolutionary Trend and Impact of Global Plastic Waste Trade Network. Sustainability 2021, 13, 3662. [Google Scholar] [CrossRef]
  43. Shanghai Municipal People’s Government. Shanghai Master Plan 2017–2035. 2017. Available online: https://www.shanghai.gov.cn/nw42806/index.html (accessed on 17 January 2020).
  44. Safi, A.; Chen, Y.; Wahab, S.; Zheng, L.; Rjoub, H. Does environmental taxes achieve the carbon neutrality target of G7 economies? Evaluating the importance of environmental R&D. J. Environ. Manag. 2021, 293, 112908. [Google Scholar]
Figure 1. Geographic location of Shanghai. The base map was derived from several sources (OpenStreetMap, Stamen).
Sustainability 14 12910 g001
Figure 2. Work-flow diagram of the SD model.
Sustainability 14 12910 g002
Figure 3. SD model flow-chart of urban carrying capacity in Shanghai.
Sustainability 14 12910 g003
Figure 4. Subsystem connection diagram based on SD model.
Sustainability 14 12910 g004
Figure 5. Dynamic trends for total population in different scenarios.
Sustainability 14 12910 g005
Figure 6. Dynamic trends for GDP in different scenarios. Note that before 2020, GDP is calculated at the annual average exchange rate between the Chinese yuan and the U.S. dollar, whereas after 2020, the exchange rate is the average of the average exchange rate of the previous 10 years.
Sustainability 14 12910 g006
Figure 7. Dynamic trends for the green ecological index in different scenarios.
Sustainability 14 12910 g007
Figure 8. Dynamic trends for the added value of secondary industry in different scenarios.
Sustainability 14 12910 g008
Table 1. Selection of evaluation indicators and estimates of urban carrying capacity from an SD model at the macro scale.
System LevelEvaluation IndicatorsCalculation EquationUnitInitial Values
Social subsystemUrban population densityUrban population/built-up areaTen thousand people/km20.9239
Social insurance expenditureFinancial revenue × 0.0263Yuan75.4315
Number of graduates per yearINTED(Number of graduates per year) + Initial ValueThousand people164
Education expenditureFinancial revenue × 0.038100 million yuan114.943
Residents’ life indexln(urban population density + endowment insurance + consumption level of resident + Medical insurance expenditure)/8.79408
Urban per capita disposable incomeGDP × population urbanization rate/urban populationthousand yuan31.8
……
Economic SubsystemOutput value of secondary industryINTEG (added value of secondary industry) + Initial Value100 million yuan7139.96
Output value of tertiary industryINTEG (added value of tertiary industry) + Initial Value100 million yuan9618.31
Proportion of high-tech industry output value SIN (proportion of tertiary industry)%53.145
GDPINTEG (GDP increment) + Initial Value100 million yuan17166
Scientific and technological achievementsLook up 0.0502
……
Environment subsystemGreen coverage rate of built-up areaConstant (0.31)/0.31
Green area of built-up areaBuilt-up area × Green coverage rate of built-up areakm2299.7
Urban green ecological index2 × ln(Degree of urban construction + resident’s life index + Habitat quality index + carbon emissions + financial development index)/7.14805
Total resourcesln(1 + ABS(total water resources + green area of built-up area))/6.02196
Sewage dischargeEXP((7.9 × 10⁻⁸) * energy consumption + 8)/2438.18
……
* Note: “With lookup” in Vensim software is a table function, which can be used to characterize nonlinear relationship variables.
Table 2. Error test results of the SD model.
Variables Name20102011201220132014201520162017
Carrying population (Ten thousands)Historical values23032347238024152426241524202418
Simulated values23032318233223462360237723872401
Error (%)0.001.242.022.862.721.571.360.70
GDP (100 million yuan)Historical values17,43719,53920,55922,26424,06825,65928,18430,633
Simulated values17,16619,90221,99824,27726,08327,72929,48731,526
Error (%)1.55%1.86%7.00%9.04%8.37%8.07%4.62%2.92%
Output value of the tertiary industry (100 million yuan)Historical values983311,14312,19913,78615,27617,27519,66321,191
Simulated values961811,30013,13915,09916,17017,30918,52019,821
Error (%)2.19%1.41%7.71%9.52%5.85%0.20%5.81%6.47%
Urban green ecological indexHistorical values7.1487.2727.3567.4157.4567.4887.5137.536
Simulated values7.1487.2977.4057.4897.5547.6097.6597.705
Error (%)0−0.3%−0.7%−1.0%−1.3%−1.6%−1.9%−2.3%
Note: Source of historical values: Shanghai Statistical Yearbooks (2011–2018).
Table 3. Ranking of indicators simulation results under five scenarios in 2035.
ScenariosRanking Results
Carrying PopulationGDPGreen Ecological IndexAdded Value of Secondary Industry
Status quo5545
economic-centric1153
high-tech3322
environment-centric4434
coordinated equilibrium2211
Publisher’s Note: MDPI stays neutral with regard to jurisdictional claims in published maps and institutional affiliations.

