
A Practical Methodology for Building a Municipality-Led Renewable Energy Community: A Photovoltaics-Based Case Study for the Municipality of Hersonissos in Crete, Greece
 , ,
, ,
Abstract
:1. Introduction
2. Materials and Methods
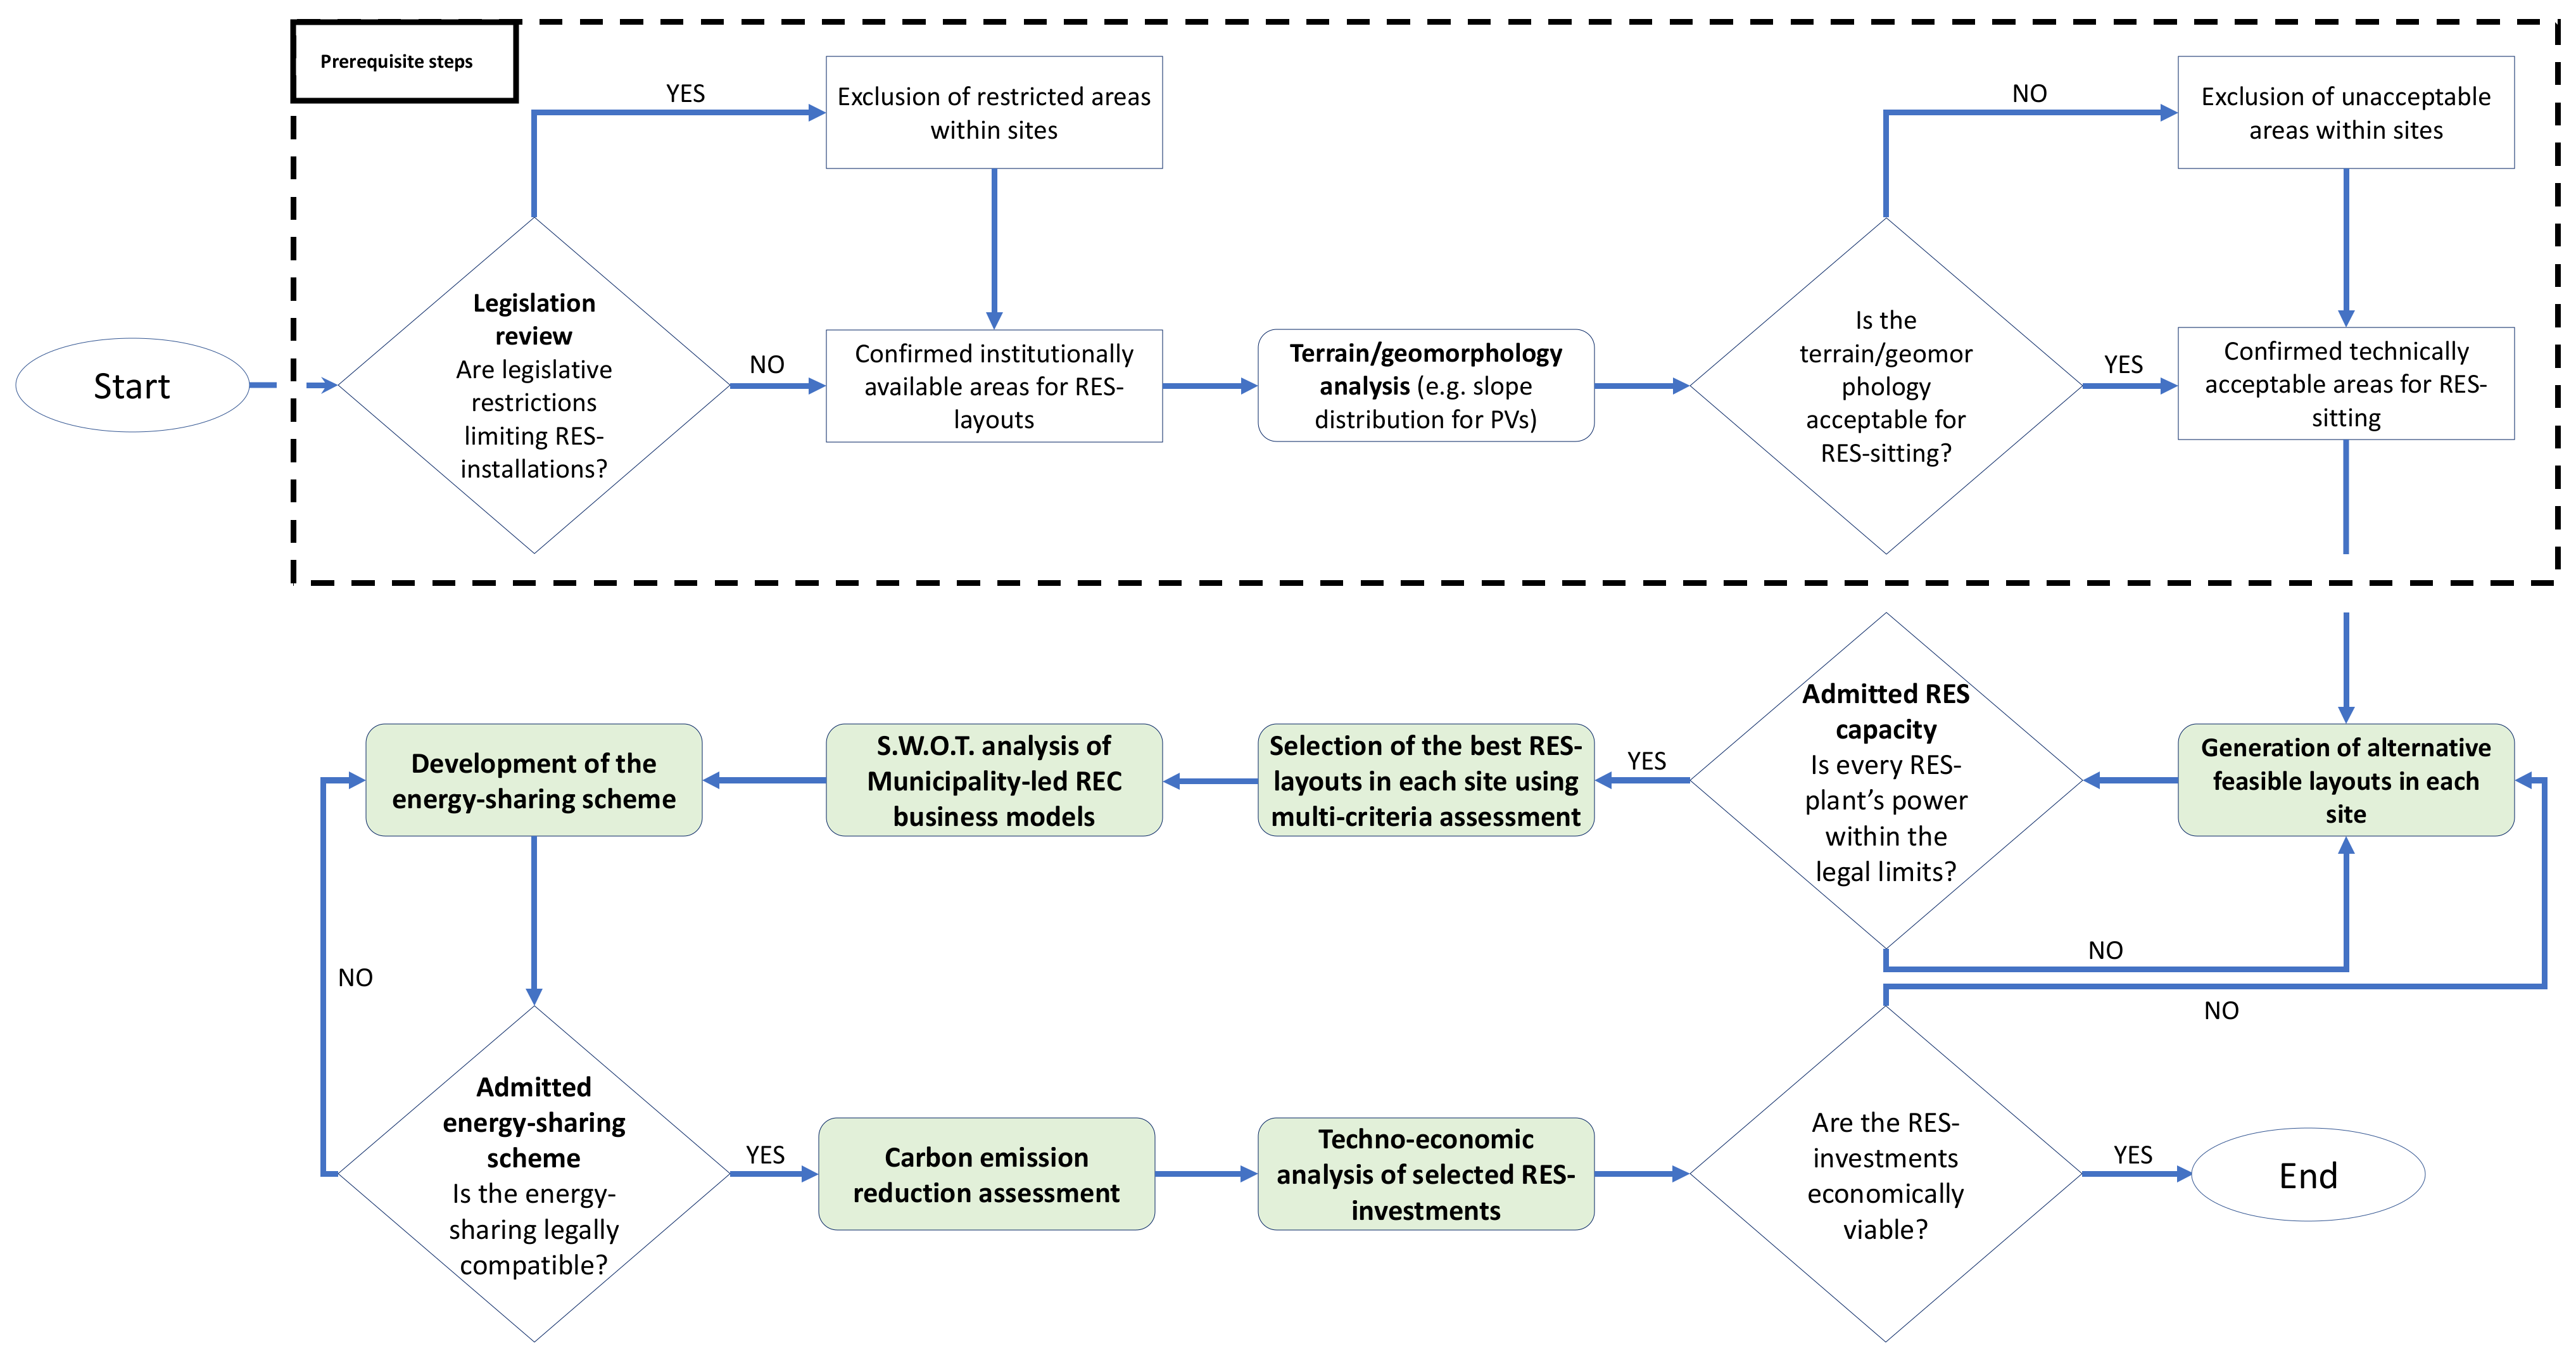
2.1. Methodology
- Generation of alternative feasible PV plant projects;
- Selection of the best PV plant projects;
- Selection of the best business model;
- Development of the energy-sharing scheme;
- Carbon emission reduction assessment;
- Techno-economic analysis of selected RES investments.
- Non-profitable EC without membership of physical persons;
- Non-profitable EC with membership of physical persons;
- Profitable EC.
2.2. Hersonissos Municipality Case Study
- Water supply and sewage company: legal entity under private law whose activities consist of planning, maintaining and managing water supply, sewage and irrigation systems.
- Solid waste management company: legal entity under private law, whose purpose is solid waste management (e.g., gathering, transportation, exploitation).
- Municipal port fund: legal entity under public law in charge of the management and exploitation of the Hersonissos port.
- Social protection and welfare agency: legal entity under public law responsible for providing support and social care services to infants, children and the elderly.
- Archaeological;
- Environmental.
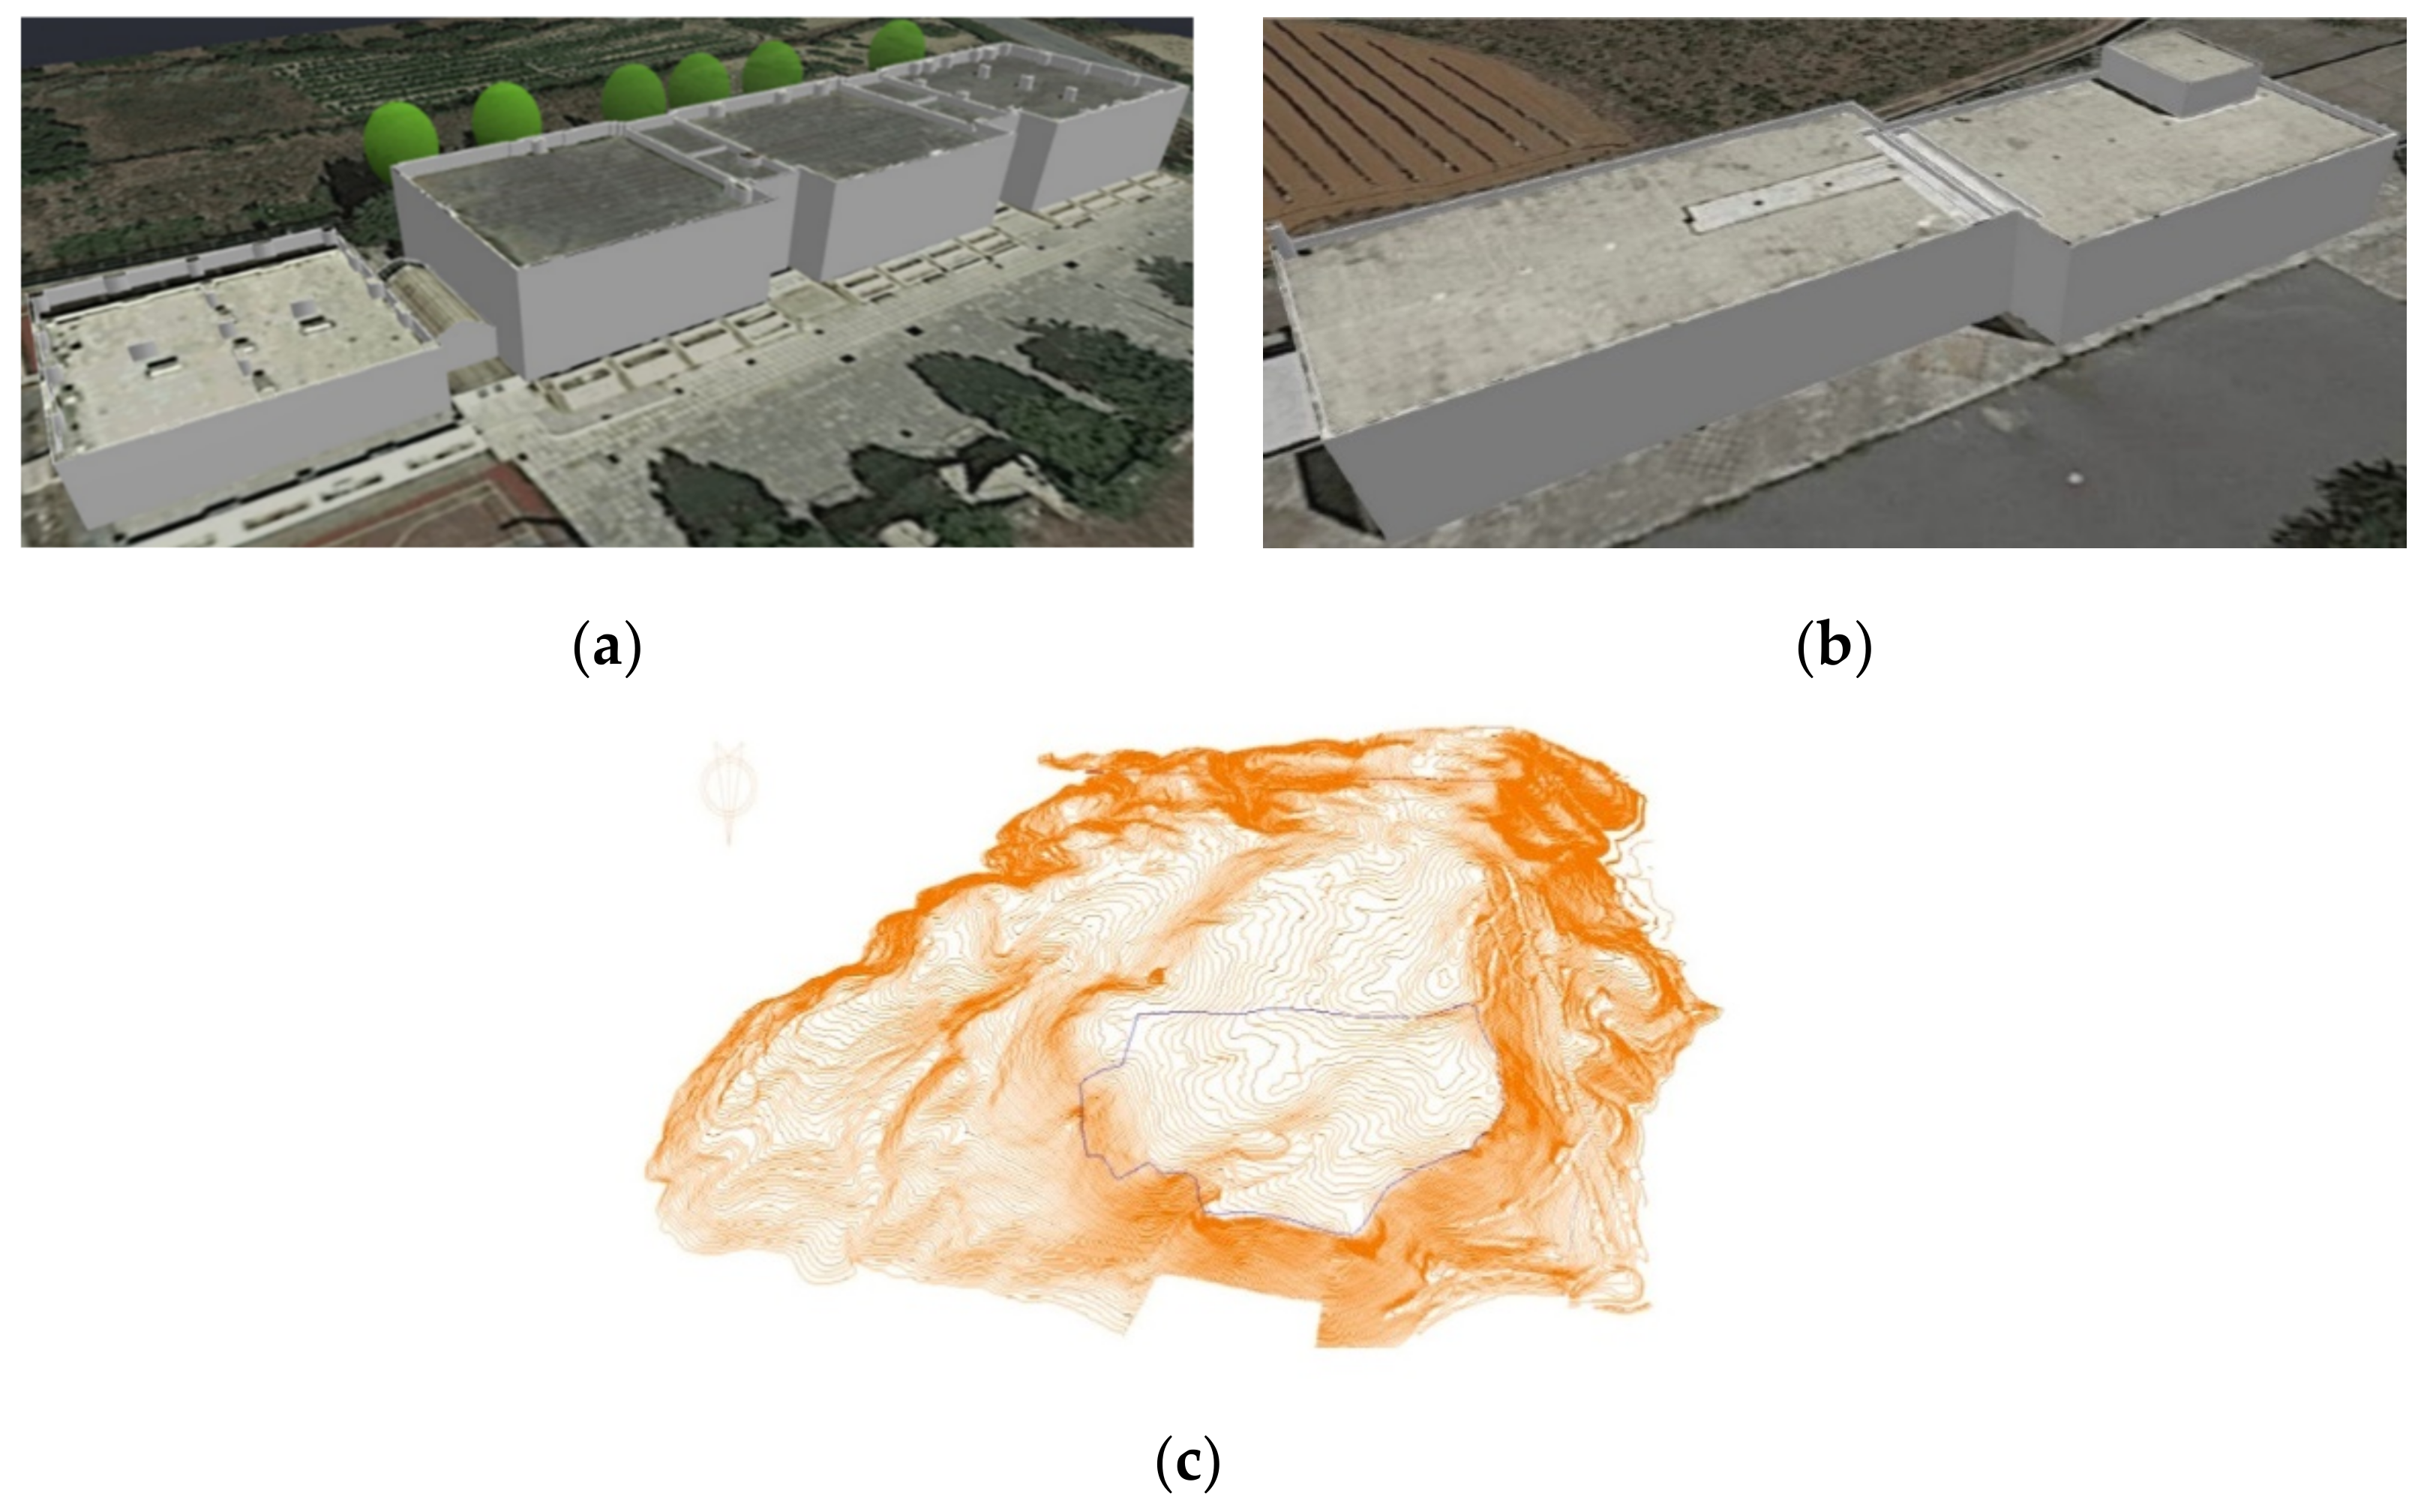
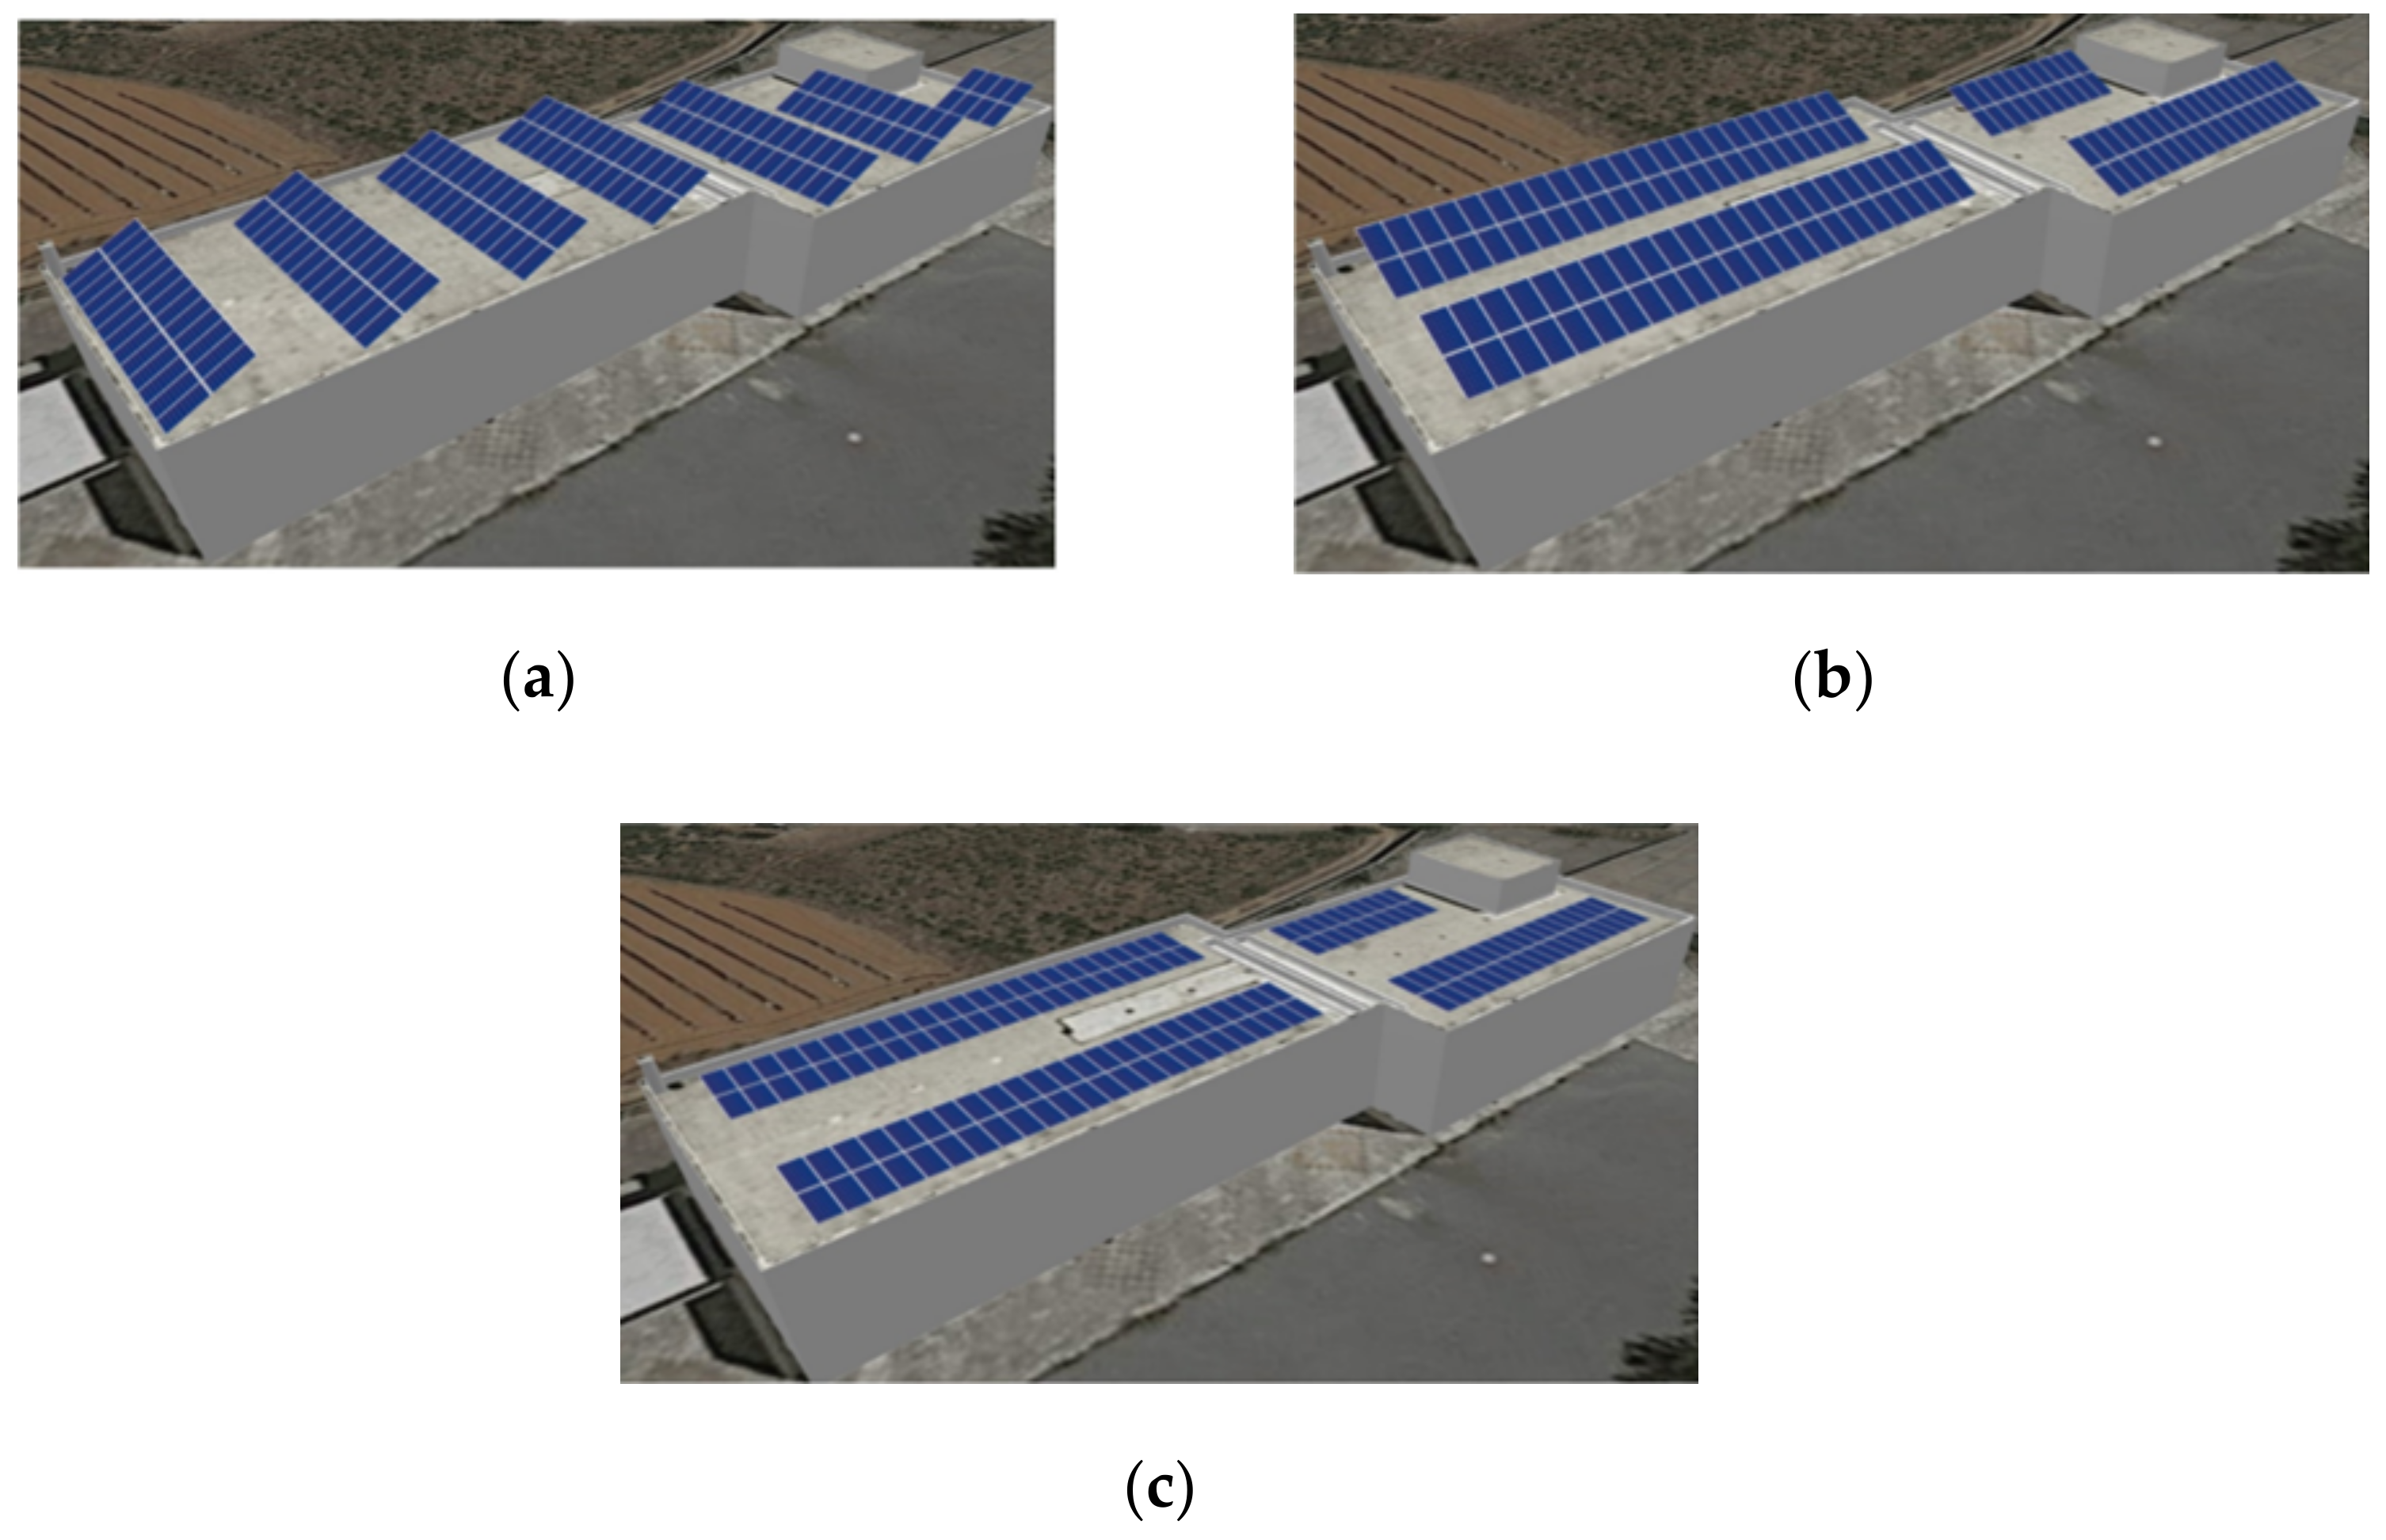
- The flat rooftop of 1063 m2 total surface area of the high school building in the Episkopi village.
- The flat rooftop of 855 m2 total surface area of the high school building in the Mochos village.
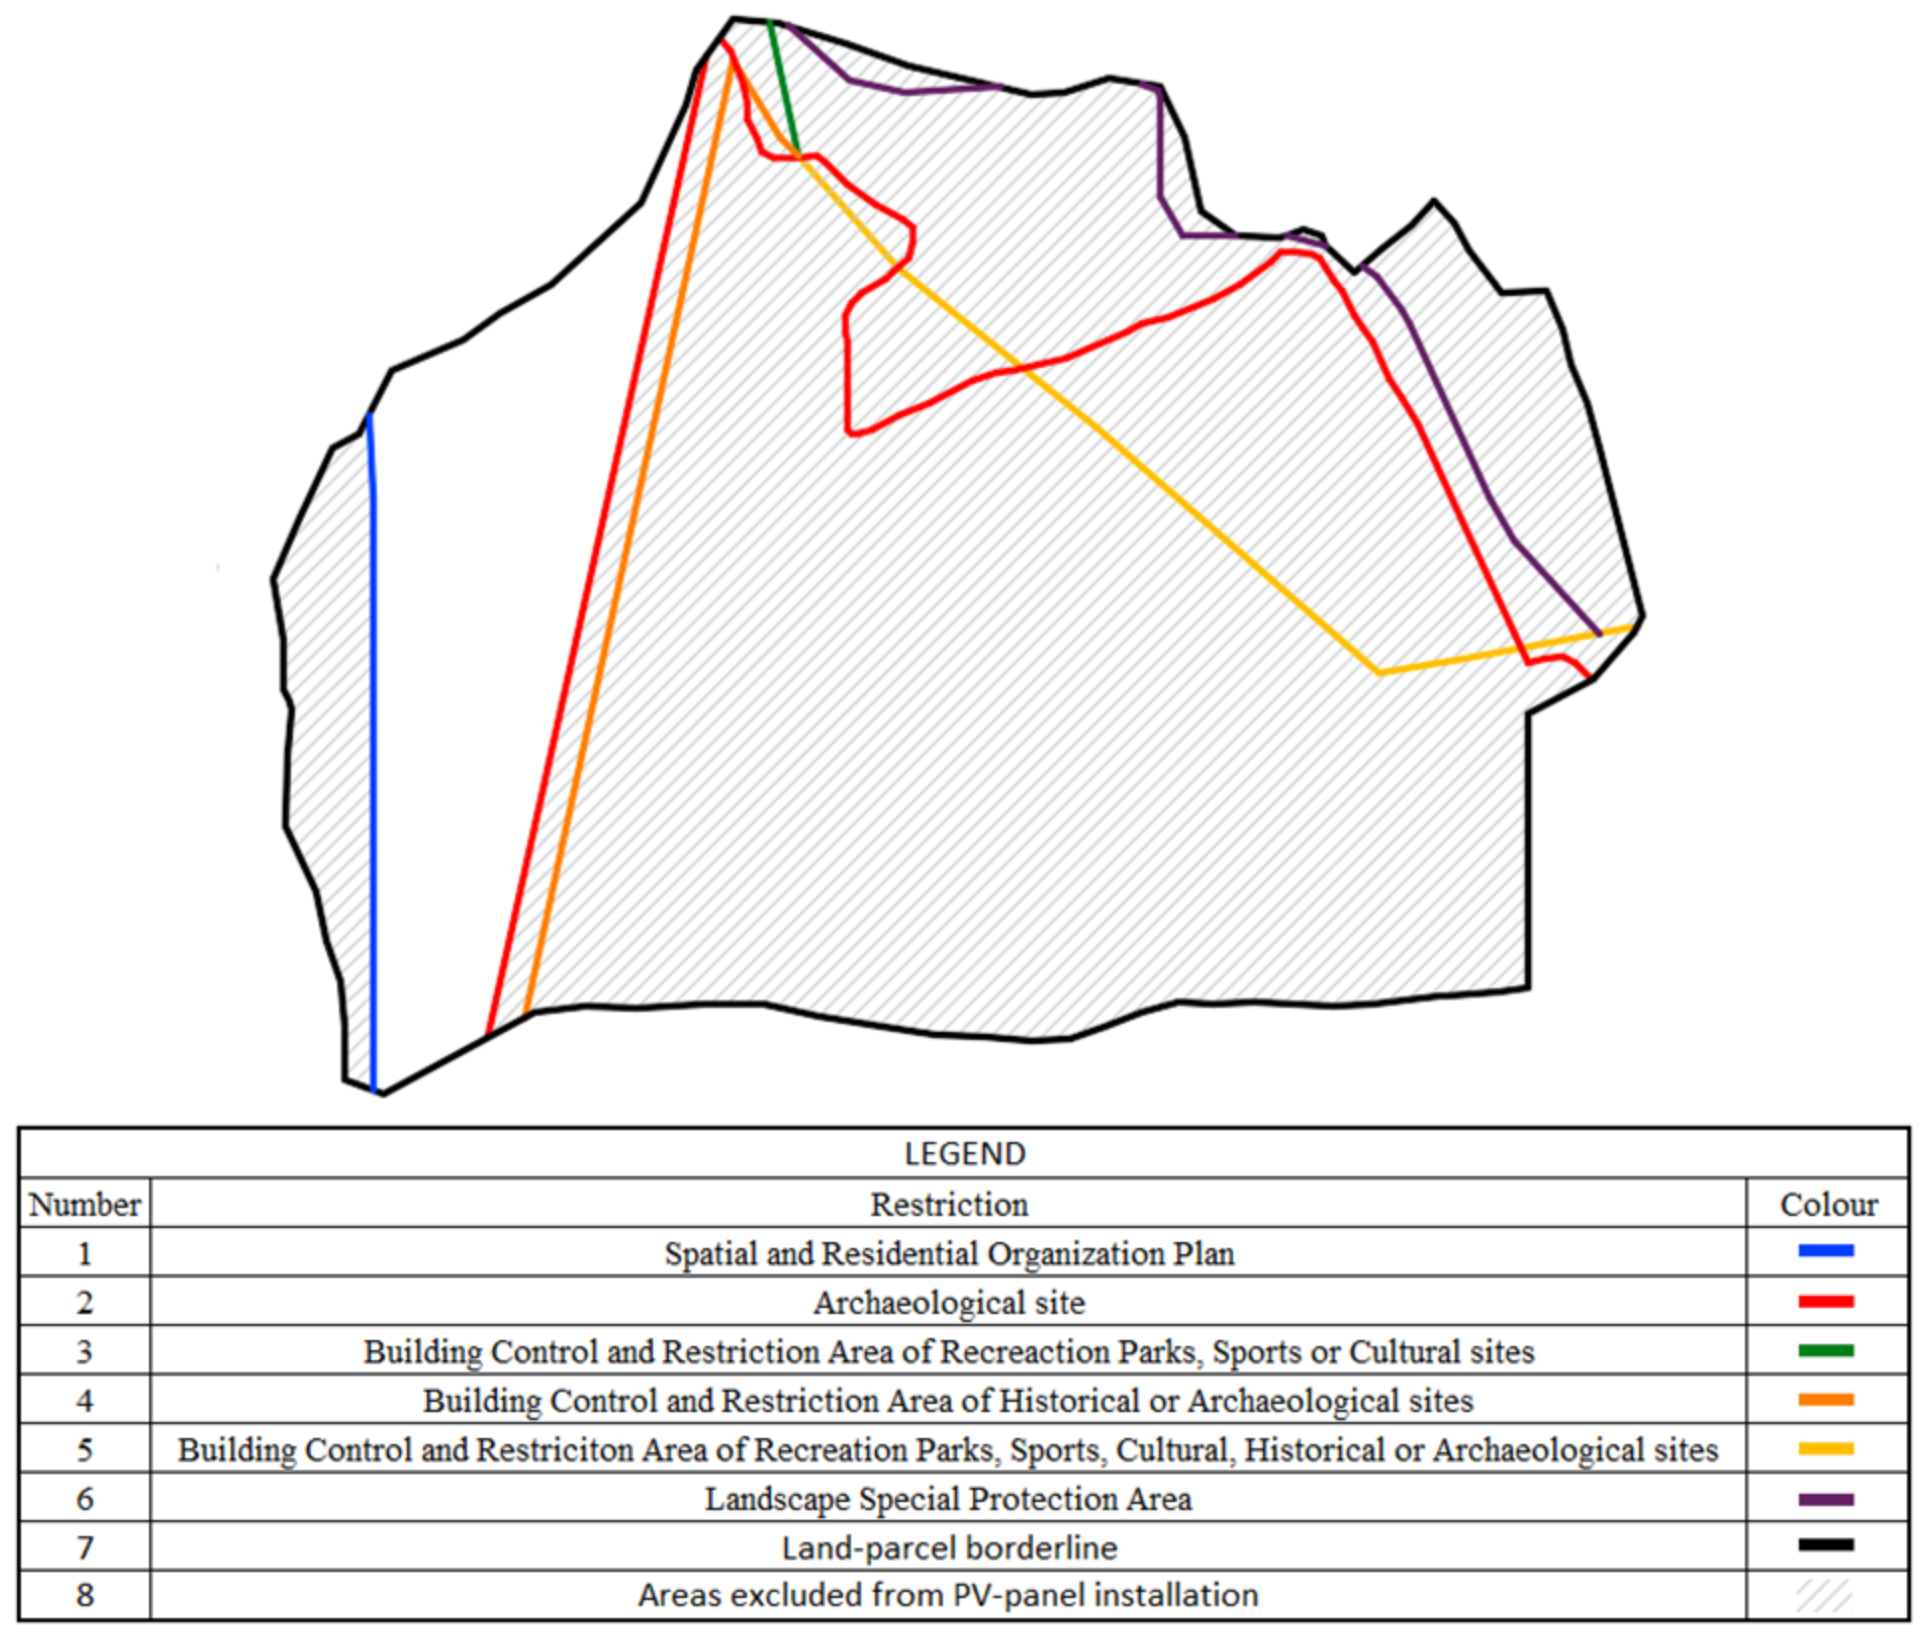
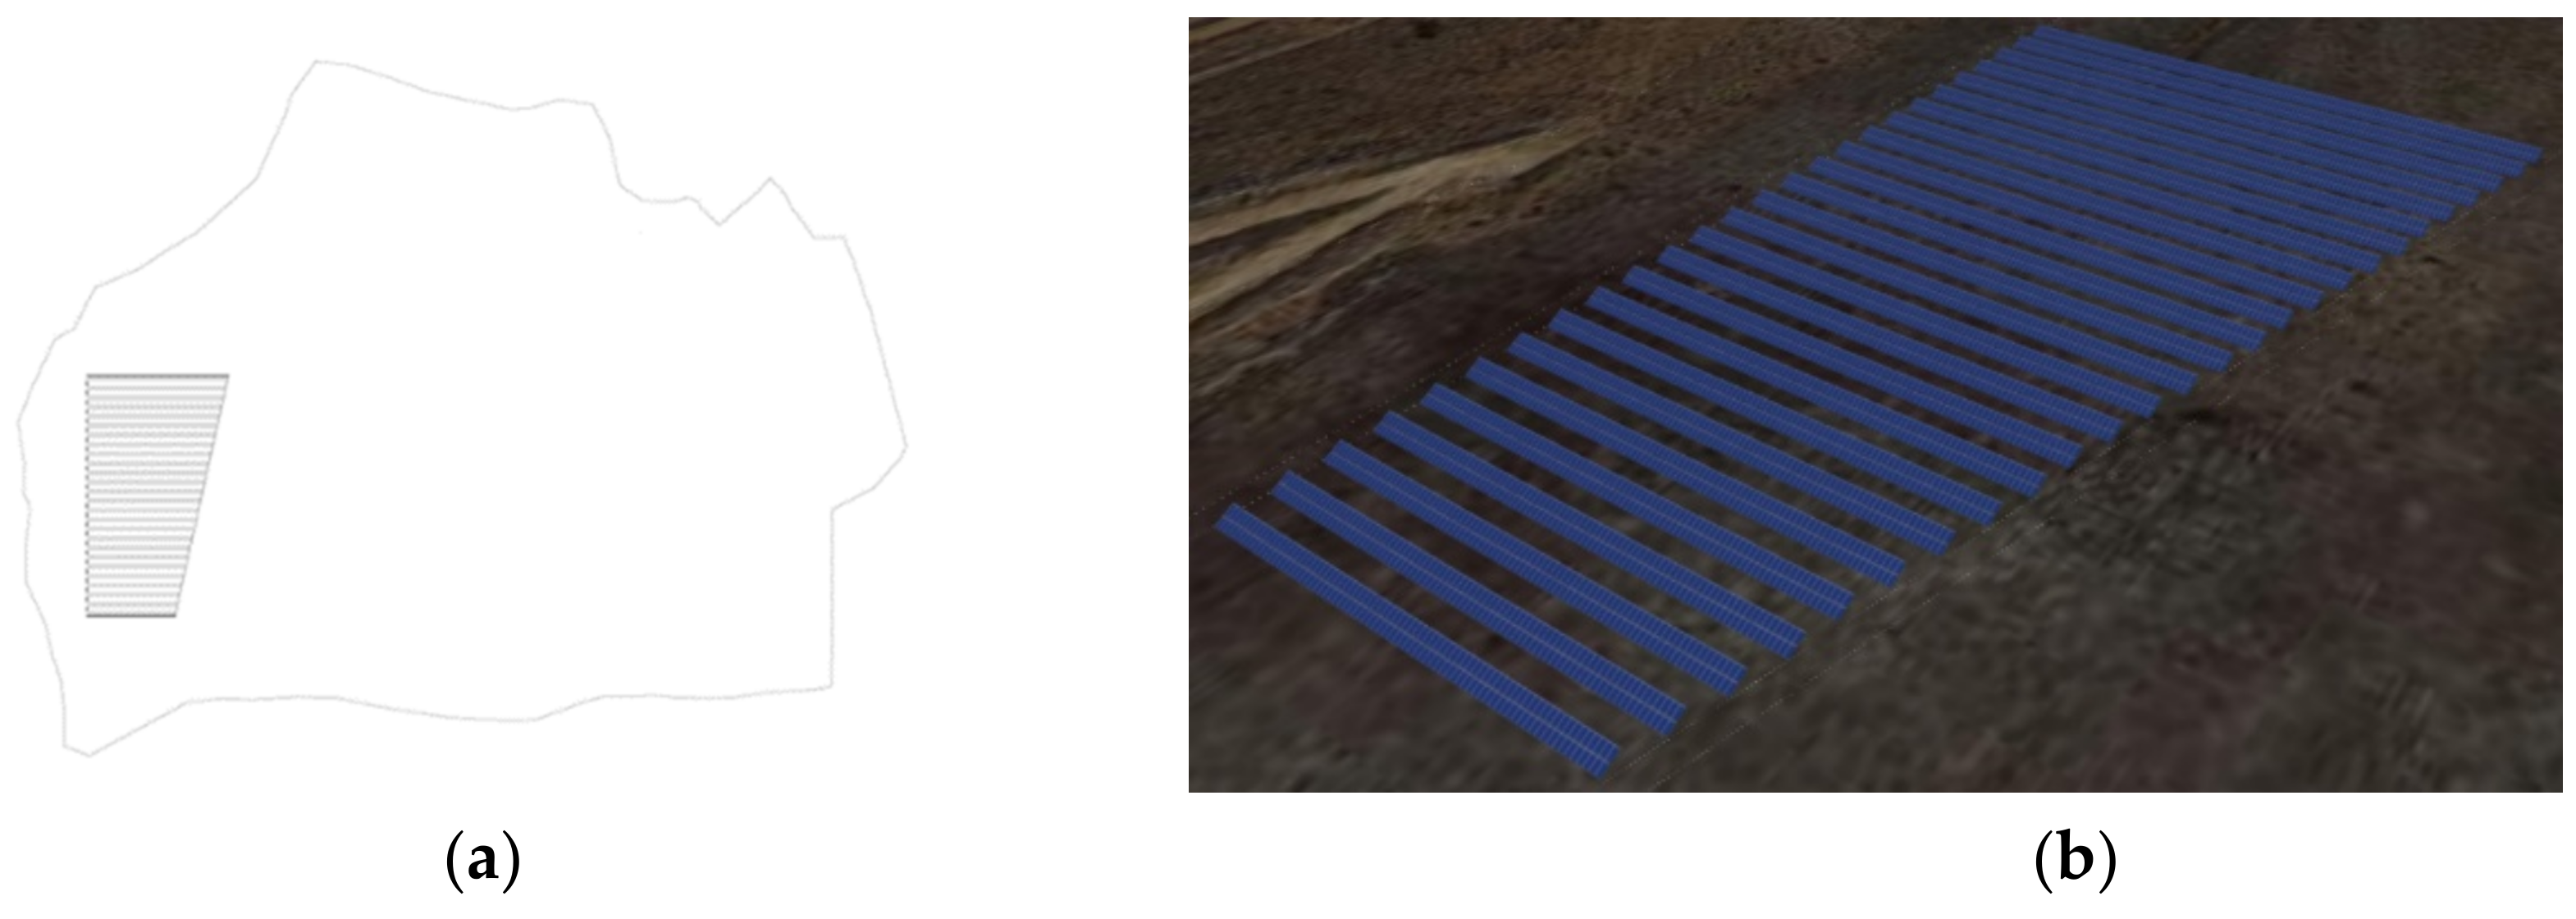
- The land parcel of a vast surface of up to 425,170 m2 located in the “Skoteino” Cave.
3. Results and Discussion
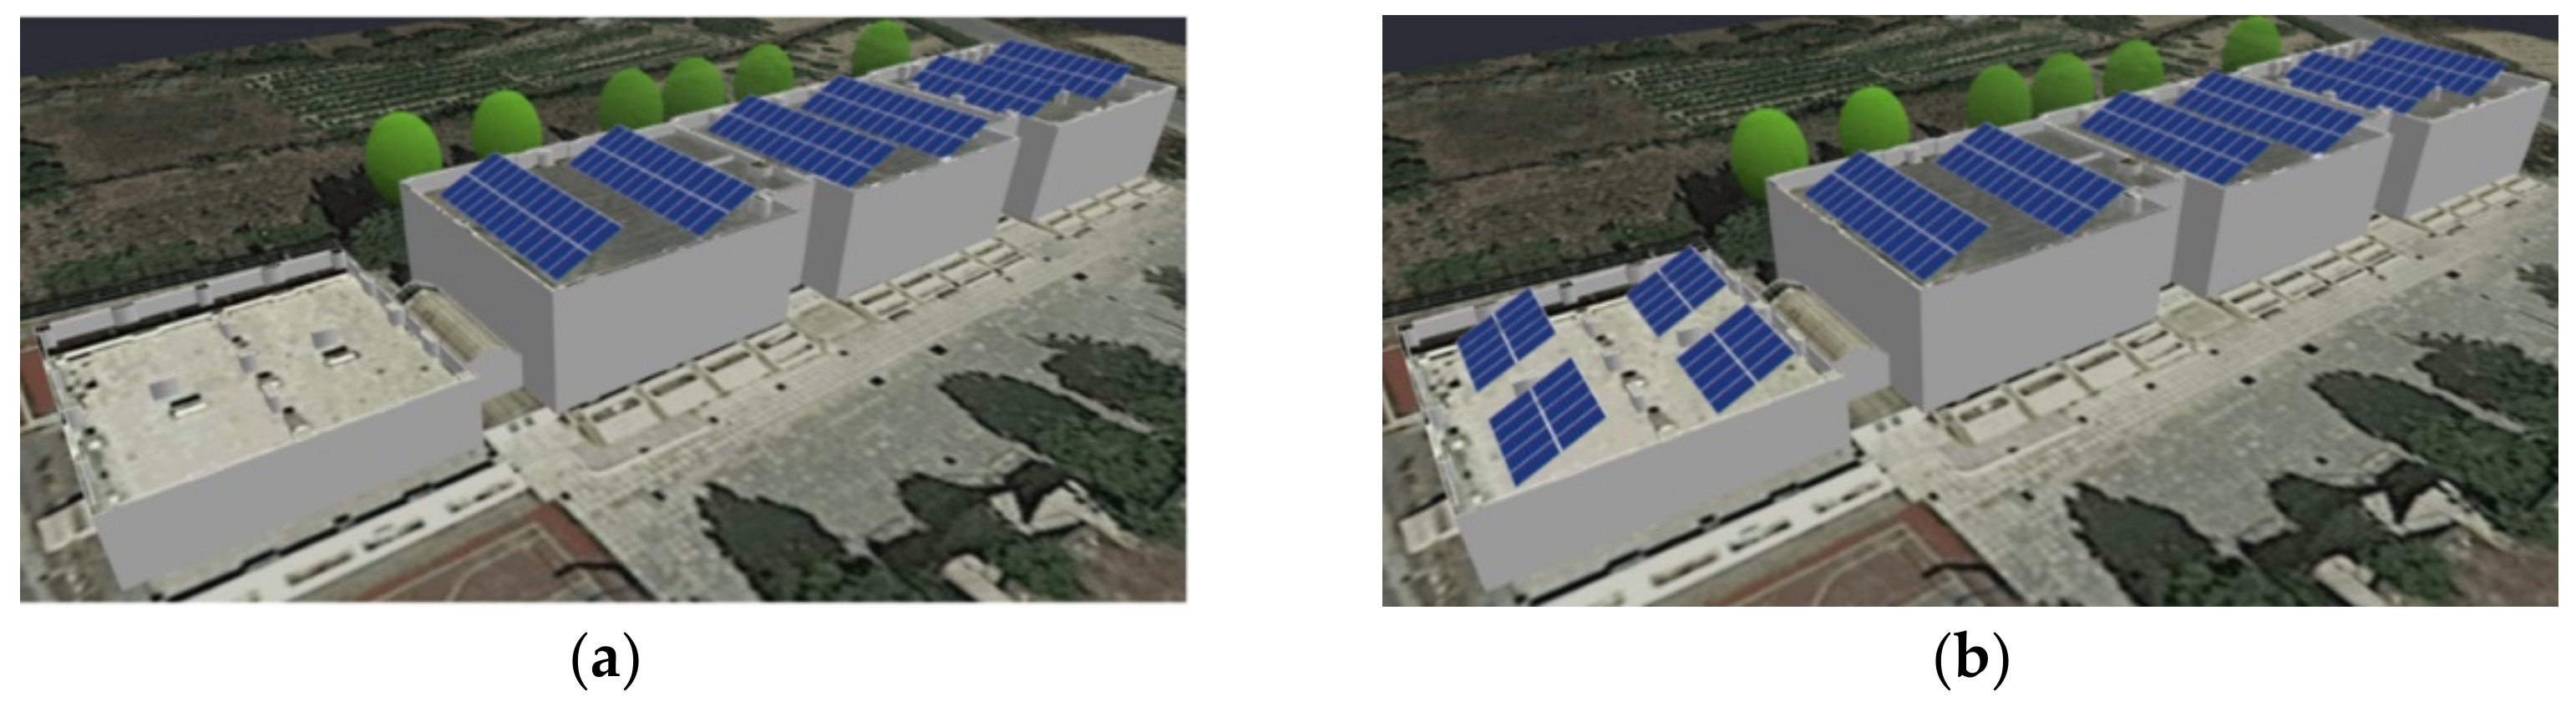
3.1. Overview of PV Plants Scenarios
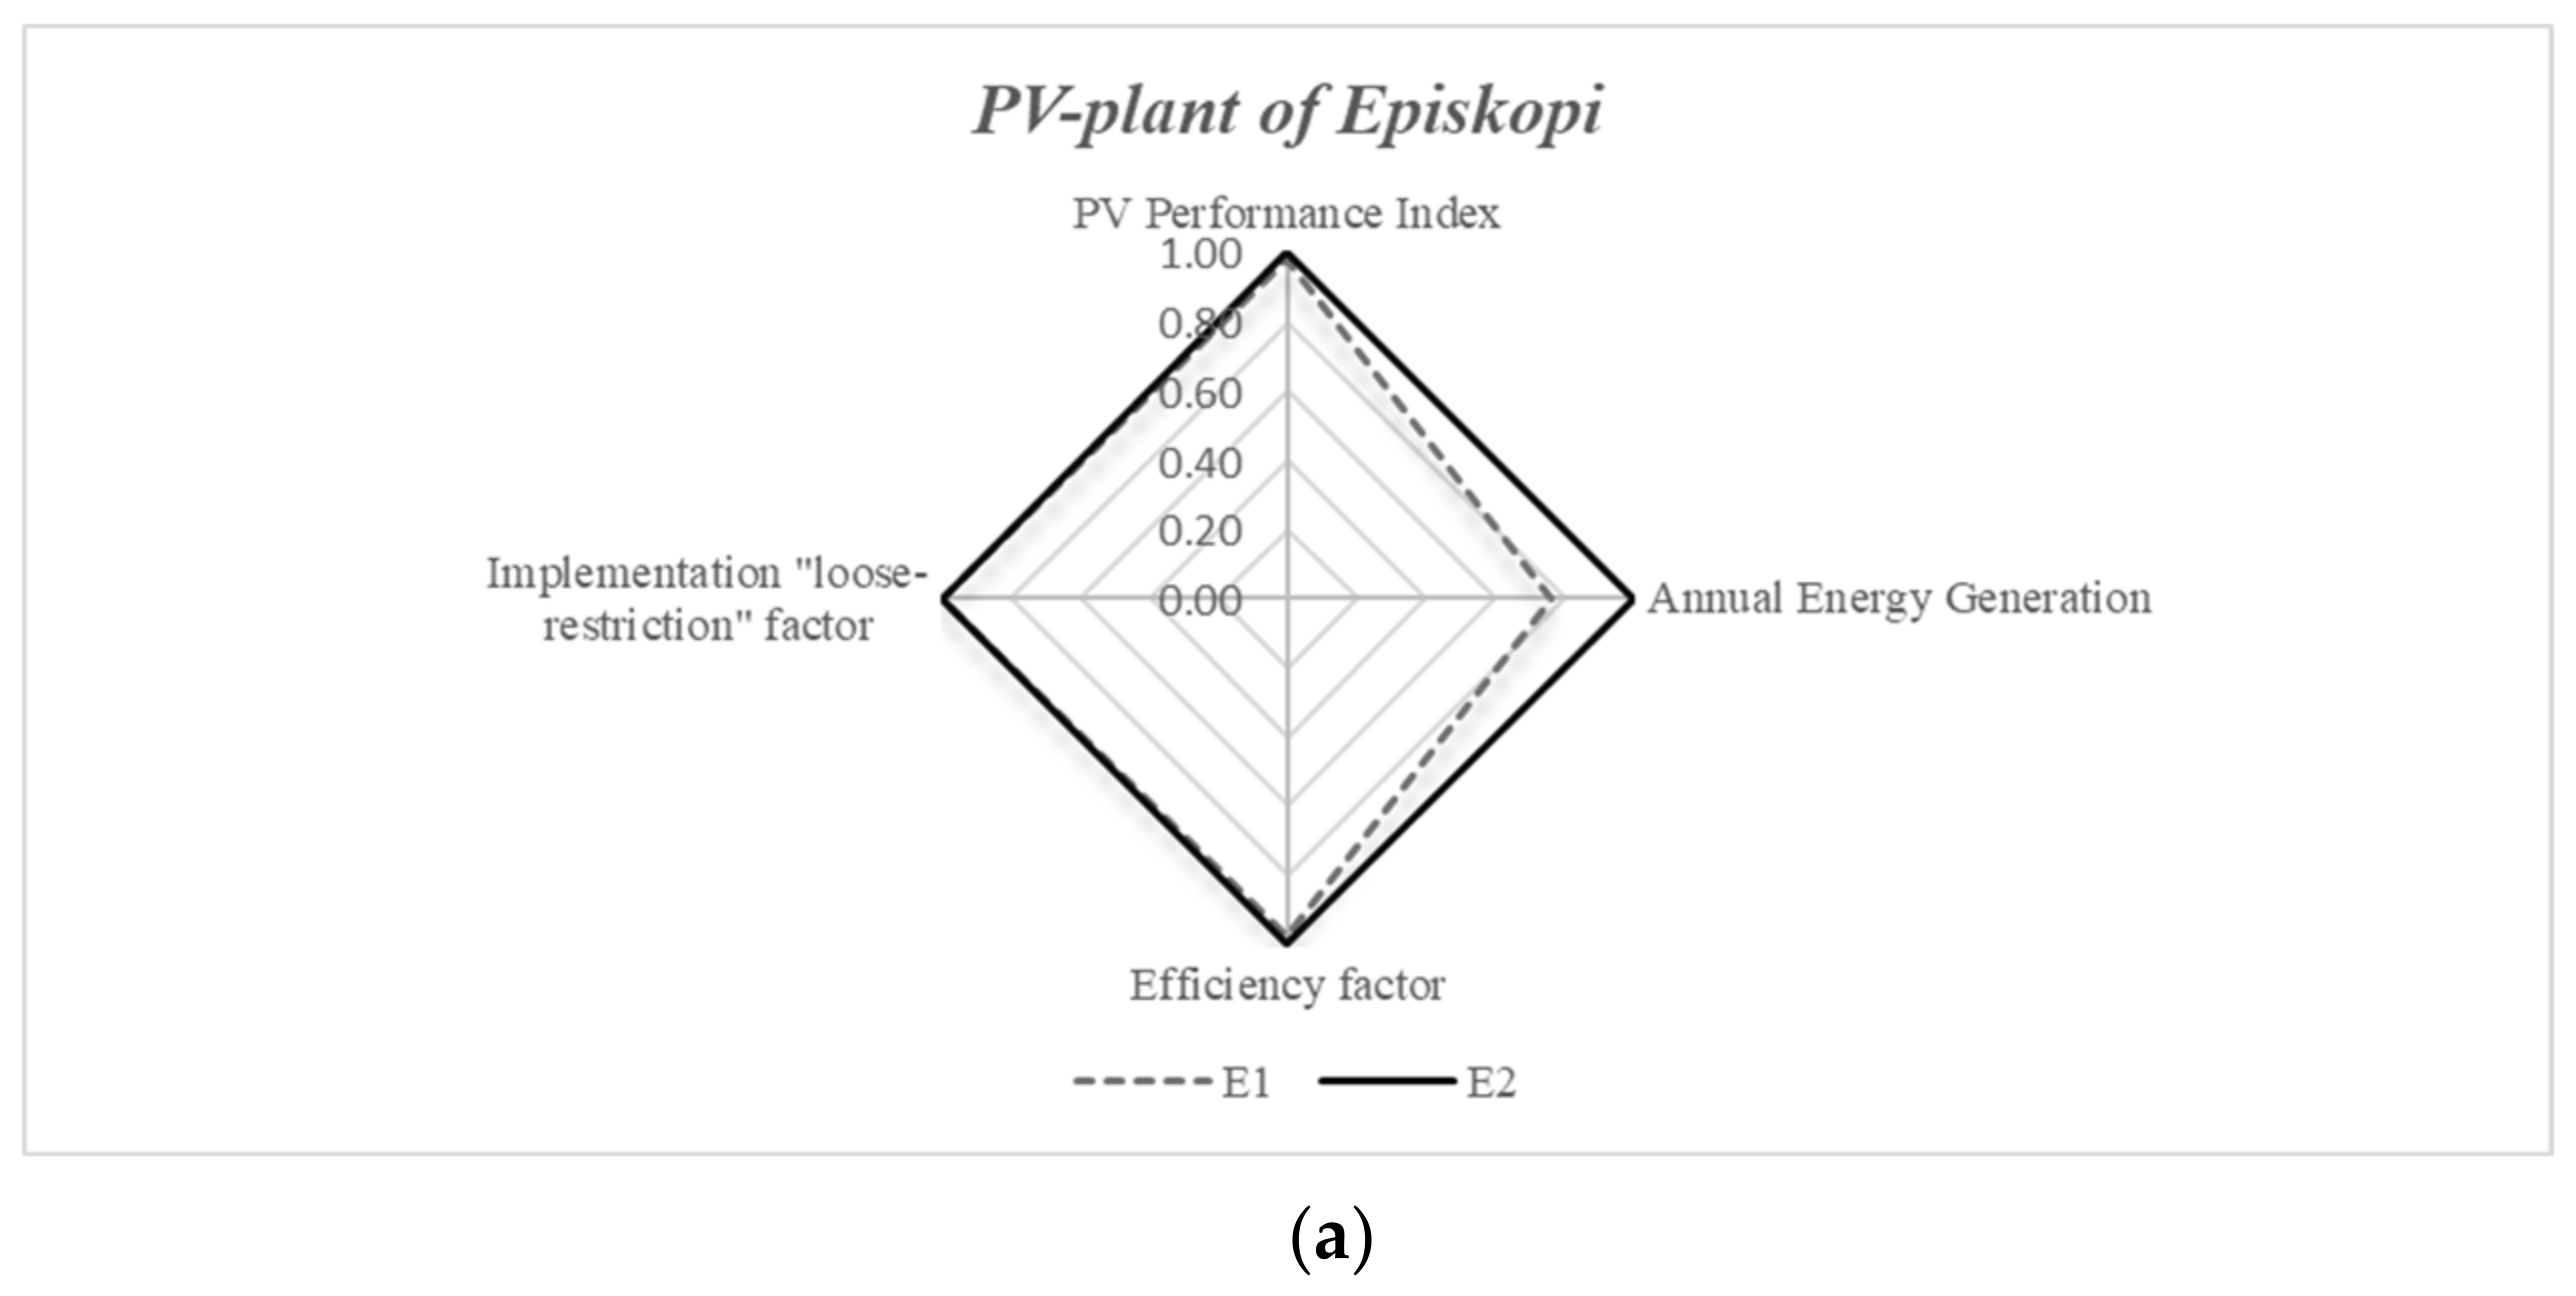
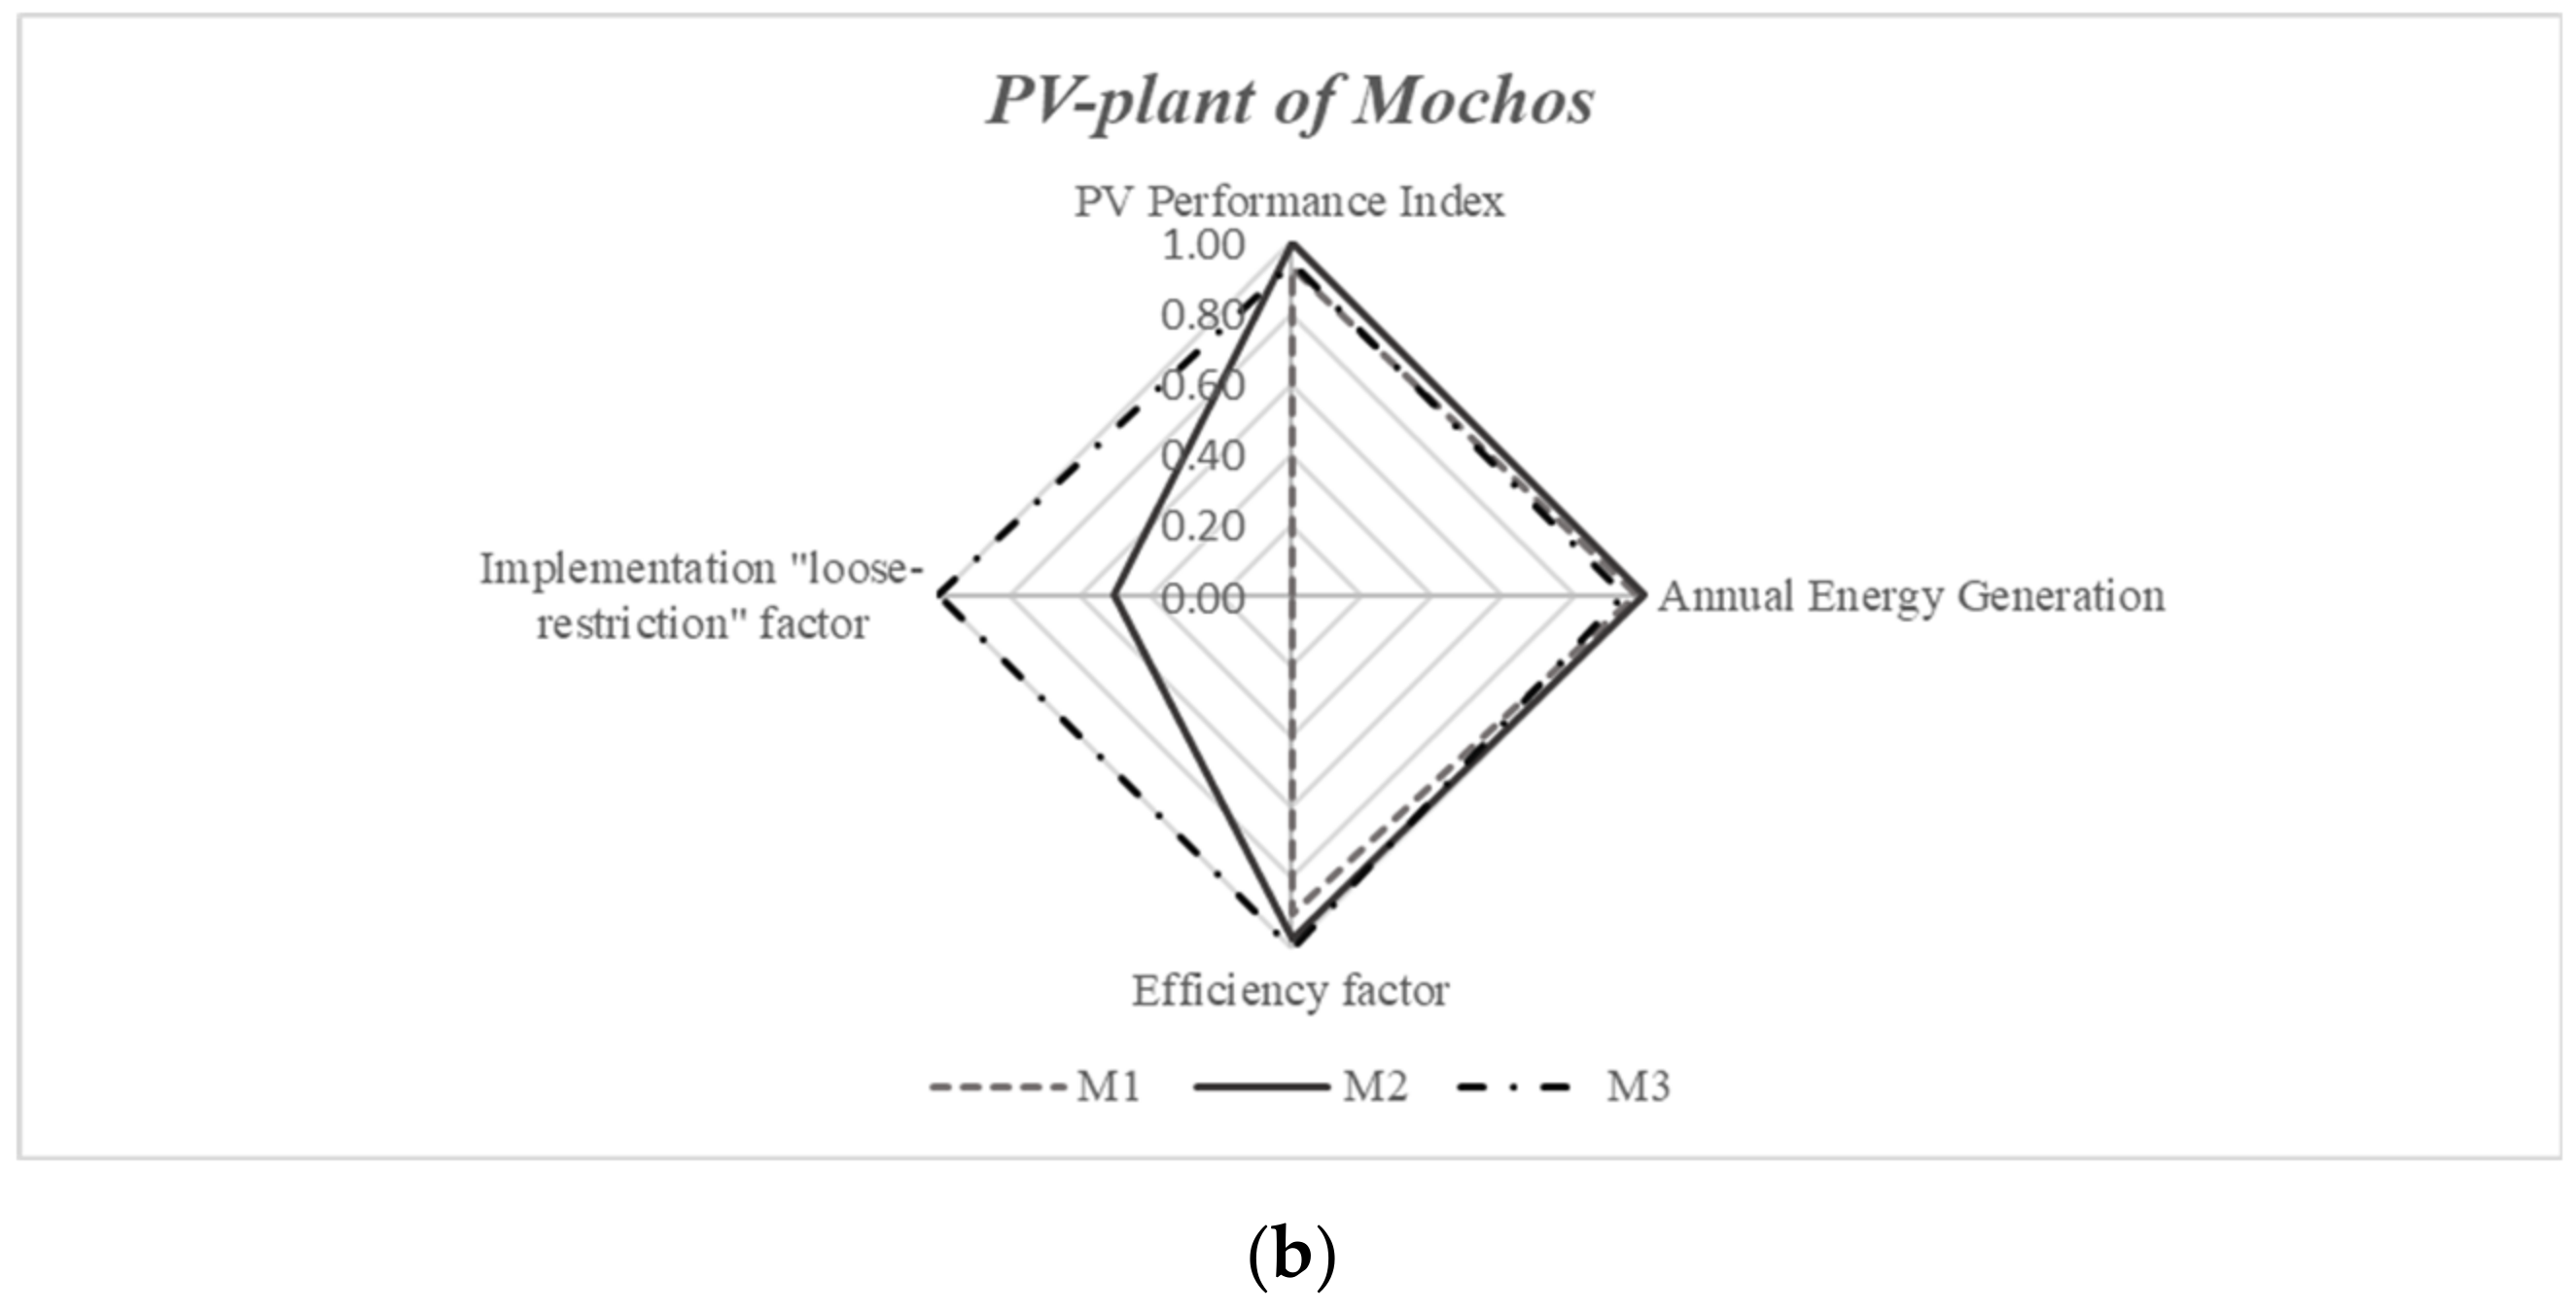
3.2. Selection of PV Plant Projects
- [c1]: The performance index;
- [c2]: The annual energy generation;
- [c3]: The efficiency factor;
- [c4]: The implementation “loose-restriction” factor.
3.3. Qualitative Assessment of Alternative REC Business Models
3.4. Development of the Energy-Sharing Scheme
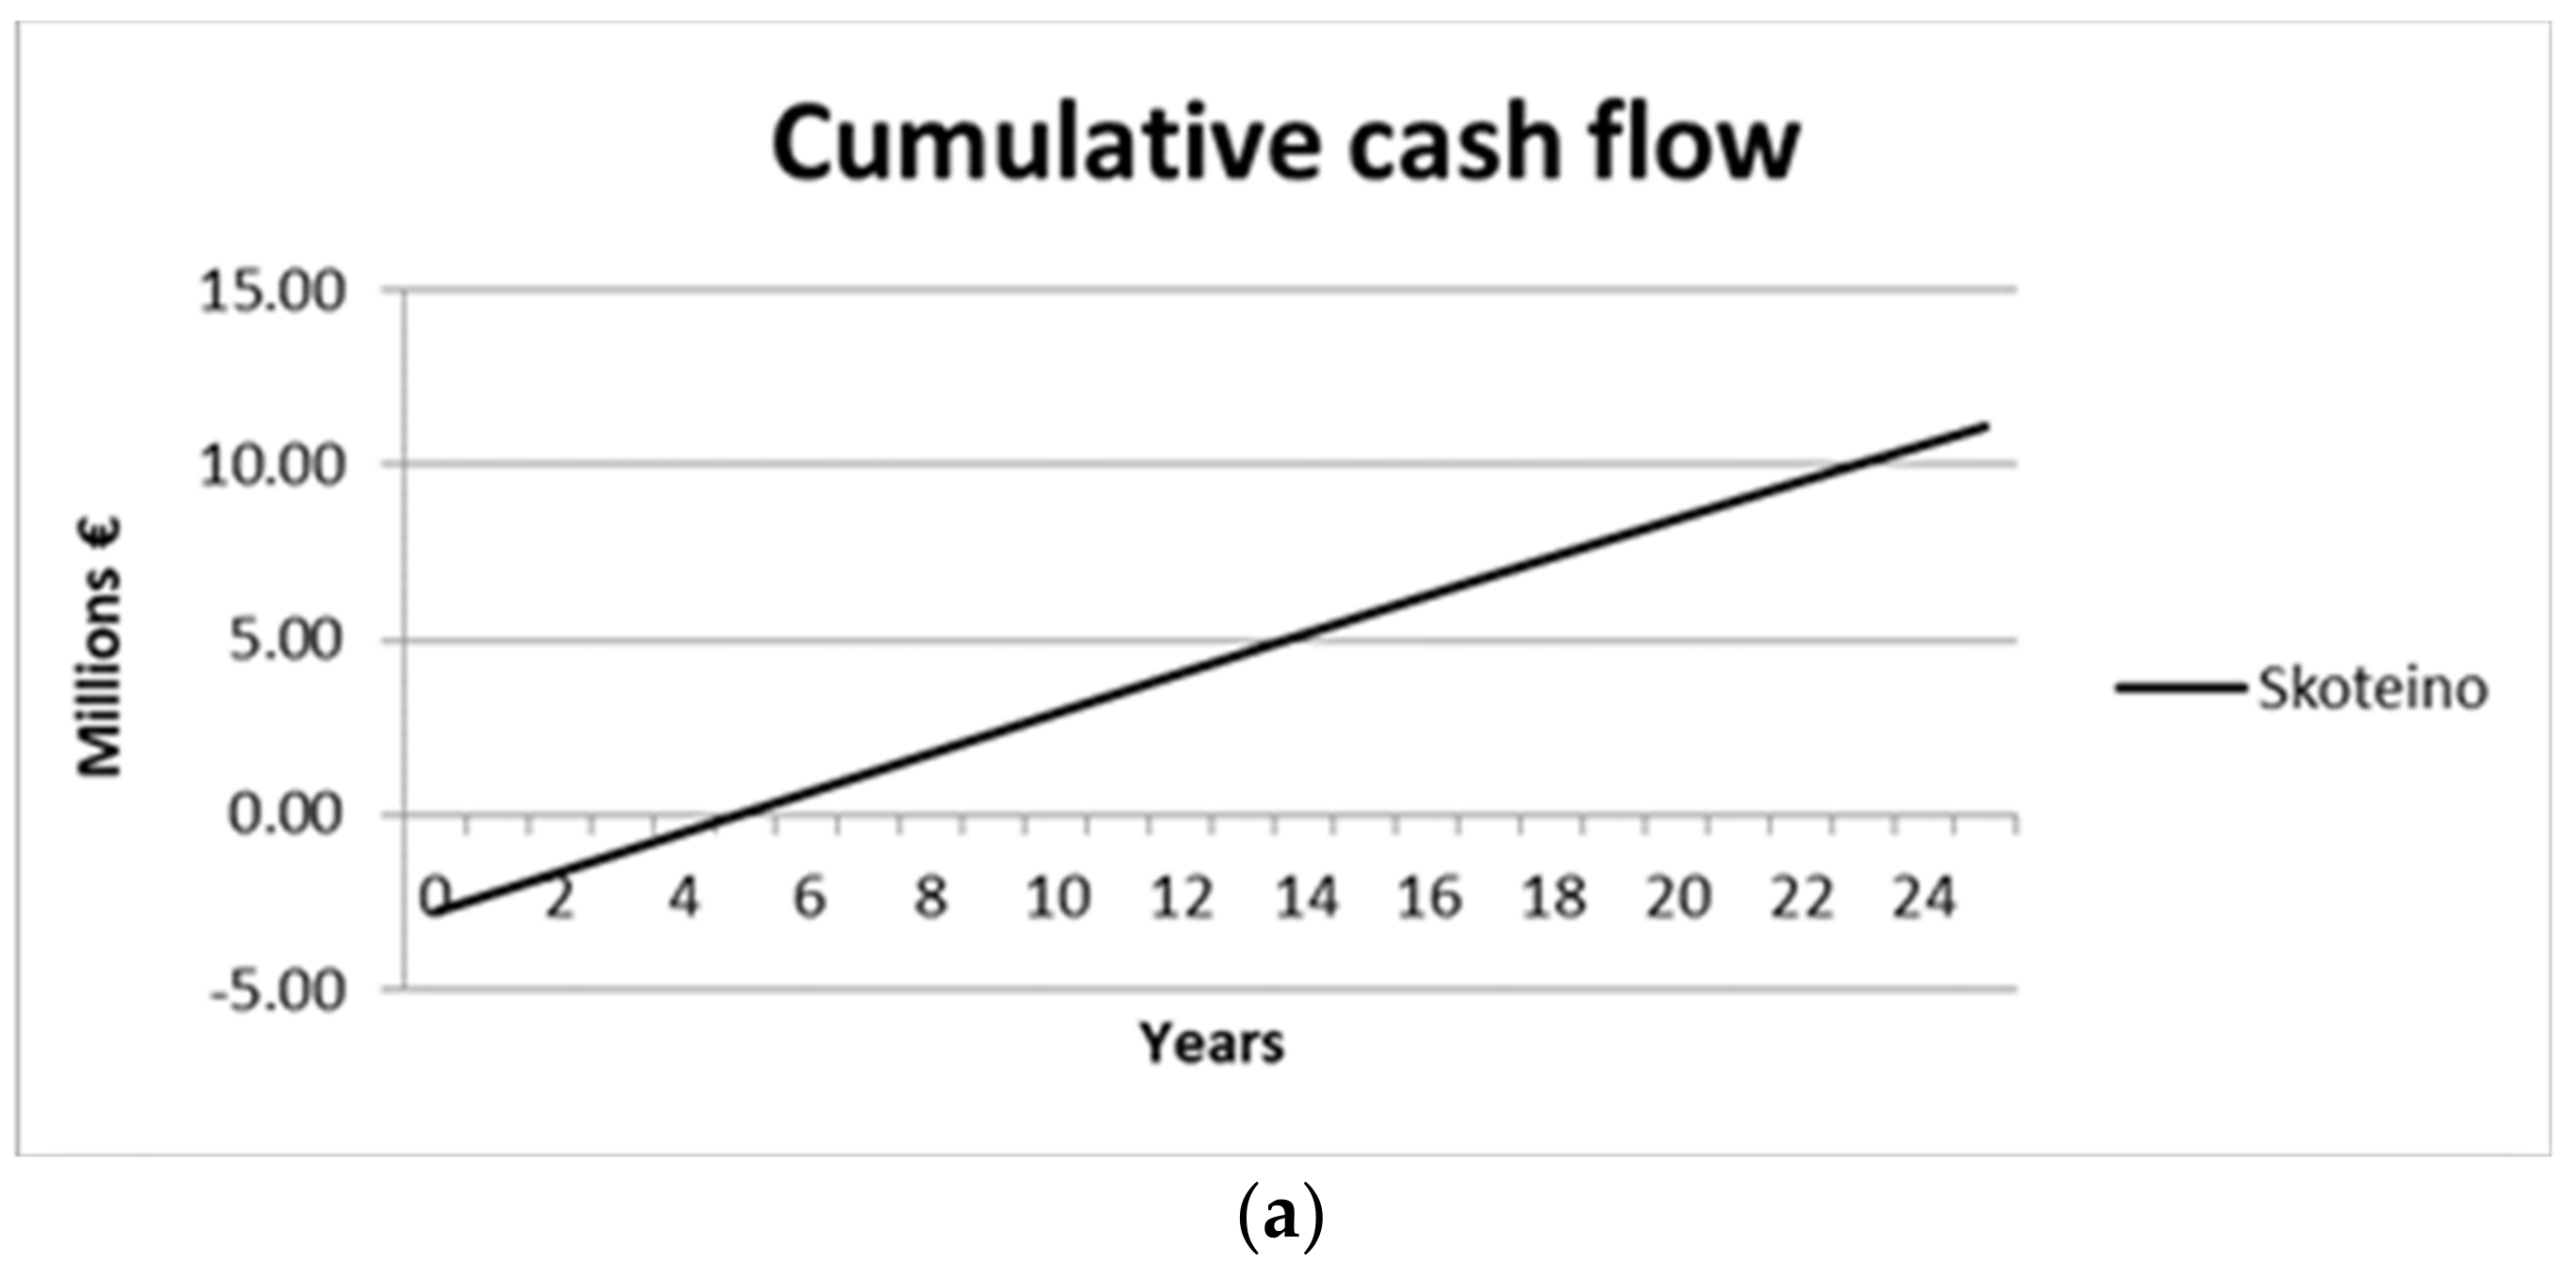
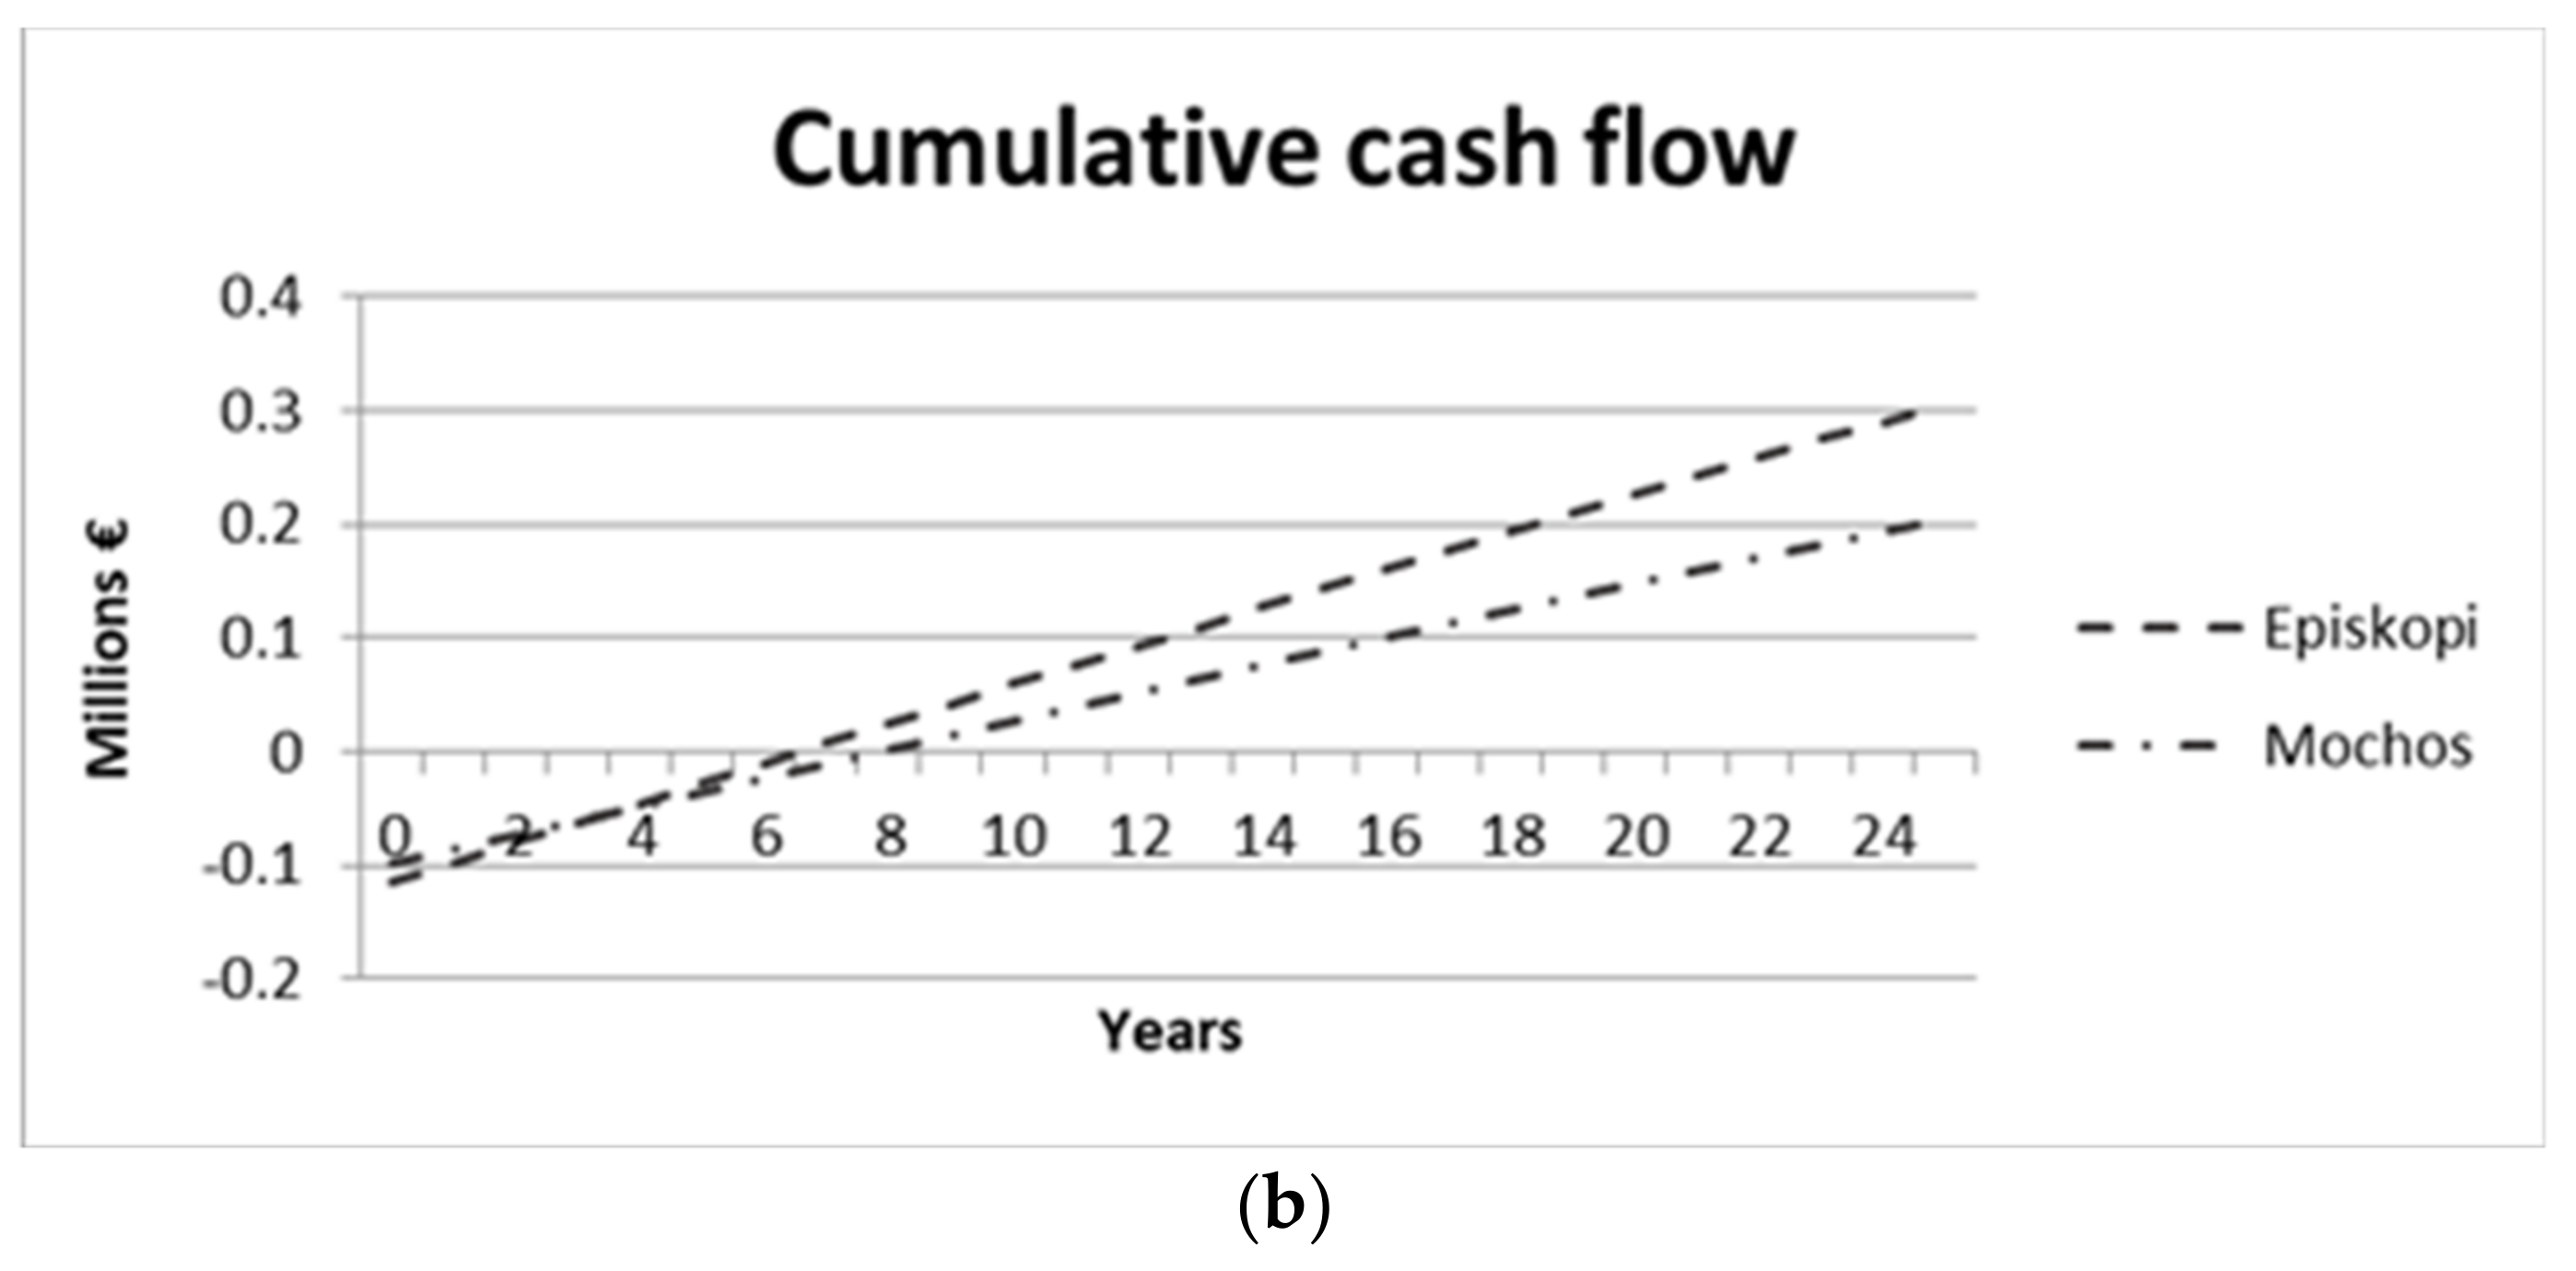
3.5. Techno-Economic Analysis of RES Projects
3.6. Summary of the Proposed Concept, Limitations and Future Work
- The energy-sharing scheme suggested herein could be adopted to precisely determine the cooperative share among REC members.
- Development and testing of optimal and legally acceptable sharing schemes and types of economic benefits allocated to the vulnerable groups of the municipality, accounting for distributing RES-emanated benefits to vulnerable groups without necessarily including them as members of the EC. Special attention shall be paid to the eligibility criteria to identify the vulnerable groups.
- Development of an efficient organization chart with precise competences of the assigned professionals of REC members.
- Definition of long-term impacts through the design of additional projects towards expanding the REC’s activities on the local social, environmental and economic context of the municipality.
- Appropriate monitoring systems ensuring the recording of energy and economic impacts should be envisaged with the PV project installation and operation.
4. Conclusions
Author Contributions
Funding
Institutional Review Board Statement
Informed Consent Statement
Data Availability Statement
Conflicts of Interest
References
- European Commission. Proposal for a Directive of the European Parliament and of the Council Amending Directive (EU) 2018/2001 of the European Parliament and of the Council, Regulation (EU) 2018/1999 of the European Parliament and of the Council and Directive 98/70/EC of the European Parliament and of the Council as Regards the Promotion of Energy from Renewable Sources, and Repealing Council Directive (EU) 2015/652, COM (2021) 557 final ed.; European Commission: Brussels, Belgium, 2021. [Google Scholar]
- European Commission. Proposal for a Directive of the European Parliament and of the Council Proposal on Energy Efficiency (Recast), COM(2021) 558 final ed.; European Commission: Brussels, Belgium, 2021. [Google Scholar]
- Hoicka, C.E.; Lowitzsch, J.; Brisbois, M.C.; Kumar, A.; Ramirez Camargo, L. Implementing a just renewable energy transition: Policy advice for transposing the new European rules for renewable energy communities. Energy Policy 2021, 156, 112435. [Google Scholar] [CrossRef]
- Pons-Seres de Brauwer, C.; Cohen, J.J. Analysing the potential of citizen-financed community renewable energy to drive Europe’s low-carbon energy transition. Renew. Sustain. Energy Rev. 2020, 133, 110300. [Google Scholar] [CrossRef]
- Burke, M.J.; Stephens, J.C. Political power and renewable energy futures: A critical review. Energy Res. Soc. Sci. 2018, 35, 78–93. [Google Scholar] [CrossRef]
- Koirala, B.P.; Koliou, E.; Friege, J.; Hakvoort, R.A.; Herder, P.M. Energetic communities for community energy: A review of key issues and trends shaping integrated community energy systems. Renew. Sustain. Energy Rev. 2016, 56, 722–744. [Google Scholar] [CrossRef] [Green Version]
- Szulecki, K. Conceptualizing energy democracy. Environ. Politics 2018, 27, 21–41. [Google Scholar] [CrossRef] [Green Version]
- Szulecki, K.; Overland, I. Energy democracy as a process, an outcome and a goal: A conceptual review. Energy Res. Soc. Sci. 2020, 69, 101768. [Google Scholar] [CrossRef]
- Doukas, H.; Marinakis, V. Energy poverty alleviation: Effective policies, best practices and innovative schemes. Energy Sources Part B Econ. Plan. Policy 2020, 15, 45–48. [Google Scholar] [CrossRef]
- Lowitzsch, J.; Hoicka, C.E.; van Tulder, F.J. Renewable energy communities under the 2019 European Clean Energy Package—Governance model for the energy clusters of the future? Renew. Sustain. Energy Rev. 2020, 122, 109489. [Google Scholar] [CrossRef]
- Lode, M.L.; Heuninckx, S.; te Boveldt, G.; Macharis, C.; Coosemans, T. Designing successful energy communities: A comparison of seven pilots in Europe applying the Multi-Actor Multi-Criteria Analysis. Energy Res. Soc. Sci. 2022, 90, 102671. [Google Scholar] [CrossRef]
- Hanke, F.; Guyet, R.; Feenstra, M. Do renewable energy communities deliver energy justice? Exploring insights from 71 European cases. Energy Res. Soc. Sci. 2021, 80, 102244. [Google Scholar] [CrossRef]
- Steward, W.C.; Kuska, S. Developing and sustaining creative cities: A sustainability tool for designers, planners, and public administrators. Int. J. Sustain. Dev. 2010, 13, 6–16. [Google Scholar] [CrossRef]
- Hinsch, A.; Rothballer, C.; Russell, L. Municipalities and Renewable Energy Communities—A Perfect Match; COM-RES HORIZON2020 Project; ICLEI: Freiburg im Breisgau, Germany, 2022; Available online: https://come-res.eu/fileadmin/user_upload/Resources/Factsheets_policybriefs/COME-RES-factsheet-2-ENG.pdf (accessed on 9 August 2022).
- Marinakis, V.; Papadopoulou, A.G.; Psarras, J. Local communities towards a sustainable energy future: Needs and priorities. Int. J. Sustain. Energy 2017, 36, 296–312. [Google Scholar] [CrossRef]
- Reis, I.F.G.; Gonçalves, I.; Lopes, M.A.R.; Antunes, C.H. A multi-agent system approach to exploit demand-side flexibility in an energy community. Util. Policy 2020, 67, 101114. [Google Scholar] [CrossRef]
- Guo, Y.; Zeman, A.; Li, R. Utility simulation tool for automated energy demand side management. Agent Technol. Energy Syst. ATES 2010, 6, 8. [Google Scholar]
- Ramchurn, S.D.; Vytelingum, P.; Rogers, A.; Jennings, N.R. Agent-based homeostatic control for green energy in the smart grid. ACM Trans. Intell. Syst. Technol. 2011, 2, 35. [Google Scholar] [CrossRef]
- Kyriakarakos, G.; Papadakis, G. Polygeneration Microgrids for Residential Applications. In Handbook of Clean Energy Systems; John Wiley & Sons, Ltd.: Hoboken, NJ, USA, 2015. [Google Scholar] [CrossRef]
- Casalicchio, V.; Manzolini, G.; Prina, M.G.; Moser, D. From investment optimization to fair benefit distribution in renewable energy community modelling. Appl. Energy 2022, 310, 118447. [Google Scholar] [CrossRef]
- Ghiani, E.; Giordano, A.; Nieddu, A.; Rosetti, L.; Pilo, F. Planning of a Smart Local Energy Community: The Case of Berchidda Municipality (Italy). Energies 2019, 12, 4629. [Google Scholar] [CrossRef] [Green Version]
- Chronis, A.-G.; Palaiogiannis, F.; Kouveliotis-Lysikatos, I.; Kotsampopoulos, P.; Hatziargyriou, N. Photovoltaics Enabling Sustainable Energy Communities: Technological Drivers and Emerging Markets. Energies 2021, 14, 1862. [Google Scholar] [CrossRef]
- Vasilakis, A.; Vrettos, C.; Kitsikopoulos, D.; Kontolati, A.; Koukoufikis, G.; Margosi, M.; Palaiogiannis, F. Mapping of Energy Communities in Greece, Deliverable 1.1-Version 1.2; HP1AB-00256. 2020. Available online: http://electraenergy.coop/wp-content/uploads/2021/05/DRAFT-Mapping-of-energy-communities-in-Greece.pdf (accessed on 9 August 2022).
- Katsaprakakis, D.A.; Voumvoulakis, M. A hybrid power plant towards 100% energy autonomy for the island of Sifnos, Greece. Perspectives created from energy cooperatives. Energy 2018, 161, 680–698. [Google Scholar] [CrossRef]
- Tsantopoulos, G.; Arabatzis, G.; Tampakis, S. Public attitudes towards photovoltaic developments: Case study from Greece. Energy Policy 2014, 71, 94–106. [Google Scholar] [CrossRef]
- Buerhop, C.; Fecher, F.W.; Pickel, T.; Häring, A.; Adamski, T.; Camus, C.; Hauch, J.; Brabec, C.J. Verifying defective PV-modules by IR-imaging and controlling with module optimizers. Prog. Photovolt. Res. Appl. 2018, 26, 622–630. [Google Scholar] [CrossRef]
- Jafarinejad, S.; Beckingham, L.E.; Kathe, M.; Henderson, K. The Renewable Energy (RE) Industry Workforce Needs: RE Simulation and Analysis Tools Teaching as an Effective Way to Enhance Undergraduate Engineering Students’ Learning. Sustainability 2021, 13, 11727. [Google Scholar] [CrossRef]
- Wang, J.-J.; Jing, Y.-Y.; Zhang, C.-F.; Zhao, J.-H. Review on multi-criteria decision analysis aid in sustainable energy decision-making. Renew. Sustain. Energy Rev. 2009, 13, 2263–2278. [Google Scholar] [CrossRef]
- Heinrich Böll Foundation—Greece. Building Energy Communities: Energy in the Hands of Citizens; Heinrich Böll Foundation: Thesaloniki, Greece, 2020; Available online: https://gr.boell.org/sites/default/files/2020-02/BOLL_ENERGY_coverLOW-Final2020.pdf (accessed on 9 August 2022).
- Bertoldi, P.; Andreanidou, K.; Dallemand, J.; Follador, M.; Glancy, R.; Hernandez Gonzalez, Y.; Iancu, A.; Kilkis, S.; Kona, A.; Labanca, N.; et al. Guidebook ‘How to Develop a Sustainable Energy and Climate Action Plan (SECAP)’; Publications Office of the European Union: Luxembourg, 2018. [Google Scholar] [CrossRef]
- Gašparović, I.; Gašparović, M. Determining Optimal Solar Power Plant Locations Based on Remote Sensing and GIS Methods: A Case Study from Croatia. Remote Sens. 2019, 11, 1481. [Google Scholar] [CrossRef]
- Global Solar Atlas. Available online: https://globalsolaratlas.info/ (accessed on 9 August 2022).
- CAN Europe. Engaging Citizens and Local Communities in the Solar Revolution—Rooftop Solar PV Country Comparison Report. 2022. Available online: https://caneurope.org/content/uploads/2022/05/Rooftop-Solar-PV-Country-Comparision-Report-2.pdf (accessed on 9 August 2022).
- Technical Chamber of Greece. Analytical National Specifications of Parameters for the Calculation of the Energy Performance of Buildings and Issuance of the Energy Performance Certificate Τ.O.Τ.Ε.Ε. 20701-1/2017; Technical Chamber of Greece: Athens, Greece, 2017; Available online: http://portal.tee.gr/portal/page/portal/SCIENTIFIC_WORK/GR_ENERGEIAS/kenak/files/TOTEE_20701-1_2017_TEE_1st_Edition.pdf (accessed on 9 August 2022).

| PoDs’ Bundles Considered | Number of PoDs | 3-Year Averaged Annual Electricity Consumption (kWh) | Description |
|---|---|---|---|
| G21 | 259 | 1,289,504.00 | Commercial-use invoice targeted to low voltage (V ≤ 25 kVA) PoDs (e.g., offices, shops, small-scale industries). |
| G22 | 36 | 804,344.00 | Commercial-use invoice targeted to low voltage (25 kVA < V ≤ 250 kVA) PoDs (e.g., office buildings, large shops, medium-scale industries). |
| G23 | 1 | 2683.00 | Commercial-use invoice targeted to low voltage (V ≤ 250 kVA) PoDs. The charging policy is higher during the daytime and lower at night. |
| SL | 312 | 1,927,483.00 | Invoice targeted specifically for street, park and national road lighting. |
| AGR | 49 | 3,535,571.00 | Invoice targeted to PoDs with agricultural use. |
| BGE | 1 | 214,900.00 | Commercial-use invoice targeted to medium voltage PoDs (V > 250 kVA) (e.g., large buildings, buildings complexes, medium- or large-scale industries) |
| Total | 658 | 7,774,485.00 | - |
| No. | Location | Geographical Coordinates (Latitude, Longitude) | Site | Site Area (m2) | Technical Parameters | Institutional Parameters | Approach Required | ||
|---|---|---|---|---|---|---|---|---|---|
| Site Slope (%) | Feasible on-Site PV South Orientation (Yes or No) | Environmental and/or Land-Use | Other Legislative Restrictions | ||||||
| 1 | Episkopi village | 35°15′37.49″ Β 25°14′1.07″ A | Rooftop of the 2-floor high school building | 1063 | 0 | Yes | No restrictions | No restrictions | Open to practice alternative PV installation scenarios. |
| 2 | Mochos village | 35°15′32.15” Β 25°25′42.12″ A | Rooftop of the 2-floor high school building | 855 | 0 | Yes | No restrictions | Possible restrictions due to proximal archaeological church | Open to practice alternative PV installation scenarios considering possible restrictions due to station’s visibility from the church |
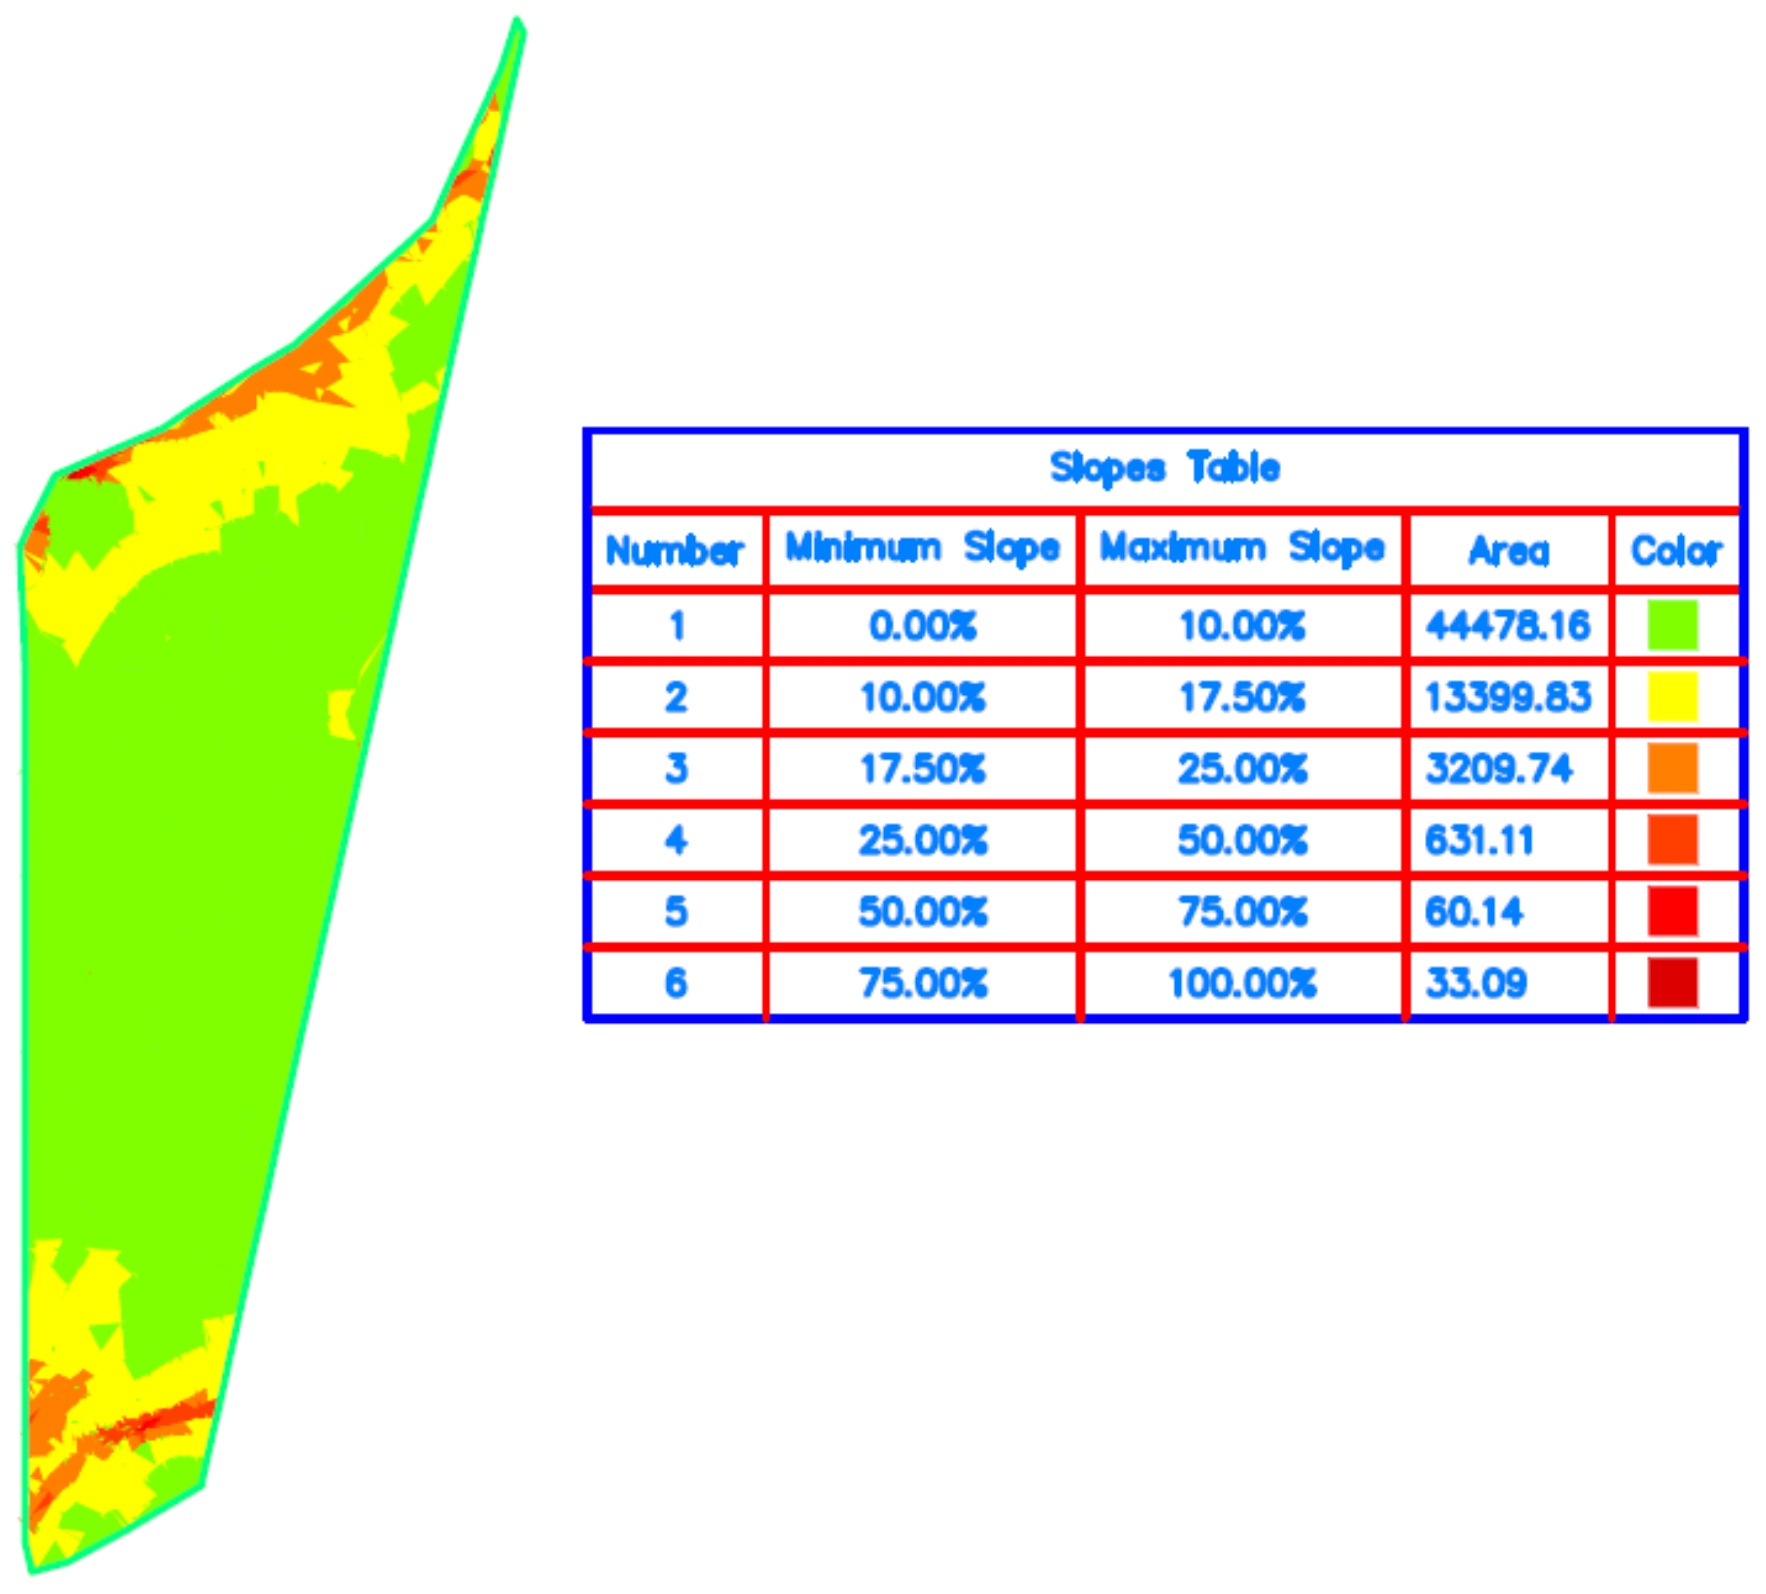
| 3 | Skoteino Cave | 35°18′31.60″ Β 25°17′26.29″ A | Land parcel | 425,170 | irregular | Yes | Multiple restricted areas within the site area | Initially, the legally/institutionally restricted areas are excluded. The identified eligible area is further subjected to extensive slope analysis. | |
| Intervention Site | Weather Data | |||
|---|---|---|---|---|
| Elevation–Sea Level (m) | Average Annual Wind Speed (m/s) | Average Annual Ambient Temperature (°C) | Contours of Annual Global Solar Irradiance on Horizontal Plane (kWh/m2/Year) | |
| Episkopi | 336 | 4.5 | 18.9 | ~1870 at all sites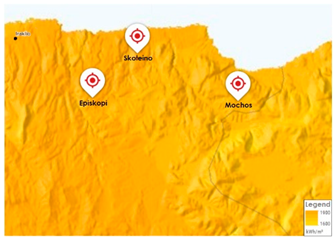 |
| Mochos | 394 | 4.6 | 17.6 | |
| Skoteino | 229 | 4.6 | 18.5 | |
| PV Plant | Scenario (Refer also to Figure 4, Figure 5 and Figure 6) | Number of Modules | Module Area (m2) | Module Gradience (°) | Orientation (Azimuth, °) | String Height (m) | Installed Power (kWp) |
|---|---|---|---|---|---|---|---|
| Episkopi | E1 | 136 | 351.50 | 25 | 180 | 2.31 | 73.44 |
| E2 | 176 | 454.90 | 25 | 180 | 2.31 | 95.04 | |
| Mochos | M1 | 160 | 413.50 | 25 | 233 | 2.31 | 86.40 |
| M2 | 152 | 392.83 | 25 | 143 | 2.31 | 82.08 | |
| M3 | 152 | 392.83 | 0 | 143 | 0.44 | 82.08 | |
| Skoteino | N/A | 5086 | 13,148.20 | 25 | 180 | 2.31 | 2750.00 |
| Criterion | Description | Weight Value in Equation (1) | Comment |
|---|---|---|---|
| c1 | Performance index (kWh/kWp): the ratio of produced energy per unit of installed power. | 0.20 | Technical criteria are proportional; hence, the same bias is imposed. |
| c2 | Annual energy generation (MWh): total energy generated from the PV plant each year. | 0.20 | |
| c3 | Efficiency factor (%): the ratio of annual energy production versus the local solar energy gain. | 0.20 | |
| c4 | Implementation “loose-restriction” factor: estimated implementation difficulty of the RES projects. | 0.40 | It receives values: 0—highly restricted, 0.5— medium restricted and 1—least restricted, reflecting the easiness to implement the project in terms of technical or institutional restrictions. It is considered of the highest importance, as it ultimately defines the feasibility of a project to take place. |
| PV Plant | Scenario (i) | Criteria Absolute Values | Criteria Normalized Values (Based on Equation (2)) | Objective Function Fi (Based on Equation (1)) | ||||||
|---|---|---|---|---|---|---|---|---|---|---|
| c1 (kWh/kWp) | c2 (MWh) | c3 (%) | c4 | C1 | C2 | C3 | C4 | |||
| Episkopi | E1 | 1783 | 130.95 | 18.06 | 1.00 No restrictions identified | 0.98 | 0.76 | 0.98 | 1.00 | 0.95 |
| E2 | 1812 | 172.21 | 18.35 | 1.00 No restrictions identified | 1.00 | 1.00 | 1.00 | 1.00 | 1 | |
| Mochos | M1 | 1649 | 142.50 | 16.70 | 0.00 PV plant viewing restriction from the nearby archaeological. Technical restriction: the existing rooftop outlet vents block the placement of 12 PV modules. | 0.93 | 0.98 | 0.90 | 0.00 | 0.56 |
| M2 | 1779 | 146.02 | 18.02 | 0.50 PV plant viewing restriction from the nearby archaeological site. The previous technical restriction is eliminated through alternative module placement. | 1.00 | 1.00 | 0.97 | 0.50 | 0.8 | |
| M3 | 1667 | 136.72 | 18.61 | 1.00 No restrictions identified; previous archaeological restrictions counter-balanced by placing the modules at a zero angle | 0.94 | 0.94 | 1.00 | 1.00 | 0.98 | |
| Skoteino | N/A | 1824 | 5010.00 | 18.47 | 1.00 | 1.00 | 1.00 | 1.00 | 1.00 | 1.00 |
| Month | Solar Energy Production (MWh) | ||
|---|---|---|---|
| Episkopi | Mochos | Skoteino | |
| January | 9.49 | 6.24 | 292 |
| February | 9.75 | 6.79 | 287 |
| March | 13.72 | 10.27 | 397 |
| April | 16.99 | 13.85 | 488 |
| May | 18.10 | 16.00 | 518 |
| June | 18.57 | 16.98 | 531 |
| July | 19.68 | 17.81 | 561 |
| August | 18.78 | 15.88 | 537 |
| September | 15.01 | 11.70 | 432 |
| October | 12.21 | 8.53 | 356 |
| November | 10.74 | 6.85 | 324 |
| December | 9.16 | 5.82 | 287 |
| Total | 172.21 | 136.72 | 5010 |
| Strengths | Weaknesses |
|---|---|
| Innovative RES-based services provided by the EC. Supportive actions for members (energy sharing, lower carbon footprint, etc.) Easy access to mature technologies in the energy field. Implementation of the virtual energy-sharing scheme, resulting in energy cost savings for beneficiaries, regardless of their membership status. High conspicuous feature marked by strengthening of the decentralized energy production, local energy autonomy and security. Contribution to the EU goals regarding climate change mitigation and the energy transition Exclusion from rivalry present in the energy supply market and subsequent elimination of the need for market research. Examination priority, granted by the Regulatory Agency for Energy (RAE), concerning the licensing of RES plants of the EC. Ease of management and decision-making stemming from the small number of members and subsequent participants in its general assembly. Lower guarantee defrayment granted by RAE. | Limited motivation arising from the non-profitable aspect and the exclusion of physical persons from membership. Potential operational problems such as the intermittent energy production, the lack of storage and control systems, etc. Potential organization frailty, particularly in the case of understaffing (lack of skilled employees). |
| Opportunities | Threats |
| Accentuate Hersonissos as a “green” municipality. Strengthening the environmental sensitization of citizens in the municipality of Hersonissos. Contribution to the targets outlined in the SECAP. RES development-favorable legal framework. Precedence in funding because of the maturity of sustainable development, stemming from the management of the EC. Reinforced policy promotion regarding the alleviation of energy poverty, e.g., through energy sharing with vulnerable households, taking advantage of the Greek legal provision to share energy among vulnerable or low-income houses without obligatory membership in the REC, or distribute benefits induced by energy cost reduction; for example, less municipal utilities’ taxation. Promotion of policies to strengthen local energy production. Satiation of future needs for products and services by members of the EC (e.g., energy cost savings, dual role of producers and consumers–prosumers). Upward trend in improving the margins of energy efficiency in end-user consumption throughout the technological progress of the EC. High prospects of technological growth (e.g., new materials, improved means of production, storage and distribution of energy). | Potential resistance by portions of society caused by the lack of information concerning the environmental benefits of ECs’ activities. Changes in legislation (e.g., increased taxation, additional approvals for licensing). Potential abandoning of the EC endeavor, caused by the lack of interest of its members due to the lack of tangible profits. |
| Strengths | Weaknesses |
|---|---|
| Innovative RES-based services provided by the EC. Supportive actions for members (energy sharing, lower carbon footprint, etc.). Easy access to mature technologies in the energy field. Implementation of the virtual energy-sharing scheme resulting in energy cost savings for beneficiaries, regardless of their membership status. High conspicuous feature marked by strengthening of the decentralized energy production, local energy autonomy and security. Strengthening energy democracy through the inclusion of physical persons as members of the EC. Contribution to the EU goals regarding climate change mitigation and the energy transition. Exclusion from rivalry present in the energy supply market and subsequent elimination of the need for market research. Examination priority, granted by RAE, concerning the licensing of RES plants of the EC. Lower guarantee defrayment granted by RAE. | Limited motivation arising from the non-profitable aspect of the EC. Potential operational problems such as the intermittent energy production, the lack of storage and control systems, etc. Potential organization frailty, particularly in the case of understaffing (lack of skilled employees). Possible lack of education or training in field of RES technology by members. Potential lack of marketing practices and difficulty in attracting new members. Possible underrepresentation of the most vulnerable groups that cannot always respect their financial obligations as active members in the REC. |
| Opportunities | Threats |
| Accentuate Hersonissos as a “green” municipality. Strengthening the environmental sensitization and responsibility of citizens in the municipality of Hersonissos by permitting their entry as members of the EC. Contribution to the achievement of the targets outlined in the SECAP. Potential attraction of new members because of the aversion of consumers from fossil fuel energy suppliers; new members can compensate the ever-increasing cost of energy through energy savings implemented with the virtual energy-sharing mechanism. RES development-favorable legal framework. Reinforced policy promotion regarding local energy production and the alleviation of energy poverty (e.g., through energy sharing with vulnerable household). | Potential threat of prolonged decision-making caused by enlarged discrepancies between members (due to the high number of included members). Increased risk of member secession due to rivalry from energy suppliers. Potential reactions by portions of society caused by the lack of information concerning the environmental benefits deriving from the activities of ECs. Changes in legislation (e.g., increased taxation, additional approvals for licensing). |
| Precedence in funding because of the maturity of sustainable development, stemming from the management of the EC. Satiation of future needs for products and services by members of the EC (e.g., energy cost savings, dual role of producers and consumers–prosumers). Upward trend in improving the margins of energy efficiency in end-user consumption throughout the technological progress of the EC. High prospects of technological growth (e.g., new materials, improved means of production, storage and distribution of energy). |
| Strengths | Weaknesses |
|---|---|
| Innovative RES-based services provided by the EC. Supportive actions for members (e.g., procurement of energy products for members). Easy access to mature technologies in the energy field. Tangible income generated through ECs’ activities. Strengthening of green entrepreneurship, decentralized energy production and local energy autonomy and security. Contribution to the EU goals regarding climate change mitigation and the energy transition. Firm strategic development of the EC (robust economic model derived from the profitable aspect). Examination priority, granted by RAE, concerning the licensing of RES plants of the EC. Lower guarantee defrayment granted by RAE. | Low public acceptance stemming from the for-profit nature of the EC. Imposed limit in the operational support contract (OSC) signed without participation in competitive processes (upper threshold of 18 MW in the Greek context). ECs’ RES plants planned by local authorities of 1st (municipalities) or 2nd (regions) degree are obliged to take part in competitive processes to sign the OSC, regardless of their installed power. Potential operational problems such as the intermittent energy production, the lack of storage and control systems, etc. Potential organization frailty, particularly in the case of understaffing (lack of skilled employees). Possible lack of education or training in field of RES technology by members. Due to the expected high cost of the cooperative share, as a result of possible lack of OSC, excluding vulnerable or low-income groups from the REC. |
| Opportunities | Threats |
| Accentuate Hersonissos as a “green” municipality. Potential attraction of new members because of the aversion of consumers from fossil fuel energy suppliers; new members can compensate the ever-increasing cost of energy by exploiting the economic services offered by the EC. Success of the “green” entrepreneurial model can attract further investors in the field. RES development-favorable legal framework. Promotion of policies to strengthen local energy production and “green” entrepreneurship. Precedence in funding or favorable loaning terms because of the maturity of sustainable development, stemming from the management of the EC and the strengthening of the advocated “green” business model. High prospects of technological growth (e.g., new materials, improved means of production, storage and distribution of energy). | Risk of low energy unit pricing in the OSC due to the competitive process. Potential economic failure due to the misalignment of supply and demand caused by operational problems (e.g., intermittent energy production). Potential danger of prolonged decision-making caused by enlarged discrepancies between members (due to the high number of included members). Increased risk of member secession due to rivalry from energy suppliers. Potential resistance by portions of society caused by the lack of information concerning the environmental benefits of ECs; these reactions could be further encouraged by the for-profit nature of the EC. Changes in legislation (e.g., increased taxation, additional approvals for licensing). |
| PV Plant/ Scenario | PoD Bundle Served | Net Metering (Direct Res-Grid-Connected Pod if Exist) | Virtual Net Metering (Virtually Shared Pods) | ||||||||
|---|---|---|---|---|---|---|---|---|---|---|---|
| No. of RES-connected PoDs | DSO- Agreed Power (kVA) | Generated Energy (kWh) | Annual Energy Consumption Covered (kWh) | Electricity Demand-Satiation Factor (%) | No. of Joined PoDs | DSO-Agreed Power (kVA) | Generated Energy (kWh) | ANNUAL Energy ConsumptionCovered (kWh) | Electricity Demand-Satiation Factor (%) | ||
| Skoteino | G21 | - | 10 | 159 | 263,057 | 263,057 | 100.00 | ||||
| G22 | - | 15 | 1115 | 614,564 | 618,702 | 99.33 | |||||
| SL | - | 23 | 299 | 596,808 | 596,808 | 100.00 | |||||
| AGR | - | 47 | 4205 | 3,535,571 | 3,535,571 | 100.00 | |||||
| Episkopi/Scenario E2 | G21 | 1 | 25 | 24,120 | 24,120 | 100.00 | 1 | 25 | 19,421 | 19,421 | 100.00 |
| SL | - | 7 | 56 | 128,669 | 131,425 | 97.90 | |||||
| Mochos/Scenario M3 | G21 | - | 2 | 33 | 35,130 | 35,130 | 100.00 | ||||
| G22 | 1 | 35 | 21,100 | 21,100 | 100.00 | 1 | 35 | 17,151 | 17,151 | 100.00 | |
| SL | - | 4 | 32 | 63,339 | 68,725 | 92.16 | |||||
| Invoice Component | G21 | G22 | SL | AGR | ||||
|---|---|---|---|---|---|---|---|---|
| Tariff-Based PoDs Bundle 1 | Bundle 1 after PoDs’ Joining | Tariff-Based PoDs Bundle 2 | Bundle 2 after PoDs’ Joining | Tariff-Based PoDs Bundle 3 | Bundle 3 after PoDs’ Joining | Tariff-Based PoDs Bundle 4 | Bundle 4 after PoDs’ Joining | |
| Months of consumption | 12 | - | 12 | - | 12 | - | 12 | - |
| DSO-agreed power (kVA) | 159 | - | 1115 | - | 299 | - | 4.205 | - |
| Total energy consumption (kWh) | 263,057 | 263,057 | 618,702 | 618,702 | 596,808 | 596,808 | 3,535,571 | 3,535,571 |
| Simultaneity factor (%) | - | - | - | - | - | - | - | - |
| mj | 10 | 10 | 15 | 15 | 23 | 23 | 47 | 47 |
| Generated energy (kWh) | - | 263,057 | - | 614,564 | - | 596,808 | - | 3,535,571 |
| Grid-injected energy (kWh) | - | 263,057 | - | 614,564 | - | 596,808 | - | 3,535,571 |
| Self-consumption (kWh) | - | 0 | - | 0 | - | 0 | - | 0 |
| Absorbed energy (kWh) | 263,057 | 263,057 | 618,702 | 618,702 | 596,808 | 596,808 | 3,535,571 | 3,535,571 |
| Charged energy (kWh) | 263,057 | 0 | 618,702 | 4138 | 596,808 | 0 | 3,535,571 | 0 |
| Energy purchase charge (€) | 43,330.057 | 7.200 | 105,297.833 | 17,058.734 | 84,318.266 | 7.2 | 394,011.232 | 7.2 |
| TSO charge (€) | 1448.986 | 1448.986 | 3785.900 | 3785.900 | 3255.891 | 3255.891 | 0 | 0 |
| DSO charge (€) | 5230.223 | 5230.223 | 14,788.138 | 14,788.138 | 12,152.632 | 12,152.632 | 0 | 0 |
| Public utility services charge (€) | 4798.159 | 4798.159 | 11,285.124 | 11,285.124 | 8182.237 | 8182.237 | 24,996.486 | 24,996.486 |
| SFRPGE charge (€) | 4471.969 | 4471.969 | 10,517.934 | 10,517.934 | 10,145.736 | 10,145.736 | 33,199.011 | 33,199.011 |
| Others (€) | 18.413 | 18.413 | 43.309 | 43.309 | 41.776 | 41.776 | 247.489 | 247.489 |
| Excise tax (€) | 578.725 | 578.725 | 1361.144 | 1361.144 | 1312.977 | 1312.977 | 7778.256 | 7778.256 |
| Consumption fee (€) | 277.022 | 60.408 | 682.807 | 241.611 | 546.318 | 124.763 | 2135.167 | 165.147 |
| Total charge without VAT (€) | 60,153.557 | 16,614.086 | 147,762.190 | 59,081.896 | 119,955.836 | 35,223.215 | 462,367.644 | 66,393.592 |
| VAT (€) | 3592.592 | 993.220 | 8824.763 | 3530.417 | 7164.571 | 2105.907 | 27,613.948 | 3973.706 |
| Total charge (€) | 63,746.149 | 17,607.306 | 156,586.953 | 62,612.313 | 127,120.407 | 37,329.122 | 489,981.593 | 70,367.298 |
| (€/kWh) | - | - | - | - | - | - | - | - |
| (€/kWh) | - | - | - | - | - | - | - | - |
| (€/kWh) | 0.242 | - | 0.253 | - | 0.212 | - | 0.138 | - |
| (€/kWh) | - | 0.067 | - | 0.101 | - | 0.063 | - | 0.019 |
| (€/kWh) (based on Equation (5)) | - | - | - | - | ||||
| (€/kWh) (based on Equation (6)) | 0.175 | 0.152 | 0.149 | 0.119 | ||||
| (€/kWh) (based on Equation (4)) | 0.137 | |||||||
| Invoice Component | G21 | G21 | SL | |||
|---|---|---|---|---|---|---|
| Tariff | RES-Connected PoD | Tariff-Based PoDs Bundle 1 | Bundle 1 after PoDs’ Joining | Tariff-Based PoDs Bundle 2 | Bundle 2 after PoDs’ Joining | |
| Months of consumption | 12 | - | 12 | - | 12 | - |
| DSO-agreed power (kVA) | 25 | - | 25 | - | 56 | - |
| Total energy consumption (kWh) | 24,120 | 24,120 | 19,421 | 19,421 | 131,425 | 131,425 |
| Simultaneity factor (%) | - | 60 | - | - | - | - |
| mj | - | - | 1 | 1 | 7 | 7 |
| Generated energy (kWh) | - | 24,120 | - | 19,421 | - | 128,669 |
| Grid-injected energy (kWh) | - | 9648 | - | 19,421 | - | 128,669 |
| Self-consumption (kWh) | - | 14,472 | - | 0 | - | 0 |
| Absorbed energy (kWh) | 24,120 | 9648 | 19,421 | 19,421 | 131,425 | 131,425 |
| Charged energy (kWh) | 24,120 | 0 | 19,421 | 0 | 131,425 | 2756 |
| Energy purchase charge (€) | 3979.523 | 7.200 | 3205.644 | 7.200 | 18,573.609 | 396.540 |
| TSO charge (€) | 138.174 | 62.920 | 113.739 | 113.739 | 711.970 | 711.970 |
| DSO charge (€) | 494.780 | 219.812 | 405.499 | 405.499 | 2649.395 | 2.649.395 |
| Public utility services charge (€) | 439.949 | 439.949 | 354.240 | 354.240 | 1801.836 | 1801.836 |
| SFRPGE charge (€) | 410.040 | 164.016 | 330.157 | 330.157 | 2234.225 | 2234.225 |
| Others (€) | 1.688 | 0.675 | 1.360 | 1.360 | 9.199 | 9.199 |
| Excise tax (€) | 53.064 | 21.226 | 42.730 | 42.730 | 289.135 | 289.135 |
| Consumption fee (€) | 25.536 | 3.759 | 20.620 | 4.623 | 120.175 | 29.290 |
| Total charge without VAT (€) | 5542.754 | 919.556 | 4473.980 | 1259.543 | 26,389.546 | 8121.592 |
| VAT (€) | 331.033 | 54.948 | 267.201 | 75.295 | 1576.162 | 485.538 |
| Total charge (€) | 5873.787 | 974.504 | 4741.182 | 1334.838 | 27,965.709 | 8607.130 |
| (€/kWh) | 0.243 | - | - | - | - | - |
| (€/kWh) | - | 0.040 | - | - | - | - |
| (€/kWh) | - | - | 0.244 | - | 0.212 | - |
| (€/kWh) | - | - | - | 0.069 | - | 0.065 |
| (€/kWh) (based on Equation (5)) | 0.203 | - | - | |||
| (€/kWh) (based on Equation (6)) | - | 0.175 | 0.147 | |||
| (€/kWh) (based on Equation (4)) | 0.156 | |||||
| Invoice Component | G22 | G21 | G22 | SL | ||||
|---|---|---|---|---|---|---|---|---|
| Tariff | RES-Connected PoD | Tariff-Based PoDs Bundle 1 | Bundle 1 after PoDs’ Joining | Tariff-Based PoDs Bundle 2 | Bundle 2 after PoDs’ Joining | Tariff-Based PoDs Bundle 3 | Bundle 3 after PoDs’ Joining | |
| Months of consumption | 12 | - | 12 | - | 12 | - | 12 | - |
| DSO-agreed power (kVA) | 35 | - | 33 | - | 35 | - | 32 | - |
| Total energy consumption (kWh) | 21,100 | 21,100 | 35,130 | 35,130 | 17,151 | 17,151 | 68,725 | 68,725 |
| Simultaneity factor (%) | - | 60 | - | - | - | - | - | - |
| mj | - | - | 2 | 2 | 1 | 1 | 4 | 4 |
| Generated energy (kWh) | - | 21,100 | - | 35,130 | - | 17,151 | - | 63,339 |
| Grid-injected energy (kWh) | - | 8440 | - | 35,130 | - | 17,151 | - | 63,339 |
| Self-consumption (kWh) | - | 12,660 | - | 0 | - | 0 | - | 0 |
| Absorbed energy (kWh) | 21,100 | 8440 | 35,130 | 35,130 | 17,151 | 17,151 | 68,725 | 68,725 |
| Charged energy (kWh) | 21,100 | 0 | 35,130 | 0 | 17,151 | 0 | 68,725 | 5386 |
| Energy purchase charge (€) | 3553.338 | 523.800 | 5792.760 | 7.200 | 2986.340 | 523.800 | 9715.980 | 768.080 |
| TSO charge (€) | 127.570 | 61.738 | 199.506 | 199.506 | 107.035 | 107.035 | 373.690 | 373.690 |
| DSO charge (€) | 496.100 | 255.560 | 715.650 | 715.650 | 421.069 | 421.069 | 1392.815 | 1392.815 |
| Public utility services charge (€) | 384.864 | 384.864 | 640.771 | 640.771 | 312.834 | 312.834 | 942.219 | 942.219 |
| SFRPGE charge (€) | 358.700 | 143.480 | 597.210 | 597.210 | 291.567 | 291.567 | 1168.325 | 1168.325 |
| Others (€) | 1.477 | 0.591 | 2.459 | 2.459 | 1.200 | 1.200 | 4.810 | 4.810 |
| Excise tax (€) | 46.420 | 18.568 | 77.286 | 77.286 | 37.732 | 37.732 | 151.195 | 151.195 |
| Consumption fee (€) | 23.049 | 6.226 | 37.142 | 8.214 | 19.331 | 7.018 | 62.903 | 18.164 |
| Total charge without VAT (€) | 4991.518 | 1394.826 | 8062.784 | 2248.296 | 4177.109 | 1702.256 | 13,811.939 | 4819.299 |
| VAT (€) | 298.108 | 83.316 | 481.538 | 134.404 | 249.466 | 101.714 | 824.942 | 288.068 |
| Total charge (€) | 5289.626 | 1478.142 | 8544.322 | 2382.701 | 4426.576 | 1803.970 | 14,636.881 | 5107.367 |
| (€/kWh) | 0.251 | - | - | - | - | - | - | - |
| (€/kWh) | - | 0.070 | - | - | - | - | - | - |
| (€/kWh) | - | - | 0.243 | - | 0.258 | - | 0.212 | - |
| (€/kWh) | - | - | - | 0.068 | - | 0.105 | - | 0.074 |
| (€/kWh) (based on Equation (5) | 0.181 | - | - | - | ||||
| (€/kWh) (based on Equation (6)) | - | 0.175 | 0.153 | 0.138 | ||||
| (€/kWh) (based on Equation (4)) | 0.155 | |||||||
| Techno-Economic Factor | PV Plant | ||
|---|---|---|---|
| Skoteino | Episkopi | Mochos | |
| Performance index (kWh/kWp) | 1821.81 | 1812 | 1667 |
| Installed power (kWp) | 2750.00 | 95.04 | 82.08 |
| Capital cost (€) | 2,750,000.00 | 114,048.00 | 98,496.00 |
| Lifetime (years) | 25 | 25 | 25 |
| Guarantee period (years) | 12 | 12 | 12 |
| Annual losses (%) | 0.5 | 0.5 | 0.5 |
| Discount rate (%) | 8 | 8 | 8 |
| (€/kWh) | 0.137 | 0.156 | 0.155 |
| Revenues (€/year) in the guarantee period | 686,366.92 | 26,865.15 | 21,208.24 |
| OpExs (€/year) | 121,705.04 | 9600.01 | 8673.72 |
| Net income (€/year) in the guarantee period | 564,661.88 | 17,265.14 | 12,534.52 |
| Economic Indicator | PV Plant | ||
|---|---|---|---|
| Skoteino | Episkopi | Mochos | |
| IRR (%) | 20.27 | 14.53 | 11.83 |
| NPV (€) | 3,213,654.00 | 67,749.00 | 33,330.00 |
| PbP (years) | 4.9 | 6.6 | 7.9 |
Publisher’s Note: MDPI stays neutral with regard to jurisdictional claims in published maps and institutional affiliations. |
© 2022 by the authors. Licensee MDPI, Basel, Switzerland. This article is an open access article distributed under the terms and conditions of the Creative Commons Attribution (CC BY) license (https://creativecommons.org/licenses/by/4.0/).
Share and Cite
Efthymiou, E.N.; Yfanti, S.; Kyriakarakos, G.; Zervas, P.L.; Langouranis, P.; Terzis, K.; Stavrakakis, G.M. A Practical Methodology for Building a Municipality-Led Renewable Energy Community: A Photovoltaics-Based Case Study for the Municipality of Hersonissos in Crete, Greece. Sustainability 2022, 14, 12935. https://doi.org/10.3390/su141912935
Efthymiou EN, Yfanti S, Kyriakarakos G, Zervas PL, Langouranis P, Terzis K, Stavrakakis GM. A Practical Methodology for Building a Municipality-Led Renewable Energy Community: A Photovoltaics-Based Case Study for the Municipality of Hersonissos in Crete, Greece. Sustainability. 2022; 14(19):12935. https://doi.org/10.3390/su141912935
Chicago/Turabian StyleEfthymiou, Emmanuel N., Sofia Yfanti, George Kyriakarakos, Panagiotis L. Zervas, Panagiotis Langouranis, Konstantinos Terzis, and George M. Stavrakakis. 2022. "A Practical Methodology for Building a Municipality-Led Renewable Energy Community: A Photovoltaics-Based Case Study for the Municipality of Hersonissos in Crete, Greece" Sustainability 14, no. 19: 12935. https://doi.org/10.3390/su141912935