Article

Ride-Hailing Service Adoption and Local Context in Motorcycle-Based Societies: Case Study in Hanoi, Vietnam

1
Faculty of Construction Management, University of Transport and Communications, Hanoi 100000, Vietnam
2
Faculty of Civil Engineering, University of Transport and Communications, Hanoi 100000, Vietnam
3
Master’s Program in Infrastructure Engineering, VNU Vietnam Japan University, Hanoi 100000, Vietnam
4
Vietnam Office, Japan International Cooperation Agency, Hanoi 100000, Vietnam
5
Department of Civil Engineering, The University of Tokyo, Tokyo 113-8656, Japan
*
Author to whom correspondence should be addressed.
Sustainability 2022, 14(2), 728; https://doi.org/10.3390/su14020728
Submission received: 18 December 2021 / Revised: 4 January 2022 / Accepted: 6 January 2022 / Published: 10 January 2022
(This article belongs to the Collection Sustainability in Urban Transportation Planning)

Abstract

:
The ride-hailing service (RHS) has emerged as a major form of daily travel in many Southeast Asian cities where motorcycles are extensively used. This study aims to analyze the local context in motorcycle-based societies, which may affect the establishment of travelers’ choice set after the appearance of RHSs. In particular, it empirically compares three types of choice-set structures in the context of urban travel mode choice by estimating standard logit and nested logit models to test six hypotheses on the associations of RHS adoption with its determinants. Revealed preference data of 449 trips from both RHS users and non-RHS users were collected through a face-to-face interview-based questionnaire survey in Hanoi, Vietnam, in December 2020. The results of model estimations revealed: (1) a substitutional effect for two-wheelers but not for four-wheelers, (2) a significant positive influence of car ownership on car RHS adoption but not on motorcycle RHS adoption, (3) significantly high sensitivity to travel time of motorcycle RHS but not of car RHS, (4) a significant negative effect of traffic congestion on car RHS adoption but an insignificant one on motorcycle RHS adoption, and (5) a significant positive association of an individual’s experience in using a smartphone with car RHSs but insignificant association with motorcycle RHSs. Our findings suggest that transportation policies of RHS motorcycles should be different from those of RHS cars because of the heterogeneity in travel behaviors of RHS users between them. They also indicate that the transition from motorcycles to cars as well as the difference in service availability among different types of RHSs should be incorporated into the development of transportation policies in Southeast Asian cities.

1. Introduction

A ride-hailing service (RHS) is a form of mobility-on-demand in which travelers pay for serviced trips through an application installed on their smartphone instead of traveling with their own vehicles [1]. The popularity of smartphones with dynamically updated technology has enabled the service to become a reliable door-to-door service. RHS is differentiated from traditional taxis mainly in its fare structures, operational regulations, and service booking systems. Of the latest updates, there are several new add-ons to the service, including pooled rides (i.e., users share their rides with others for a cheaper service price), demand-dependent charge (i.e., price is dynamically increased under high demand), and route-based pricing (i.e., an artificial-intelligence charge system in which the fare is set based on users’ willingness to pay for a specific route).
As widely acknowledged, RHS adoption is context-dependent [2] because it varies with the characteristics of the location [3], including local travelers’ behavior, local service types, and local regulations. In fact, varied results have been reported across regions. For example, RHS trips are made quite frequently in motorcycle-based societies [4,5], unlike the occupational occurrence of RHS trips in car-based societies [6]. Other evidence of context-based variation can also be seen in the motivations for RHS usage. For example, Tirachini [6] showed that limited parking is generally noted as a key motivation for RHS use in car-based societies, but this was not found in the context of motorcycle-based societies, probably because of the problem of illegal parking [7]. As for the context of travel mode choice, including RHS, most studies assumed RHS to be a substitutional mode to conventional modes. They include competitive choices of RHSs versus public transport [8]; RHS versus traditional taxi and walking [9]; pooled RHSs versus private RHSs [10]; driverless on-demand vehicles, shared on-demand vehicles, transit plus on-demand vehicles, and driverless public transit shuttles (e.g., [11]); and ridesourcing versus private modes [12]. However, these studies did not consider the local context of the establishment of the choice set structure when the RHS was introduced. To the best of our knowledge, Shen et al. [2] is exceptional as a study that tested multiple-choice structures, but their tests did not examine the local contexts, while they analyzed a car-based society.
This study attempts to fill this gap by analyzing the local context in motorcycle-based societies, which may affect the establishment of travelers’ choice set after the appearance of RHSs. The popularity of motorcycles leads to our hypothesis that local travelers have a nested structure in their choice set of travel modal choices in motorcycle-based societies, in which there is a substitutional effect among two-wheeled vehicles. This study compares three types of structures of travelers’ choice sets with travel data collected from Hanoi, Vietnam. The findings are expected to contribute to a better understanding of travelers’ perceptions of the choice-set structure in motorcycle-based cities such as Hanoi, which is characterized with over 70% of modal share by motorcycle and a transition from motorcycles to cars.
The remaining structure of this paper is as follows: Section 2 presents a literature review. The method, including hypotheses, and models is presented in Section 3. Section 4 describes the empirical study, with a detailed discussion in Section 5. Finally, the study concludes with further issues in Section 6.

2. Literature Review

Dias [13] suggested that there are four key topics surrounding RHSs: disruptiveness, regulation, travel demand, and automation. First, the appearance of RHSs has disruptive effects, for example, an increase in location/job accessibility and more transportation options [14]. Second, regarding the regulatory aspect, researchers have mainly focused on the requirements applied to the services [15,16]. Third, many efforts have been made to understand the service demand of RHSs, in which several sub-aspects have been noted, including travel mode share [17], personal automobile travel [18], and travel mode choice [19]. Finally, attention to the issue of automation has mainly focused on business models for autonomous vehicles [20].
Recent studies on RHS adoption have revealed several notable findings. For instance, the service is considered a substitute for transit and traditional taxi services (e.g., [21]) and/or a complement of transit services (e.g., [19]). The outstanding characteristics of RHS users include being young and educated, living in an urban habitat, and having a high income and fewer cars than other travelers [22,23,24,25,26,27]. In addition to sociodemographic factors, attitudinal factors [28] and information and communication technology factors [29] affect service usage (e.g., [28]). The key reasons for using the service include avoidance of drunk driving and parking [30,31]. More RHS trips are made in rainy conditions (e.g., [32]) and where there is greater walkability [25] and higher population density [33], mainly for travel and leisure purposes [18]. RHS users tend to have less private vehicle ownership [22] and are likely to buy private vehicles if the service is unavailable [34]. Travel time is dominant in sharing rides (i.e., sharing RHS trips with others) compared to factors such as the presence of strangers [18,35]. Younger adults are more likely to use the service during high-demand periods [36].
It should be noted that there are difficulties (mainly because of privacy and competitive issues) in collecting trip-level data from RHS service providers [13,37] except for some cases of available published data sets such as Austin, Texas, in the USA, although disaggregate data is critical in understanding both the supply side, such as issues of deadheading (vehicles running with no passengers), and the demand side, including individual RHS choices. Thus, a recent trend in RHS mode choice studies is to rely on surveyed data sources [37,38,39,40,41]. Despite such efforts, there is still a lack of available disaggregate data for a reliable forecast of ride-hailing adoption among individuals [38,40].
Many studies have also found distinctive characteristics of motorcycle-based contexts, details of which are presented in Table 1. First, the dominant use of motorcycles makes users more habitual than reasoned in using the mode. Second, motorcycles are seen as the fastest and most reliable mode of transport in dense urban environments. Third, motorcycles are mainly used for single, short-distance, and multi-stop trips. Fourth, motorcycle users are young and open to technology. Fifth, there is a transition from motorcycles to cars in middle-income countries. Sixth, the use of motorcycles is associated with public transport performance. Seventh, parking is a critical factor for switching from motorcycles to public transport. Eighth, motorcycle services are easier to use than car services when changing to public transport. Finally, the use of motorcycles negatively affects walking behavior.

3. Hypotheses and Models

3.1. Hypotheses

This study assumes that all hypotheses should be based on local travelers’ perceptions because socioeconomics is expected to have solid effects on mode choices [53]. Given that the utility-based modeling approach is applied to an individual’s travel mode choice, one of the most critical issues is the way in which travelers set up their choice set [54]. We first posit a hypothesis on the choice set of travelers and then use it as a basis to develop the remaining hypotheses. This analytical process allows us to systematically consider the influence of the local context on RHS adoption. Further details can be seen in the methodological procedure flowchart illustrated in Figure 1.
First, the prevailing use of motorcycles in motorcycle-based societies makes the mode the best mode in the local context. The usage has generally lasted relatively long because it becomes habitual rather than reasoned [43]. Thus, it is reasonable to assume that travelers in motorcycle-based societies perceive a similarity among two-wheelers, thus considering all types of two-wheelers under a sub-group of alternatives. The phenomenon of similar travel alternatives has been well addressed in the literature [55,56]. However, this phenomenon is not likely the case for cars in motorcycle-based societies because cars are considered to be more than merely a travel mode due to their symbolic characteristics representing hedonic social status and lifestyles [57,58], as well as the heterogeneity of modal choice among social milieus [59]. This is more likely to happen in societies where there is a transition from motorcycles to cars. Therefore, our first and second hypotheses are as follows.
Hypotheses 1 (H1).
Travelers in motorcycle-based societies consider private motorcycles, RHS motorcycles, and motorcycle taxis under the same subgroup of alternatives,while they consider private cars, RHS cars, and car taxis independently.
Hypotheses 2 (H2).
The number of cars in a household positively affects an individual’s car RHS adoption.
Second, urban areas in motorcycle-based societies are characterized by narrow streets and traffic congestion, which make motorcycles the best mode for travel [47], as well as its low out-of-pocket cost [60]. Thus, we hypothesize that travelers who put a strong weight on travel time will mostly select motorcycles for their travel. Additionally, the narrow streets will cause significantly longer travel times by car than by motorcycles under traffic congestion. Thus, our third and fourth hypotheses are as follows.
Hypotheses 3 (H3).
Travelers in motorcycle-based societies are sensitive to travel time for the two-wheeled modes, but not for four-wheeled modes.
Hypotheses 4 (H4).
Traffic congestion affects the choice of car RHS alternatives, but not motorcycle RHSs.
Third, although it is acknowledged that travelers in motorcycle-based society are open to technology [42] and that the use of smartphones is a requirement for ride-hailing services, we cannot simply assume that travelers are fully dependent on smartphones in using the service because the service is largely affected by the law of supply and demand. In particular, there is an attraction of RHSs through easy access to both users and service providers. An overwhelming increase in service providers (e.g., due to the benefit of job opportunities [13]) may make the service too convenient for users (e.g., users can easily use the service even without a smartphone). Thus, as there should be faster growth on the supply side of motorcycle RHSs than car RHSs in motorcycle-based societies (due to the dominance of motorcycles), it is rational to hypothesize that motorcycle RHSs are less smartphone dependent than car RHSs in motorcycle-based societies. The fifth hypothesis is as follows.
Hypotheses 5 (H5).
The higher availability of motorcycle RHSs makes them less smartphone dependent than car RHSs in motorcycle-based societies.
Finally, as it is commonly reported in previous studies that younger travelers have a higher willingness to use RHSs [22,23]; we wish to confirm this in the context of motorcycle-based societies. Our sixth hypothesis is as follows.
Hypotheses 6 (H6).
Younger individuals are more likely to adopt RHS.

3.2. Models

A series of logit models were used to investigate an individual’s modal choices. Mode choice models were generated based on random utility maximization theory [61]. The representative utility function of each mode is assumed to be an additive linear function of well-addressed determinants in the literature on RHS adoption, including social demographic attributes [24,26], travel time and cost [18,35], experiences of using smartphones [29], and attitude toward the environment [6,62].
In this study, three models were estimated. First, a multinomial logit model (MNL) was applied to examine the case in which all travel mode choices are treated independently. Then, two nested logit (NL) models were formulated to examine cases that might show a similarity in the choice set. The use of MNL and NL is widely known in general extreme value models [56]. The models were estimated based on the revealed preference data reported by the travelers. This type of approach has been widely used in choice modeling.
In the specific case of Hanoi City, eight of the most popular travel modes were investigated: private cars (denoted caP), private motorcycles (denoted mcP), RHS cars (denoted caR), RHS motorcycles (denoted mcR), traditional taxis (denoted caT), traditional motorcycle taxis (denoted mcT), public buses (denoted Bus), and walking (denoted Walk).
First, the MNL model assumes that all alternatives in the choice set follow the independence from irrelevant alternatives (IID) property. The probability of choosing a mode in the choice set is expressed using Equation (1):
P n , w = exp ( V n , w ) w W n exp ( V n , w ) ,
where P n , w is the probability of individual n choosing mode w ; V n , w is the representative utility function of mode w for individual n ; and W n is a choice set of individual n consisting of m c T ,   m c R ,   m c P ,   c a T ,   c a R ,   c a P ,   B u s ,   and   W a l k .
The NL models assume substitutional effects among the alternatives in the choice set. In other words, the universal choice set can be partitioned into subsets, where alternatives in the same nest share unobserved common attributes. In this study, two NL models are developed. The first NL model assumes that all the two-wheeled vehicles are grouped in the m2w nest, while the second NL model also assumes the substitution effect among the two-wheelers as NL1, but with an additional substitution effect among the four-wheeled vehicles. The probability of individual n choosing mode w in nest Mk (m2w: two-wheelers nest, c4w: four-wheeler nest) is formulated as
P n , w = P n , w | M k · P n , M k ,
where P n , w | M k is the conditional probability of choosing mode w given that w is in nest M k , and P n , M k is the marginal probability of choosing an alternative in nest M k . These two probabilities are derived as shown in Equations (3) and (4):
P n , w | M k = exp ( V n , w / λ M k ) w M k exp ( V n , w / λ M k )
P n , M k = exp ( V n , M k + λ M k ln w M k exp ( V n , w / λ M k ) ) k { m 2 w , c 4 w } exp ( V n , M k + λ M k ln w M k exp ( V n , w / λ M k ) ) + exp ( V n , B u s ) + exp ( V n , W a l k ) ,
where λ M k is a parameter that measures the degree of independence among alternatives in nest M k . If the nest structure is appropriately constructed, it should take a value in the range 0–1 [56].

4. Empirical Study

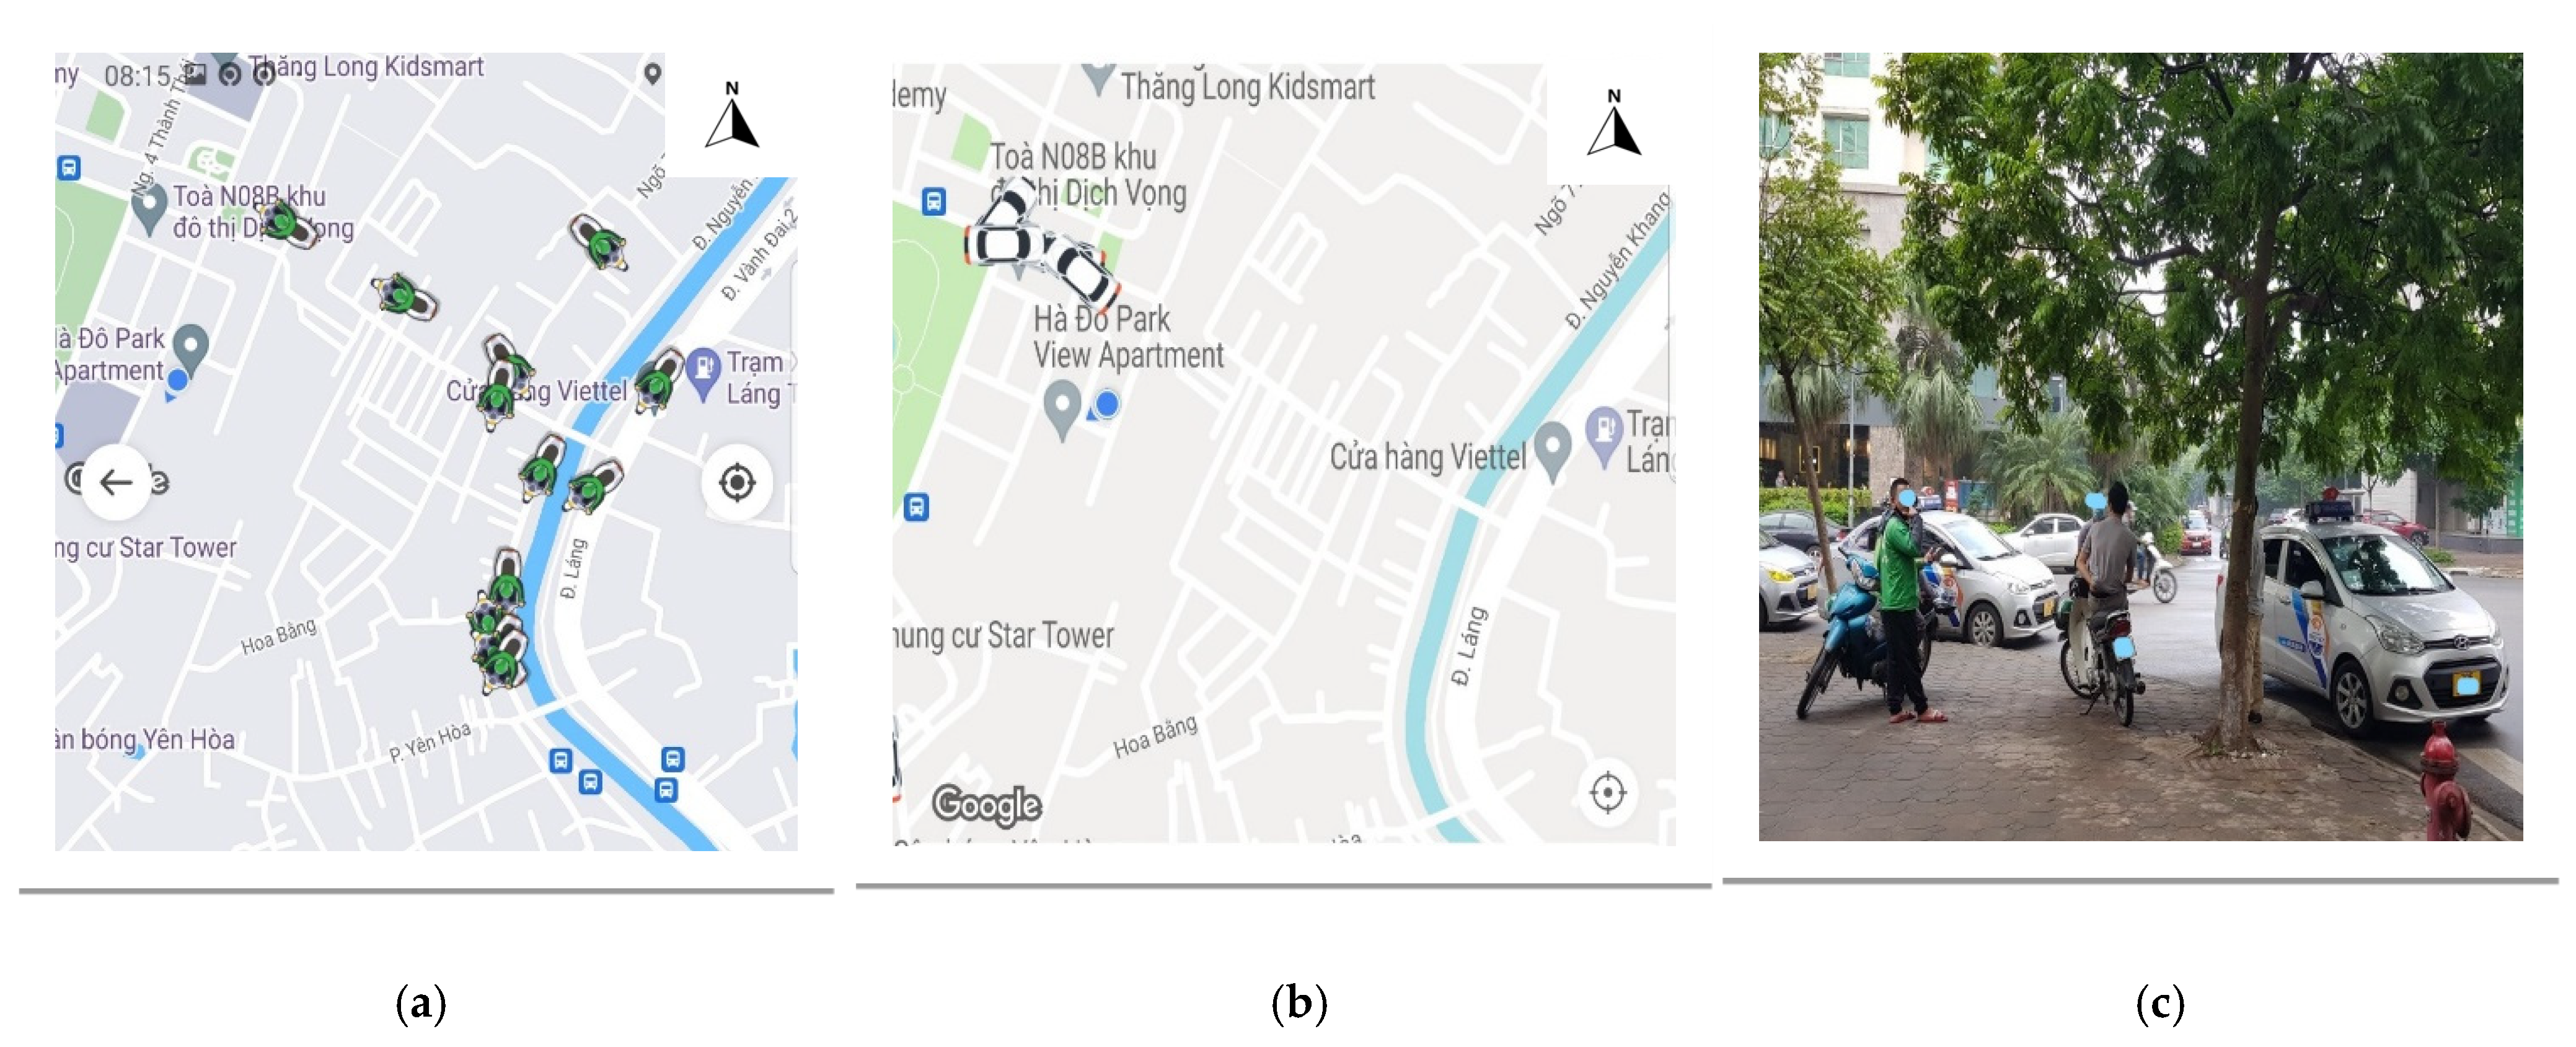
4.1. Local Context of Hanoi City

Hanoi is the capital of Vietnam, covering an area of 3359 km2. It is the second largest city in the country and the economic hub of the north. As of 2020, Hanoi had a total population of approximately 8 million people with an average population density of 2.4 thousand persons/km2. It should be noted that the population is extremely high in the central business districts (CBDs). According to Hanoi Department of Transport data, the city has approximately 5.2 million motorcycles, nearly 0.5 million cars, over 1.2 million bikes, and over 11,000 electric two-wheelers (excluding vehicles from nearby provinces, which make up around 10–15% of the total number). The average annual rates of increase in the number of vehicles during the period 2011–2016 were approximately 10.2% and 6.7% for cars and motorcycles, respectively. Of the estimated modal mode share in 2020, motorcycles account for 72.6%, followed by buses (8.6%), private cars (6.9%), taxis (6.4%), bikes (3.5%), motorcycle taxis (2.9%), and others [63]. It should also be noted that while the share of motorcycles has remained almost the same, that of cars has increased nearly 1.2 times, and the shares of buses and bikes have decreased nearly 0.8 and 0.7 times, respectively, between 2014 and 2020 [63], indicating a transition from motorcycles to cars in the city.
According to Hanoi Department of Transport data, the average road density in the city CBDs is approximately 5.94 km/km2 (occupying 11.38% of the total CBD land area). Approximately 70% of the existing roads have widths less than 11.0 m (some even 5.0 m). This means that two-way traffic is often not possible on many of these roads, and these roads cannot act as alternate routes for congested corridors. The annual increase rate of the road network was nearly 4.0% during the 2011–2016 period. In addition, most of the arterial roads in urban areas have pedestrian facilities with paved sidewalks, zebra-marked crossings, and street lighting. Sidewalks are mainly asphalt or concrete and 4–5 m wide, but their quality is inconsistent between areas. Notably, open spaces are often illegally used for motorcycle parking, leading to an ineffective sidewalk width for pedestrians. Moreover, motorcycles operating on sidewalks are commonly observed when roads are heavily congested.
The appearance of RHSs in Hanoi is remarked by Grab, a Singapore-based company whose service started in 2014. The company is also the first to implement a motorcycle RHS. The two main competitors of Grab are Vietnam’s Be and Indonesia’s Gojek. The RHS in the city is currently more competitive with other participants, notably with motorbike RHSs of Aber, FastGo, and Be group joint stock companies. A common business strategy of these companies is to expand their services beyond passenger services to include food, package deliveries, and even shopping services. As of 2019, our self-records showed that there were approximately 35,000 and 10,000 RHS cars of Grab and Be, respectively, operating in the city. In the case of RHS motorcycles, Grab leads with approximately 45,000 vehicles, followed by Gojek (GoViet was the previous name) with 15,000 vehicles and Be with 10,000 vehicles. It should be noted that motorcycle RHSs are dominant compared to car RHSs in the city. This dominance is illustrated in Figure 2.

4.2. Survey

A face-to-face interview using a questionnaire was conducted from December 19 to 21, 2020, in crowded places of the city CBDs, when the city had successfully controlled the third wave of the COVID-19 pandemic. It should be noted that an expected impact of the pandemic on travel was that people tried to avoid unnecessary trips as well as using public transport modes under the government’s regulations of social distancing. Respondents are randomly interviewed at locations that are selected based on an assumption that characteristics of a location may represent trip characteristics and level of income in target areas. These locations are commercial places, supermarkets, schools/universities, entertainment places, coffee/restaurants, and residential buildings. Before going into the details of the questionnaire, a screening question was used to identify whether the respondent was an RHS user. Two types of questionnaires were used: one for RHS users and the other for non-RHS users. As a result, data points of 240 individual RHS users and of 209 individual non-RHS users were collected.
Of the general information, respondents were asked to provide their sociodemographic information including gender, age, income, occupation, distance to bus stop, banking situation, main travel mode, years of using smartphones, and number of private vehicles (car and motorcycle) in their household. In addition, to be in line with the transition from motorcycles to cars in the city, respondents who do not own cars were asked to select one of three options (will buy, will not buy, not yet decided) for their intention to buy cars in the near future. They were also asked to select one of five responses (no idea, extremely disagree, disagree, agree, extremely agree) to the statement that they are considering buying a low emission vehicle (LEV) and zero emission vehicle (ZEV) to protect the environment (see Appendix A).
To serve the purpose of this study, RHS users were requested to describe their latest RHS trip, while non-RHS users described their latest trip. The characteristics of the latest trip include information on the origin-destination (OD) pair, travel mode, and starting time. Based on these characteristics, trip details (travel distance, travel time, and travel cost) were built for the analyses. The approaches for building trip details are presented in Table 2.
In particular, Google application programming interfaces (APIs) are used to derive the travel distance and travel time of non-RHS user trips. It should be noted that, except for the travel cost by bus, travel costs of car-based and/or motorcycle-based trips are not available in Google APIs. They were estimated based on reliable local references for costs including fuel, maintenance, and parking costs. Regarding RHS trips, the investigated variables were extracted from the RHS applications.
As can be seen from Table 3, respondents are mostly young, with approximately 40% of them aged less than 25 years. The male-female ratio is 55–45, which is quite close to that of the city population, which is approximately 50–50. The majority of respondents had an income of less than 15 million VND per month (equivalent to approximately 650 USD). Most of them are students, employees in private organizations, and freelancers and have no bank account. The main travel mode by motorcycle was dominant, making up nearly 80% of the respondents. Among them, nearly 30% had cars, while more than 95% owned at least one motorcycle. Approximately 35% of the respondents lived within 500 m of the nearest bus station.
In addition, more than 70% of the RHS trips made by respondents cost less than 40,000 VND. More than 80% of non-RHS trips last less than 30 min, versus more than 90% for RHS trips; thus, it seems that RHSs are mainly used for short trips. Notably, approximately 75% of respondents are considering buying an LEV and ZEV to protect the environment. Lastly, RHS users generally have more years of smartphone use than non-RHS users.

4.3. Estimation Results

Pandas Biogeme software was used for the model estimations. The advantages of the software can be found in the latest update [64]. Some points on RP-based modelling should be clarified. First, varying variables, including travel time and travel cost, were estimated for all investigated modes. Second, for unvarying variables, targeted modes are selected based on the nature of the considered variables and the purpose of this study. In particular, age was considered for all investigated modes with walk as a reference mode. Consideration of buying an LEV and ZEV to protect the environment is investigated under cases of RHS modes and “green” modes (bus and walking). Private vehicle ownership in households is considered an RHS mode and private mode. Years of using smartphones, intention to buy cars in the near future, and trip starting during peak hours (a dummy variable) are intensively examined in the RHS modes.
The estimated results of the MNL model, nested logit model 1 (NL1), and nested logit model 2 (NL2) are presented in Table 4. Because the number of parameters estimated in the three models is different, model selection is based on the Akaike information criterion (AIC). Model 1, which has the smallest AIC value, is the best model. Thus, the association of the investigated variables with RHS adoption will be discussed based on the results of NL1. The notable findings are presented below.
First, the nested parameter for NL2 (four-wheeled nest is included) is not consistent with the rule of the nested model [56]. In addition, the AIC value of NL2 is not better than that of NL1. Therefore, there is no substitutional effect among four-wheeled vehicles in our dataset. The nested parameter of NL1 is consistent with the rule of the nested model with good t-test statistics (inclusive value of 0.223). These results support Hypothesis 1 that travelers in motorcycle-based societies consider private motorcycles, RHS motorcycles, and motorcycle taxis as forming a sub-group of two-wheelers. However, they consider private cars, RHS cars, and car taxis independently.
Second, the number of cars in a household positively affects the possibility of adopting car RHSs; thus, our second hypothesis is supported. This implies that those having greater car access will use car RHSs more. However, a similar effect was not observed in the case of motorcycles.
Third, as can be seen from the model results, travelers in motorcycle-based societies are sensitive to travel time for the two-wheeled modes, thus supporting our third hypothesis. The negative value of the travel time parameter showed that travelers are more likely to use two-wheelers when they perceive the travel time to be shorter. This is also observed in the case of walking, but not for the cases of four-wheelers. This suggests that four-wheeler users seem to be less sensitive to travel time than two-wheeler users.
Fourth, the results showed a negative association between starting time and the adoption of car RHSs. This was not observed in the case of a motorcycle RHS. Travelers starting their trips during peak hours are less likely to select car RHSs as their travel mode. In other words, traffic congestion affects the choice of the car RHS alternative but not the motorcycle RHS, thus supporting the fourth hypothesis. Referring to the above discussion that four-wheeler users are less sensitive to travel time than two-wheeler users, we consider that travel time sensitivity is probably strongly activated under conditions of traffic congestion due to much longer travel times by car than by motorcycle in traffic congestion.
Fifth, years of using smartphones has a positive association with the adoption of car RHSs (i.e., the longer the period of smartphone use, the greater the likelihood of using a car RHS). This was not observed for motorcycle RHSs, suggesting that motorcycle RHSs are less smartphone dependent than car RHSs, thus supporting Hypothesis 5. This is in accordance with the local context of Hanoi City, where users can even use a motorcycle RHS without a smartphone because of the high availability of the service. Specifically, they can use direct communication, which is typical for conventional motorcycle taxis.
Sixth, with the walk mode as the reference case, most age parameters are negative and significant. The parameters associated with non-RHS modes had the lowest values. These results indicate that if the age increases, there is a lower probability that individuals choose RHS modes. In other words, the younger the age, the greater the likelihood of adopting RHSs. This supports Hypothesis 6.

5. Discussion

This study is one of the first to highlight the impact of local context on RHS adoption in motorcycle-based societies. The approach of this study is systematic in that we first investigate the establishment of an RHS-involved mode choice structure before examining the association between RHS adoption and its determinants. The use of RP data in modeling allows us to consider trip-level characteristics. Various points of interest regarding RHS adoption in motorcycle-based societies have been highlighted that show a strong contrast between motorcycle and car RHSs, including a substitutional effect for two-wheelers (but not for four-wheelers), a positive influence of car ownership on car RHS adoption (but not on motorcycle RHS), a sensitivity to travel time for motorcycle RHSs (but not for car RHSs), the negative effect of traffic congestion on car RHS adoption (but not on motorcycle RHS adoption), and a positive effect of the time of smartphone use on car RHSs (not on motorcycle RHSs).
First, the substitutional effect among two-wheelers (H1 is supported, NL1, nested parameter value = 4.48, p-value < 0.01) suggests that travelers in motorcycle-based cities might be too familiar with two-wheelers, leading to a situation where the discrimination among two-wheelers is not as strong as other alternatives, leading them to form a subgroup of alternatives. This is in line with the concept of threshold perception [65] and the phenomenon of tolerance and indifference bands in mode choice [66]. Therefore, motorcycle RHSs may be treated similarly to other two-wheelers, suggesting tough competition between the mode and other similar services, such as the traditional motorcycle taxi. Such competition is seemingly less serious in the case of car RHSs because the substitutional effect was not observed in the case of four-wheelers.
Second, the positive association between the number of cars in a household and car RHS adoption (H2 is supported, NL1, parameter value = 0.751, p-value < 0.001) suggests that adoption may inherit benefits from the transition toward cars in society. Car RHSs may have helped increase car access, which is perceived as a symbol of lifestyle in society [58]. It should be noted that in the specific case of Hanoi city, car RHS vehicles looked almost identical to private cars for a long time (except for a recent small change in plate color) because there is no appearance-related regulation for the vehicle. Contrariwise, the lack of an association between the number of motorcycles in households and motorcycle RHSs is probably because the number of motorcycles is approaching its limit and/or motorcyclists tend to use more motorcycles when they have more access to the mode.
Third, the finding that users of two-wheelers are more travel-time-sensitive than those of four-wheelers (H3 is supported, NL1, parameter value of two wheelers = −0.0519, p-value < 0.001, significance not observed for four-wheelers) is notable for RHS development: travel time is likely an advantage of motorcycle RHSs compared to car RHSs in motorcycle-based societies. Moreover, although it is less sensitive to travel time than motorcycle RHS adoption, car RHS adoption was found to be negatively affected by traffic congestion. In particular, car RHS trips are negatively associated with the starting time during peak hours, while this is not observed in the case of motorcycle RHS adoption (H4 is supported, parameter value of car RHS = −0.709, p-value < 0.01, significance not observed for motorcycle RHS). Thus, it is likely that traffic congestion strengthens the travel time advantage of motorcycle RHSs over car RHSs. This can be worse for car RHS adoption when service providers apply a similar pricing increase policy during peak hours to car RHSs and motorcycle RHSs.
Fourth, in line with previous studies that the use of information and communication technology positively affects the use of RHSs (e.g., [67]), this study confirmed the positive association between years of smartphone use and car RHS adoption (H5 is supported, parameter value of car RHS = 0.107, p-value < 0.01). However, such an association was not observed in the case of motorcycle RHSs. This highlights the need for a better understanding of local contexts. In the case of Hanoi, this phenomenon probably reflects an excess supply of motorcycle RHSs; users can even use a motorcycle RHS without a smartphone. This interesting phenomenon should be further investigated in future studies.
Fifth, this study confirms a common finding [22,23] that RHS adoption is positively associated with young travelers (H6 is supported, parameter value of car RHS = −0.124, p-value < 0.001; parameter value of motorcycle RHS = −0.103, p-value < 0.001). It should be noted that such a phenomenon occurred in most of the investigated modes, but it was the strongest for RHSs. This implies a need to understand the exact factors contributing to this phenomenon, in particular whether this phenomenon is due to higher daily travel demand or better access to information and communication technology among young travelers.
Finally, it should be noted that we did not find a significant association between travel cost and RHS adoption. This is probably due to threshold perception [65] and/or the indifference bands in choice [66]. This should be put into the local context that RHS trips still make up a small proportion of the total trips in daily life. In addition, our model did not show a relationship between pro-environmental attitudes (through the stated consideration of buying environmentally friendly vehicles) and RHS adoption. This is probably because local travelers have not yet perceived the benefits of RHSs toward the environment.

6. Conclusions

This study analyzed modal choice behavior, including RHSs, by incorporating the local context of motorcycle-based transportation systems. Three MNL and NL models were estimated using an empirical dataset collected from Hanoi, Vietnam. First, the results suggest that travelers treat RHS motorcycles and RHS cars differently in a mode choice decision. In particular, the RHS motorcycle is considered a substitutional alternative to two-wheeled modes (private motorcycles, RHS motorcycles, and motorcycle taxis), while an RHS car is considered an independent group of 4-wheeler vehicles, including private cars, RHS cars, and car taxis. Second, our results also showed that the number of cars in a household positively affects the possibility of adopting a car RHS. This is remarkable in a motorcycle-based society under a transition towards a car-based society. Third, our results further revealed that travelers are sensitive to travel time for the two-wheeled modes only, not for the other motorized modes. This partly explains why traffic congestion affects the choice of RHS cars, but not RHS motorcycles. Finally, the extremely high availability of the RHS motorcycle makes this mode less smartphone dependent than RHS cars because travelers can easily obtain the service without a smartphone.
Our findings suggest that transportation policies for RHS motorcycles should be different from those for RHS cars because RHS users recognize them in an obviously different manner. Future transportation policies should also be fully aware of the transition from motorcycles to cars as well as the difference of service availability among different types of RHSs in motorcycle-based societies, typically in Southeast Asian cities.
This study had several limitations. First, our modelling approach is based on RP data that may not fully reflect realistic trip-level data. Second, although the emergence of EVs is acknowledged, we did not consider EVs as alternatives in our universal choice set because electric vehicles can be any type of current mode, including RHS and non-RHS. Future studies should explore this issue. Third, the use of built-up data in this study may cause biases because we have to rely on values provided by Google APIs and various local references to estimate travel time and travel cost. Fourth, due to privacy concerns, our study could only extract the locations of the origin and destination of trips stated by respondents. Fifth, although this study aims to investigate RHS adoption in a normal situation, it is unfortunate that the data were collected under a new normal situation; thus, biases caused by COVID-19 are unavoidable. Finally, further research with a larger sample size and more realistic trip-level characteristics is required to obtain a more stable impact outcome.

Author Contributions

Conceptualization, N.H.-T., H.T.L. and H.K.; data curation, N.H.-T., H.V.C., P.L.B. and S.T.; formal analysis, H.T.L.; funding acquisition, H.K.; methodology, N.H.-T. and H.K.; project administration, P.L.B., S.T. and H.K.; writing—original draft, N.H.-T.; writing—review and editing, H.T.L. and H.K. All authors have read and agreed to the published version of the manuscript.

Funding

This study was financially supported by a Kajima Foundation’s International Joint Research Grant.

Institutional Review Board Statement

The study was conducted with an approval from the Ethics Committee of Vietnam Japan University (protocol code: No.1 and date of approval: 4th January 2022).

Informed Consent Statement

Informed consent was obtained from all subjects involved in the study.

Data Availability Statement

Not applicable.

Acknowledgments

We appreciate Saksith Chalermpong and Phathinan Thaithatkul (Chulalongkorn University) for sharing a basic design of questionnaire survey of ride-hailing services.

Conflicts of Interest

The authors declare no conflict of interest.

Appendix A. List of Questions in the Local Survey

General information
  • 1. Age: ……. years old
  • 2. Gender: a) Male  b) Female c) Others
  • 3. Monthly income (Mil. VND; select one): a) <5; b) 5–10; c) 10–15; d) 15–20; e) 20–25; f) >25; g) Not applicable
  • 4. Occupation (select one):
  • a) student; b) employee in private organization; c) employee in government agency; d) freelancer
  • e) part-time employee: f) retired/unemployed and not looking for a job
  • 5. How many vehicles do your household own?
  • …………cars; ……………. motorcycles
  • 6. Distance from your home to the nearest bus stop: ……. km
  • 7. Main travel mode used before Covid-19 pandemic (select one):
  • a) private motorcycle/car; b) public bus; c) public bus + taxi/motorcycle taxi/RHS; d) taxi/motorcycle taxi/RHS; e) walk/bicycle
The latest trip information (for either RHS or non-RHS)
  • 8. Origin: …………………
  • 9. Destination: ……………
  • 10. If the trip is a single mode trip, what mode did you use? (select one)
  • a) private car: b) private motorcycle; c) RHS car; d) RHS motorcycle; e) traditional taxi; f) traditional motorcycle taxi; g) public bus; h) walking
  • 11. Departure time of the trip: ……………. (e.g., 8:30)
  • 12. Total travel time: ……………… minutes
  • 13. Total distance (select one): ………….. km
  • 14. Total travel cost: ……… VND
Vehicle ownership and its intention
  • 15. How will you change your vehicle ownership status in the near future?
  • 15.1 Car (select one)
  •         a) I don’t have a car and I will not buy one.
  •         b) I don’t have a car, but I will buy one.
  •         c) I have a car, and I will not buy a new one.
  •         d) I have a car, and I will change to a new one.
  •         e) I have a car, but I will get rid of it.
  •         f) I have not yet decided.
Smartphone usage and environmental attitude
  • 16. How many years have you been using smartphone? ……………years
  • 17. Do you agree to the following statement: “I am considering buying a low emission vehicle (LEV) and a zero emission vehicle (ZEV) to save the environment”? (select one)
  • a) neutral; b) totally disagree; c) disagree; d) agree; e) totally agree

References

  1. Shaheen, S.; Cohen, A.; Yelchuru, B.; Sarkhili, S.; Hamilton, B.A. Mobility on Demand Operational Concept Report (No. FHWA-JPO-18-611); Department of Transportation, Intelligent Transportation Systems Joint Program Office, US, 2017. Available online: https://rosap.ntl.bts.gov/view/dot/34258 (accessed on 5 January 2022).
  2. Shen, H.; Zou, B.; Lin, J.; Liu, P. Modeling travel mode choice of young people with differentiated E-hailing ride services in Nanjing China. Transp. Res. Part D Transp. Environ. 2020, 78, 102216. [Google Scholar] [CrossRef]
  3. Ma, Y.; Yu, B.; Xue, M. Spatial Heterogeneous Characteristics of Ridesharing in Beijing–Tianjin–Hebei Region of China. Energies 2018, 11, 3214. [Google Scholar] [CrossRef] [Green Version]
  4. Acheampong, R.A.; Siiba, A.; Okyere, D.K.; Tuffour, J.P. Mobility-on-demand: An empirical study of internet-based ride-hailing adoption factors, travel characteristics and mode substitution effects. Transp. Res. Part C Emerg. Technol. 2020, 115, 102638. [Google Scholar] [CrossRef]
  5. Giddy, J.K. The influence of e-hailing apps on urban mobilities in South Africa. Afr. Geogr. Rev. 2019, 38, 227–239. [Google Scholar] [CrossRef]
  6. Tirachini, A. Ride-hailing, travel behaviour and sustainable mobility: An international review. Transportation 2020, 47, 2011–2047. [Google Scholar] [CrossRef]
  7. Chalermpong, S.; Ratanawaraha, A. Bangkok, Thailand. In Parking: An International Perspective; Pojani, D., Corcoran, J., Sipe, N., Mateo-Babiano, I., Eds.; Elsevier: Amsterdam, The Netherlands, 2019; pp. 207–227. [Google Scholar]
  8. Sa, A.L.S.; Pitombo, S.C. Methodological proposal for stated preference scenarios regarding an exploratory evaluation of ride-hailing implications on transit: A Brazilian context analysis. Case Stud. Transp. Policy 2021, 4, 1727–1736. [Google Scholar] [CrossRef]
  9. Khattak, Z.H.; Miller, J.S.; Ohlms, P. Ride-hailing and taxi versus walking: Long term forecasts and implications from large-scale behavioral data. J. Transp. Health 2021, 22, 101121. [Google Scholar] [CrossRef]
  10. Kang, S.; Mondal, A.; Bhat, A.C.; Bhat, C.R. Pooled versus private ride-hailing: A joint revealed and stated preference analysis recognizing psycho-social factors. Transp. Res. Part C Emerg. Technol. 2021, 124, 102906. [Google Scholar] [CrossRef]
  11. Sweet, M.N. User interest in on-demand, shared, and driverless mobility: Evidence from stated preference choice experiments in Southern Ontario. Travel Behav. Soc. 2021, 23, 120–133. [Google Scholar] [CrossRef]
  12. Asgari, H.; Jin, X. Propensity toward ride-sourcing: Desired savings in travel time and mobility cost to switch from private mobility. Transp. Res. Part C Emerg. Technol. 2020, 121, 102883. [Google Scholar] [CrossRef]
  13. Dias, F.F. Ride-hailing and travel demand implications. In International Encyclopedia of Transportation; Vickerman, R., Ed.; Elsevier: Amsterdam, The Netherlands, 2021; pp. 564–568. [Google Scholar]
  14. Dudley, G.; Banister, D.; Schwanen, T. The Rise of Uber and Regulating the Disruptive Innovator. Politi- Q. 2017, 88, 492–499. [Google Scholar] [CrossRef]
  15. de Souza Silva, L.A.; de Andrade, M.O.; Maia, M.L.A. How does the ride-hailing systems demand affect individual transport regulation? Res. Transp. Econ. 2018, 69, 600–606. [Google Scholar] [CrossRef] [Green Version]
  16. Li, Y.; Taeihagh, A.; De Jong, M. The Governance of Risks in Ridesharing: A Revelatory Case from Singapore. Energies 2018, 11, 1277. [Google Scholar] [CrossRef] [Green Version]
  17. Wang, X.; Yan, X.; Zhao, X.; Cao, Z. Identifying latent shared mobility preference segments in low-income communities: Ride-hailing, fixed-route bus, and mobility-on-demand transit. Travel Behav. Soc. 2021, 26, 134–142. [Google Scholar] [CrossRef]
  18. Lavieri, P.S.; Bhat, C.R. Investigating objective and subjective factors influencing the adoption, frequency, and characteristics of ride-hailing trips. Transp. Res. Part C Emerg. Technol. 2019, 105, 100–125. [Google Scholar] [CrossRef]
  19. Zhang, Y.; Zhang, Y. Exploring the relationship between ridesharing and public transit use in the United States. Int. J. Environ. Res. Public Health 2018, 15, 1763. [Google Scholar] [CrossRef] [PubMed] [Green Version]
  20. Greenblatt, J.B.; Shaheen, S. Automated vehicles, on-demand mobility, and environmental impacts. Curr. Sustain. /Renew. Energy Rep. 2015, 2, 74–81. [Google Scholar] [CrossRef] [Green Version]
  21. Zhong, Y.; Yang, T.; Cao, B.; Cheng, T. On-demand ride-hailing platforms in competition with the taxi industry: Pricing strategies and government supervision. Int. J. Prod. Econ. 2021, 243, 108301. [Google Scholar] [CrossRef]
  22. Clewlow, R.R.; Mishra, G.S. Disruptive Transportation: The Adoption, Utilization, and Impacts of Ridehailing in the United States (Technical Report UCD-ITS-RR-17-07); University of California, Davis, Institute of Transportation Studies, UD, 2017. Available online: https://escholarship.org/uc/item/82w2z91j (accessed on 5 January 2022).
  23. Dias, F.F.; Lavieri, P.S.; Garikapati, V.; Astroza, S.; Pendyala, R.M.; Bhat, C.R. A behavioral choice model of the use of car-sharing and ride-sourcing services. Transportation 2017, 44, 1307–1323. [Google Scholar] [CrossRef]
  24. Lavieri, P.S.; Garikapati, V.M.; Bhat, C.R.; Pendyala, R.M.; Astroza, S.; Dias, F.F. Modeling Individual Preferences for Ownership and Sharing of Autonomous Vehicle Technologies. Transp. Res. Rec. J. Transp. Res. Board 2017, 2665, 1–10. [Google Scholar] [CrossRef] [Green Version]
  25. Marquet, O. Spatial distribution of ride-hailing trip demand and its association with walkability and neighborhood characteristics. Cities 2020, 106, 102926. [Google Scholar] [CrossRef]
  26. Rayle, L.; Dai, D.; Chan, N.; Cervero, R.; Shaheen, S. Just a better taxi? A survey-based comparison of taxis, transit, and ridesourcing services in San Francisco. Transp. Policy 2016, 45, 168–178. [Google Scholar] [CrossRef] [Green Version]
  27. Vinayak, P.; Dias, F.F.; Astroza, S.; Bhat, C.R.; Pendyala, R.M.; Garikapati, V.M. Accounting for multi-dimensional dependencies among decision-makers within a generalized model framework: An application to understanding shared mobility service usage levels. Transp. Policy 2018, 72, 129–137. [Google Scholar] [CrossRef]
  28. Loa, P.; Habib, K.N. Examining the influence of attitudinal factors on the use of ride-hailing services in Toronto. Transp. Res. Part A Policy Pract. 2021, 146, 13–28. [Google Scholar] [CrossRef]
  29. Kong, H.; Moody, J.; Zhao, J. ICT’s impacts on ride-hailing use and individual travel. Transp. Res. Part A Policy Pract. 2020, 141, 1–15. [Google Scholar] [CrossRef]
  30. Clark, B.Y.; Brown, A. What does ride-hailing mean for parking? Associations between on-street parking occupancy and ride-hail trips in Seattle. Case Stud. Transp. Policy 2021, 9, 775–783. [Google Scholar] [CrossRef]
  31. Goodspeed, R.; Xie, T.; Dillahunt, T.R.; Lustig, J. An alternative to slow transit, drunk driving, and walking in bad weather: An exploratory study of ridesourcing mode choice and demand. J. Transp. Geogr. 2019, 79, 102481. [Google Scholar] [CrossRef]
  32. Liu, S.; Jiang, H.; Chen, Z. Quantifying the impact of weather on ride-hailing ridership: Evidence from Haikou, China. Travel Behav. Soc. 2021, 24, 257–269. [Google Scholar] [CrossRef]
  33. Wang, S.; Noland, R.B. Variation in ride-hailing trips in Chengdu, China. Transp. Res. Part D Transp. Environ. 2020, 90, 102596. [Google Scholar] [CrossRef]
  34. Hampshire, R.C.; Simek, C.; Fabusuyi, T.; Di, X.; Chen, X. Measuring the impact of an unanticipated suspension of ride-sourcing in Austin, Texas. Presented at the 97th Annual Meeting of the Transportation Research Board, Washington, DC, USA, 7–11 January 2018; Paper No. 18-03105. Available online: https://papers.ssrn.com/sol3/papers.cfm?abstract_id=2977969 (accessed on 5 January 2022).
  35. Lavieri, P.S.; Bhat, C.R. Modeling individuals’ willingness to share trips with strangers in an autonomous vehicle future. Transp. Res. Part A Policy Pract. 2019, 124, 242–261. [Google Scholar] [CrossRef]
  36. Kooti, F.; Grbovic, M.; Aiello, L.M.; Djuric, N.; Radosavljevic, V.; Lerman, K. Analyzing Uber’s ride-sharing economy. In WWW’17 Companion: Proceedings of the 26th International Conference on World Wide Web Companion, Geneva, Switzerland, 3–7 April 2017; International World Wide Web Conferences Steering Committee: Geneva, Switzerland; pp. 574–582. Available online: https://dl.acm.org/doi/10.1145/3041021.3054194 (accessed on 5 January 2022).
  37. Komanduri, A.; Wafa, Z.; Proussaloglou, K.; Jacobs, S. Assessing the Impact of App-Based Ride Share Systems in an Urban Context: Findings from Austin. Transp. Res. Rec. J. Transp. Res. Board 2018, 2672, 34–46. [Google Scholar] [CrossRef]
  38. Dias, F.F.; Kim, T.; Bhat, C.R.; Pendyala, R.M.; Lam, W.H.K.; Pinjari, A.R.; Srinivasan, K.K.; Ramadurai, G. Modeling the Evolution of Ride-Hailing Adoption and Usage: A Case Study of the Puget Sound Region. Transp. Res. Rec. J. Transp. Res. Board 2020, 2675, 81–97. [Google Scholar] [CrossRef]
  39. Gerte, R.; Konduri, K.C.; Eluru, N. Is There a Limit to Adoption of Dynamic Ridesharing Systems? Evidence from Analysis of Uber Demand Data from New York City. Transp. Res. Rec. J. Transp. Res. Board 2018, 2672, 127–136. [Google Scholar] [CrossRef] [Green Version]
  40. Lavieri, P.S.; Dias, F.F.; Juri, N.R.; Kuhr, J.; Bhat, C.R. A Model of Ridesourcing Demand Generation and Distribution. Transp. Res. Rec. J. Transp. Res. Board 2018, 2672, 31–40. [Google Scholar] [CrossRef] [Green Version]
  41. Wenzel, T.; Rames, C.; Kontou, E.; Henao, A. Travel and energy implications of ridesourcing service in Austin, Texas. Transp. Res. Part D Transp. Environ. 2019, 70, 18–34. [Google Scholar] [CrossRef]
  42. Jones, L.R.; Cherry, C.R.; Vu, T.A.; Nguyen, Q.N. The effect of incentives and technology on the adoption of electric motorcycles: A stated choice experiment in Vietnam. Transp. Res. Part A Policy Pract. 2013, 57, 1–11. [Google Scholar] [CrossRef]
  43. Chen, C.-F.; Lai, W.-T. The effects of rational and habitual factors on mode choice behaviors in a motorcycle-dependent region: Evidence from Taiwan. Transp. Policy 2011, 18, 711–718. [Google Scholar] [CrossRef]
  44. Chang, H.-L.; Wu, S.-C. Exploring the vehicle dependence behind mode choice: Evidence of motorcycle dependence in Taipei. Transp. Res. Part A Policy Pract. 2007, 42, 307–320. [Google Scholar] [CrossRef]
  45. Poi, A.W.H.; Law, T.H.; Hamid, H.; Jakarni, F.M. Motorcycle to car ownership: The role of road mobility, accessibility and income inequality. Transp. Res. Part D Transp. Environ. 2020, 90, 102650. [Google Scholar] [CrossRef]
  46. Truong, T.M.T.; Ngoc, A.M. Parking behavior and the possible impacts on travel alternatives in motorcycle-dominated cities. Transp. Res. Procedia 2020, 48, 3469–3485. [Google Scholar] [CrossRef]
  47. Guerra, E. Electric vehicles, air pollution, and the motorcycle city: A stated preference survey of consumers’ willingness to adopt electric motorcycles in Solo, Indonesia. Transp. Res. Part D Transp. Environ. 2019, 68, 52–64. [Google Scholar] [CrossRef]
  48. Suatmadi, A.Y.; Creutzig, F.; Otto, I.M. On-demand motorcycle taxis improve mobility, not sustainability. Case Stud. Transp. Policy 2019, 7, 218–229. [Google Scholar] [CrossRef]
  49. Tran, M.T.; Zhang, J.; Fujiwara, A. Can we reduce the access by motorcycles to mass transit systems in future Hanoi? Procedia Soc. Behav. Sci. 2014, 138, 623–631. [Google Scholar] [CrossRef] [Green Version]
  50. Marquet, O.; Miralles-Guasch, C. City of motorcycles. On how objective and subjective factors are behind the rise of two-wheeled mobility in Barcelona. Transp. Policy 2016, 52, 37–45. [Google Scholar] [CrossRef]
  51. Pongprasert, P.; Kubota, H. TOD residents’ attitudes toward walking to transit station: A case study of transit-oriented developments (TODs) in Bangkok, Thailand. J. Mod. Transp. 2018, 27, 39–51. [Google Scholar] [CrossRef] [Green Version]
  52. Peraphan, J.; Hermann, K.; Markus, M. The conundrum of the motorcycle in the mix of sustainable urban transport. Transp. Res. Procedia 2017, 25, 4869–4890. [Google Scholar] [CrossRef]
  53. Shanmugam, L.; Ramasamy, M. Study on mode choice using nested logit models in travel towards Chennai metropolitan city. J. Ambient. Intell. Humaniz. Comput. 2021, 1–9. [Google Scholar] [CrossRef]
  54. Cascetta, E.; Papola, A. Random utility models with implicit availability/perception of choice alternatives for the simulation of travel demand. Transp. Res. Part C Emerg. Technol. 2001, 9, 249–263. [Google Scholar] [CrossRef]
  55. Ben-Akiva, M.; Lerman, S.R. Discrete Choice Analysis: Theory and Application to Travel Demand; MIT Press: Cambridge, MA, USA, 1985. [Google Scholar]
  56. Train, K.E. Discrete Choice Methods with Simulation; Cambridge University Press: Cambridge, UK, 2003. [Google Scholar]
  57. Gatersleben, B. Affective and symbolic aspects of car use. In Threats from Car Traffic to the Quality of Urban Life: Problems, Causes, and Solutions; Garling, T., Steg, L., Eds.; Elsevier: Amsterdam, The Netherlands, 2007; pp. 219–233. [Google Scholar]
  58. Ramos, M.S.; Bergstad, C.J.; Nässén, J. Understanding daily car use: Driving habits, motives, attitudes, and norms across trip purposes. Transp. Res. Part F Traffic Psychol. Behav. 2020, 68, 306–315. [Google Scholar] [CrossRef]
  59. Groth, S.; Hunecke, M.; Wittowsky, D. Middle-Class, Cosmopolitans and Precariat among Millennials between Automobility and Multimodality. Transp. Res. Interdiscip. Perspect. 2021, 12, 100467. [Google Scholar] [CrossRef]
  60. Inaba, H.; Kato, H. Impacts of Motorcycle Demand Management in Yangon, Myanmar. Transp. Res. Procedia 2017, 25, 4852–4868. [Google Scholar] [CrossRef]
  61. Domencich, T.A.; McFadden, D. Urban Travel Demand: A Behavioural Analysis; North-Holland: Amsterdam, The Netherlands, 1975. [Google Scholar]
  62. Alemi, F.; Circella, G.; Handy, S.; Mokhtarian, P. What influences travelers to use Uber? Exploring the factors affecting the adoption of on-demand ride services in California. Travel Behav. Soc. 2018, 13, 88–104. [Google Scholar] [CrossRef]
  63. Ngoc, A.M.; Nishiuchi, H.; Van Truong, N.; Huyen, L.T. A comparative study on travel mode share, emission, and safety in five Vietnamese Cities. Int. J. Intell. Transp. Syst. Res. 2021, 1–13. [Google Scholar] [CrossRef]
  64. Bierlaire, M. A Short Introduction to PandasBiogeme (Technical Report TRANSP-OR 200605); Transport and Mobility Laboratory, ENAC, EPFL: Lausanne, Switzerland, 2020; Available online: https://transp-or.epfl.ch/documents/technicalReports/Bier20.pdf (accessed on 5 January 2022).
  65. Coombs, C.H.; Dawes, R.M.; Tversky, A. Mathematical Psychology: An Elementary Introduction; Prentice Hall: Englewood Cliffs, NJ, USA, 1970. [Google Scholar]
  66. Jang, S.; Rasouli, S.; Timmermans, H. Tolerance and Indifference Bands in Regret–Rejoice Choice Models: Extension to Market Segmentation in the Context of Mode Choice Behavior. Transp. Res. Rec. J. Transp. Res. Board 2018, 2672, 23–34. [Google Scholar] [CrossRef]
  67. Fu, X. Does heavy ICT usage contribute to the adoption of ride-hailing app? Travel Behav. Soc. 2020, 21, 101–108. [Google Scholar] [CrossRef]
Figure 1. Methodological procedure flowchart.
Sustainability 14 00728 g001
Figure 2. (a,b) Typical availability of motorcycle RHS and car RHS at the same time in the same area (RHS application view); (c) typical motorcycle RHS and conventional motorcycle taxi waiting at intersections.
Sustainability 14 00728 g002
Table 1. Notable travel mode choice characteristics of motorcycle-based societies.
StudiesObjectivesOutstanding Characteristics (Original Text Is Cited)
Jones et al., 2013 [42]Electric motorcycle adoption
  • Sales tax incentive is a strong stimulus for electric motorcycle adoption.
  • Consumers willing to pay for technology-based performance improvements.
Chen and Lai, 2011 [43]Mode choice in motorcycle-based society
  • Psychological (rational and habitual) factors have stronger influences on mode choice behaviors than socio-economic factors.
  • Habitual factors explain traveler mode choice behaviors better than rational ones.
  • The contextual effect with regard to public transport development is found to be significant for motorcyclists’ mode choice behaviors.
Chang and Wu, 2008 [44]Motorcycle usage
  • Motorcyclists depend on their motorcycles to achieve unaccompanied, short-distance, multi-stop trips.
  • Motorcyclists under the age of 25 who were inferior in economic terms and did not use an automobile showed relatively higher measures of motorcycle dependence.
Poi et al., 2021 [45]Transition from motorcycle to car
  • Increased demand for motorcycles (especially high-power motorcycles) should be expected in developed countries when more and more high mobility roads are provided due to the culture of motorcycle touring.
  • The use of cars is found to be relatively higher in countries with moderate income levels when more high mobility roads are built.
Truong and Ngoc, 2020 [46]Parking and mode choice in motorcycle-based society
  • With higher parking fees, parking users are more likely to shift to public transport.
  • Motorcyclists and bicyclists are more sensitive to parking fees than car users.
  • Motorcyclists and bicyclists are more willing to shift to public transport than car users, especially when they must pay more for parking.
Guerra, 2019 [47]Electric motorcycle adoption
  • Speed, range, charge time, and price all mattered substantially with respondents willing to pay a 7–13% premium for motorcycles with 10 km longer range, 10 km/h faster speed, or an hour shorter charge time.
  • Charge time was particularly important to consumers’ willingness to adopt electric motorcycles.
  • Younger non-smoking respondents with concerns about the environment and favorable views of e-bikes were most likely to choose electric motorcycles.
Suatmadi et al., 2019 [48]On-demand motorcycle taxi adoption
  • Two- and three-wheeler ride sharing systems coupled with information and communication technologies (ICT) are radically changing the mobility landscape in Asian cities.
  • The market is segmented into users belonging to the three different socio-economic groups, all of which switch modes towards motorcycle taxi.
Tran et al., 2014 [49]Motorcycle toward mass transit usage
  • Those selecting measures to improve parking facilities prefer motorcycles to other access modes.
Marquet and Miralles-Guasch, 2016 [50]Two-wheeled mobility in motorcycle city
  • Motorbike use depends on a combination of demographic and economic factors.
  • Motorbikes are seen as a fast and reliable mode of transport in dense urban environments.
Pongprasert and Kubota, 2017 [51]Motorcycle taxi and walking usage
  • Motorcycle taxi services are the main barrier to pedestrians walking to stations.
  • Middle-adult aged residents, office employees, residents owning a car, and people living far from stations are less likely to walk.
  • Average income households and commuters during non-peak hours tend to use motorcycle taxis more.
  • Residents living far from stations tend to use motorcycle taxis less, because most of the motorcycle taxi services are located near transit stations.
Peraphan et al., 2017 [52]Motorcycle use in the mix of sustainable urban transport modes
  • Compared to cars, motorcycles are potentially the more sustainable means of transport.
  • Motorcycles need less space, consume fewer resources, and pollute less than cars with typically low occupancy.
  • Despite its apparent benefits, promotion of motorcycles can even worsen the sustainability of a transport system.
  • Implementation of certain mitigations, such as parking organization, can improve the outcomes.
Table 2. Methods for building specific attributes of reported trips (all modes).
ModeVariableApproach
Private CarDistanceGoogle map API
TimeGoogle map API
CostAverage (fuel cost + maintenance cost): 8533 vnd/km
Parking cost: 30,000 vnd/trip
Private MotorcycleDistanceGoogle map API
TimeGoogle map API
CostAverage (fuel cost + maintenance cost): 991 vnd/km
Parking cost: 5000 vnd/trip
BusStopsGoogle map API
TimeGoogle map API
CostGoogle map API
MC_RHSDistanceExtracted from RHS application
TimeExtracted from RHS application
Waiting timeExtracted from RHS application
CostExtracted from RHS application
Motorcycle taxiDistanceGoogle map API (equal to private motorcycle)
TimeGoogle map API (equal to private motorcycle)
CostApproximately 6000 vnd/1 km + 10,000 vnd
TaxiDistanceGoogle map API
TimeGoogle map API
CostAverage price of traditional taxi companies
Open: 11,000 vnd/0.748 km
From 0.748 km to 30 km: 15,100 vnd/km
From 31 km: 12,000 vnd/km
Waiting time: 3000 vnd/4 min
Car RHSDistanceExtracted from RHS application
TimeExtracted from RHS application
Waiting timeExtracted from RHS application
CostExtracted from RHS application
Table 3. Descriptive statistics.
AgeMissing (0.22%); 16–25 (35.86%); 26–35 (21.83%); 36–45 (12.69%); 46–55 (10.24%); 56–65 (15.81%); 66–75 (2.45%); 76–85 (0.89%)
GenderMissing (0.22%); male (53.45%); female (46.33%)
Household income (Mil. VND)Missing (2.67%); less than 5 (21.60%); 5–10 (22.49%); 10–15 (17.82%); 15–20 (10.24%); 20–25 (10.24%); more than 25 (14.92%)
OccupationMissing (3.56%); student (27.84%); employee in private organization (21.38%); employee in government agency (5.57%); freelancer (26.28%); part-time employee (3.56%); retired/unemployed and not looking for a job (11.80%)
Number of motorcycles in householdMissing (2.67%); 0 (3.56%); 1 (22.27%); 2 (39.64%); 3 (20.94%); 4 + (10.91%)
Number of cars in householdMissing (6.46%); 0 (67.26%); 1 (22.72%); 2+ (3.56%)
Distance home-bus stop (km)Missing (8.91%); 0–0.25 (22.27%); 0.25–0.5 (12.03%); 0.5–0.75 (28.29%); 0.75–1 (3.79%); 1–1.25 (12.69%); 1.25–1.5 (2.67%); >1.5 (9.35%)
Main mode before COVID-19Missing (0.89%); private motorcycle/car (76.61%); public bus (4.90%); public bus + taxi/motorcycle taxi/RHS (6.46%); taxi/motorcycle taxi/RHS (1.11%); walk/bicycle (10.02%)
Travel cost—VND (non-RHS)Missing (65.55%); less than 20,000 (16.27%); 20,001–40,000 (8.61%); 40,001–60,000 (5.26%); 60,001–80,000 (1.91%); 80,001–100,000 (0.96%); more than 100,001 (1.44%)
Travel cost—VND (RHS)Missing (1.67%); less than 20,000 (32.50%); 20,001–40,000 (37.92%); 40,001–60,000 (12.92%); 60,001–80,000 (6.67%); 80,001–100,000 (4.17%); more than 100,001 (4.17%)
Travel time—minute (non-RHS)Missing (0.00%); less than 10 (27.27%); 11–20 (35.41%); 21–30 (19.14%); 31–40 (5.74%); 41–50 (6.22%); 51–60 (4.31%); >61 (1.91%)
Travel time—minute (RHS)Missing (0.83%); less than 10 (21.25%); 11–20 (50.00%); 21–30 (20.42%); 31–40 (4.17%); 41–50 (1.67%); 51–60 (1.67%); >61 (0.00%)
Considering buying LEV and ZEVMissing (2.67%); absolutely disagree (1.34%); disagree (4.23%); neutral (16.26%); agree (31.85%); absolutely agree (43.65%)
Years of using smartphone (non-RHS)Missing (20.10%); less than 2 (1.91%); 2–4 (21.53%); 4–6 (15.31%); 6–8 (8.13%); 8–10 (22.49%); >10 (10.53%)
Years of using smartphone (RHS)Missing (6.25%); less than 2 (2.08%); 2–4 (10.00%); 4–6 (22.08%); 6–8 (27.08%); 8–10 (27.50%); >10 (5.00%)
Table 4. Model estimation results (N = 449).
VariableAlternativeMNLNL Model 1NL Model 2
Estimated Coefficient (t-Value in Parentheses)
Alternative specific constantsBus−5.18 (−5.21) ***−4.9 (−5.45) ***−5.83 (−5.08) ***
Car−6.4 (−5.23) ***−6.22 (−5.76) ***−7.14 (−3.90) ***
MC-Private−3.37 (−6.14) ***−0.981 (−2.20) *−1.03 (−2.24) *
Car-RHS−2.47 (−3.57) ***−2.29 (−3.67) ***−2.20 (−3.32) ***
Car-Taxi−10.3 (−5.62) ***−9.15 (−5.77) ***−10.9 (−3.52) ***
MC-Taxi −5.29 (−6.85) ***−1.35 (−2.06) *−1.41 (−2.11) *
Walk−6.22 (−4.66) ***−5.64 (−4.59) ***−5.84 (−4.44) ***
Nested parameter
(= 1/λMk)
Four-wheeled vehicles 0.748 (2.71) **
Two-wheeled vehicles 4.48 (2.00) *4.29 (2.08) *
Inclusive value λMk Two-wheeled vehicles 0.2230.233
AgeMC-Private −0.0698 (−3.32) ***−0.0852 (−4.31) ***−0.0833 (−4.25) ***
Car-RHS−0.135 (−5.30) ***−0.124 (−5.15) ***−0.131 (−4.71) ***
MC-RHS −0.146 (−6.59) ***−0.103 (−4.93) ***−0.102 (−4.89) ***
Bus−0.0748 (−3.03) **−0.0677 (−2.89) **−0.0639 (−2.74) **
Car-Private −0.0608 (−2.26) *−0.056 (−2.19) *−0.0473 (−1.64)
Car-Taxi 0.0143 (0.42) 0.0109 (0.347) 0.0364 (0.776)
MC-Taxi −0.0417 (−1.81) .−0.0782 (−3.81) ***−0.0759 (−3.73) ***
Considering buying LEV and ZEVCar-RHS & MC-RHS0.0482 (0.379) −0.0189 (−0.607) −0.017 (−1.09)
Bus0.508 (1.72) .0.476 (1.64) 0.459 (1.98) *
Walk0.543 (1.55) 0.509 (1.46) 0.299 (1.40)
Years of smartphone useCar-RHS 0.101 (2.21) *0.107 (2.54) *0.130 (2.48) *
MC-RHS0.00273 (0.0852) 0.000237 (0.0297) 0.00171 (0.201)
Travel costCar-RHS & MC-RHS−0.00304 (−0.588) −0.00315 (−1.04) −0.00322 (−0.968)
Bus0.0456 (0.608) 0.0455 (0.616) 0.0458 (0.616)
Car-Private & MC-Private−0.00399 (−0.469) −0.00307 (−0.400) −0.00306 (−0.344)
Car-Taxi & MC-Taxi0.00242 (0.633) −0.000995 (−0.404) −0.00117 (−0.434)
Travel timeBus−0.0192 (−1.29) −0.0181 (−1.25) −0.0188 (−1.26)
Car-RHS, Car-Taxi, Car-Private −0.014 (−0.592) −0.00672 (−0.344) −0.00782 (−0.378)
MC-RHS, MC-Taxi, MC-Private−0.0598 (−3.21) **−0.0519 (−2.97) **−0.0536 (−2.98) **
Walk−0.114 (−4.17) ***−0.111 (−4.09) ***−0.109 (−4.10) ***
Intention to buy car in the near futureCar-RHS 0.661 (1.67) .0.391 (1.09) 0.386 (1.01)
MC-RHS0.532 (2.00) *0.117 (1.31) 0.126 (1.36)
Number of cars in householdCar-RHS 0.778 (2.78) **0.751 (2.71) **0.724 (2.44) *
Car-Private1.69 (5.28) ***1.71 (5.38) ***1.88 (4.51) ***
Number of motorcycles in householdMC-RHS0.229 (1.94) .0.0935 (1.47) 0.0991 (1.52)
MC-Private 0.336 (2.84) **0.104 (1.51) 0.110 (1.56)
0/1 Dummy variable: trip starts during peak hoursCar-RHS −0.643 (−1.78) .−0.709 (−2.14) *−0.831 (−2.16) *
MC-RHS0.124 (0.496) 0.0342 (0.535) 0.0371 (0.554)
Number of estimated parameters353637
Initial log likelihood−933.6693−933.6693−933.669
Final log likelihood−576.3586−573.1078−572.871
Likelihood ratio test714.6214 ***721.1228 ***721.5967 ***
Adjusted McFadden’s Rho-squared0.3450.3480.347
Akaike Information Criterion1222.7171218.2161219.742
Bayesian Information Criterion1366.4631366.0691371.702
Notes: MC denotes motorcycle; significance codes: “***”: p < 0.001; “**”: p < 0.01; ‘*’: p < 0.05; ‘.’: p < 0.1.
Publisher’s Note: MDPI stays neutral with regard to jurisdictional claims in published maps and institutional affiliations.

