Article

Research on the Coordinated Development of Economic Development and Ecological Environment of Nine Provinces (Regions) in the Yellow River Basin

School of Geographical Sciences, Shanxi Normal University, Taiyuan 030030, China
*
Author to whom correspondence should be addressed.
Sustainability 2022, 14(20), 13102; https://doi.org/10.3390/su142013102
Submission received: 25 August 2022 / Revised: 5 October 2022 / Accepted: 10 October 2022 / Published: 13 October 2022

Abstract

:
An important manifestation of high-quality regional development is the coordination of economic development and the ecological environment. We used night light data and the net primary productivity (NPP) of vegetation to quantitatively analyze the economic development and ecological environment of nine provinces (regions) in the Yellow River Basin in 2005, 2010, 2015 and 2020, and explored the coupling coordination relationship between the two from temporal and spatial scales. The analysis results showed that: (1) The ecological value of the Yellow River Basin showed a declining–rising trend. In 2005, 2010, 2015 and 2020, the ecological value of the Yellow River Basin was 2290.67 billion yuan, 2140.11 billion yuan, 2304.49 billion yuan and 2387.55 billion yuan. (2) The light density was related to the economic development of the city, and the light density showed a steady increase. The light index increased from 0.0001–1.6534 in 2005 to 0.0029–5.055 in 2020. The hot spots of light density were concentrated in the capital cities of the provinces with relatively good economic development and were concentrated in the east; the cold spots were mainly concentrated in the relatively slow economic development areas in the west. (3) The degree of coordination between economy and ecology in the Yellow River Basin increased from 0.1757 in 2005 to 0.2529 in 2020. However, the coordination degree of the ecological economy in the basin has been in an unbalanced state for a long time, with huge development potential. (4) There was a huge gap in the degree of ecological coordination in the basin. In 2020, the most coordinated ecological economy was 0.519 in Chengdu, and the most unbalanced was 0.053 in the Yushu Tibetan Autonomous Prefecture.

1. Introduction

For a long time, the deterioration of ecological conditions and environmental pollution have been the key factors restricting the efficient and sustainable development of regions. With the rapid development of economy and society, the contradiction between regional economic development and the ecological environment has become more prominent [1]. Therefore, it is extremely important to protect the ecological environment and promote regional development at the same time. As an important economic belt in China, the Yellow River Basin has a very important impact on China’s economic and social development and ecological security (Figure 1). In the “Administrative Division of the Yellow River Basin” issued by the Yellow River Commission of the Ministry of Water Resources, the nine provinces of Qinghai, Gansu, Sichuan, Ningxia, Inner Mongolia, Shanxi, Shaanxi, Henan and Shandong were selected as the research objects. There are obvious differences in landform types, climatic conditions and precipitation between the regions in the basin. In 2020, the total population of the Yellow River Basin was 422 million, accounting for 29.92% of the country’s total, with a regional GDP of 25.39 trillion yuan, accounting for 24.99% of the country’s total. The Yellow River Basin is most strongly affected by the relationship between man and land, and the conflict between the ecological environment and the economy is significantly intensified. In recent years, studies on the Yellow River Basin have covered a variety of aspects. Recent research on the Yellow River Basin has focused on intangible cultural heritage [2], urban agglomeration analysis [3] and the harmonious development of economy and ecology [4].
In this context, it is necessary to study the coordinated development of economy and ecology in the nine provinces (regions) of the Yellow River Basin. Through a brief review of the literature on this topic (Section 2), we found that in the current study, the harmonization of economy and ecology is usually measured using a single indicator. It is difficult to represent the comprehensive development level of economic development and ecological environment with the single indicator system, leading to a deviation in research results. This paper uses night light data and the net primary productivity (NPP) of vegetation to quantitatively analyze the economic development and ecological environment of nine provinces (regions) in the Yellow River Basin in 2005, 2010, 2015 and 2020, and uses the coupling coordination model to analyze and discuss the coupling coordination relationship between them on both temporal and spatial scales. This study is based on the hypothesis of coordinated ecological and economic development under the high-quality development strategy of nine provinces (regions) in the Yellow River Basin. The objectives (motivations) of this study are to better understand the current status of high-quality development in the nine provinces (regions) of the Yellow River Basin and also to provide a reference for the study of economic and ecological coordination in other regions.
The research aims are as follows: (1) compare and evaluate the temporal and spatial characteristics of the economic development of nine provinces ( regions ) in the Yellow River Basin at different points in time during the study period; (2) analyze the temporal and spatial features of the ecological environment in nine provinces (regions) of the Yellow River Basin at different points in time during the study period; (3) measure the degree of coordination between economy and ecology in nine provinces (regions) of the Yellow River Basin and analyze their spatial and temporal evolution features during the study period.
The contributions of this study are as follows. Firstly, different from previous indicator models, the economy is represented by light data and the ecology is represented by the net primary productivity of vegetation to analyze their coupling degree, which enriches the relevant research methods. Secondly, the spatial and temporal characteristics of economic and ecological coordination in the Yellow River Basin are studied to provide important support for the high-quality development of the Yellow River Basin.

2. Literature Review

The relationship between economic development and the ecological environment has been studied earlier. As early as 1962, American biologist Rachel Carson, in her book Silent Spring, described the environmental damage caused by traditional economic growth by analyzing the pollution of pesticides in the ecological environment [5]; Grossman GM and Krueger AB put forward the Kuznets curve theory according to the trend of economic growth and environmental change, and believed that the relationship curve between economy and environment is in an inverted U shape [6]. Currently, in the context of high-quality economic development, there are more and more studies related to economic development and ecological environment. Studies on the coordination of economic development and the ecological environment can be classified according to different criteria.
First, according to the evaluation model, Han [7] analyzed the coordination relationship between economic self-resource and environment systems using the obstacle model and coupled coordination evaluation model; Liu [8] studied the coupled coordination mechanism of socio-economic and water environmental systems using the coupled coordination evaluation model, scissor difference model and projection tracking model; Xu [9] analyzed the coordination between economic growth and resources and environment using the environmental Kuznets model; Sui [10] analyzed the degree of coupling and coordination of the energy–environment–economy system using a resource–environment complex system; Zhang [11] and Liu [12] used the geographically weighted regression (GWR) model to analyze the coupling and coordination level of the regional environment and economy; Zhang [13] used the Tapio decoupling model and STIRPAT model to analyze the economic output and water environmental stress in the Yangtze River Basin and made relevant recommendations.
Secondly, related studies can be divided according to the coupling of different economic forms with environmental factors; for example, agricultural economy and agricultural environment [14], mineral resources development and ecology of mining area [15,16], coordinated analysis of fishery resources and ecological carrying capacity [17], tourism economy [18], urbanization and ecological environment [19,20], economic development and water environment quality [21] and marine ecology [22].
Finally, studies have been divided according to study regions. Liu et al. [23,24] studied the coupling and coordination relationship between economic development and carbon emissions at the national level; An et al. [25,26,27] analyzed the coordinated relationship between economy and ecology in the Yellow River Basin; Yuan et al. [28,29] analyzed the coordinated relationship between economy and ecology in the Yangtze River Basin; Wang et al. [30,31,32,33] studied the coordinated development of economy and ecology at provincial and municipal levels.
The analysis of related studies reveals a variety of approaches and that the subject of research is not limited to simple economic development and the ecological environment but can also include the coordination of different economic forms and the ecological environment. The study area is also refined from national to provincial and municipal, providing suggestions for more microscopic regional development. Most existing studies and evaluation models use a system of indicators to measure the coupling between economy and ecology, but the values in the indicator system may be subject to errors. Therefore, the use of objective data such as light data and the net primary productivity of vegetation can ensure the objectivity of the results obtained.

3. Materials and Methods

3.1. Materials

Night light image data have the characteristics of timeliness, wide coverage, high sensitivity and independence, and they are widely used in meteorological monitoring, population density evaluations, land-use surveys, socioeconomic evaluations, etc. [34,35,36]. At present, the commonly used global nighttime light data mainly come from the polar orbiting satellite program DMSP/OLS nighttime light images and the new generation of earth observation satellite NPP/VIIRS nighttime light images. Among them, DMSP/OLS images can provide nighttime light data from 1992 to 2013, and NPP/VIIRS images can provide nighttime light data from 2012 and later. However, the data scale of the DMSP/OLS images and NPP/VIIRS images is inconsistent, resulting in discontinuities between images in nighttime lights. In order to reflect the long-term dynamic changes in nighttime lighting data, this paper integrates two types of nighttime lighting images, DMSP/OLS and NPP/VIIRS. The steps are as follows: (1) Data extraction. In order to avoid the error caused by the deformation of the image grid, the night light image is extracted from the administrative area and is converted to the Lambert equal-area azimuth projection coordinate system. (2) DMSP/OLS data correction [37]. Jixi City, Heilongjiang Province was selected as the invariant target area, and with F162007 as the benchmark image, the invariant target method is used to establish a univariate quadratic regression model, and the DMSP/OLS data are regressed and corrected. In view of the difference in the image data of the different sensors within the year [38], the regression-corrected data are fused within the year, and the interannual correction is performed on the basis of the intra-year fusion correction to improve the continuity between the light images. (3) NPP/VIIRS data correction. The outliers in the NPP/VIIRS monthly images are removed via the economic intensity method, the processed monthly images are merged into the annual images, and the bright value pixels in the corrected 2013 DMSP/OLS images are used as masks [39] to extract the corresponding pixels in the NPP/VIIRS annual imagery from 2012 to 2019, which are stable pixels. (4) Night light data corrections. Calculate the sum of the night lights at the county level in the corrected DMSP/OLS images and NPP/VIIRS images in 2012 and 2013, and combine the quadratic regression equations to analyze the DMSP/OLS images; then, an NPP/Regression analysis is carried out on the sum of the night lights of the VIIRS images, and the established regression model is used to fit the NPP/VIIRS data in 2015 and 2020 to the DMSP/OLS data scale, and the integrated 2005, 2010, 2015 and 2020 data are obtained. The nighttime light data of the Yellow River Basin in 2005 were selected on this basis, and the nighttime light data of Yellow River Basin in 2005, 2010, 2015 and 2020 were selected as the basic data of this study.
The MODIS17A3 remote-sensing data of the Yellow River Basin in 2005, 2010, 2015 and 2020 were from the NASA website (https://ladsweb.modaps.eosdis.nasa.gov/search/order/1) (accessed on 10 May 2022). The space resolution was 500 m × 500 m. These data were obtained by referring to the BIOME-BGC model and the light energy utilization model to obtain the NPP of the terrestrial ecosystem [40]. In order to facilitate the mask extraction of the data, the map projection conversion tool in ENVI5.3 was used to project the data to a Lambert Conformal Conic suitable for the study area, and its central meridian was 105° E. The standard parallels were 30° N and 62° N, and the geographic coordinate system was the Beijing 54 coordinate system (GCS_Beijing_1954). According to the MODIS17A3 data product description, its valid values are 0–65500, and the values outside this range are invalid. Then we performed the extraction of valid values. The unit of the NPP data in MODIS17A3 was kgC/m2/a. In order to facilitate the display of the NPP data, the unit of the NPP was converted to gC/m2/a; the vector file of the Yellow River Basin was used to extract the mask of the above processed data to obtain the NPP data of the Yellow River Basin in 2005, 2010, 2015 and 2020.

3.2. Methods

(1) Construction of a regional economic development index. The total nighttime light intensity and nighttime light density can both characterize regional economic development. High-brightness areas have obvious urban agglomeration effects and high social and economic development levels. Low-brightness development areas have a low population and economic density, and a low land use intensity [41,42]. In this paper, the night light density of the administrative region was used as the regional economic development index to calculate the regional economic development level of the prefectures, cities and counties in the Yellow River Basin in 2005, 2010, 2015 and 2020. The formula is as follows:
D N L = i = 1 n D N i / n
In the formula: DNL is the nighttime light density; DNi is the gray value of the i pixel in the nighttime light image; n is the total number of pixels.
(2) Ecological value assessment. The ecological value can be divided into three parts: the value of the organic matter produced by vegetation, the value of the fixed CO2 and the value of the released O2. According to the photosynthesis equation, the mass ratio of primary productivity to CO2 and O2 is 100:163:120, and the respective material amounts of the three can be calculated. The ecological value is obtained uniformly in the form of price [43], and the formula for calculating the value of organic matter is:
N v t = N P P 5 0.45 × c
In the formula: Nvt is the value of organic matter in year t; 0.45 is the carbon content rate of the NPP; c is the unit price of standard coal, using the 2017 annual average price of 5500 kcal thermal coal with a relatively stable price of 611.7 yuan/t, equivalent to the unit price of standard coal, which is 480.6 yuan/t, c = 480.6 yuan/t. The oxidation ratio of vegetation NPP affects the terrestrial carbon sink [44]. The photosynthesis equation is used to measure CO2 and O2, and the carbon tax method and the oxygen production cost method are used to calculate the value of vegetation fixed CO2 and released O2 [45]. The carbon tax conversion cost is 702.95 yuan/t, and the oxygen production cost is 400 yuan/t [46]. Finally, we calculated the ecological value. The formula for calculating the annual mean value of the ecological value of vegetation in 2020 is:
E v t = N P P t × ( c 0.45 + 702.95 + 400 )
In the formula: Evt is the annual average value of the ecological value of vegetation in year t.
(3) Evaluation of ecological and economic coordination. The coupling coordination degree model is used to describe the interaction and interrelated coordinated development degree between regional economic development and ecological environment (Table 1). The model formula is:
D = C × T
C = 2 ( U 1 × U 2 ) / ( U 1 + U 2 )
T = α U 1 + β U 2
In the formula: D is the coupling coordination degree; it is composed of the coupling degree index C and the comprehensive coordination index T. D∈ [0, 1], the closer D is to 1, the higher the degree of coupling coordination. U1 and U2 represent economic development and ecological environment carrying capacity, respectively, and α and β are weight coefficients; let α = β = 0.5, economic development and ecological environment carrying capacity have equal contributions [47].

4. Results

4.1. The Spatiotemporal Pattern of the Yellow River Basin’s Economic Index

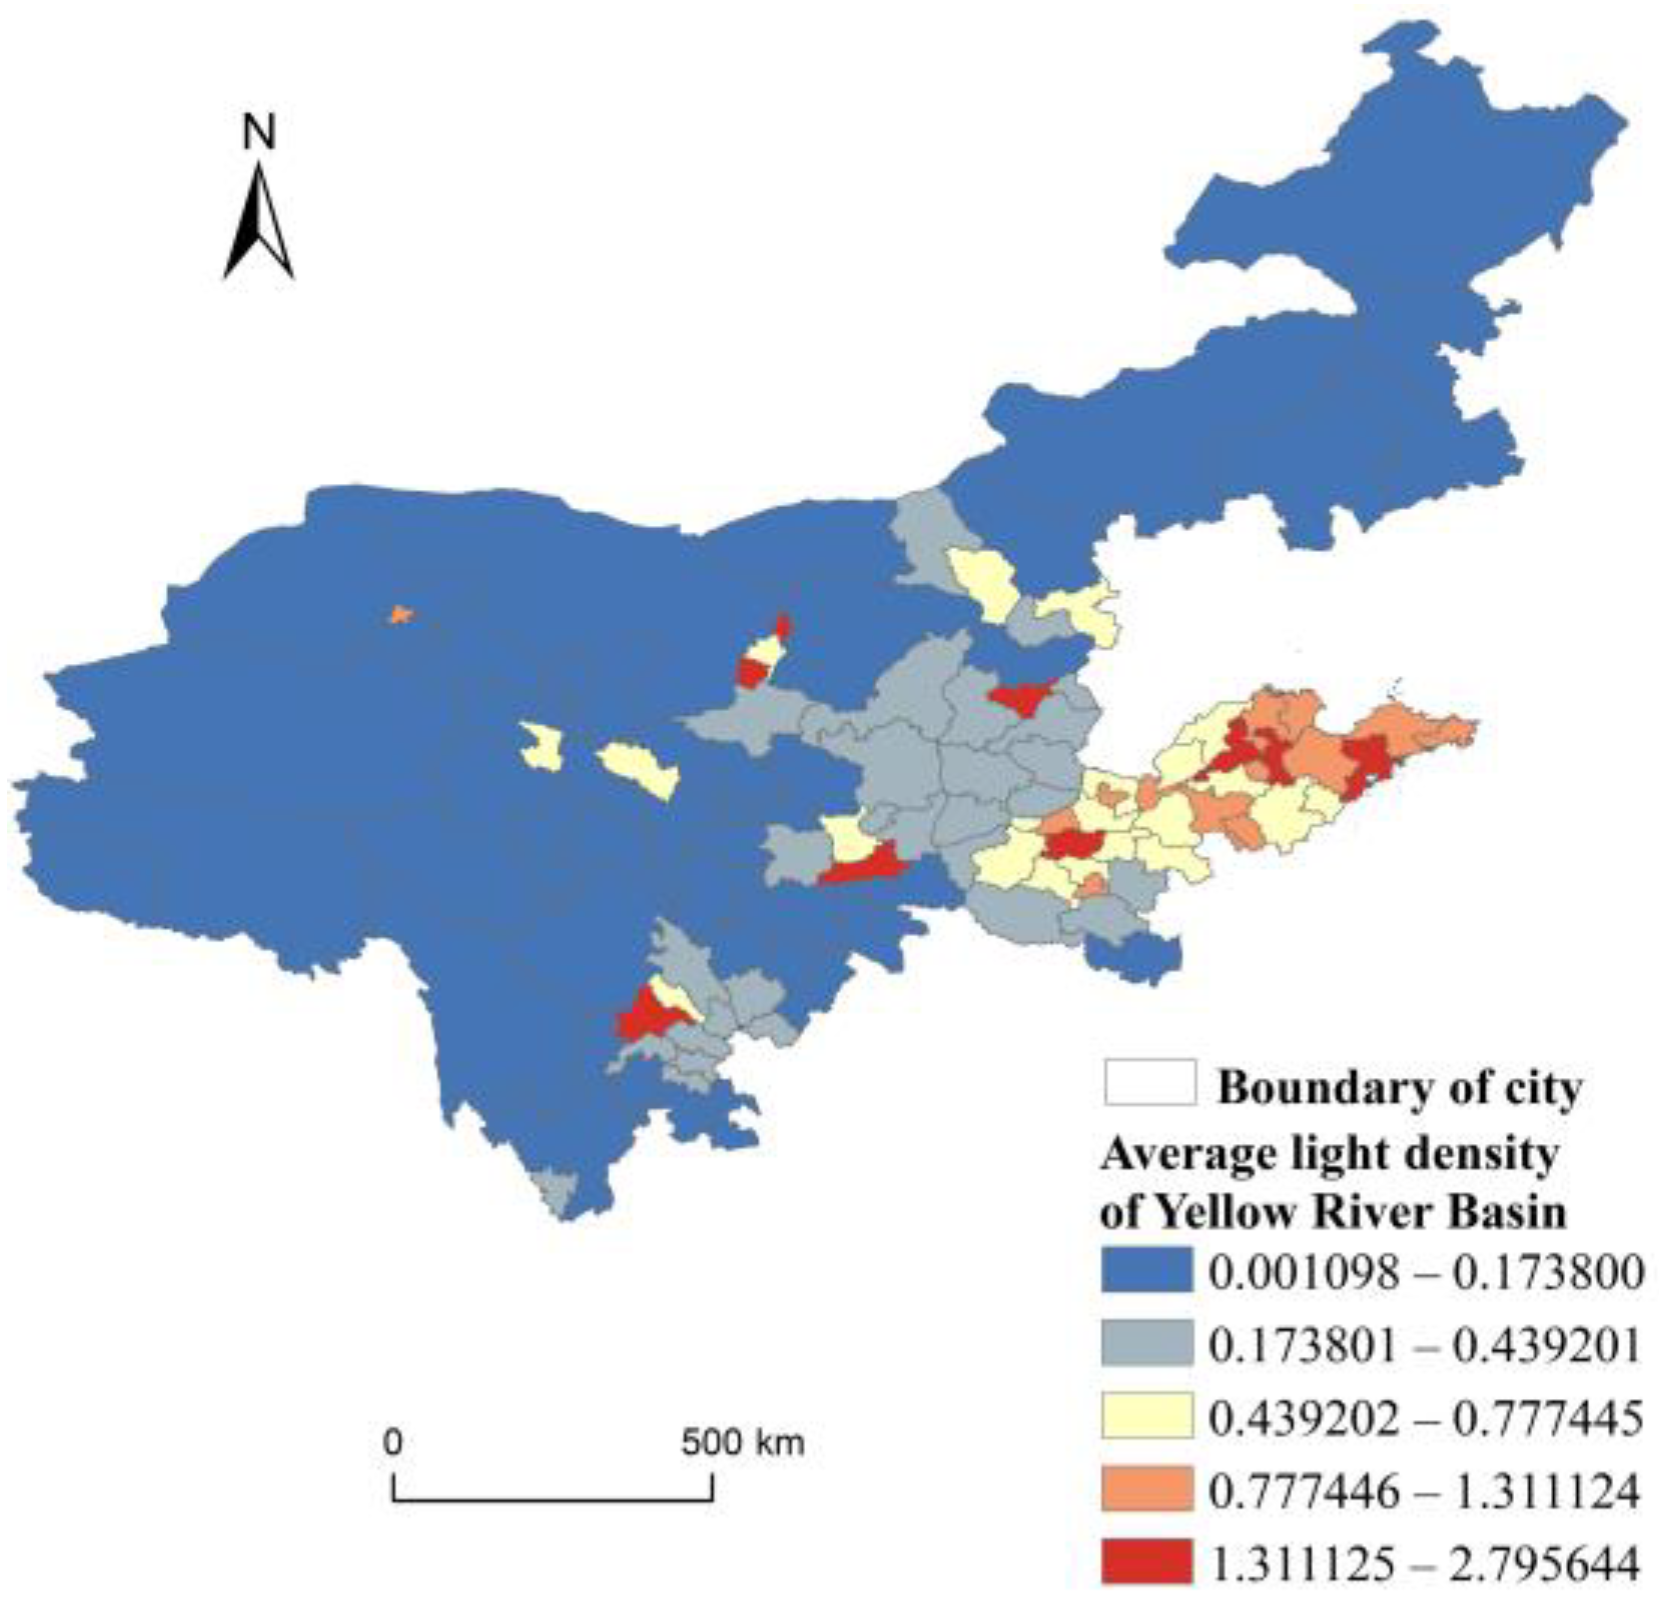
  • Change characteristics of the economic index: The average economic index of the Yellow River Basin (Figure 2) and the economic index of the Yellow River Basin in each year (Figure 3) were generated through light data processing. The economic index of the Yellow River Basin in 2005 was 0.00010–1.65340, the economic index in 2010 was 0.00019–1.76513, the economic index in 2015 was 0.00112–3.33750 and the economic index in 2020 was 0.00291–5.0547. In general, the economic index of the Yellow River Basin based on nighttime light data showed a steady upward trend. Among them, the economic index from 2005 to 2010 had a small increase, and the economic growth of the Yellow River Basin was relatively slow during this period; from 2010 to 2015, the economic index of the Yellow River Basin increased significantly regardless of the maximum value or the minimum value. At this stage, the economy of the Yellow River Basin was developing rapidly; from 2015 to 2020, the minimum value of the economic index in the Yellow River Basin changed little, and the maximum value increased significantly. This shows that the economically developed regions are growing rapidly, while the less developed regions have little economic change, and then the regional differences are further widened.
2.
Spatial distribution characteristics of the economic index: It can be seen from Figure 2 that the economic index in the Yellow River Basin generally showed a trend of high in the east and low in the west, and high in the south and low in the north. The areas with a high economic index were concentrated in the eastern region, which is consistent with the actual situation of the economic development level in the eastern region. In the west, Chengdu, Yinchuan, Xi’an and other provincial capitals had high light densities, while other cities were at lower densities, indicating that the western economy is in poorer condition. In addition, the large area of the western cities is one of the reasons for its low light density. It is worth mentioning that Wuhai City in the Inner Mongolia Autonomous Region had a high economic index, which is related to the small area of the city. Secondly, Wuhai City is rich in natural resources, which promotes local economic development.

4.2. Temporal and Spatial Pattern of NPP in the Yellow River Basin

  • Through calculations, the NPP of the Yellow River Basin in 2005, 2010, 2015 and 2020 was 399.946 gC·m−2·a−1, 366.798 gC·m−2·a−1, 415.639 gC·m−2·a−1 and 410.667 gC·m−2·a−1, respectively, showing a rising trend in general. Combined with Figure 4, it was found that from 2005 to 2010, the minimum and maximum values of the NPP in the Yellow River Basin decreased significantly, mainly because the extensive economic development pattern at that time caused damage to the ecological environment; the minimum value of the NPP in the Yellow River Basin from 2010 to 2015 was unchanged and the maximum value showed an upward trend. At this stage, the Yellow River Basin had transformed the economic development mode, the ecological environment had been effectively improved and the ecological environment of the region with a better ecological background continued to improve; from 2015 to 2020, the NPP in the Yellow River Basin was the smallest. The value increased, and the maximum value changed less. This shows that at this stage, the areas with poor ecological backgrounds began to focus on ecological construction, so that the NPP value of such areas was improved.
Figure 4. Distribution of NPP in each year in Yellow River Basin.
Sustainability 14 13102 g004
2.
From Figure 5, it can be concluded that the mean NPP of the Yellow River Basin showed was high in the south and low in the north. The high-value areas of the NPP were Ya’an City, the Liangshan Yi Autonomous Prefecture and Panzhihua City. These cities are all part of Sichuan Province and have good climatic conditions with relatively abundant precipitation. Good natural conditions provide an excellent foundation for plant growth. The areas with low NPP values were mainly located in the inland areas, such as Wuhai, Golmud and Alashan League. Due to the arid climate, the terrain here is dominated by desert and sandy land, and the vegetation is sparse, so the NPP in this area is low.
Figure 5. Average NPP of Yellow River Basin.
Sustainability 14 13102 g005

4.3. Evaluation of the Economy and Ecology Coordination Relationship in the Yellow River Basin

  • Spatial distribution of the ecological value: In 2020, the ecological value of the Yellow River Basin was 2387.5 billion yuan, accounting for 9.75% of the Yellow River Basin’s GDP in 2020. The Garze Tibetan Autonomous Prefecture, Liangshan Yi Autonomous Prefecture and Aba Tibetan and Qiang Autonomous Prefecture had the highest ecological value, all above 75 billion yuan; Wuhai, Jiayuguan and Jiyuan had the lowest ecological value, all below 1.4 billion yuan. In 2020, the average ecological value per unit area of the Yellow River Basin was 891,536.856 yuan/km2, and the ecological value per unit area of Ya’an, the Liangshan Yi Autonomous Prefecture and Panzhihua ranked top three, of which Ya’an had the highest unit ecological value, which was 1,827,897.499 yuan/km2; the ecological value per unit area of Wuhai, Golmud and the Yushu Tibetan Autonomous Prefecture was the lowest, and the ecological value per unit area of Wuhai was the lowest, which was 198,099.6844 yuan/km2. Overall, the spatial distribution of the ecological values was high in the south and low in the northwest.
  • The coordinated development degree of the ecology and economy in the Yellow River Basin (Figure 6): The economic and ecological coordination degrees of the Yellow River Basin in 2005, 2010, 2015 and 2020 were calculated, and they were 0.1757, 0.1873, 0.2204 and 0.2529, respectively, which were in a serious imbalance stage. Overall, the degree of ecological and economic coordination in the Yellow River Basin had not changed much, showing a steady upward trend. In 2020, the economic and ecological coordination of the Yellow River Basin was the most coordinated, with a coordination degree of 0.2529. From 2005 to 2010, the coordination degree of the Yellow River Basin had the smallest increase, and the coordination state was still in the category of serious imbalance and decline. From 2010 to 2015, the coordination degree of the Yellow River Basin improved the most, and the type of coordination degree also changed into the category of moderate imbalance and decline. From 2015 to 2020, although the coordination degree of the Yellow River Basin was still in the category of moderate imbalance and decline, the ecological and economic coordination degree continued to rise, indicating that the ecological environment of the Yellow River Basin was improving.
  • Temporal and spatial changes in ecological and economic harmonization (Table 2): In general, the degree of ecological and economic coupling and coordination among cities in the Yellow River Basin was mostly within the range of unbalanced and attenuated coupling (Figure 7). However, there was an upward trend in the economic and ecological coordination of most cities in the basin from 2005 to 2020. The cities whose coupling coordination interval was in the deregulation and degeneration category decreased from 107 in 2005 to 77 in 2020, and most of them were in the moderate deregulation degeneration category in 2020. In 2020, Chengdu’s ecological and economic coupling coordination degree was the highest, at 0.5194, reaching the barely coupling coordination category. However, the Yushu Tibetan Autonomous Prefecture, which had the lowest level of coupling coordination, had been in a state of serious imbalance. Although the Yushu Tibetan Autonomous Prefecture is rich in plant resources, its economic level is low, so the ecological economy is extremely incongruous.

5. Discussion

In this paper, the harmonious relationship between economy and ecology in the cities of nine provinces (districts) in the Yellow River Basin showed an increasing trend in time, which is consistent with previous studies [4,12,46]. In terms of spatial characteristics, the ecological and economic coordination relationships among the municipalities in the basin showed a decreasing pattern from downstream to upstream and from coastal to inland, and Shi [48] reached a similar conclusion in his study. However, there are both similarities and differences in the findings of studies on the coordinated development of regional economy and ecology. In Liu’s [12] study on the coupled ecological–economic and coordinated development of cities in the Yellow River Basin, the hot spots were considered to be distributed in Zhengzhou, the Shandong Peninsula and Hu-Bao-E-Yu city cluster, while the cold spots were distributed in the Loess Plateau. Second, in the study on the coordination analysis of socio-economic and resource environment in the central cities of the Yellow River Basin [27], Li concluded that Xining and Lanzhou have the highest degree of coupling. The difference in the indicators used in the coupled models caused different results from those in this paper.
The innovation of this paper is to break through the original index system for evaluating economic or ecological and to propose the use of night light data to characterize the level of economic development and vegetation net primary productivity to characterize ecological environments for the study of the coordinated development of regional economy and ecology, which expands the related research methods.
This study has some limitations. Firstly, this study only analyzes the coordination of economy and ecology in prefecture level cities, while microscopic studies of counties are lacking. Second, it needs further discussion whether the weight of economic development and the ecological environment in coupled coordination should vary with different regions. Therefore, subsequent studies on coordinated ecological and economic development should be conducted from a micro and dynamic perspective.

6. Conclusions

6.1. Conclusion

The economic index and ecological value of the Yellow River basin in 2005, 2010, 2015 and 2020 were calculated using night light data and the net vegetation value index, from which the economic level and ecological status of the Yellow River Basin municipalities were obtained. The coordination of the two was analyzed via a coupled coordination model. From 2005 to 2020, the GDP of the Yellow River Basin increased from 513.253 billion yuan to 253.861 billion yuan, so its economic development index will continue to rise. In terms of spatial distribution, it showed a spatial distribution pattern of a high economic development index in the downstream, which is consistent with the downstream provinces such as Shandong Province and Henan Province, whose GDP is at the top of the basin. From 2005 to 2020, the overall ecological value of the Yellow River Basin showed a downward–upward trend, which is related to the neglect of the ecological environment in early economic development and the importance of the ecological environment in current high-quality economic development. In terms of the spatial pattern, the overall ecological value was generally high in the south and low in the north. This is because the climate in the south is more humid than that in the north, which is suitable for the growth of vegetation. The ecological and economic coordination in the Yellow River Basin had gone through three stages of change. From 2005 to 2010, the degree of ecological and economic coordination in the Yellow River Basin increased, mainly because the level of economic development increased after 2005, but it was not strong and had little impact on the ecological environment; from 2010 to 2015, the degree of ecological and economic coordination in the Yellow River Basin showed an upward trend, and the relationship between ecology and economy tended to be coordinated, which is related to the implementation of environmental protection policies; from 2015 to 2020, the degree of ecological and economic coordination in the basin continued to increase and gradually move toward coordination.

6.2. Policy Enlightenment

The results of this study showed that the degree of ecological coordination varied considerably among the different areas in the basin. For example, the ecological and environmental conditions in the upstream areas were good but relatively fragile. In addition, the economic level of the upstream area was low and the production methods were relatively crude. Therefore, its ecological and environmental protection pressure was higher and its ecological and economic coordination was the lowest. So, the upstream area should continue to adhere to environmental protection policies and promote the rational allocation of resources. The midstream area has a poor ecological environment, mostly located in arid areas with few plant resources. The level of economic development was low, mainly in terms of industry, and the degree of coordination between ecology and economy was low. The midstream region should continue to adhere to the green development approach, promote industrial transformation and upgrading, achieve high-quality development and further improve the level of resource intensification; the downstream region and Sichuan Basin have developed economies, rich plant resources, and a good ecological and economic coordination. The region should continue to adhere to the strict protection of the ecological environment while promoting higher-quality economic development. Secondly, the cities should break administrative barriers and build a platform for sharing the fruits of green development to help regional development.

6.3. Future Research

This paper can be an effective supplement to the current methods for studying the coordinated development of economy and ecology and can also provide a reference for other scholars’ future research. In the future, we should continue to enrich the research methods in order to have a more accurate understanding of the development of the region. In addition, the weights of the coordination model in this study are half for each of the two subsystems of economic development and ecological environment, and future studies will distribute the weights of each system more rationally.

Author Contributions

Conceptualization, Z.Z.; methodology, Z.Z. and H.L.; software, Z.Z., H.L. and Y.C.; validation, Z.Z. and H.L.; formal analysis, Z.Z. and H.L.; investigation, Y.C. and H.L.; resources, Z.Z. and H.L.; data curation, Z.Z. and H.L.; writing—original draft preparation, Z.Z., H.L. and Y.C.; writing—review and editing, Z.Z., H.L. and Y.C.; visualization, Y.C. and H.L.; supervision, Z.Z.; project administration, Z.Z.; funding acquisition, Z.Z. All authors have read and agreed to the published version of the manuscript.

Funding

This research was funded by the Research on 5G+ “Tourism Planning of Shanxi Yellow River”, grant number HH202005, and the Research Project on the Collaborative Mechanism and Management Model of Postgraduate Political and Ideological Education in the New Era, grant number 2021YJJG146.

Institutional Review Board Statement

Not applicable.

Informed Consent Statement

Not applicable.

Data Availability Statement

Not applicable.

Acknowledgments

We express our gratitude to anonymous reviewers and editors for their professional comments and suggestions.

Conflicts of Interest

The authors declare no conflict of interest.

References

  1. Harte, M.J. Ecology, sustainability, and environment as capital. Ecol. Econ. 1995, 15, 157–164. [Google Scholar] [CrossRef]
  2. Zhang, Z.W.; Li, Q.; Hu, S.X. Intangible Cultural Heritage in the Yellow River Basin: Its Spatial–Temporal Distribution Characteristics and Differentiation Causes. Sustainability 2022, 14, 11073. [Google Scholar] [CrossRef]
  3. Zhang, Z.W.; Liu, Y.F. Spatial Expansion and Correlation of Urban Agglomeration in the Yellow River Basin Based on Multi-Source Nighttime Light Data. Sustainability 2022, 14, 9359. [Google Scholar] [CrossRef]
  4. Wei, W.; Jin, C.G.; Han, Y.; Huang, Z.H.; Niu, T.; Li, J.K. The Coordinated Development and Regulation Research on Public Health, Ecological Environment and Economic Development: Evidence from the Yellow River Basin of China. Int. J. Environ. Res. Public Health 2022, 19, 6927. [Google Scholar] [CrossRef]
  5. Thorson, R.; Rachel, C. Silent Spring and Other Writings on the Environment. By Rachel Carson. Edited by Sandra Steingraber. Environ. History 2019, 8, 965–968. [Google Scholar]
  6. Grossman, G.M.; Krueger, A.B. Economic growth and the environment. Q. J. Econ. 1995, 110, 353–377. [Google Scholar] [CrossRef] [Green Version]
  7. Han, H.; Guo, L.; Zhang, J.Q.; Zhang, K.Z.; Cui, N.B. Spatiotemporal analysis of the coordination of economic development, resource utilization, and environmental quality in the Beijing-Tianjin-Hebei urban agglomeration. Ecol. Indic. 2021, 127, 107724. [Google Scholar] [CrossRef]
  8. Yi, L.; Li, Y.Y.; Wei, J. Coupling coordination and spatiotemporal dynamic evolution between social economy and water environmental quality—A case study from Nansi Lake catchment, China. Ecol. Indic. 2020, 119, 106870. [Google Scholar]
  9. Xu, J.W.; Fu, Z.Q.; Xie, Y.Y.; Wu, N.; Li, L.L. Analysis of the Coordination between Economic Growth and Resources and Environment Based on EKC Hypothesis—Taking Tieling City as an Example. J. Environ. Eng. Technol. 2016, 6, 290–294. [Google Scholar]
  10. Sui, X.T.; Wang, X.H.; Zhao, L.D. Using the resource-environment-economy coordination degree model to guide China’s national blue bay remediation action plan in Qingdao. J. Oceanol. Limnol. 2020, 38, 1846–1857. [Google Scholar] [CrossRef]
  11. Zhang, Q.; Shen, J.Q.; Sun, F.H. Spatiotemporal differentiation of coupling coordination degree between economic development and water environment and its influencing factors using GWR in China’s province. Ecol. Model. 2021, 462, 109794. [Google Scholar] [CrossRef]
  12. Liu, K.; Qiao, Y.R.; Shi, T.; Zhou, Q. Study on coupling coordination and spatiotemporal heterogeneity between economic development and ecological environment of cities along the Yellow River Basin. Environ. Sci. Pollut. Res. 2020, 28, 6898–6912. [Google Scholar] [CrossRef] [PubMed]
  13. Zhang, Y.Y.; Sun, M.Y.; Yang, R.J.; Li, X.H.; Zhang, L.; Li, M.Y. Decoupling water environment pressures from economic growth in the Yangtze River Economic Belt, China. Ecol. Indic. 2021, 122, 107314. [Google Scholar] [CrossRef]
  14. Yao, L.; Halike, A.; Wei, Q.; Tang, H.; Tuheti, B. Research on Coupling and Coordination of Agro-Ecological and Agricultural Economic Systems in the Ebinur Lake Basin. Sustainability 2022, 14, 10327. [Google Scholar] [CrossRef]
  15. Wu, W.J.; Zhou, J.S.; Niu, J.Y.; Lv, H.D. Study on coupling between mineral resources exploitation and the mining ecological environment in Yellow River Basin. Environ. Dev. Sustain. 2021, 23, 13261–13283. [Google Scholar] [CrossRef]
  16. Chen, X.H.; Zhou, F.Y.; Hu, D.B.; Yi, G.D.; Cao, W.Z. An improved evaluation method to assess the coordination between mineral resource exploitation, economic development, and environmental protection. Ecol. Indic. 2022, 138, 108808. [Google Scholar] [CrossRef]
  17. Huang, H.; Wang, Z.Y.; Li, Y.D.; Zhao, X.; Wang, Z.H.; Cheng, X.P. Fishery Resources, Ecological Environment Carrying Capacity Evaluation and Coupling Coordination Analysis: The Case of the Dachen Islands, East China Sea. Front. Mar. Sci. 2022, 9, 651. [Google Scholar] [CrossRef]
  18. Liu, Y.M.; Suk, S.H. Coupling and Coordinating Relationship between Tourism Economy and Ecological Environment—A Case Study of Nagasaki Prefecture, Japan. Int. J. Environ. Res. Public Health 2021, 18, 12818. [Google Scholar] [CrossRef]
  19. Liao, S.J.; Wu, Y.; Wong, S.W.; Shen, L.Y. Provincial perspective analysis on the coordination between urbanization growth and resource environment carrying capacity (RECC) in China. Sci. Total Environ. 2020, 730, 138964. [Google Scholar] [CrossRef]
  20. Ye, C.; Pi, J.W.; Chen, H.Q. Coupling Coordination Development of the Logistics Industry, New Urbanization and the Ecological Environment in the Yangtze River Economic Belt. Sustainability 2022, 14, 5298. [Google Scholar] [CrossRef]
  21. Zhu, H.; Zhu, J.S.; Zou, Q. Comprehensive Analysis of Coordination Relationship between Water Resources Environment and High-Quality Economic Development in Urban Agglomeration in the Middle Reaches of Yangtze River. Water 2020, 12, 1301. [Google Scholar] [CrossRef]
  22. Audzijonyte, A.; Pethybridge, H.; Porobic, J.; Gorton, R.; Kaplan, I.; Fulton, E.A. Atlantis: A spatially explicit end-to-end marine ecosystem model with dynamically integrated physics, ecology and socio-economic modules. Methods Ecol. Evol. 2019, 10, 1814–1819. [Google Scholar] [CrossRef] [Green Version]
  23. Lu, C.Y.; Liu, X.W.; Zhang, T.; Huang, P.; Tang, X.L.; Wang, Y.J. Comprehensive Measurement of the Coordinated Development of China’s Economic Growth, Energy Consumption, and Environmental Conservation. Energies 2022, 15, 6149. [Google Scholar] [CrossRef]
  24. Ji, J.W.; Tang, Z.Z.; Zhang, W.W.; Liu, W.L.; Jin, B.; Xi, X.; Wang, F.T.; Zhang, R.; Guo, B.; Xu, Z.Y.; et al. Spatiotemporal and Multiscale Analysis of the Coupling Coordination Degree between Economic Development Equality and Eco-Environmental Quality in China from 2001 to 2020. Remote Sens. 2022, 14, 737. [Google Scholar] [CrossRef]
  25. An, S.; Zhang, S.L.; Hou, H.P.; Zhang, Y.Y.; Xu, H.N.; Liang, J. Coupling Coordination Analysis of the Ecology and Economy in the Yellow River Basin under the Background of High-Quality Development. Land 2022, 11, 1235. [Google Scholar] [CrossRef]
  26. Xin, Y.; Liu, X.Y. Coupling driving factors of eco-environmental protection and high-quality development in the yellow river basin. Front. Environ. Sci. 2022, 10, 1237. [Google Scholar] [CrossRef]
  27. Li, H.M.; Jiang, Z.M.; Dong, G.H.; Wang, L.Y.; Huang, X.; Gu, X.; Guo, Y.J. Spatiotemporal Coupling Coordination Analysis of Social Economy and Resource Environment of Central Cities in the Yellow River Basin. Discret. Dyn. Nat. Soc. 2021, 2021, 6637631. [Google Scholar] [CrossRef]
  28. Yuan, L.; Li, R.; He, W.; Wu, X.; Kong, Y.; Degefu, D.M.; Ramsey, T.S. Ramsey Thomas Stephen. Coordination of the Industrial-Ecological Economy in the Yangtze River Economic Belt, China. Front. Environ. Sci. 2022, 10, 451. [Google Scholar] [CrossRef]
  29. Yin, Y.Q.; Xu, Z.X. The Coupling Synergy Effect of Economic and Environment in Developed Area: An Empirical Study from the Yangtze River Delta Urban Agglomeration in China. Int. J. Environ. Res. Public Health 2022, 19, 7444. [Google Scholar] [CrossRef]
  30. Wang, W.L.; Gong, J.; Yang, W.Y.; Zeng, J.Y. The Ecology-Economy-Transport Nexus: Evidence from Fujian Province, China. Agriculture 2022, 12, 135. [Google Scholar] [CrossRef]
  31. Chen, J.H.; Zhang, W.P.; Song, L.; Wang, Y.F. The coupling effect between economic development and the urban ecological environment in Shanghai port. Sci. Total Environ. 2022, 841, 156734. [Google Scholar] [CrossRef]
  32. Liu, Y.Z.; Yang, R.J.; Sun, M.Y.; Zhang, L.; Li, X.J.; Meng, L.Y.; Wang, Y.Z.; Liu, Q. Regional sustainable development strategy based on the coordination between ecology and economy: A case study of Sichuan Province, China. Ecol. Indic. 2022, 134, 108445. [Google Scholar] [CrossRef]
  33. Zhu, S.C.; Huang, J.L.; Zhao, Y.L. Coupling coordination analysis of ecosystem services and urban development of resource-based cities: A case study of Tangshan city. Ecol. Indic. 2022, 136, 108706. [Google Scholar] [CrossRef]
  34. Ma, T.; Zhou, Y.K.; Zhou, C.H.; Haynie, S.S.; Pei, T.; Xu, T. Night-time light derived estimation of spatio-temporal characteristics of urbanization dynamics using DMSP/OLS satellite data. Remote Sens. Environ. 2015, 158, 453–464. [Google Scholar] [CrossRef]
  35. Forbes, D.J. Multi-scale analysis of the relationship between economic statistics and DMSP-OLS night light images. GISci. Remote Sens. 2013, 50, 483–499. [Google Scholar] [CrossRef]
  36. Niu, W.H.; Xia, H.M.; Wang, R.M.; Pan, L.; Meng, Q.M.; Qin, Y.C.; Li, R.M.; Zhao, X.Y.; Bian, X.Q.; Zhao, W. Research on Large-Scale Urban Shrinkage and Expansion in the Yellow River Affected Area Using Night Light Data. ISPRS Int. J. Geo-Inf. 2020, 10, 5. [Google Scholar] [CrossRef]
  37. Liu, Z.F.; He, C.Y.; Zhang, Q.F.; Huang, Q.X.; Yang, Y. Extracting the dynamics of urban expansion in China using DMSP-OLS nighttime light data from 1992 to 2008. Landsc. Urban Plan 2012, 106, 62–72. [Google Scholar] [CrossRef]
  38. Zhang, Q.; Seto, K.C. Mapping urbanization dynamics at regional and global scales using multi-temporal DMSP/OLS nighttime light data. Remote Sens. Environ. 2011, 115, 2320–2329. [Google Scholar] [CrossRef]
  39. Liu, P.F.; Wang, Q.; Zhang, D.D.; Lu, Y.Z. An Improved Correction Method of Nighttime Light Data Based on EVI and WorldPop Data. Remote Sens. 2020, 12, 3988. [Google Scholar] [CrossRef]
  40. Chen, X.; Nordhaus William, D. Using luminosity data as a proxy for economic statistics. Proc. Natl. Acad. Sci. USA 2011, 108, 8589–8594. [Google Scholar] [CrossRef] [Green Version]
  41. Liang, H.D.; Guo, Z.Y.; Wu, J.P.; Chen, Z.Q. GDP spatialization in Ningbo City based on NPP/VIIRS night-time light and auxiliary data using random forest regression. Adv. Space Res. 2020, 65, 481–493. [Google Scholar] [CrossRef]
  42. He, X.; Zhu, Y.T.; Chang, P.P.; Zhou, C.S. Using Tencent User Location Data to Modify Night-Time Light Data for Delineating Urban Agglomeration Boundaries. Front. Environ. Sci. 2022, 10, 860365. [Google Scholar] [CrossRef]
  43. Richmond, A.; Kaufmann, R.K.; Myneni, R.B. Valuing ecosystem services: A shadow price for net primary production. Ecol. Econ. 2007, 64, 454–462. [Google Scholar] [CrossRef]
  44. Randerson, J.T.; Masiello, C.A.; Still, C.J.; Rahn, T.; Poorter, H.; Field, C.B. Is carbon within the global terrestrial biosphere becoming more oxidized? Implications for trends in atmospheric O2. Global Chang. Biol. 2006, 12, 260–271. [Google Scholar] [CrossRef] [Green Version]
  45. Wang, Z.S.; Zhang, S.L.; Wang, X.F.; Yang, Y.J. Evaluation of Environmental Purification Service for Urban Green Space in Nanjing. Nat. Environ. Pol. Tech. 2015, 14, 1019–1025. [Google Scholar]
  46. Zhang, Z.W.; Chang, T.Y.; Qiao, X.N.; Yang, Y.J.; Guo, J.; Zhang, H. Eco-Economic Coordination Analysis of the Yellow River Basin in China: Insights from Major Function-Oriented Zoning. Sustainability 2021, 13, 2715. [Google Scholar] [CrossRef]
  47. Ma, Y. Examining the coupling degree and interactive stress between urbanization and eco-environment in Yangtze River Economic Belt. Ch’ang-Chiang Liu Yu Tzu Yuan Yu Huan Ching 2020, 29, 275–286. [Google Scholar]
  48. Shi, T. Spatial correlation network and regional connected effect of coupling coordination degree between ecological protection and high-quality economic development in the Yellow River regions. Reg. Econ. Rev. 2020, 3, 25–34. [Google Scholar]
Figure 1. Overview of the study area.
Sustainability 14 13102 g001
Figure 2. Average light density of Yellow River Basin.
Sustainability 14 13102 g002
Figure 3. Light density in each year of Yellow River Basin.
Sustainability 14 13102 g003
Figure 6. Coordination degree of Yellow River Basin in each year.
Sustainability 14 13102 g006
Figure 7. Average coordination degree of Yellow River Basin.
Sustainability 14 13102 g007
Table 1. Coupling coordination interval and state of economic system and environmental system.
Coupling Coordination Degree (D)Coupling Coordination IntervalCoupling Coordination State
0 < D ≤ 0.1dissonance declineExtreme derangement
0.1 < D ≤ 0.2Severe derangement
0.2 < D ≤ 0.3Moderate dissonance decline
0.3 < D ≤ 0.4transitional reconciliationMild derangement
0.4 < D ≤ 0.5On the verge of deficient decline
0.5 < D ≤ 0.6Barely coupled coordination class
0.6 < D ≤ 0.7low coordinationPrimary coupling coordination class
0.7 < D ≤ 0.8Intermediate coupling coordination class
0.8 < D ≤ 0.9highly coordinatedWell-coupled coordination class
0.9 < D ≤ 1.0High-quality coupling coordination class
Table 2. Types of and changes in ecological and economic coordination degrees in Yellow River Basin.
TypeNumber of
Prefectures and Cities in 2005
Number of
Prefectures and Cities in 2010
Number of
Prefectures and Cities in 2015
Number of
Prefectures
and Cities in 2020
Extreme derangement1914118
Severe derangement49472924
Moderate dissonance decline39456245
Mild derangement891033
On the verge of deficient decline0034
Barely coupled coordination class0001
Publisher’s Note: MDPI stays neutral with regard to jurisdictional claims in published maps and institutional affiliations.

