
Optimization of Multi-Port Empty Container Repositioning under Uncertain Environments

1
School of Foreign Languages, Shanghai Maritime University, Shanghai 201306, China
2
School of Economics and Management, Shanghai Maritime University, Shanghai 201306, China
*
Author to whom correspondence should be addressed.
Sustainability 2022, 14(20), 13255; https://doi.org/10.3390/su142013255
Submission received: 17 August 2022
/
Revised: 9 October 2022
/
Accepted: 11 October 2022
/
Published: 15 October 2022
(This article belongs to the Special Issue Carbon Neutralization in Sustainable Port and Shipping)
Abstract
:Empty container repositioning has always been an important problem faced by ports. In this paper, we study the multi-port empty container repositioning problem with the uncertainty of the demand and supply of empty containers in ports. First, we established an optimization model for empty container reposition strategies and calculated every port’s proportion, depending on its own empty container storage, on the operation of other ports and on the leasing company, in meeting the demand. Next, we established an optimization model for the empty container non-repositioning strategy, calculated the same proportions and compared their performance under two strategies. A two-stage particle swarm optimization (TS-PSO) algorithm was designed to solve the two models, and an example was used to verify the effectiveness of the algorithm and the rationality of the two models. Our research showed that the total cost of empty containers, storage costs, lease costs and the optimal storage of empty containers in ports under the repositioning strategy are all lower than those of the non-repositioning strategy. The proportion of the empty container demand met by inventory under the repositioning strategy is higher than that under the non-repositioning strategy, while the proportion of the empty container demand met by leasing is lower. The costs of leasing cost and repositioning empty containers are higher than those under the non-repositioning strategy. The increase in transportation time between ports per empty container mainly leads to the increase in the reposition costs of all ports. The increase in storage fees chiefly leads to the rising storage costs of all ports. The increase in leasing fees leads to the rising leasing costs of all ports. The paper provides a method for ports to decide the upper limit of empty container storage and to optimize their repositioning strategy.
1. Introduction
International trade has developed rapidly in the past decades with the development of economic globalization and production regionalization [1]. The contribution of ocean transportation logistics to international trade has reached about 90% [2]. Container transportation plays an important role in ocean transportation logistics and in addressing people’s demands for basic and secondary commodities [3,4]. Although the demand for container transportation has always shown a trend of continuous and steady growth, the number and flow of containers maintain an unbalanced state, and the shortage of empty containers often occurs in the port areas of import-oriented countries. The main reasons for this phenomenon lie in the widespread international trade imbalances and improper container management [5].
For example, in 2020, the number of containers transported from East Asia to Europe was 16.1 million TEUs, while that from Europe to East Asia was only 6.9 million TEUs [6]. The situation is the same as the international trade between China and the United States. The trade imbalance between China and the United States has further exacerbated the imbalance of container flow on international routes in the region. This is because the goods exported from China to the United States are mainly commodities such as clothing, which require more containers, while the port goods exported from the United States to China are basically fewer, thus requiring fewer containers. To a certain extent, this cause some ports to have an excess inventory of empty containers, while existing empty containers in other ports cannot meet the needs of customers in time, which results in the shortage of empty containers often found in major ports in North America [7].
The empty container crisis results from the failure of container logistics chain management. Since 2020, the outbreak of the COVID-19 epidemic has revealed the vulnerability of the container logistics chain, but the epidemic is only the trigger, and the long-term accumulated disadvantages in each link of the empty container supply chain are the core crux of the crisis. On the one hand, it is the reason why the shipping industry’s maritime transport network is inefficient; on the other hand, it is also the problem of ports, inland logistics and other links [8,9].
Too many or too few empty containers in a terminal will affect a port’s operation. Ideally, ports and shipping companies should strengthen cooperation [10], especially the arrangement of shipping dates [11], to achieve the balance between the supply and demand of empty containers. However, in reality, the loaded containers arriving at the port are usually transported by trucks to the inland importer, emptied, and returned to the port terminal for storage [12,13]. When there is a demand for transportation, the container is sent to the inland exporter for loading and is then returned to the port for transportation. If a large number of empty containers are left idle and stacked in the port, they will undoubtedly occupy a large storage space, even the space of the heavy container yard, affecting the normal circulation of heavy container business, causing port congestion, reducing operational efficiency and leading to difficulties in accessing containers.
Empty containers are seriously excessive in some ports. According to the CAx (Container Availability Index) value of 20DC dry containers provided by Container Xchange, the CAx value of Shanghai in week 14 of 2021 was 0.64 [14], indicating that the number of empty containers is excessive, as is shown in Figure 1:
Container transportation has a great impact on port revenue [15]. However, repositioning empty containers with low economic benefits has seriously affected the profit of ports and shipping companies. In terms of environmental issues, container ships also account for a relatively high proportion of the main pollutant emissions in ports, especially in the maneuvering and berthing states [16]. How to effectively formulate the strategy of empty container repositioning between ports, reduce the cost of empty containers and improve the efficiency of the port have become important problems to be solved in ports (see [17]). Empty container leasing and repositioning are usually these ports’ solutions to this problem [18,19].
2. Literature Review
Some scholars have studied the optimization of empty container repositioning in recent years [20,21,22]. Some papers assume that the container shipment demand is deterministic [23]. For example, Choong et al. [24] established an empty container dispatch cost optimization model under multimodal transportation. Wang and Wang [25] constructed a land-carriage empty container repositioning integer programming model. Li et al. [26] studied the optimization model of paired empty container repositioning in multiple ports and designed an intelligent algorithm to solve the model. Lei and Church [27] presented three strategic-level models for locating storage yards for empty shipping containers to reduce the mileage involved in repositioning empty containers. Some scholars focused on foldable container repositioning [28,29], such as Moon et al. [30], who compared the reposition costs of standard containers and foldable containers. Yu et al. [31] constructed a two-stage game optimization model of dry ports and seaports combined with transport and deduced the carrier’s optimal delivery strategy and retention time of empty containers. Shintani et al. [18] presented a model of a minimum-cost, multi-commodity network flow problem that considered different empty container sizes and repositioning. Zhou et al. [32] derived the number of relocations need to retrieve all containers from a yard segment of a port. Escudero et al. [33] designed an optimal formula of multimodal empty container transportation in ports considering the time window and used a practical case to verify the validity of the formula. Luo et al. [34] considered a container transportation service chain composed of a container leasing company, carriers, forwarders, ports and consignors. The above works have studied the empty container repositioning problem from the perspectives of time, space and cost, but mainly focused on the overall optimization of empty containers, without considering the continuous characteristics of the changes in empty container storage in the port yard.
Several researchers have studied the optimization of empty container repositioning under random conditions. Crainic et al. [35] extended a dynamic, deterministic formulation of a two-stage stochastic programming formulation for the empty container repositioning problem under the uncertainties of empty container demand. Erera et al. [36] established an empty container reposition optimization model using a robust optimization framework considering the interval uncertainty of forecast values. Francesco et al. [37] studied the optimization of empty container repositioning in the case of the port service time under random distribution. For the problem of multimodal transportation in empty containers with random demand, Luo and Chang [38] proposed an empty container inventory coordination strategy based on a revenue-sharing contract. Lee and Moon [39] discussed the empty container repositioning problem and proposed a robust formulation considering foldable containers under demand uncertainty. Sarmadi et al. [40] constructed a two-stage stochastic programming model of an empty container repositioning network in a dry port and analyzed the influence of the transportation network configuration and operation decisions on the holding cost of the empty container inventory. These studies mainly considered situations in which the demand for empty containers is uncertain, but the supply of empty containers is also uncertain in practice, and the empty container supply will have an important impact on empty container repositioning.
The problem of port container storage has also attracted the attention of some scholars. Kim and Kim [41] studied the optimization problem of container storage in port container yards, and established three mathematical models: maximizing the profit of the terminal operator; maximizing the terminal operator’s profit constraints; and minimizing the total public cost. Lee and Yu [42] studied the storage fee competition problem between the remote container yard and the container terminal. Qiu et al. [43] studied the storage pricing problem for outbound containers in dry ports. Alfandari et al. [44] studied the empty container reposition optimization problem in which shipping companies consider routes, port pairings, transportation time and fleet size at the same time and designed an integer linear program to solve the model. Kurtuluş [45] proposed a multi-objective mixed-integer programming model aiming to optimize inland container logistics with dry port location allocation by including empty container relocation and volume discounts. Baştuğ et al. [46] analyzed the factors of port competitiveness by using survey methods and a Fuzzy Analytic Hierarchy Process through analyzing the literature on the cooperation between ports and container transport companies over 20 years. They believed that consensus between ports and shipping companies is of great significance to improve the competitiveness of the port. The above research mainly focused on the optimization of empty containers in a single period and in one port, ignoring the continuous changes in port empty container storage and situations involving multiple ports.
In this paper, two optimization models of empty container repositioning under uncertain multi-port environments are constructed according to the multi-period change and multi-port state of empty container storage. The demand and supply of empty containers of each port are random variables. The probability of each state of empty container storage in the port is calculated through relationship between these states. It aims to minimize the total cost of port empty container reposition, storage and lease. A two-stage particle swarm optimization algorithm (PSO) is proposed to solve the model. An example is given to verify the effectiveness of the algorithm and the rationality of the model in order to provide reference for optimizing the problem of empty container repositioning between multiple ports.
3. Model Hypotheses and Formulation
3.1. Model Hypotheses
In this study, we have four basic hypotheses:
- (1)
- The supply of empty containers to a port only consists of three portions: shipping company transportation, repositioning from other ports and container leasing.
- (2)
- Every empty container considered in this paper belongs to the 20-feet-long type.
- (3)
- The ports are operating in normal conditions, without considering abnormal situations such as port interruption.
- (4)
- The leasing company can offer empty containers without a limitation on the amount.
3.2. Model of a Port’s Empty Containers under the Repositioning Strategy
In this section, we will construct two models of multi-port empty container repositioning optimization, one of which considers a port repositioning strategy and the other which adopts a non-repositioning strategy. A comparison of the total port costs between the two models will be carried out.
Assuming that the demand and supply of empty containers in the port are random variables, the port’s empty container demand can be met by the port’s own empty container storage when its empty container storage is greater than 0. The port’s empty container demand can be met through empty container leasing or other ports when the port’s empty container storage is 0. The empty container dispatch order of the port is shown in Figure 2:
Assuming be the total empty container demand of all ports, then . Assuming is the proportion of port i’s empty container demand in the total demand of empty containers of all ports, then . At the same time, . It is concluded that:
As there is and the empty container storage of the port is related to the input, output and repositioning, the change in the empty container storage of port i can be obtained as shown in Figure 3.
Based on the Markov chain theory, every status is and is only affected by the statuses that are right before and after it. According to Figure 3, it is easy to obtain:
According to Formulas (2)–(4), it is known that:
When the empty container storage capacity of port i is greater than 0, it can rely on its own inventory to meet the demand.
Assume S is the total amount of empty containers in all ports, that is, . When the empty container inventory in all ports is 0, the port can only meet the demand through empty container leasing companies, so , and:
According to the publicity 1, it can be calculated: ; the values of , , and can be calculated by iterative method.
The total cost model of port empty container repositioning under the repositioning strategy is as follows:
Formula (9) expresses the minimum total cost of a port’s empty containers, which consists of the empty container storage cost, leasing cost and empty container repositioning cost. Formula (10) expresses the storage cost of the port’s empty containers, composed of the storage fees of every empty container in the port, in which represents the storage cost when the number of empty containers in storage in port i is m. Formula (11) expresses the empty container repositioning cost, in which represents the cost of repositioning empty containers from port l to port i. Formula (12) expresses a port’s empty container leasing cost, with representing the lease cost of the empty containers of port i. Formula (13) expresses the probability that the port i’s empty container storage capacity is m. Formula (14) expresses that port i relies on its own empty container storage to meet the demand ratio. Formula (15) expresses that port i relies on empty container leasing to meet the empty container demand. Formula (16) expresses that port i relies on other ports to transfer empty containers to meet the demand ratio. Formula (17) expresses port i’s empty container demand waiting time limit. Formula (18) expresses port i’s empty container storage space limit.
3.3. Model of a Port’s Empty Containers under the Non-Repositioning Strategy
A port’s empty container demand can only be met by the port’s self-storage or an empty container leasing company under the non-repositioning strategy. As a consequence, the relationship between the empty container inventory and the input and output of port i is shown in Figure 4.
According to Formulas (19)–(21), it is known that:
When the empty container storage capacity of port i is greater than 0, it can rely on its own inventory to meet the demand, so , and rely on empty container lease to meet the empty container demand ratio .
The total cost model of port empty container repositioning under the non-repositioning strategy is as follows:
The meanings of Formulas (24)–(31) are the same as those in Section 3.2.
Theorem 1.
Under the repositioning strategy, the proportion of the port depending on its own empty container storage to meet the demand is higher than that under the non-repositioning strategy.
Proof of Theorem 1.
Let the superscript tr denote the repositioning strategy, and denote the non-repositioning strategy. Because , <. According to Formulas (6) and (22), it is known that and . □
Theorem 2.
Under the repositioning strategy, the proportion of the port depending on empty container leasing to meet the demand for empty containers is lower than that under the non-repositioning strategy.
Proof of Theorem 2.
According to Theorem 1, it is known that . Because 1 and , , so . □
4. Model Solving
4.1. Two-Stage PSO Algorithm
The particle swarm optimization (PSO) algorithm has the advantages of simplicity and fast convergence speed among all kinds of heuristic algorithms [47]. However, it is easy to fall into the local convergence trap. Some researchers have improved the convergence speed of PSO and the breadth of its particle searching by combining the iteration steps of PSO or by combining the PSO algorithm with other intelligent algorithms [48,49]. As a consequence, this paper optimizes and improves the search space of the PSO algorithm, wielding a two-stage PSO algorithm in which the first stage is the global search phase, including the following Steps 1–3, and the second stage is the local search phase, including Steps 4–5. The specific steps of the optimization algorithm of empty container repositioning between ports based on a two-stage PSO algorithm are as follows:
Step 1: parameter initialization. The parameters involved in the port empty container total cost model are assigned, and N particles are initialized randomly, . Each particle is rounded as =max(1,round()).
Step 2: walk each particle in a region, and the radius of the k particle wandering region is . , where lu and ld are the upper and lower limits of the value of the decision variable. M random particles are randomly generated in , and represents the j particle in the k region.
Step 3: use the classical particle swarm optimization algorithm to calculate the optimal solution in the N region. is the optimal position of , and is the optimal particle in the k region. The update speed and position rules of each particle are as follows:
The is rounded. In Formula (32), rand () is a random number between (0, 1). c1 and c2 are called learning factors in the PSO algorithm, and w is a weighted coefficient. The iteration in step 3 is used to calculate Z1 times, and the best position of the i region is obtained.
Step 4: return to Step 2 and assume . Repeat Steps 2 to 4 and calculate Z2 times.
Step 5: use the classical particle swarm optimization algorithm for the N particle , and the update speed and position rules of each particle are consistent with Equations (32) and (33). The optimal solution of the model is obtained by iterative calculation Z3 times.
4.2. Calculation of , , and under the Repositioning Strategy
,, and in the port empty container repositioning optimization model under the repositioning strategy need to be calculated by the iterative calculation method. The details are as follows:
Initialize , and .
For (k = 1; k ≤ Max num; k++) {
if(){
break;}}
5. Computational Experiments
In this section, we give some numerical examples to illustrate how the repositioning strategy affects empty container repositioning at the port and how the cost changes. There is a large number of port groups in the Yangtze River Delta, and there is much cooperation between ports. We selected Taicang Port, Nantong Port and Zhangjiagang Port as the research objects. The distances between the three ports are shown in Table 1.
Ships are used for empty container transportation between ports, the speed is set to 16 knots and the loading and unloading time is 4 h. The empty container transportation time between the three ports is shown in Table 2.
The minimum fee for empty container storage in Taicang Port is USD 1.3 per day. If the storage fee for each empty container is USD 2, the average storage fee per hour is USD 0.0833. The storage fees at Nantong Port and Zhangjiagang Port are the same as Taicang Port. According to the Where Are All The Containers? report published by Container xChange in August 2022, the one-way pick-up fee for a leased container on the China–Germany route is USD 1995, the voyage lasts about 35 days, and the lease fee per hour is USD 2.38. The berth times of Taicang Port, Nantong Port and Zhangjiagang Port are all limited to 4 days. In 2021, the container throughputs of Taicang Port, Nantong Port and Zhangjiagang Port were 7038 K TEU, 2027.4 K TEU and 868 K TEU, respectively. If the upper limit of empty container storage space of a port is 1/24 of the throughput, K TEU, K TEU and K TEU. See Table 3 for other data of the three ports.
5.1. Analysis of the Result of the Solution
MATLAB2018b is used to program and debug the algorithm, and the total cost model of port empty containers under the repositioning strategy is calculated by comparing the traditional PSO algorithm and the two-stage PSO algorithm. The results are shown in Figure 5.
As can be seen from Figure 5, compared with the traditional PSO algorithm, the convergence speed of the two-stage PSO algorithm is faster, and the calculation result is also better than the traditional PSO algorithm. The two-stage PSO algorithm is used to solve the port empty container cost model under both the repositioning strategy and the non-repositioning strategy. The results are shown in Table 4.
According to Table 4, the total cost, storage cost and optimal storage capacity of a port’s empty containers under the repositioning strategy are all lower than those under the non-repositioning strategy. It can be seen that the repositioning strategy will significantly reduce the total cost of empty containers at the ports. Due to the repositioning strategy, the storage capacity of empty containers in the ports is lower than that under the non-repositioning strategy, so the port needs to meet the demand for empty containers through more leasing and repositioning methods. Therefore, the cost of empty container lease and reposition will be higher than that of the non-repositioning strategy.
5.2. Sensitivity Analysis
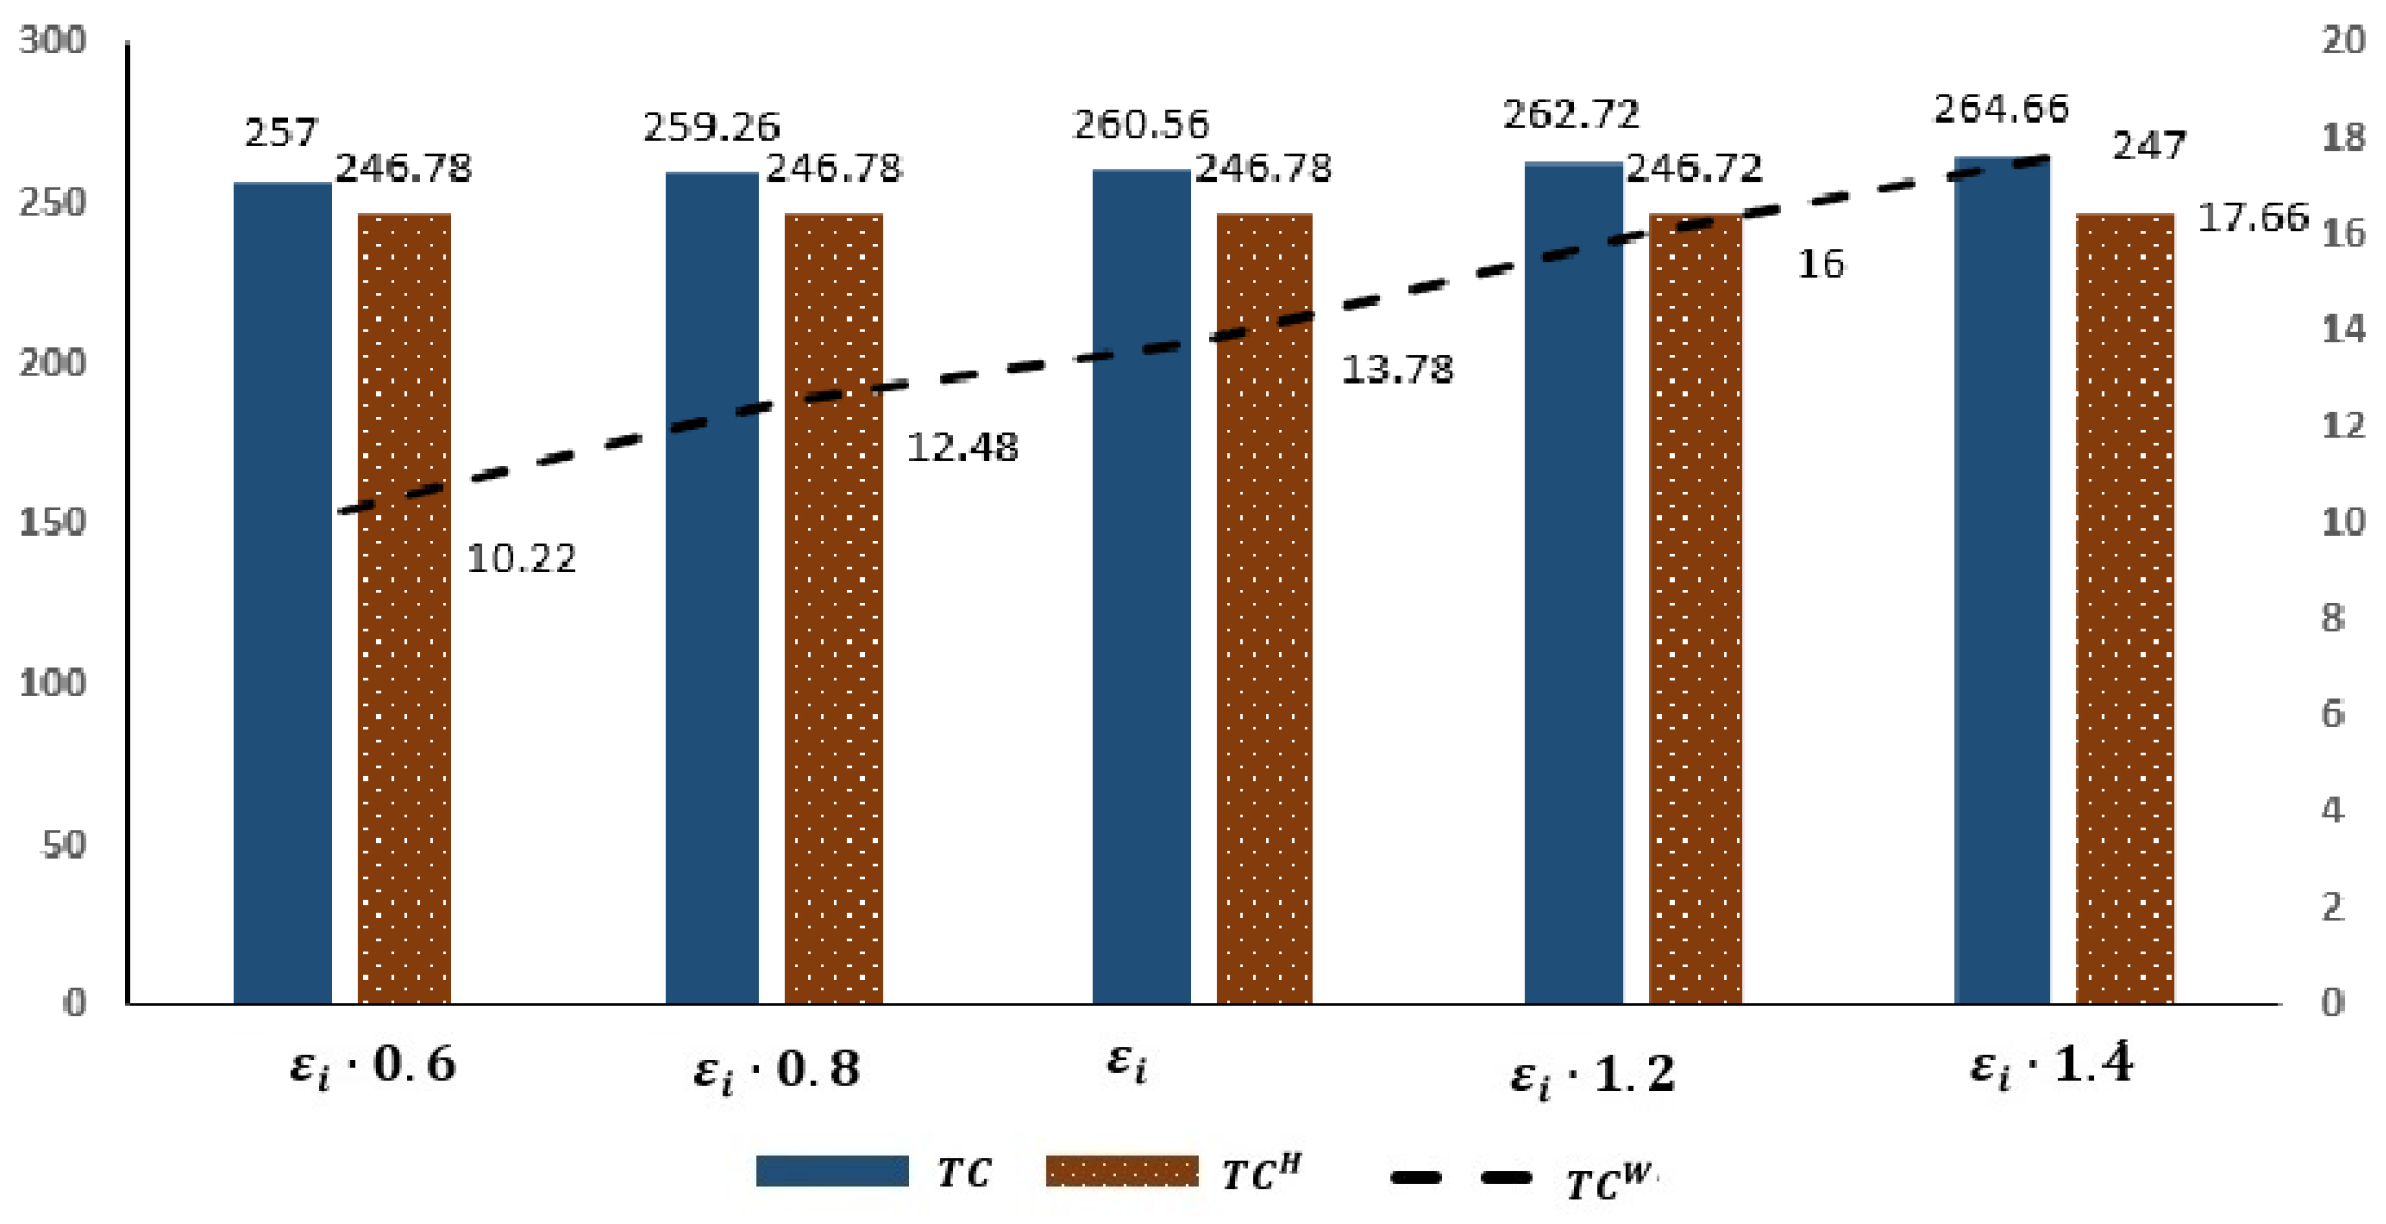
An increase in means an increase in the sum of empty container transportation and handling time between ports. It can be seen from Figure 6 that in the repositioning strategy, the port storage cost and lease cost change less, and the reposition fee will increase significantly. Because the increase in transportation and handling time will lead to an increase in repositioning costs, ports can only meet market demand by increasing the storage or leasing of empty containers, which in turn leads to increased storage costs and leasing costs. Since port operations in the non-repositioning strategy are not affected by , port storage costs and leasing costs in the non-repositioning strategy will not change.
An increase in means an increase in the storage fees of empty container units. It can be seen from Figure 8 and Figure 9 that with an increase in , the port storage costs increase significantly under both the reposition and non-repositioning strategies. The total port costs mainly include the empty container storage cost, so the total cost also increases with the empty container storage cost increasing. Due to the increase in the storage cost of empty containers, the port has to increase or to meet the demand for empty containers, and the costs of empty container leasing and repositioning also increase slightly.
An increase in means an increase in the unit empty container lease cost. It can be seen from Figure 10 and Figure 11 that with the increase in , the port’s empty container lease cost increases significantly under both the repositioning strategy and the non-repositioning strategy. However, since the lease cost is not high in the total cost (20.91% for the repositioning strategy and 5.29% for the non-repositioning strategy), the total cost will not increase significantly.
6. Conclusions
This paper mainly studies the optimization problem of multi-port and multi-period empty container repositioning under the condition that a port’s empty container demand and supply are random variables. We calculated every port’s proportion, depending on its own empty container storage, on the operation of other ports and on the leasing company, in meeting the demand and made comparisons between two strategies of reposition and non-repositioning. At the same time, a port’s total empty container cost, empty container storage cost, empty container repositioning cost and empty container leasing cost under the repositioning strategy and the non-repositioning strategy were compared, and the two-stage PSO algorithm was used to solve the model. In addition, a numerical example was used to verify the effectiveness of the algorithm and the rationality of the model.
The main conclusions are as follows:
- The ports’ total cost, storage cost and empty container storage capacity under the repositioning strategy are lower than those under the non-repositioning strategy, but the empty container leasing cost and repositioning cost are higher than those under the non-repositioning strategy.
- The main component of the total cost of empty containers in the port is the cost of empty container storage. The change in the storage fees of empty containers has the greatest impact on the total cost of empty containers. The increase in the transportation time of empty containers between ports will lead to an increase in the empty container repositioning fee under the repositioning strategy, but it has little impact on the port’s storage costs and lease costs and will not affect the port’s operation under the non-repositioning strategy. When the storage fee of empty containers increases, regardless of whether the port adopts a reposition or non-repositioning strategy, the port’s empty container storage cost will increase significantly anyway, and the empty container leasing and reposition costs will also increase slightly. When the leasing fee of empty containers increases, under both reposition and non-repositioning strategies, the leasing cost of empty containers in the port will increase significantly, but the impact on the total cost is not significant.
There are still certain deficiencies in this paper. For example, empty container repositioning is easily affected by factors such as shipping schedule, empty container storage yard location and quantity restrictions in empty container leases, which have not been covered in this paper. In future research, the optimization of empty container repositioning considering the shipping schedule, the port’s off-site storage planning and the empty container lease constraints can be studied.
Author Contributions
Conceptualization, X.T.; Software, J.W.; Writing—original draft, C.X.; Writing—review & editing, J.S. and C.W. All authors have read and agreed to the published version of the manuscript.
Funding
This research was funded by the National Natural Science Foundation of China, grant number 71974123.
Conflicts of Interest
The authors declare no conflict of interest.
Abbreviation
The notations for the variables and parameters are as follows:
| Variables: | |
| The number of empty containers obeying the positive etheric distribution supply of port i. | |
| The number of empty containers to port i transferred from other ports. | |
| The empty container storage of port i. | |
| The number of empty containers obeying the positive etheric distribution demand of port i. | |
| The proportion of port i depending on its own empty container storage to meet the demand. | |
| The proportion of port i depending on other ports to transfer empty containers to meet the demand. | |
| The proportion of port i depending on empty container lease to meet the demand. | |
| The probability that the empty container storage capacity of port i is m. | |
| The total cost. | |
| Empty container storage cost. | |
| Empty container reposition cost. | |
| Empty container lease cost. | |
| Parameters: | |
| I | The number of ports. |
| Container storage fee per empty container for port i. | |
| Container lease fee per empty container for port i. | |
| The fee of one empty container transferred from port i to port , and is reposition fee per unit time. | |
| Waiting time limit for empty container demand of port i. | |
| v | The space of one empty container. |
| Upper limit of empty container storage space of port i. | |
| The x-th priority origin port of an empty container when port i lacks containers. | |
| The probability of port q as the origin of empty containers to port i. | |
| Sum of empty container transportation and handling time from port i to j. | |
| Empty container transportation and handling time from leasing company to port i. | |
References
- Zhou, Y.; Chen, S.; Chen, M. Global value chain, regional trade networks and Sino-EU FTA. Struct. Chang. Econ. Dyn. 2019, 50, 26–38. [Google Scholar] [CrossRef]
- Song, D.M.; Panayides, P.M. Maritime Logistics: A Complete Guide to Effective Shipping and Port Management; Kogan Page: London, UK, 2012. [Google Scholar]
- Lind, M.; Ward, R.; Jensen, H.H.; Chua, C.P.; Simha, A.; Karlsson, J.; Göthberg, L.; Penttinen, T.; Theodosiou, D.P. The future of shipping: Collaboration through digital data sharing. In Maritime Informatics; Progress in IS; Springer: Cham, Switzerland, 2021; pp. 137–149. [Google Scholar] [CrossRef]
- Chen, L.; Nan, G.; Li, M.; Feng, B.; Liu, Q. Manufacturer’s online selling strategies under spillovers from online to offline sales. J. Oper. Res. Soc. 2022. [Google Scholar] [CrossRef]
- Elmi, Z.; Singh, P.; Meriga, V.K.; Goniewicz, K.; Borowska-Stefańska, M.; Wiśniewski, S.; Dulebenets, M.A. Uncertainties in Liner Shipping and Ship Schedule Recovery: A State-of-the-Art Review. J. Mar. Sci. Eng. 2022, 10, 563. [Google Scholar] [CrossRef]
- UNCTAD. United Nations conference on trade and development. In Review of Maritime Transport; United Nations: Geneva, Switzerland, 2020; Available online: https://unctad.org/system/files/official-document/rmt2020_en.pdf (accessed on 18 November 2020).
- Jeong, Y.; Saha, S.; Chatterjee, D.; Moon, I. Direct shipping service routes with an empty container management strategy. Transp. Res. Part E Logist. Transp. Rev. 2018, 118, 123–142. [Google Scholar] [CrossRef]
- Tang, Y.; Chen, S.; Feng, Y.; Zhu, X. Optimization of multi- period empty container repositioning and renting in CHINA RAILWAY Express based on container sharing strategy. Eur. Transp. Res. Rev. 2021, 13, 42. [Google Scholar] [CrossRef]
- Cai, J.; Li, Y.; Yin, Y.; Wang, X.; Lalith, E.; Jin, Z. Optimization on the multi-period empty container repositioning problem in regional port cluster based upon inventory control strategies. Soft Comput. 2022, 26, 6715–6738. [Google Scholar] [CrossRef]
- Dulebenets, M.A. Multi-objective collaborative agreements amongst shipping lines and marine terminal operators for sustainable and environmental-friendly ship schedule design. J. Clean. Prod. 2022, 342, 130897. [Google Scholar] [CrossRef]
- Abioye, O.F.; Dulebenets, M.A.; Kavoosi, M.; Pasha, J.; Theophilus, O. Vessel Schedule Recovery in Liner Shipping: Modeling Alternative Recovery Options. IEEE Trans. Intell. Transp. Syst. 2021, 10, 6420–6434. [Google Scholar] [CrossRef]
- Romano, A.; Yang, Z. Decarbonisation of shipping: A state of the art survey for 2000–2020. Ocean Coast. Manag. 2021, 214, 105936. [Google Scholar] [CrossRef]
- Kavoosi, M.; Dulebenets, M.A.; Abioye, O.F.; Pasha, J.; Wang, H.; Chi, H. An Augmented Self-Adaptive Parameter Control in Evolutionary Computation: A Case Study for the Berth Scheduling Problem. Adv. Eng. Inform. 2019, 42, 100972. [Google Scholar] [CrossRef]
- CAx. 2021. Available online: https://container-xchange.com/features/cax (accessed on 4 April 2022).
- Chen, J.; Zhang, S.; Xu, L.; Wan, Z.; Fei, Y.; Zheng, T. Identification of key factors of ship detention under port state control. Mar. Policy 2019, 102, 21–27. [Google Scholar] [CrossRef]
- Xiao, G.; Wang, T.; Chen, X.; Zhou, L. Evaluation of Ship Pollutant Emissions in the Ports of Los Angeles and Long Beach. J. Mater. Sci. Eng. 2022, 10, 1206. [Google Scholar] [CrossRef]
- Jiang, X.; Lee, L.; Chew, E.P.; Han, Y.; Tan, K.C. A container yard storage strategy for improving land utilization and operation efficiency in a transshipment hub port. Eur. J. Oper. Res. 2012, 221, 64–73. [Google Scholar] [CrossRef]
- Koichi, S.; Konings, R.; Imai, A. Combinable containers: A container innovation to save container fleet and empty container repositioning costs. Transp. Res. Part E Logist. Transp. Rev. 2019, 130, 248–272. [Google Scholar] [CrossRef]
- Yap, W.; Lam, J. 80 million-twenty-foot-equivalent-unit container port? Sustainability issues in port and coastal development. Ocean Coast. Manag. 2013, 71, 13–25. [Google Scholar] [CrossRef]
- Jula, H.; Chassiakos, A.; Ioannou, P. Port dynamic empty container reuse. Transp. Res. Part E Logist. Transp. Rev. 2006, 42, 43–60. [Google Scholar] [CrossRef]
- Bernat, N.S.; Schulte, F.; Voß, S.; Böse, J. Empty container management at ports considering pollution, repair options and street-turns. Math. Probl. Eng. 2016, 2016, 3847163. [Google Scholar] [CrossRef] [Green Version]
- Song, W.; Liu, D.; Rong, W. Optimization of Passenger-like Container Train Running Plan Considering Empty Container Dispatch. Sustainability 2022, 14, 4697. [Google Scholar] [CrossRef]
- Gelareh, S.; Meng, Q. A novel modeling approach for the fleet deployment problem within a short-term planning horizon. Transp. Res. Part E Logist. Transp. Rev. 2010, 46, 76–89. [Google Scholar] [CrossRef]
- Choong, S.T.; Cole, M.H.; Kutanoglu, E. Empty container management for intermodal transportation networks. Transp. Res. Part E Logist. Transp. Rev. 2002, 38, 423–438. [Google Scholar] [CrossRef]
- Wang, B.; Wang, Z. Research on the Optimization of Intermodal Empty Container Reposition of Land-carriage. J. Transp. Syst. Eng. Inf. Technol. 2007, 7, 29–33. [Google Scholar] [CrossRef]
- Li, J.A.; Leung, S.C.H.; Wu, Y.; Liu, K. Allocation of empty containers between multi-ports. Eur. J. Oper. Res. 2007, 182, 400–412. [Google Scholar] [CrossRef]
- Lei, T.L.; Church, R.L. Locating short-term empty-container storage facilities to support port operations: A user optimal approach. Transp. Res. Part E Logist. Transp. Rev. 2011, 47, 738–754. [Google Scholar] [CrossRef]
- Shintani, K.; Konings, R.; Imai, A. The impact of foldable containers on container fleet management costs in hinterland transport. Transp. Res. Part E Logist. Transp. Rev. 2010, 46, 750–763. [Google Scholar] [CrossRef]
- Goh, S.H. The impact of foldable ocean containers on back haul shippers and carbon emissions. Transp. Res. Part D Transp. Environ. 2019, 67, 514–527. [Google Scholar] [CrossRef]
- Moon, I.; Ngoc, A.D.; Konings, R. Foldable and standard containers in empty container repositioning. Transp. Res. Part E Logist. Transp. Rev. 2013, 49, 107–124. [Google Scholar] [CrossRef]
- Yu, J.; Tang, G.; Song, X.; Yu, X.; Qi, Y.; Li, D.; Zhang, Y. Ship arrival prediction and its value on daily container terminal operation. Ocean Eng. 2018, 157, 73–86. [Google Scholar] [CrossRef]
- Zhou, C.; Wang, W.; Li, H. Container reshuffling considered space allocation problem in container terminals. Transp. Res. Part E Logist. Transp. Rev. 2020, 136, 101869. [Google Scholar] [CrossRef]
- Escudero-Santana, A.; Munuzuri, J.; Cortés, P.; Onieva, L. The one container drayage problem with soft time windows. Res. Transp. Econ. 2020, 2, 100884. [Google Scholar] [CrossRef]
- Luo, T.; Chang, D.; Xu, Z. Forwarder’s Empty Container Ordering and Coordination Considering Option Trading in the Container Transportation Service Chain. Comput. Ind. Eng. 2021, 156, 107251. [Google Scholar] [CrossRef]
- Crainic, T.G.; Gendreau, M.; Dejax, P.A. Dynamic and stochastic models for the allocation of empty containers. Oper. Res. 1993, 41, 102–126. [Google Scholar] [CrossRef]
- Erera, A.L.; Morales, J.C.; Savelsbergh, M. Robust optimization for empty repositioning problems. Oper. Res. 2009, 57, 468–483. [Google Scholar] [CrossRef] [Green Version]
- Francesco, M.D.; Lai, M.; Zuddas, P. Maritime repositioning of empty containers under uncertain port disruptions. Comput. Ind. Eng. 2013, 64, 827–837. [Google Scholar] [CrossRef]
- Luo, T.; Chang, D. Empty container repositioning strategy in intermodal transport with demand switching. Adv. Eng. Inform. 2019, 40, 1–13. [Google Scholar] [CrossRef]
- Lee, S.; Moon, I. Robust empty container repositioning considering foldable containers. Eur. J. Oper. Res. 2020, 280, 909–925. [Google Scholar] [CrossRef]
- Sarmadi, K.; Amiri-Aref, M.; Dong, J.X. Integrated strategic and operational planning of dry port container networks in a stochastic environment. Transp. Res. Part B Methodol. 2020, 139, 132–164. [Google Scholar] [CrossRef]
- Kim, K.H.; Kim, K.Y. Optimal price schedules for storage of inbound containers. Transp. Res. Part B Methodol. 2007, 41, 892–905. [Google Scholar] [CrossRef]
- Lee, C.Y.; Yu, M. Inbound container storage price competition between the container terminal and a remote container yard. Flex. Serv. Manuf. J. 2012, 24, 320–348. [Google Scholar] [CrossRef]
- Qiu, X.; Lam, J.; Huang, G.Q. A bilevel storage pricing model for outbound containers in a dry port system. Transp. Res. Part E Logist. Transp. Rev. 2015, 73, 65–83. [Google Scholar] [CrossRef]
- Alfandari, L.; Davidović, T.; Furini, F.; Ljubić, I.; Maraš, V.; Martin, S. Tighter MIP models for barge container ship routing. Omega 2019, 82, 38–54. [Google Scholar] [CrossRef]
- Kurtuluş, E. Optimizing Inland Container Logistics and Dry Port Location-Allocation from an Environmental Perspective. Res. Transp. Bus. Manag. 2022, 3, 100839. [Google Scholar] [CrossRef]
- Baştuğ, S.; Haralambides, H.; Esmer, S.; Eminoğlu, E. Port competitiveness: Do container terminal operators and liner shipping companies see eye to eye? Mar. Policy 2022, 135, 104866. [Google Scholar] [CrossRef]
- Jain, M.; Saihjpal, V.; Singh, N.; Singh, S.B. An Overview of Variants and Advancements of PSO Algorithm. Appl. Sci. 2022, 12, 8392. [Google Scholar] [CrossRef]
- Asghari, M.; Afshari, H.; Mirzapour Al-e-hashem, S.M.J.; Fathollahi-Fard, A.M.; Dulebenets, M.A. Pricing and advertising decisions in a direct-sales closed-loop supply chain. Comput. Ind. Eng. 2022, 171, 108439. [Google Scholar] [CrossRef]
- Ren, X.; Liu, S.; Yu, X.; Dong, X. A method for state-of-charge estimation of lithium-ion batteries based on PSO-LSTM. Energy 2021, 234, 121236. [Google Scholar] [CrossRef]
Figure 1.
The CAx value of 20DC of Shanghai.

Figure 2.
Empty container dispatch order of port i.

Figure 3.
Change in port i’s empty container storage under the repositioning strategy.
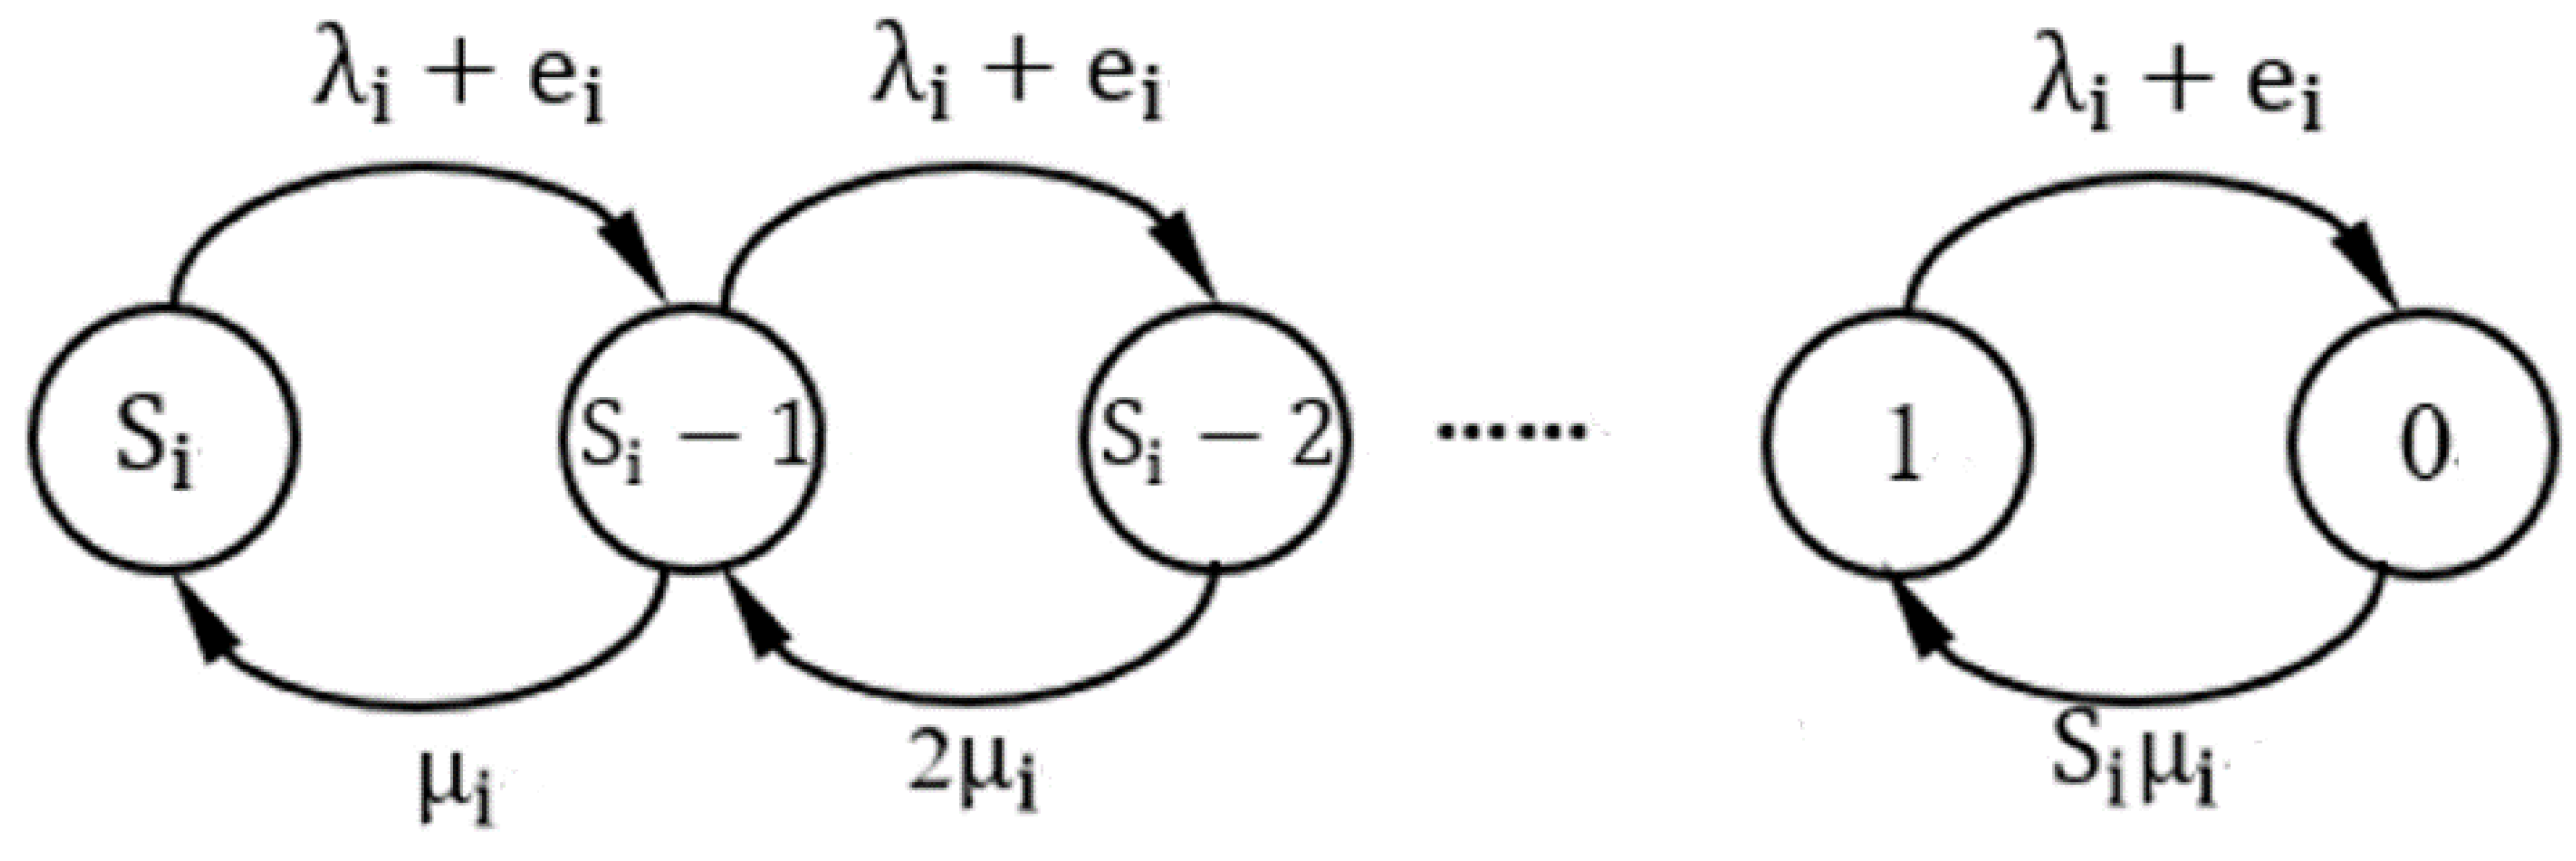
Figure 4.
The change in port i’s empty container storage under the non-repositioning strategy.

Figure 5.
Comparison between traditional PSO algorithm and two-stage PSO algorithm.
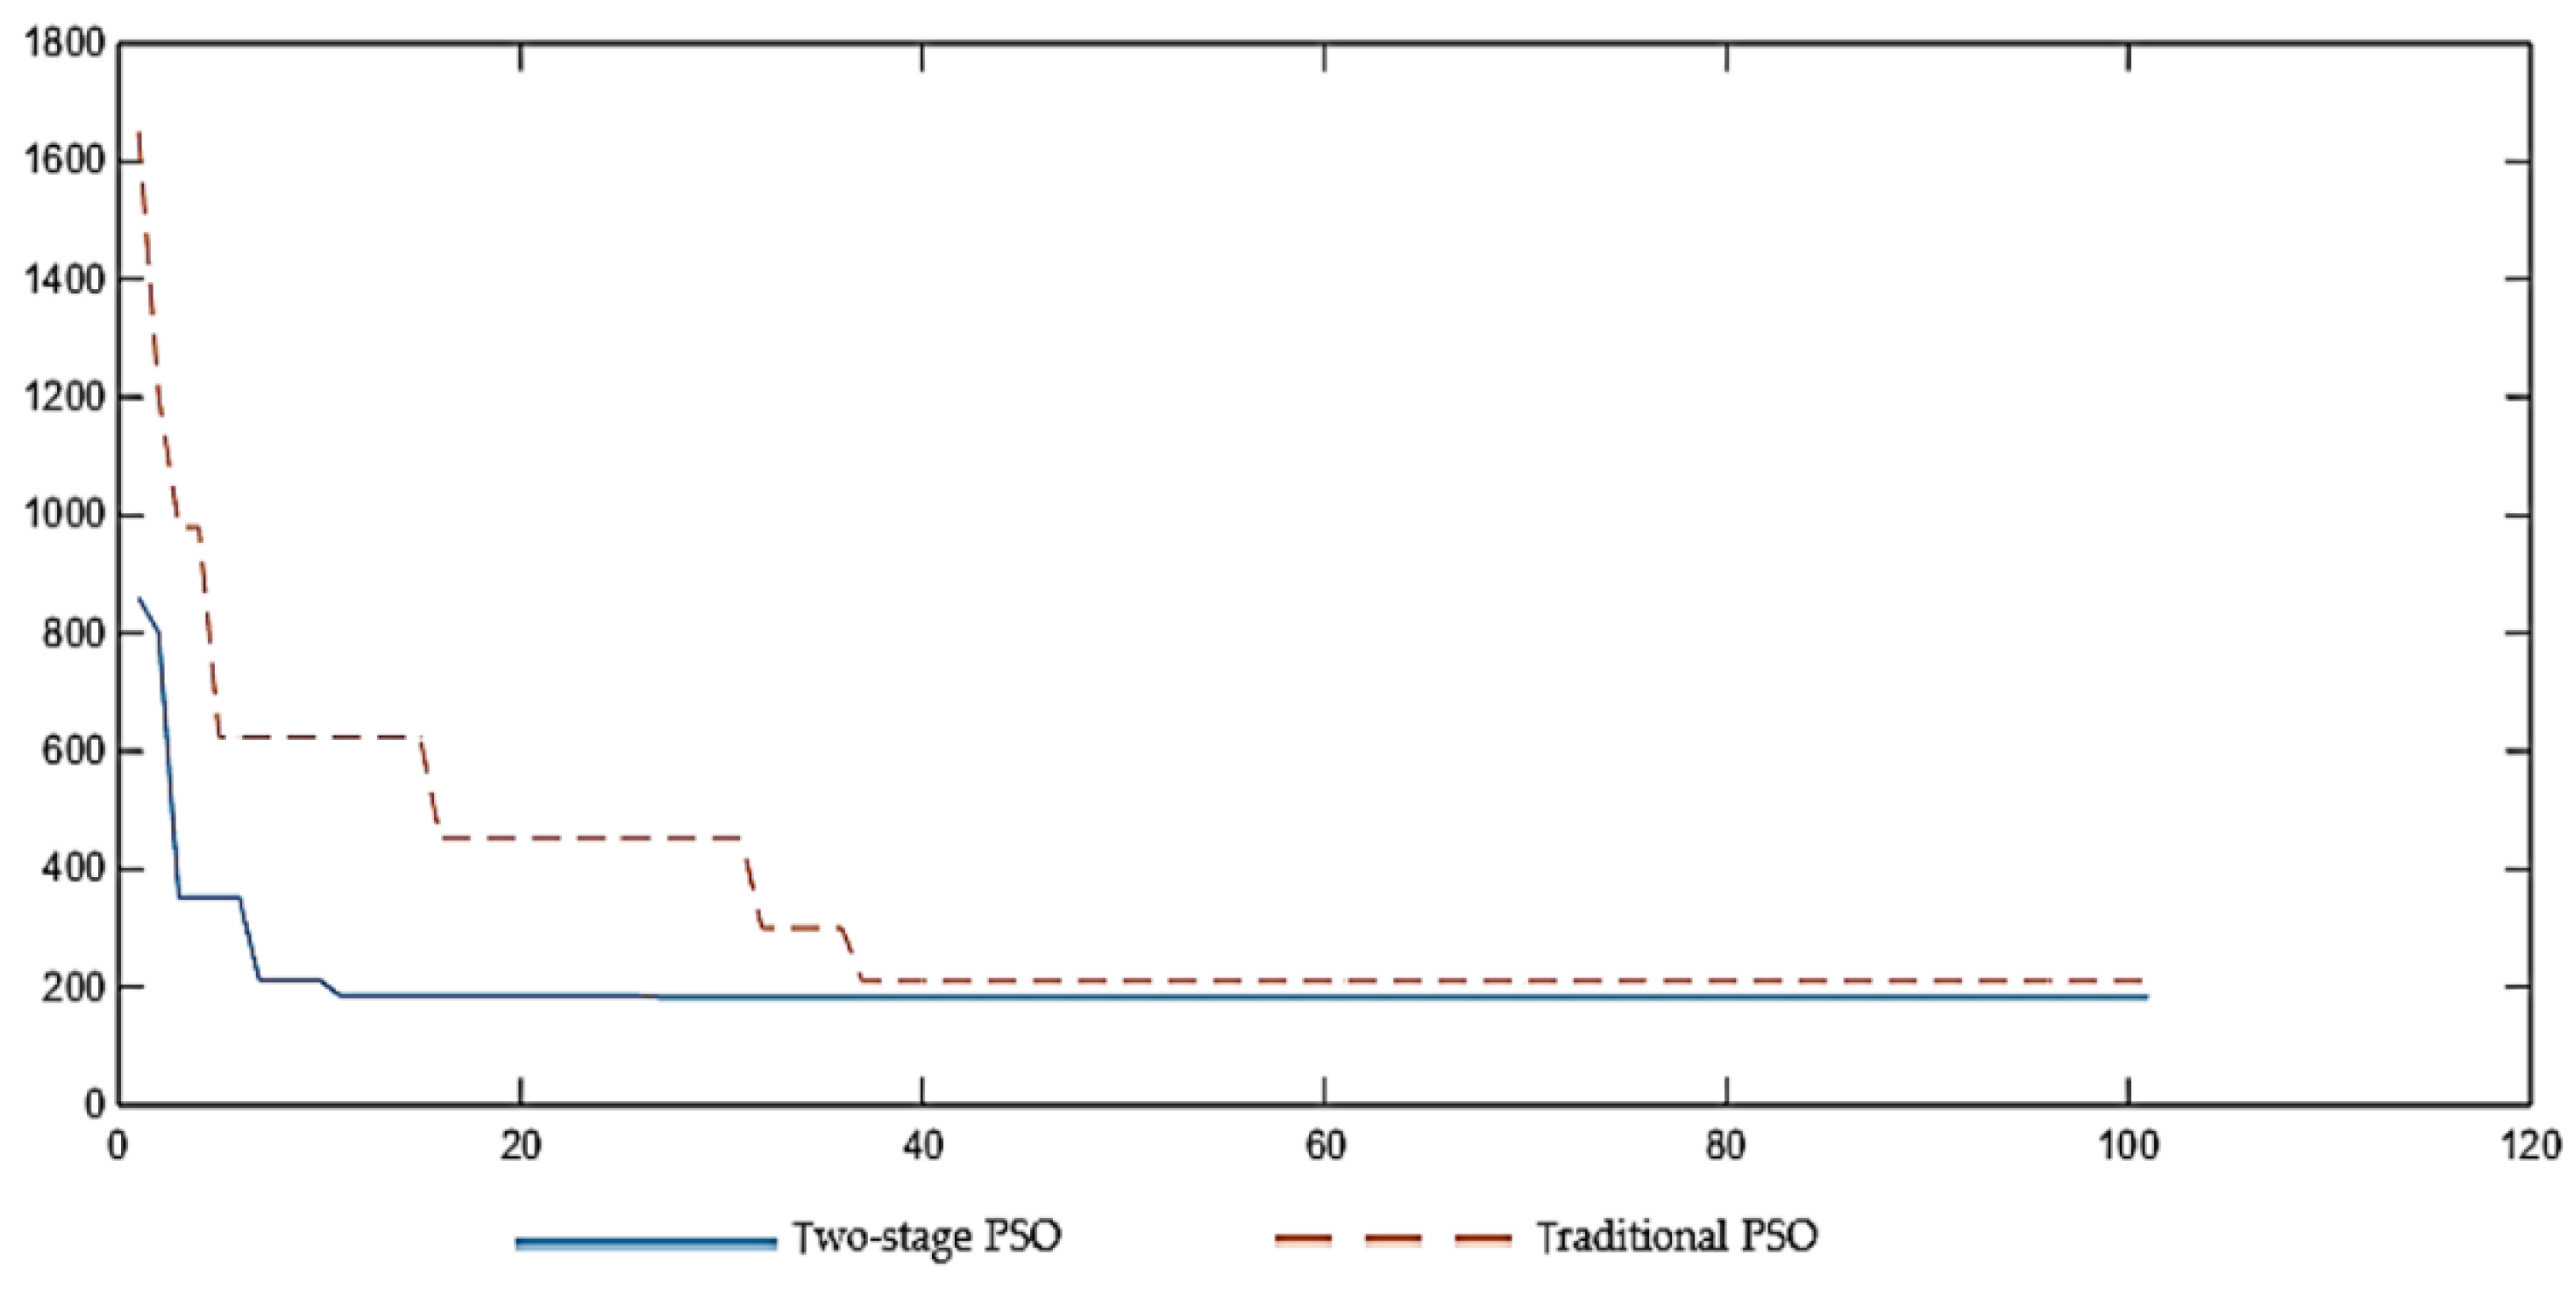
Figure 6.
The impact of ’s change on port cost under repositioning strategy.
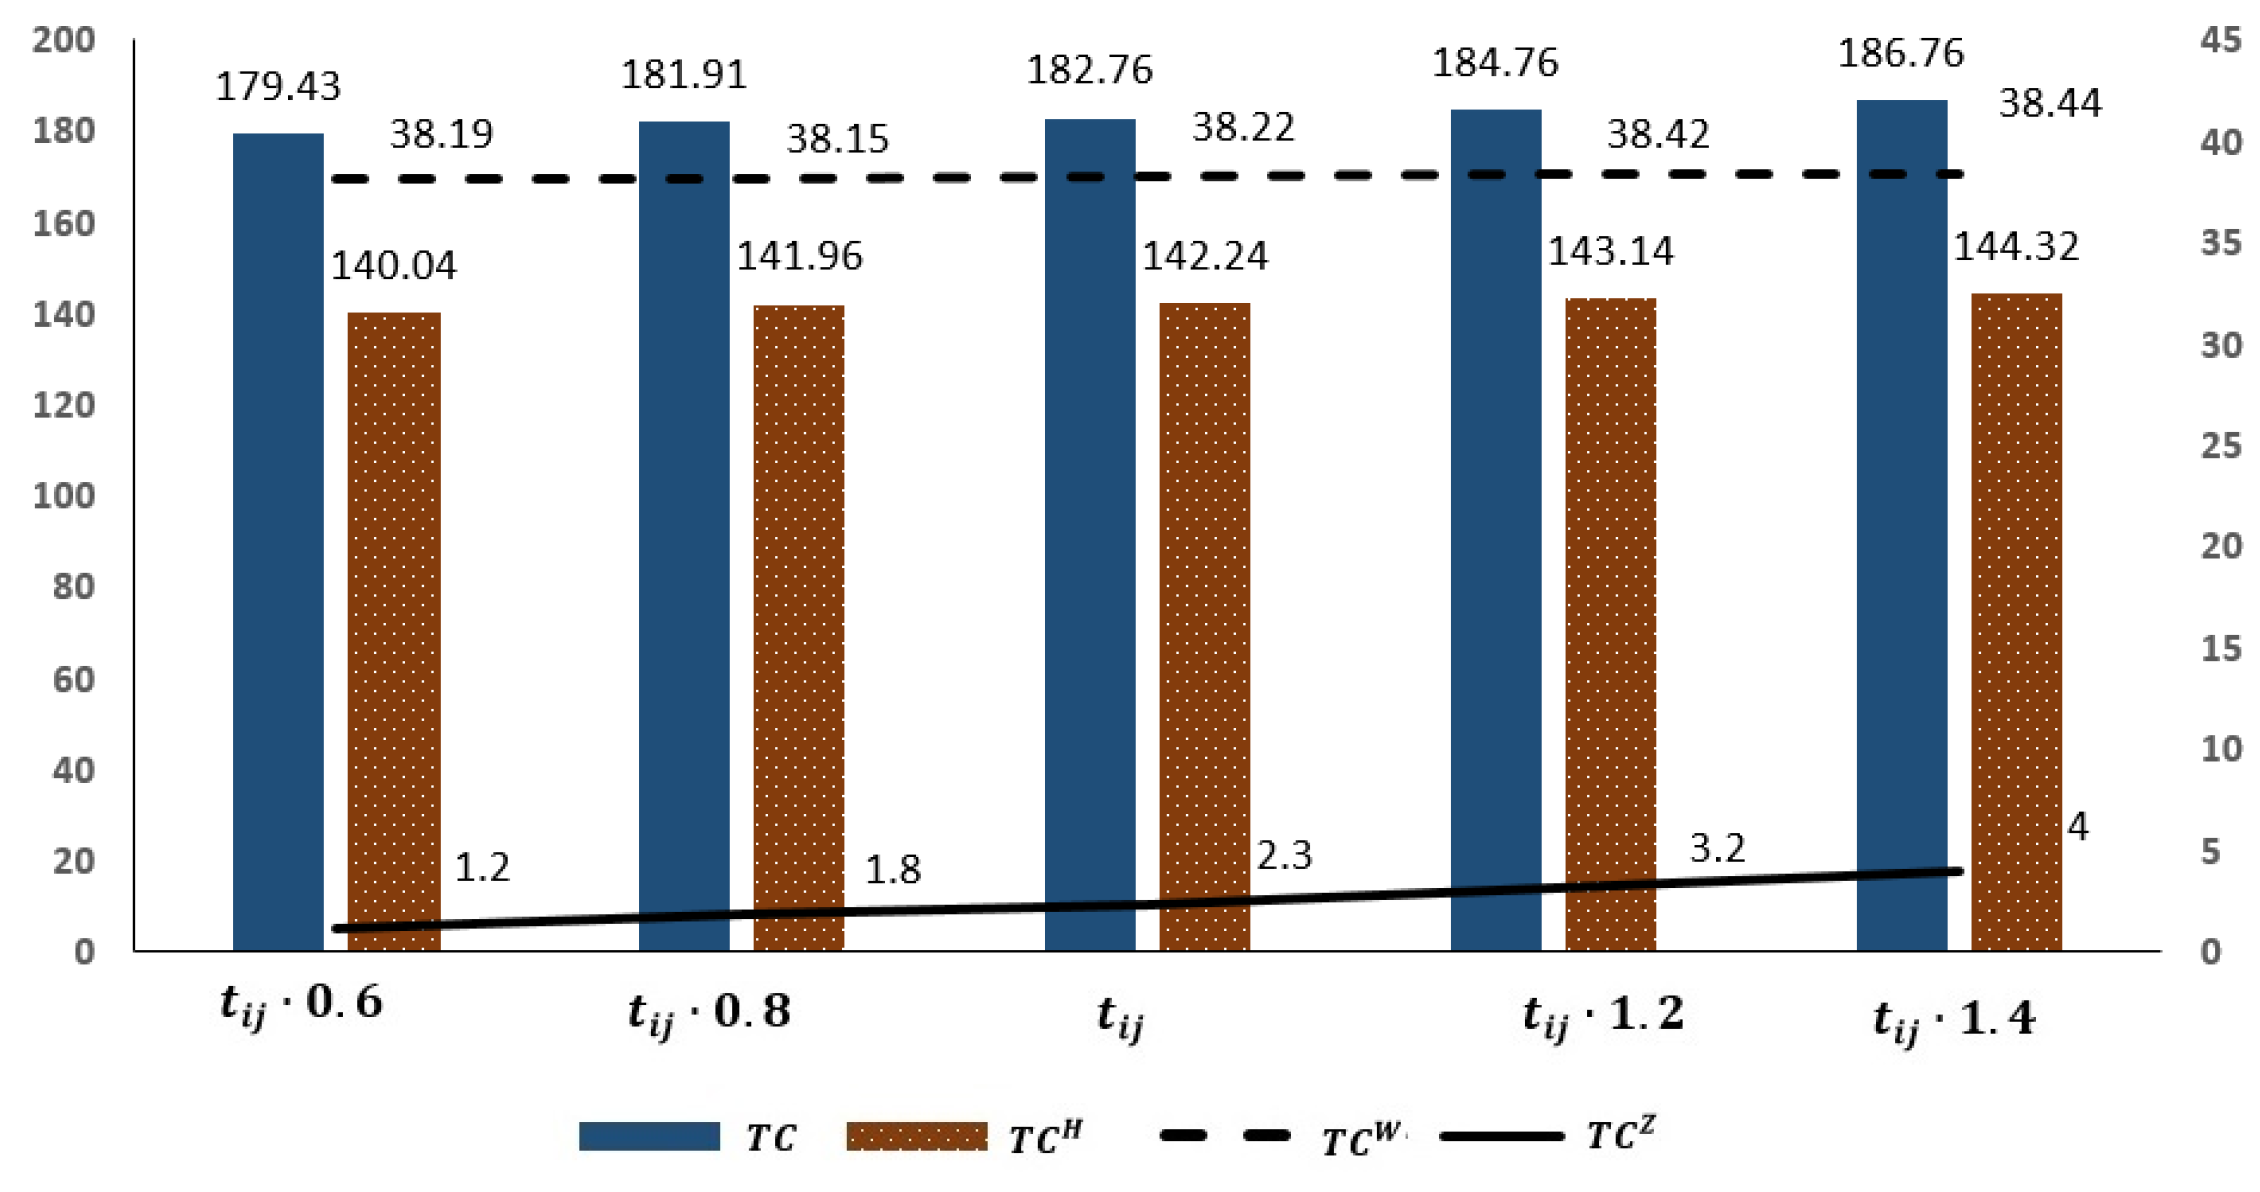
Figure 7.
The impact of ’s change on port cost under non-repositioning strategy.

Figure 8.
The impact of ’s change on port cost under repositioning strategy.

Figure 9.
The impact of ’s change on port cost under non-repositioning strategy.

Figure 10.
The impact of ’s change on port cost under repositioning strategy.
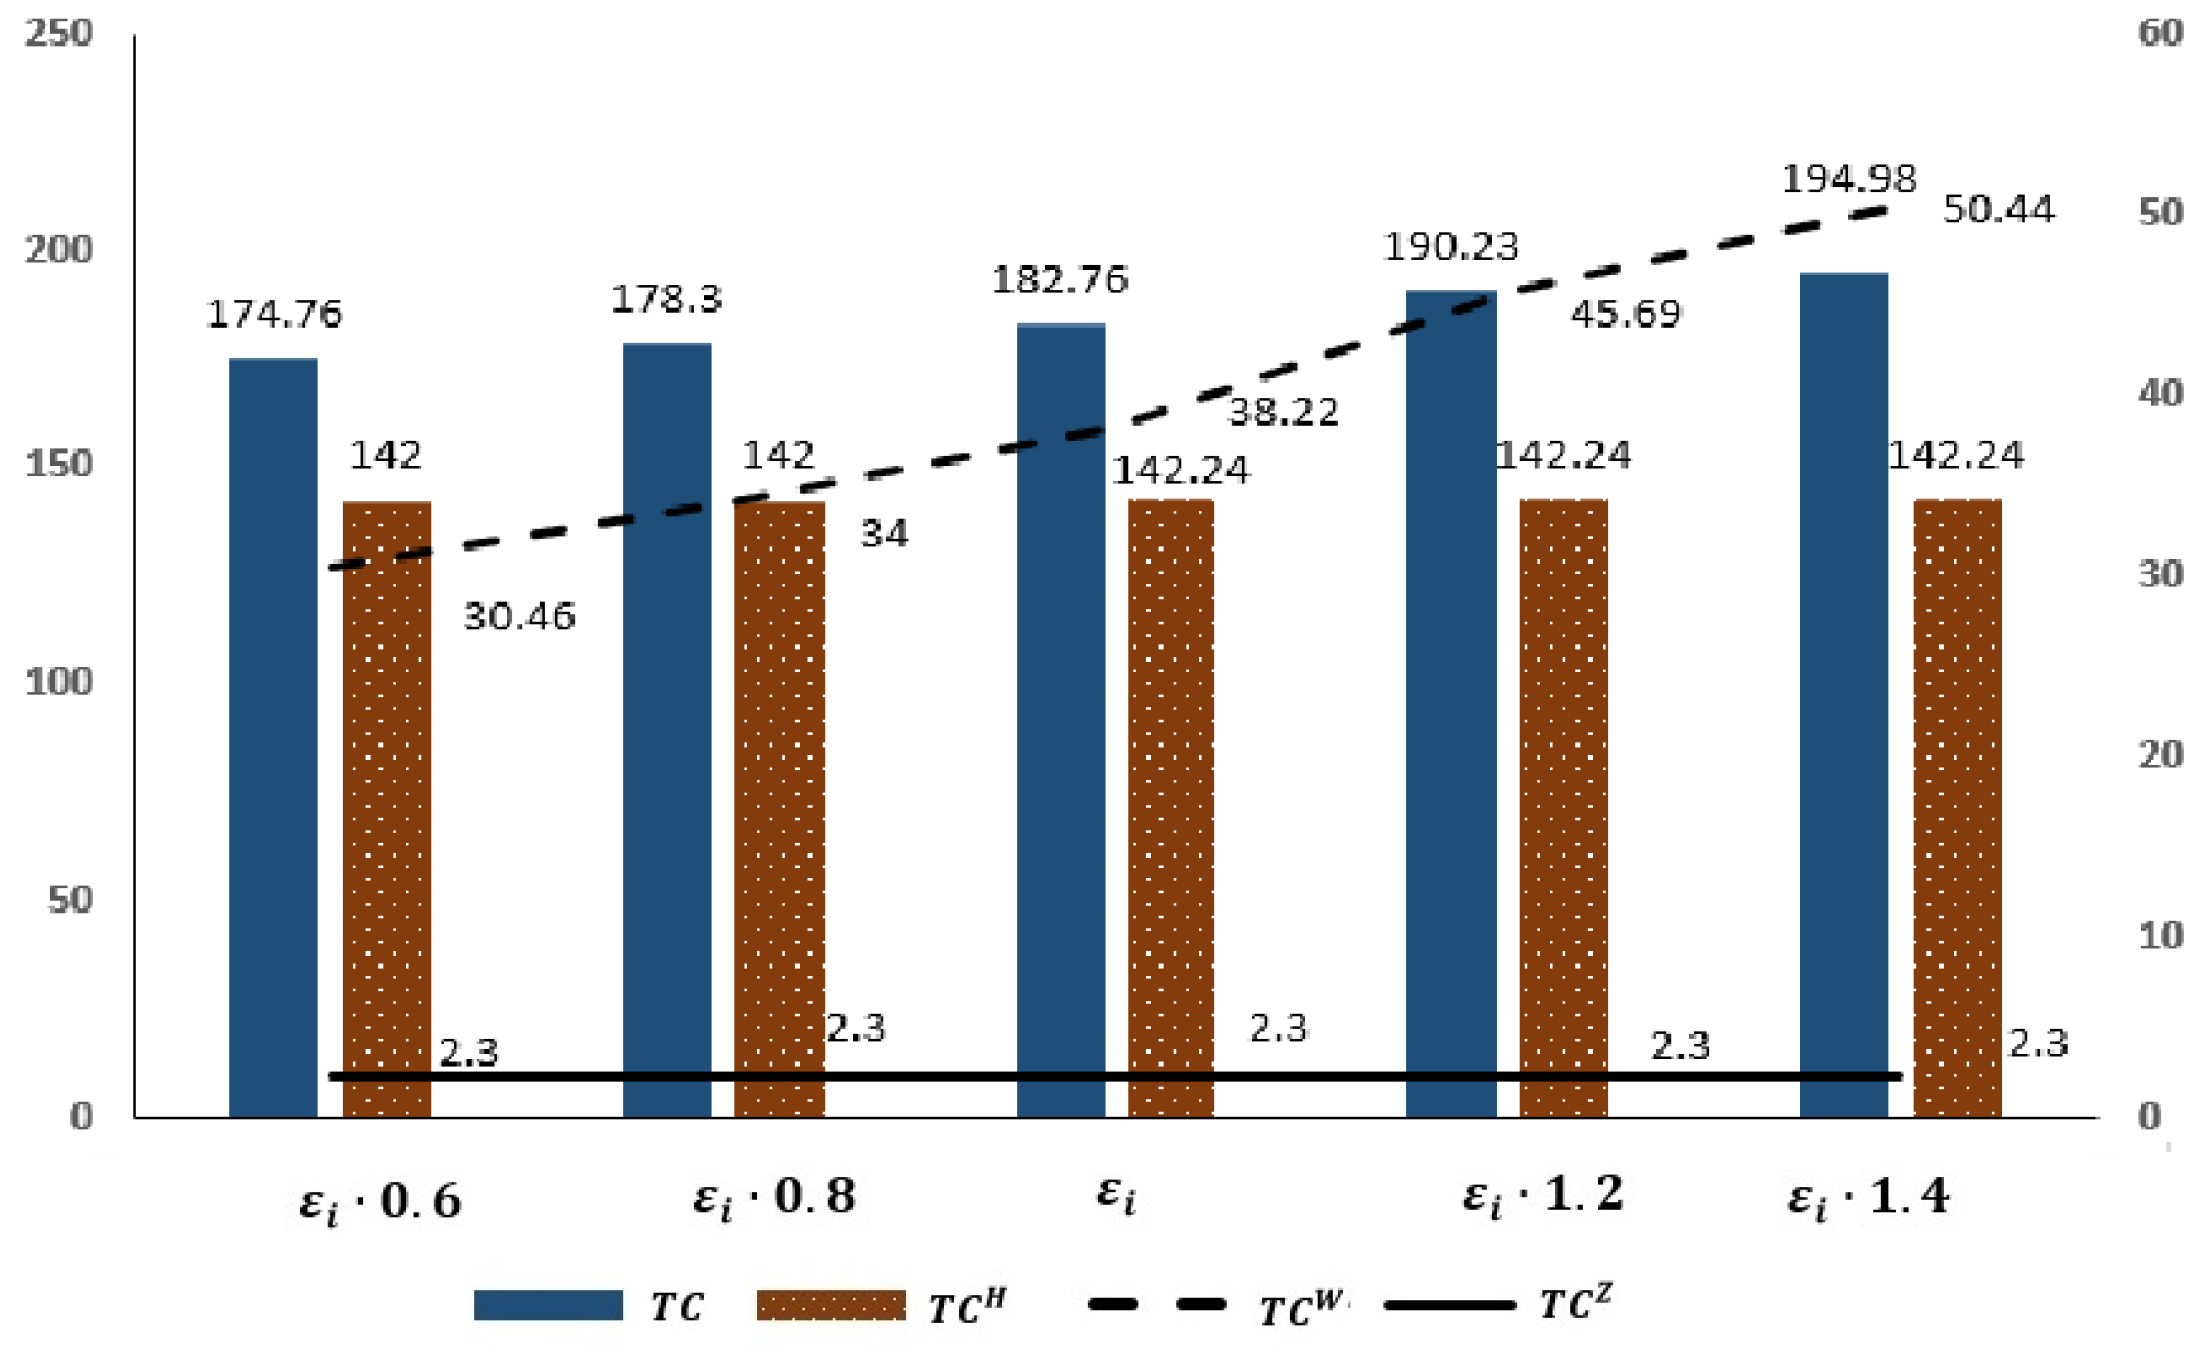
Figure 11.
The impact of ’s change on port cost under non-repositioning strategy.

Table 1.
Distance between three ports (n miles).
| Port | Port 1 (Taicang Port) | Port 2 (Nantong Port) | Port 3 (Zhangjiagang Port) |
|---|---|---|---|
| Port 1 (Taicang Port) | 0 | 24 | 53 |
| Port 2 (Nantong Port) | 24 | 0 | 19 |
| Port 3 (Zhangjiagang Port) | 53 | 19 | 0 |
Table 2.
Empty container transport time between ports (h).
| Port | Port 1 (Taicang Port) | Port 2 (Nantong Port) | Port 3 (Zhangjiagang Port) |
|---|---|---|---|
| Port 1 (Taicang Port) | 0 | 5.5 | 7.3 |
| Port 2 (Nantong Port) | 5.5 | 0 | 5.2 |
| Port 3 (Zhangjiagang Port) | 7.3 | 5.2 | 0 |
Table 3.
Other port data.
| Parameters | Port 1 | Port 2 | Port 3 |
|---|---|---|---|
| (USD/K) | 83.3 | 83.3 | 83.3 |
| (USD/K) | 2380 | 2380 | 2380 |
| (h) | 96 | 96 | 96 |
| 293 | 84 | 36 | |
| 4.5 | 4.5 | 4.5 |
Table 4.
Comparison of port empty container repositioning cost under two strategies.
| Repositioning Strategy | Non-Repositioning Strategy | |
|---|---|---|
| (K) | 182.76 | 260.56 |
| (K) | 142.24 | 246.78 |
| (K) | 2.30 | - |
| (K) | 38.22 | 13.78 |
| (K) | 642,242 | 844,666 |
Publisher’s Note: MDPI stays neutral with regard to jurisdictional claims in published maps and institutional affiliations. |
© 2022 by the authors. Licensee MDPI, Basel, Switzerland. This article is an open access article distributed under the terms and conditions of the Creative Commons Attribution (CC BY) license (https://creativecommons.org/licenses/by/4.0/).
Share and Cite
MDPI and ACS Style
Song, J.; Tang, X.; Wang, C.; Xu, C.; Wei, J. Optimization of Multi-Port Empty Container Repositioning under Uncertain Environments. Sustainability 2022, 14, 13255. https://doi.org/10.3390/su142013255
AMA Style
Song J, Tang X, Wang C, Xu C, Wei J. Optimization of Multi-Port Empty Container Repositioning under Uncertain Environments. Sustainability. 2022; 14(20):13255. https://doi.org/10.3390/su142013255
Chicago/Turabian StyleSong, Jingyao, Xin Tang, Chuanxu Wang, Changyan Xu, and Junyi Wei. 2022. "Optimization of Multi-Port Empty Container Repositioning under Uncertain Environments" Sustainability 14, no. 20: 13255. https://doi.org/10.3390/su142013255
Note that from the first issue of 2016, this journal uses article numbers instead of page numbers. See further details here.